Article

Temporal and Spatial Variability of Ground Frost Indices in Northeast China

1
College of Ecology, Taiyuan University of Technology, Taiyuan 030024, China
2
State Key Laboratory of Vegetation and Environmental Change, Institute of Botany, Chinese Academy of Sciences, Beijing 100093, China
3
Geographical Science and Tourism College, Jilin Normal University, Siping 136000, China
4
Centre for Global Sustainability Studies, Universiti Sains Malaysia, Penang 11800, Malaysia
5
Northeast Institute of Geography and Agroecology, Chinese Academy of Sciences, Changchun 130102, China
*
Author to whom correspondence should be addressed.
Atmosphere 2024, 15(7), 817; https://doi.org/10.3390/atmos15070817
Submission received: 9 May 2024 / Revised: 30 June 2024 / Accepted: 5 July 2024 / Published: 8 July 2024
(This article belongs to the Special Issue Vegetation and Climate Relationships (3rd Edition))

Abstract

:
Frost is one of the most frequent, intense, and influential agrometeorological disasters that occurs frequently in Northeast China. The study of the spatiotemporal changes of ground frost is of great significance for farmers and policymakers in Northeast China, as it can inform decisions related to crop selection, planting schedules, and the development of regional climate adaptation plans. In this study, the spatiotemporal changes of frost indices (last spring frost (LSF), first fall frost (FFF), and frost-free period (FFP)) in Northeast China were analyzed from 1961 to 2020. Then, we investigated the mutation characteristics of the frost indices and their correlation with geographical factors. The results revealed that (1) the LSF, FFF, and FFP in Northeast China were concentrated at 120–140 DOY, 260–280 DOY, and 110–170 days, respectively. The spatial distribution of frost indices exhibited significant spatial heterogeneity. (2) The LSF, FFF, and FFP showed significant trends of advancement, delay, and extension, with trends of −1.94 days/10 a, 1.72 days/10 a, and 4.21 days/10 a, respectively. (3) More than 80% of the LSF, FFF, and FFP of the sites showed trends of advancement, delay, and extension, with greater variability in the central part of Heilongjiang Province. (4) The FFF and FFP experienced an abrupt change in the late 1990s. (5) The correlation between latitude and LSF, FFF, and FFP was the strongest, with correlation coefficients of 0.77, −0.79, and −0.78, respectively. This study provides a comprehensive understanding of the changing characteristics of ground frost indices that impact agricultural production in Northeast China against the backdrop of climate change. The findings hold significant scientific value in guiding the adaptation of agricultural production layouts in Northeast China to the evolving climatic conditions.

1. Introduction

Climate warming has been a standout aspect of climate change over the past century. The IPCC’s Sixth Assessment Report indicates that the global average surface temperature during the period from 2011 to 2020 was 1.09 °C warmer than the average from 1850 to 1900 [1]. Anticipated effects of global warming include significant impacts on human health, agricultural yields, economic activities, social conflicts, and the biophysical environment [2,3,4,5,6,7]. Under the background of global warming, the frequency of meteorological disasters is increasing [8]. As a significant agricultural nation, China’s agricultural output is periodically affected by such disasters [9,10,11,12,13]. Frost, in particular, is a type of agricultural meteorological feature that has garnered attention from experts across various sectors, including agriculture, meteorology, and forestry, in recent decades [14,15].
Frost is a critical weather phenomenon that poses a significant risk to agricultural productivity [16,17]. The occurrence of frost is determined by the dropping of temperatures below 0 °C at the soil surface, plant surface, and in the adjacent atmosphere [18]. This leads to potential damage to crops, which can vary based on factors such as the type of crop, its growth stage, and the agricultural environment [19]. To assess the risk of frost damage, meteorologists and agronomists widely use frost indices [20,21,22]. These indices mainly include the last spring frost (LSF), the first fall frost (FFF), and the frost-free period (FFP). The FFP is the duration between the LSF and the FFF when there is no risk of frost, and it directly affects the length of the growing season for crops [23]. Frost can cause damage to crops in various ways [24]. Spring frost can harm seedlings, young plants, and flowers, particularly if it happens after the growing season has begun. This damage can be irreversible and lead to a decrease in crop yield [25,26,27,28]. The susceptibility of crops to frost damage increases over time and can ultimately result in the death of the plant. Chloroplasts, in particular, are highly vulnerable to frost damage, with cellular dehydration and membrane instability being key processes that lead to this damage [29,30]. Autumn frost before harvest can damage growing shoots, reducing crop yields and causing substantial economic losses [31]. With global warming, the likelihood of crops being affected by frost damage during their growth cycles may rise [32,33,34]. Investigating the spatio-temporal changes in frost indices, which can be achieved through the use of satellite data and advanced weather forecasting techniques [35], is crucial for better understanding and mitigating the impacts of frost on agriculture. By monitoring frost occurrence and its impact on crops, farmers and policymakers can develop strategies to minimize the negative effects of frost on agricultural productivity.
Several studies have been undertaken to evaluate the variations in the frost index across different regions by using different data from different periods. For instance, Scheifinger et al. used daily minimum temperatures to investigate the change in the last frost occurrence date in Central Europe [36]. Rahimi et al. used the probability density functions and regression analysis methods to construct the probability distribution for each frost series and the correlation between the dates of frost occurrence and elevation in the Central Alborz Region of Iran [37]. Anandhi et al. integrated historical site data with future data from global climate model (GCM) simulations to predict future changes in frost indices in the Catskill Mountain region of New York [38]. Malinovic-Milicevic et al. studied the variations in frost indices in Serbia during the period of 1961–2010, as well as the impact of atmospheric circulation on temperature fluctuations [39]. In a separate study, changes in frost indices in Northern Iran were assessed using the Mann–Kendall and Theil–Sen estimator methods [40]. The onset and conclusion of the frost season, as well as the length of the frost-free interval, have been observed to exhibit temporal shifts in southern Bulgaria through the application of linear regression and F-statistical analysis [41]. Kozminski et al. investigated the spatial and temporal dynamics of frost indices in Poland by examining the 5-cm-above-ground minimum air temperature records (1971–2020) daily from a network of 52 meteorological stations [42]. Yeşilırmak conducted a comprehensive study on the climatology and consistent temporal trends of select agroclimatic indices, including the frost index, across western Anatolia in Turkey, covering the interval from 1966 to 2018 [14]. Overall, the trend suggests that the LSF is occurring earlier, the FFF is delaying, and the FFP is extending [42,43,44]. These changes can have significant implications for agricultural practices, biodiversity, and ecosystem dynamics. It is essential to continue researching and monitoring these indices to inform policy decisions and climate change adaptation strategies, and to ensure the resilience of agricultural systems worldwide.
The frost index is an important indicator used to assess the risk of frost damage to crops [45,46]. In recent years, with the warming trend of the global climate, the changes in the frost index have received increasing attention in China, as China is a major agricultural country. Several studies have analyzed the changes in the frost index in China. Liu et al. analyzed the changes in the frost index in eight climate zones in China and explored the correlation between the frost index and sea level pressure, daily temperature range, and daily minimum temperature [47]. They found that the extension of the frost-free period may be caused by advancement of the last spring frost or a delay of the first fall frost. Li et al. studied the changes in the frost-free period (FFP) in the five major climate zones in China based on ERA5-Land reanalysis data, the Mann–Kendall (MK) test, and Sen’s slope methods [48]. They found that climate change in different regions may lead to varying frost indices. Yue et al. reported the spatiotemporal heterogeneity of spring frost in Xinjiang for the period of 1971–2020 using data from 40 meteorological stations [49]. They found that the spring frost in Xinjiang shows significant spatial and temporal variability. Some studies have also shown that, compared to frost indices calculated based on daily minimum temperature, ground frost indices calculated based on daily minimum ground surface temperature are more suitable for northern China [50,51]. This is because the ground surface temperature is more sensitive to climate change than the air temperature, and the calculation of the frost index based on ground surface temperature can better reflect the risk of frost damage to crops in northern China. Overall, these studies provide valuable information on the changes in the frost index in China, which can be used to assess the risk of frost damage to crops and to develop strategies for adaptation to climate change.
Northeast China’s agricultural productivity is indeed vital for the country’s food security and economy, making it a key region for studying the impacts of climate on crop production [52]. Until recently, the spatiotemporal changes of the ground frost indices and their response to climate change have remained unclear. Because frost events can lead to significant yield losses and economic hardship for farmers, it is necessary to study the frost dynamics in the region. Consequently, the objectives of this study were to (1) explore the spatiotemporal variations in the frost indices (LSF, FFF, and FFP); (2) investigate the mutation of the frost indices (LSF, FFF, and FFP); and (3) analyze the correlation between geographic factors and frost indices (LSF, FFF, and FFP). To conduct these analyses, we used daily minimum ground surface temperature (GST) data collected from 79 stations in Northeast China from 1961 to 2020. These data were complemented by geographical factors for each station, including latitude, longitude, and altitude. The findings of this research can provide valuable insights for local agricultural planning and policy making. By understanding the spatiotemporal variation characteristics of frost in Northeast China, farmers and policymakers can adjust the agricultural production layout to more resilient areas, implement measures to mitigate frost damage, and develop strategies for frost conservation. This is particularly important in the context of a changing climate, which can lead to more extreme weather events and greater variability in temperature and precipitation patterns.

2. Materials and Methods

2.1. Study Area

The study area encompasses Northeast China, incorporating the provinces of Liaoning, Jilin, and Heilongjiang and covering a vast expanse of 790,000 km2 (Figure 1). Situated on the eastern flank of Eurasia, the region spans latitudes from 38°40′ to 53°36′ north and longitudes from 118°48′ to 135°7′ east. It experiences a temperate and monsoon continental climate, marked by extended, dry winters and brief, humid summers. The annual temperature exhibits a progressive decrease from south to north, while precipitation displays a corresponding increase from west to east [53]. Geographically, the region is ringed by the Da Hinggan Mountains to the west, the Xiao Hinggan Mountains to the north, and the Changbai Mountains to the east, while the Sanjiang Plain, Songnen Plain, and Liaohe Plain occupy the central area. Northeast China stands as a pivotal grain-producing zone within China, overflowing with corn production and acclaimed as one of the world’s three major “golden maize belts” [54]. However, its distinctive geographical position makes it vulnerable to climatic disasters, which significantly impact crop yields in this area [55].

2.2. Data

In this study, we gathered sixty years’ worth of daily minimum ground surface temperature (GST) data from a network of 79 meteorological stations scattered across Northeast China. The dataset covers the period from 1961 to 2020 and was sourced from the Daily Value Dataset of Chinese Terrestrial Climate Information (V3.0), which is accessible through the China Meteorological Data Sharing Service System of China Meteorological Administration (CMA) (http://data.cma.cn/en, accessed on 1 January 2022). The CMA has conducted comprehensive quality control on meteorological data, including checks for threshold values, extremes, consistency, and manual verification to ensure accuracy and consistency. These data have been widely applied in climate research in China, providing reliable support for scientific research and policy making. To maintain data integrity, stations with missing values exceeding 2% were excluded to preserve the overall consistency and completeness of the dataset. Following data organization, the overall missing rate was determined to be 0.17%. Subsequently, the study employed two methods to address the issue of missing data: (1) if the absence of data spanned more than 5 consecutive days, the missing values were filled in using the multiyear average for that specific period; and (2) if the gap in data spanned fewer than 5 consecutive days, the missing values were filled in with the average value derived from the adjacent days’ data. Ultimately, the analysis was conducted using data from 79 weather stations confined to Northeast China. The spatial distribution of these stations is presented in Figure 1.

2.3. Methods

2.3.1. Definition of Frost Indices

In this research, three key indicators were chosen to delineate ground frost characteristics within the study area: the last spring frost (LSF), the first fall frost (FFF), and the frost-free period (FFP) [39,40,41]. These indicators were used to quantify the occurrence and duration of frost events, which are pivotal factors influencing agricultural activities and ecosystem dynamics. The choice to utilize daily minimum ground surface temperature (GST) as an indicator for frost characteristics, as opposed to daily minimum air temperature was based on the understanding that GST is more reflective of the conditions at the Earth’s surface, where plants and soil are directly affected by the cold [48]. This is particularly relevant in regions with significant temperature variations between day and night, such as Northeast China. There is no uniform definition of the LSF or FFF. In this study, the LSF is determined as the date with the minimum GST below 0 °C for the final time during the first half of the year. It is crucial for planning agricultural activities, particularly for crops that are sensitive to late spring frosts. The FFF is defined as the first instance when the minimum GST falls below 0 °C in the second half of the year. This indicator is important for assessing the potential damage to crops during the late growth stage and for planning frost protection measures. The FFP is calculated as the time interval between the LSF and FFF. This interval signifies the uninterrupted stretch of the year when frost is not recorded in a given region, a period of paramount importance for the growth and development of frost-intolerant crops and the sustenance of various ecosystem processes. To analyze these frost indicators systematically, we employed the Julian Day system, which assigns a unique day number to each day of the year. By using the Julian Day system, this study can accurately track and compare frost events across different years and locations within Northeast China. This approach allows for a standardized comparison of frost patterns over time and space, facilitating a comprehensive understanding of the spatiotemporal variation in frost characteristics in the region.

2.3.2. Trends Analysis

In this study, we employed multiple statistical methods (linear regression method, Mann–Kendall test, and Theil–Sen slope) to analyze the trends of frost indices over Northeast China. These methods are considered robust and are widely recognized in the field of climatology for detecting trends in time series data [56,57,58]. We applied the linear regression method to analyze the annual frost indices for the entire Northeast China region as well as for three individual provinces: Heilongjiang Province, Jilin Province, and Liaoning Province. Then, the Mann–Kendall test and the Theil–Sen slope methods were used to explore the statistical significance and trend of frost indices at each site. Statistically, the significance levels of trend detection for frost indices were set as 0.05 and 0.01 for all the methods. By setting these levels, the researchers were able to assess the robustness of the detected trends and determine whether the observed changes in frost indices were likely to be reliable and indicative of broader climate change patterns in Northeast China.

2.3.3. Mutation Analysis

We used Mann–Kendall (M-K) to test the abrupt changes in the time series of the frost indices. The Mann–Kendall (M-K) test is indeed a powerful non-parametric statistical test for detecting trends in time series data, including abrupt changes or shifts in the data [58]. It does not assume a specific distribution for the data, making it suitable for a wide range of applications, including climate and environmental studies.

2.3.4. Correlation Analysis

The Pearson correlation coefficient is a measure of the linear relationship between two quantitative variables [59]. It is used to assess the strength and direction of the linear association between frost indices and geographic factors such as latitude, longitude, and altitude. A correlation coefficient value greater than 0 indicates a positive relationship between the variables. A correlation coefficient value of 0 suggests no significant relationship between the variables. A correlation coefficient value less than 0 indicates a negative relationship between the variables. The absolute value of the correlation coefficient indicates the strength of the relationship. A value closer to 1 (or −1) indicates a stronger relationship, while a value closer to 0 indicates a weaker relationship.

3. Results

3.1. Spatial Distribution of the Frost Indices

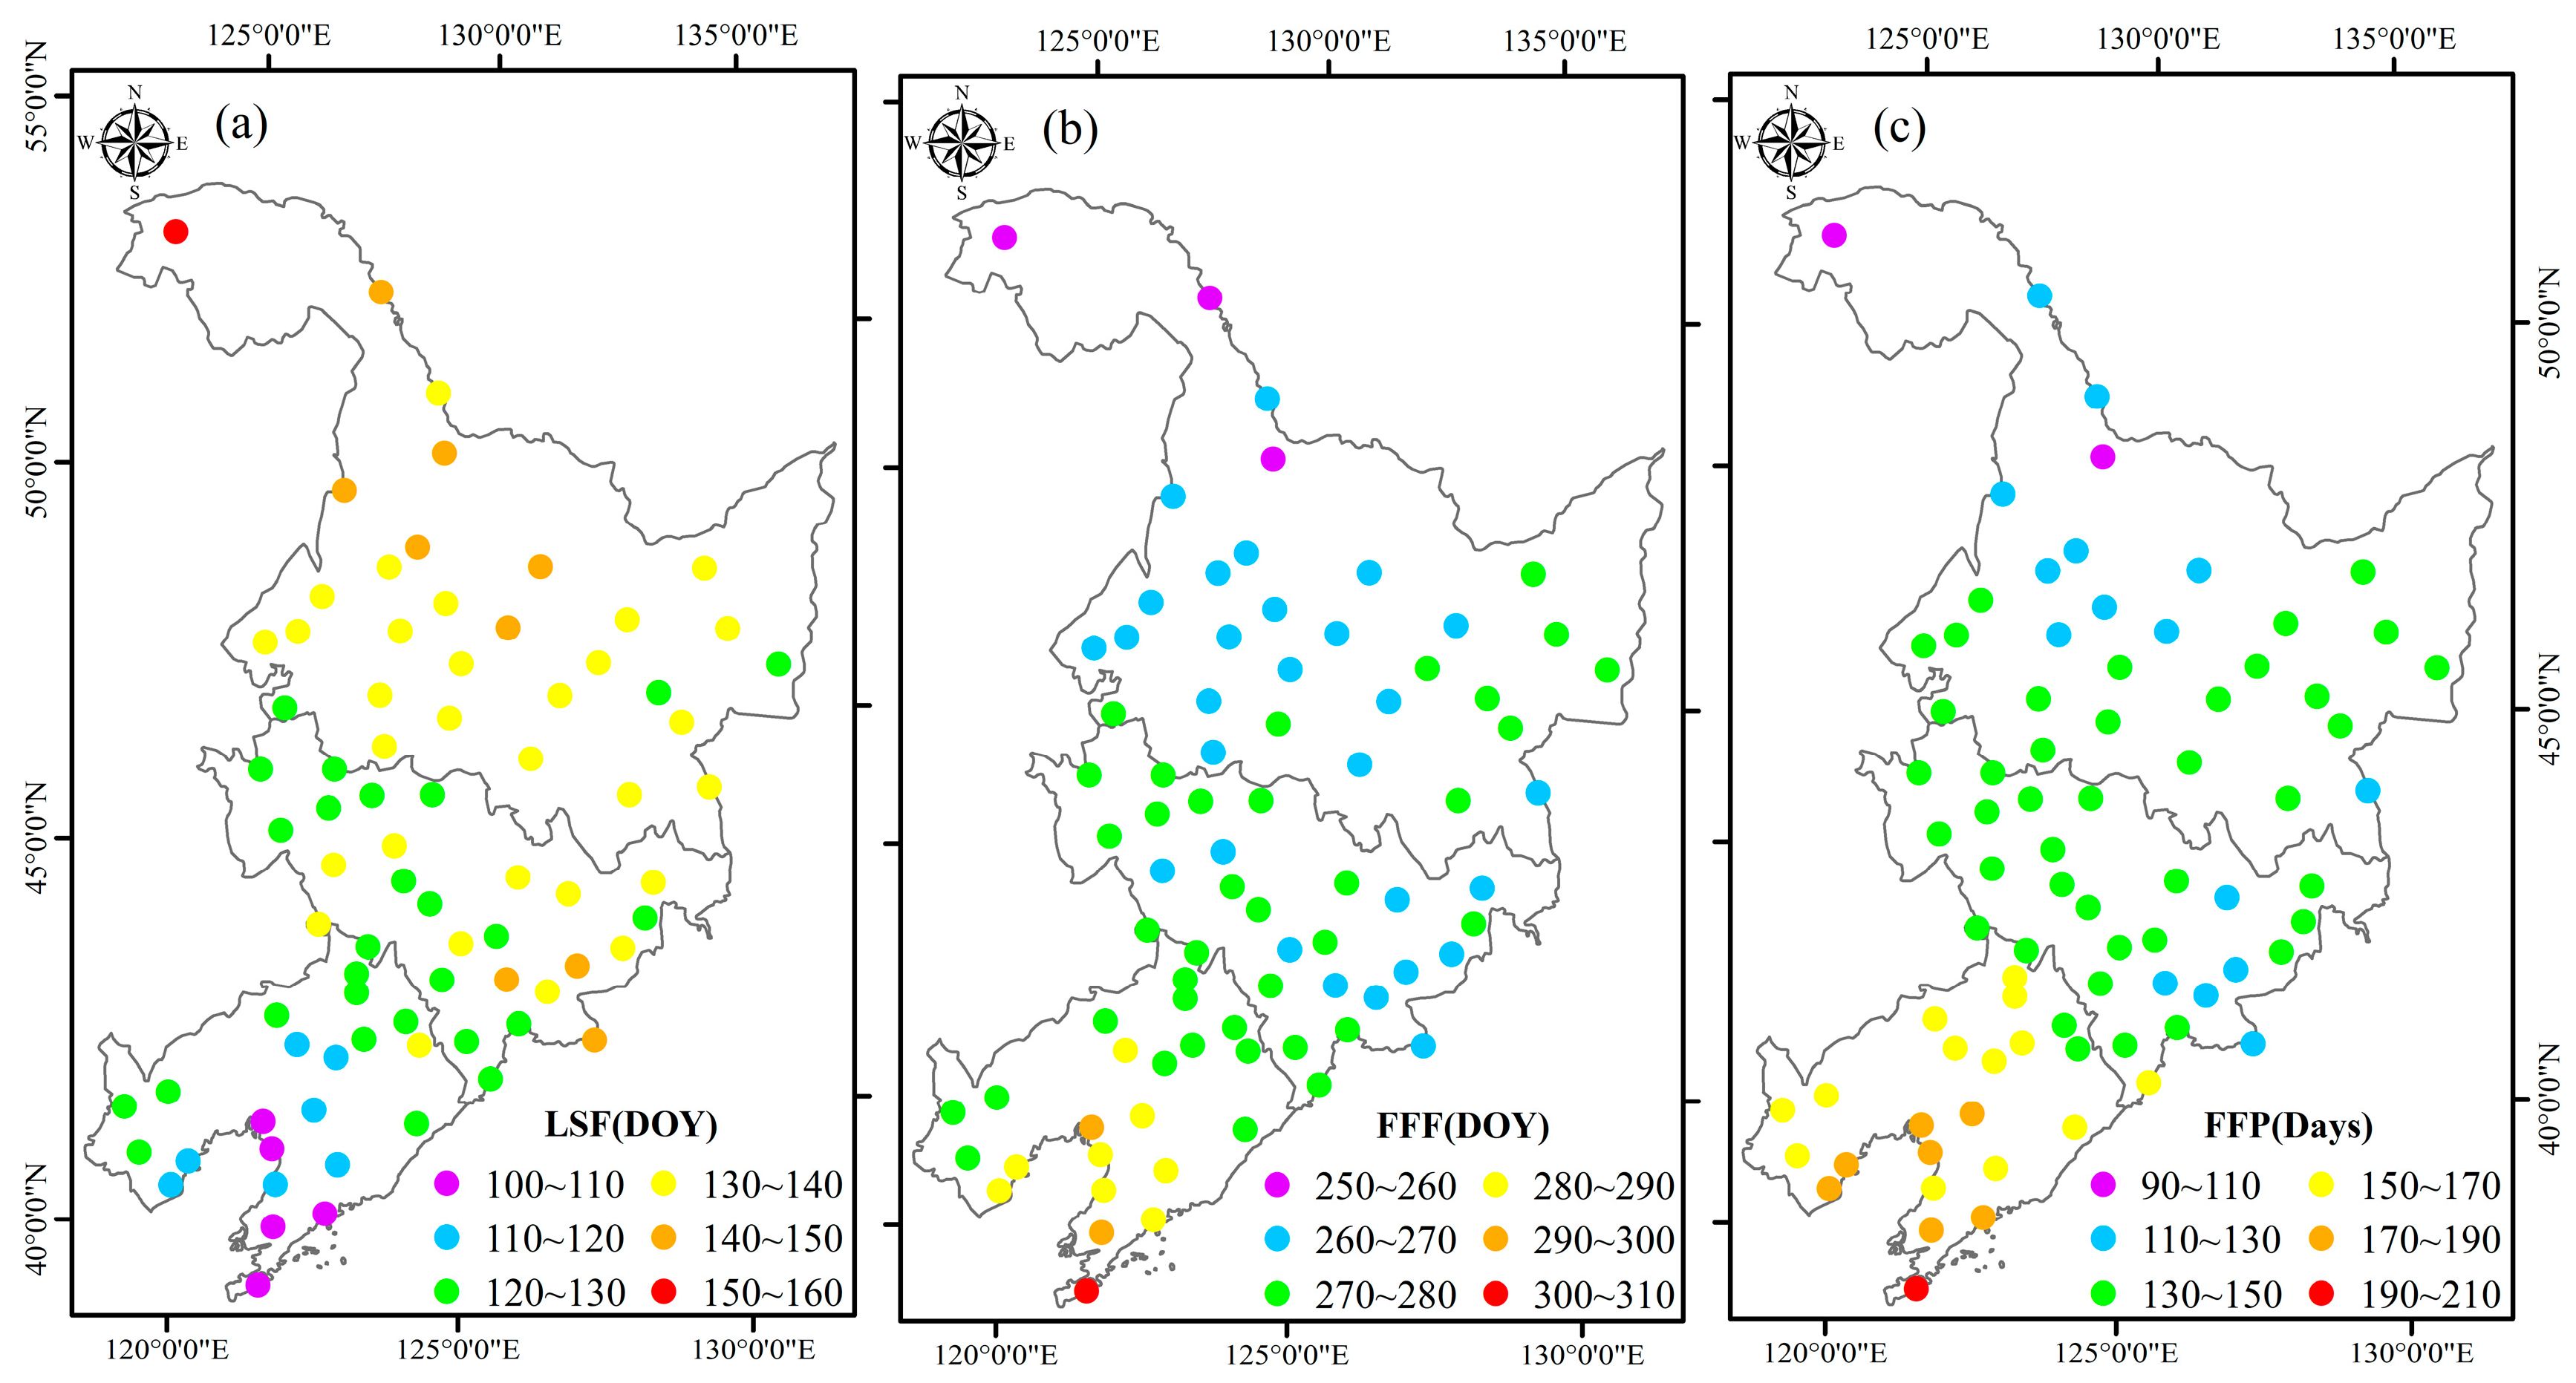
The spatial distribution of the frost indices in Northeast China during 1961–2020 is shown in Figure 2. The LSF was between the 100th and 160th days from 1 January, exhibiting a spatial distribution pattern that gradually delayed from south to north, while the FFF was between 250th and 310th days from 1 January and gradually delayed from north to south (Figure 2). The LSF in the southern coastal areas occurred before 20 April, which was earlier than that for the other areas. The LSF in Songnen Plain, Liaohe Plain, and the eastern region was from late April to late May (110th to 140th days), whilst that in Mohe, Nenjiang, and other stations of the northern area was postponed until after June (Figure 2a).
The FFF in the northern area was in the first half of September, whilst that in most of the central area was from late September to early October (260th to 280th days). The FFF in the southern coastal areas occurred after mid-October, and in some places even occurred after November (Figure 2b).
The Mohe station, located at the northernmost end of Heilongjiang Province, was the region with the shortest FFP (96 days), the latest LSF, and the earliest FFF in Northeast China. The average FFP in Northeast China decreased gradually from the south (210 days) to the north (90 days), i.e., from the locations with later LSF and earlier FFF to the locations with earlier LSF and later FFF (Figure 2c). In addition, the FFP of the Xiao Hinggan Mountains and Changbai Mountains was less than 130 days due to the influence of topographic factors. Owing to being affected by the LSF and FFF, the FFP combined the LSF and FFF spatial distribution regularities, showing the characteristics of the combination of horizontal and vertical zonality.

3.2. Interannual Trend of the Frost Indices

The temporal change in the frost indices in Northeast China during the period of 1961–2020 is illustrated in Figure 3. The average LSF and FFF in Northeast China were approximately 128 DOY (May 8 and 7 for nonleap and leap years, respectively) and 273 DOY (September 30 and 29 on nonleap and leap years, respectively), respectively. Thus, the average FFP was approximately 144 days over the study area. The LSF significantly advanced (−1.94 days/10 a, R2 = 0.62, p < 0.01) and the FFF was significantly delayed (1.72 days/10 a, R2 = 0.34, p < 0.01) from 1961 to 2020 in Northeast China, which led to a significant increasing trend (4.21 days/10 a, R2 = 0.62, p < 0.01) in the FFP. This indicates an advancement in the LSF and a delay in the FFF, leading to an extension of the FFP in Northeast China in the past few decades. Moreover, the extension of the FFP was mainly caused by the advance of the LSF.
Regional mean values for LSF (FFF) were 136 DOY (267 DOY), 131 DOY (271 DOY), and 117 DOY (282 DOY) for Heilongjiang, Jilin, and Liaoning, respectively. The corresponding values for FFP were 130 days, 139 days, and 164 days (Figure 4). The LSFs for Heilongjiang, Jilin, and Liaoning were all significantly advanced, and the advancing rates were 2.80, 2.65, and 1.90 days/10 a, respectively. The FFFs for Heilongjiang, Jilin, and Liaoning provinces were also significantly delayed, and the delaying rates were 1.65, 1.77, and 1.75 days/10 a, respectively. The FFPs for Heilongjiang, Jilin, and Liaoning provinces were also significantly extended, and the extending rates were 4.45, 4.42, and 3.64 days/10 a, respectively. The three frost indices for Heilongjiang, Jilin, and Liaoning displayed significance, with p < 0.01, during the same period.

3.3. Spatial Distribution of the Variation Trend in Frost Indices

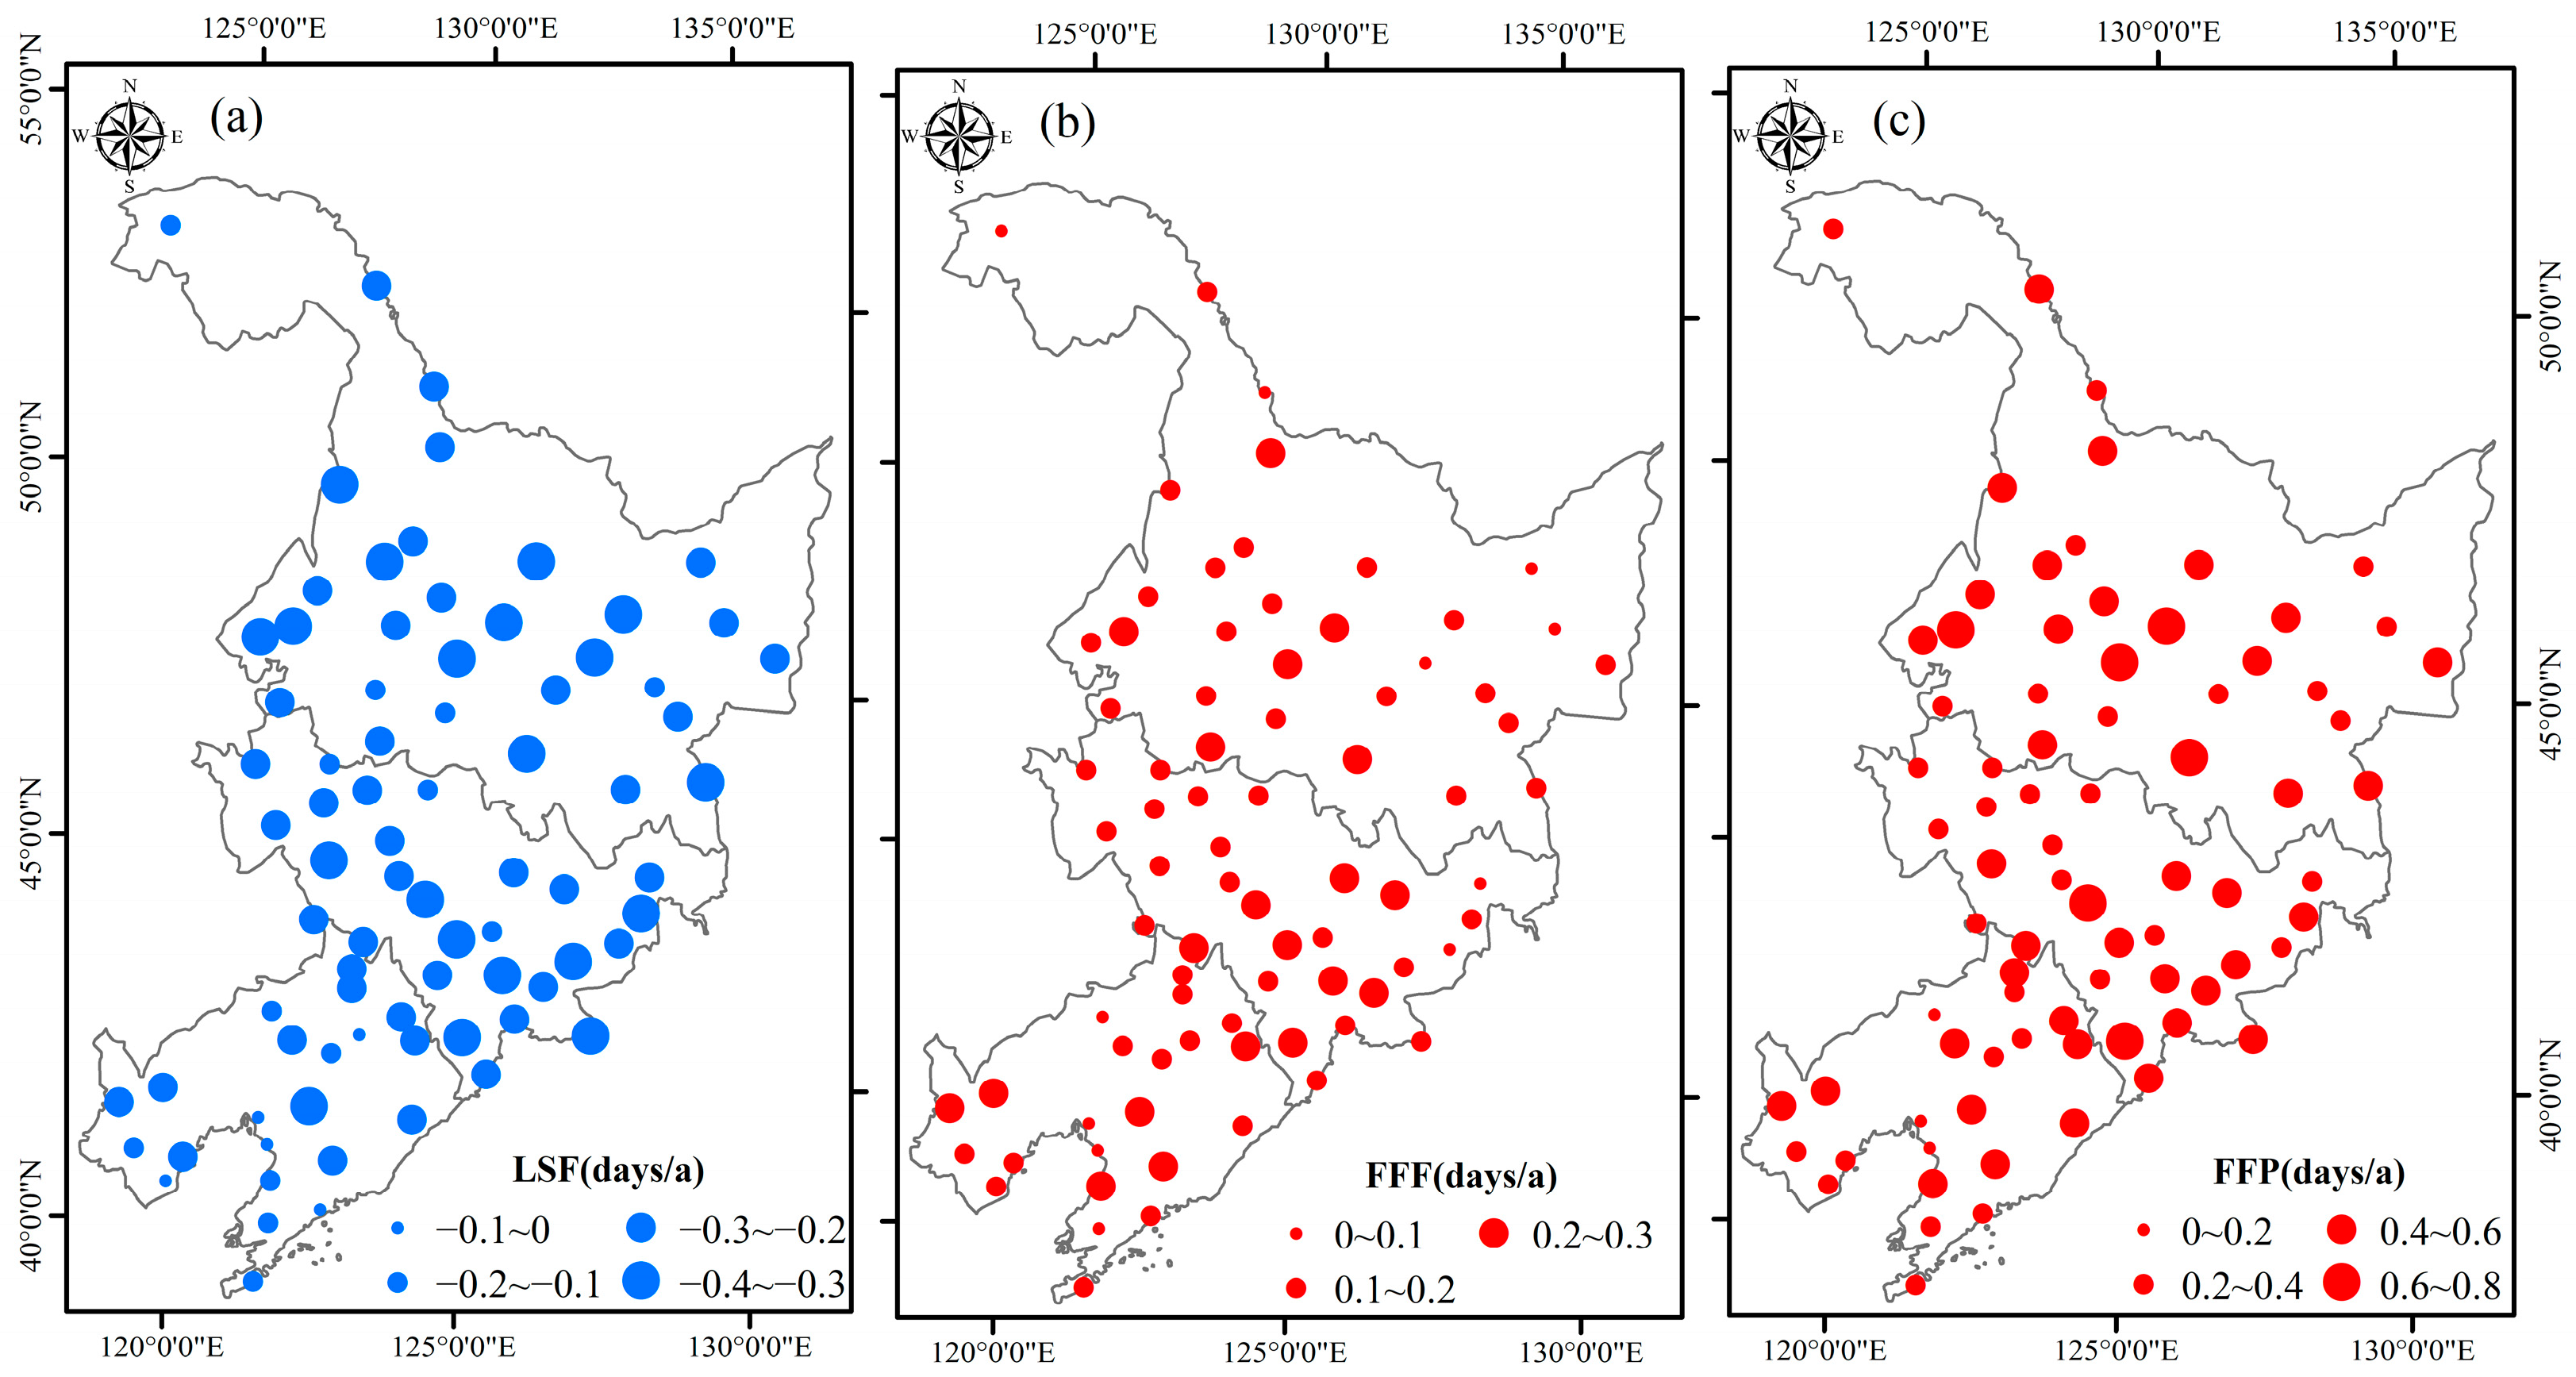
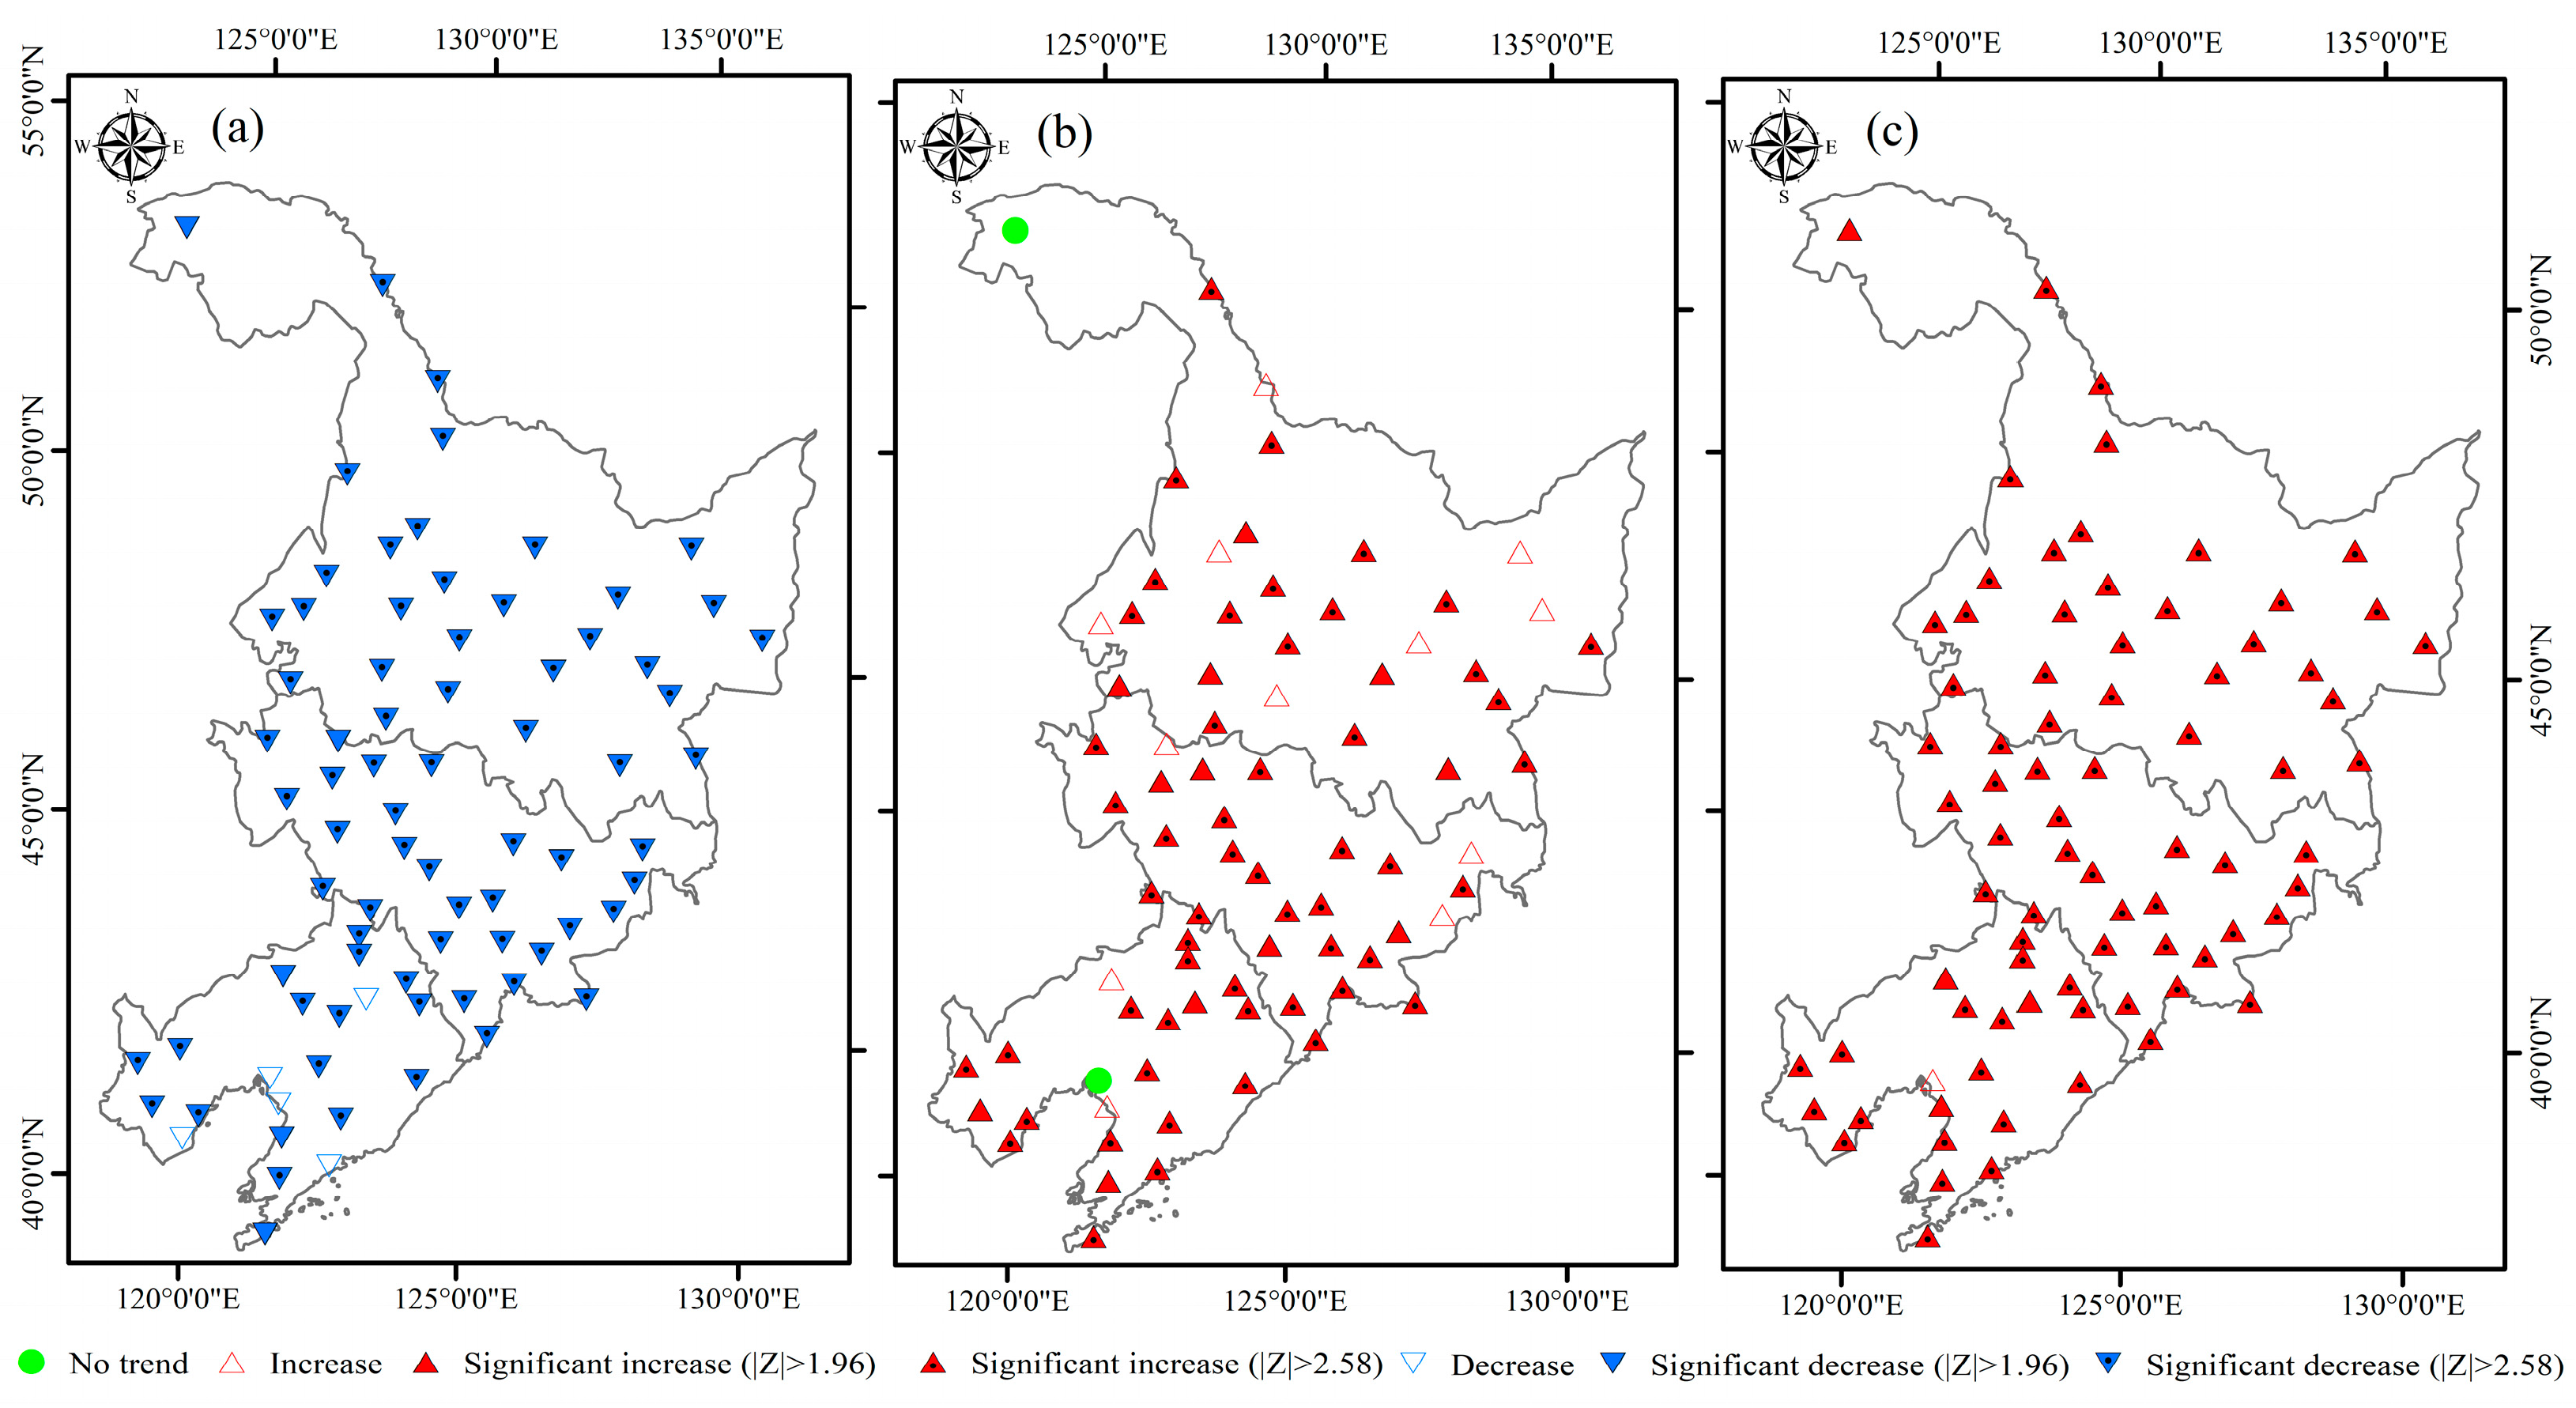
The spatial distributions of changing rates and MK in the LSF, FFF, and FFP are shown in Figure 5 and Figure 6, respectively. The LSFs of all stations in Northeast China had advancing trends (with the maximum advancing degree of 3.9–4.1 days/10 a). The LSFs for 87% (69 stations) of stations were very significantly advanced (|Z| > 2.58) in most regions. Only five stations exhibited insignificant advancement at the LSF, and these stations were mainly concentrated in the southern part of the Liaoning Province (Z > −1.96) (Figure 6a). The FFFs in the Mohe and Dalian stations experienced no change trends, while the remaining 78 sites showed trends of delay. The FFFs for 82% (65 stations) of stations which was widely distributed in the research area, were very significantly delayed (|Z| > 2.58) and experienced a delaying trend at a rate range of 1.3–2.9 days/10 a (Figure 5b). The FFPs in 94% of the sites were very significantly extended (|Z| > 2.58), and only Dawa station exhibited an insignificant lengthened trend. The FFP in the central region of Heilongjiang Province was prolonged by 6.5 days/10 a, whilst that in the southern area of Liaoning Province was lengthened by 0.1–2.0 days/10 a. Above all, the lengthening of FFP was caused by LSF advancing and FFF delaying.
The statistics of the number of stations with trends in the frost index are shown in Table 1. LSF and FFP showed significant advancing and lengthening trends at all sites in Heilongjiang and Jilin, respectively. There was no change in FFF for one site in Heilongjiang and one site in Jilin. The FFF was significantly delayed at 73%, 89%, and 86% of sites in Heilongjiang, Jilin, and Liaoning, respectively.

3.4. Mutation Analysis of the Frost Indices

The abrupt changes in the annual mean frost indices in Northeast China during 1961–2020 are illustrated in Figure 7. In detail, the UF line of LSF fluctuated around 0 values between 1961 and 1981, showing an advanced trend starting in the 1980s and significantly advancing after 1996. The UF and UB of LSF intersected in 1998, but were outside the confidence interval, indicating that there was no mutation in LSF. The FFF showed an early trend before the 1990s, followed by a delayed trend after the 1990s, and reached a significant delay after 2006. Moreover, mutations of the FFF occurred between 1999 and 2001. FFP showed a declining trend in the 1960s and 1970s, but increased from the 1980s and significantly from 2000 onward. And the mutation time of FFP was in 1997. In summary, the frost indices experienced an abrupt change in the late 1990s.

3.5. The Relationship between the Frost Indices and Geographic Factors

The potential influence of geographic factors on the frost indices in Northeast China was explored via Pearson’s correlation analysis. From the results shown in Figure 8, Figure 9 and Figure 10, frost indices were significantly correlated with latitude, longitude, and elevation, and these correlations were significant at the 0.001 significance level. Latitude influences the distribution of energy across the Earth’s surface through the sun’s incidence angle, and as a result, the climate at different latitudes varies significantly. The LSF, FFF, and FFP showed significant positive, negative, and negative correlations with the latitude, with correlation coefficients of 0.77, −0.79, and −0.78, respectively (Figure 8). Since longitude affects the transfer of water and energy between coastal areas and China’s inland regions, regional climate change is also influenced by longitude. In the current study, the LSF, FFF, and FFP showed significant positive, negative, and negative correlations with the longitude, with correlation coefficients of 0.55, −0.48, and −0.52, respectively (Figure 9). In addition to latitude and longitude, elevation influences regional climate change through determining the vertical distribution of energy and water. The LSF, FFF, and FFP showed significant positive, negative, and negative correlations with the elevation, with correlation coefficients of 0.53, −0.49, and −0.52, respectively (Figure 10). As expected, stations with lower latitude/longitude/elevation had earlier LSFs, later FFFs, and longer FFPs. These results indicate that latitude, longitude, and altitude are all significant influencing factors for the frost indices in Northeast China. Moreover, all frost indices were well correlated with latitude rather than longitude or elevation.

4. Discussion

4.1. Annual Average and Spatial Distribution of the Frost Indices

Our study revealed that the LSF in Northeast China was on 9 May, later than in the Yellow River basin (30 April), Gansu-Xinjiang (19 April), and the Huang-Huai-Hai region (26 March), but earlier than in the Qinghai–Tibet region (27 May). Conversely, the FFF was on 29 September in Northeast China, preceding that in the Yellow River basin (8 October), Gansu-Xinjiang (9 October), and the Huang-Huai-Hai region (10 November), yet following the Qinghai–Tibet region (18 September) [51,60]. These patterns were mainly due to geographical positioning: Northeast China’s higher latitude resulted in colder temperatures, delaying the LSF and advancing the FFF compared to middle latitudes [61,62,63]. However, the Qinghai–Tibet region’s exceptional location, the “roof of the world” or the “third pole”, with even lower temperatures [64], led to a later LSF and earlier FFF than in Northeast China. Aside from the impact of natural conditions, variations in data collection methods can also introduce discrepancies in frost indices. For instance, temperature readings taken at 5 cm above the ground and at 2 m above the ground may produce different results, thereby affecting the calculated frost index. Our study also indicated a clear pattern of climatic variation in Northeast China, with the LSF, FFF, and FFP all showing gradients from south to north. This pattern aligns with the general decrease in temperature that occurs with increasing latitude [65,66]. A later LSF in the north indicates that the growing season starts later due to colder temperatures [67,68]. This could delay planting and the start of crop growth, potentially affecting yield and overall agricultural productivity [69,70]. An earlier FFF in the north suggests that the growing season ends sooner due to earlier cooling temperatures [71]. This could affect the duration of crop growth and the timing of harvest, requiring farmers to plan accordingly to maximize yields [72,73]. A shorter FFP in the north indicates a shorter window for crop growth and cultivation, which could pose challenges for farmers in terms of planning and managing their agricultural activities [74]. The differences in LSF, FFF, and FFP between the northernmost and southernmost regions of Northeast China are significant, with variations of 52, 49, and 101 days, respectively. These variations highlight the importance of understanding local climatic conditions for agricultural planning and management. Farmers and policymakers need to consider these climatic factors when determining crop types and planting dates, as well as to implement adaptive strategies to ensure sustainable agricultural practices and food security in the face of a changing climate.

4.2. The Dynamic Changes of the Frost Indices

The results of this study showed that the LSF, FFF, and FFP were significantly advanced, delayed, and extended at rates of −1.94, 1.72, and 4.21 days/10 a, respectively. These trends suggest that Northeast China has been experiencing a general warming trend, causing the LSF to occur earlier in the year, the FFF to occur later in the year, and the frost-free period to last longer. The data from various regions showed similar patterns of change, although the rates of change could vary [38,39,40,75,76]. For example, in Central Europe, Scheifinger et al. indicated that the LSF had advanced at a rate of −0.2 days/year from 1951 to 1997, as inferred from daily minimum temperature records [36]. In the United States Great Lakes region, Yu et al. found, based on daily minimum temperatures at a height of 2 m, that the LSF, FFF, and FFP were advancing, delaying, and extending at rates of −0.19, 0.24, and 0.43 days/year, respectively, between 1980 and 2010 [77]. In Turkey, Erlat and Türkeş used the daily minimum night-time air temperatures to observe a decreasing trend of −0.64 days/decade for the LSF and an increasing trend of 0.71 days/decade for the FFP between 1950 and 2013 [78]. In Japan, Masaki’s research, utilizing frost observation data and daily minimum temperature records, revealed that the LSF was advancing at a rate of −0.228 days/year and the FFF was delaying at a rate of 0.224 days/year between 1951 and 2010 [76]. Similarly, based on the daily minimum skin temperature, Li et al. found that the FFP in China had extended at a rate of 1.25 days/decade between 1950 and 2020 [48]. The inconsistencies between the findings of this study and the research outcomes might be accounted for by disparities in the duration of the studies, the regions analyzed, the height at which minimum temperature measurements were taken, and the datasets utilized. The abrupt change in the frost index in Northeast China in the late 1990s could be the result of several factors working together: the continued warming, the enhanced urban heat island effect due to accelerated urbanization, and changes in land use, such as deforestation and alterations in agricultural activities, which may have altered the surface energy balance and soil moisture conditions, thereby affecting frost formation. These trends have significant implications for agriculture, ecosystems, and human activities, as they can affect planting and harvesting schedules, insect populations, wildlife, and even human health [79]. Countries around the world need to monitor these changes and adapt strategies to mitigate the negative impacts of climate change and take advantage of any new opportunities that may arise.

4.3. The Impact of Climate Change on the Frost Indices

The study revealed a substantial correlation between ground frost occurrence and geographical variables such as latitude, longitude, and altitude. Notably, the relationship between latitude and frost was the most pronounced. Frost typically manifests during the night when temperatures at the earth’s surface and near surface objects fall below the freezing point, causing water vapor in the air to condense into ice crystals. In our study, frost is defined as the occurrence when the minimum ground surface temperature drops below 0 °C. A pivotal factor in this process is the daily minimum temperature, which represents the lowest recorded temperature on a given day. This minimum temperature generally occurs during the night or in the early hours before sunrise, a phenomenon particularly prevalent in instances of radiative frost. It is important to recognize that the specific value of the daily minimum temperature is influenced by factors such as geographical location, season, and local climatic conditions. Lower temperatures increase the likelihood and severity of frost [80]. The influence of precipitation on frost is complex, as it can increase water vapor content and cloud formation, potentially reducing surface radiation loss and delaying frost [81]. Geographical variables like latitude, longitude, and altitude impact frost indices by influencing temperature and precipitation patterns. As latitude increases, the temperature becomes cooler. The atmosphere absorbs some of the solar radiation, but the rest reaches the ground, where it is emitted as longwave radiation. In higher latitudes, where there is less greenhouse gas, this radiation is less effectively trapped, leading to increased heat loss and further cooling of the ground [82,83,84]. China’s climatic zone gradient from south to north includes tropical, temperate, and cold regions [85]. Northeast China primarily encompasses arid and cold climates. The decrease in temperature leads to early FFF, late LSF, and short FFP. As altitude increases, atmospheric pressure drops, leading to a decrease in temperature to maintain the ideal gas law’s relationship between pressure and temperature. The reduced air density at higher elevations weakens heat transfer through convection, conduction, and radiation, resulting in less efficient energy exchange between the ground and the air, ultimately lowering ground temperatures. This effect is most pronounced in mountainous areas [86,87]. Furthermore, as altitude increases, the water vapor content in the atmosphere decreases, reducing the likelihood of water vapor condensing into clouds and precipitation, thereby promoting the occurrence of frost [88]. Consequently, higher altitudes experience a later LSF, an earlier FFF, and a reduced FFP [37,89]. The weak correlation between the frost index and altitude is due to the complexity of frost formation, which includes factors like air humidity, wind speed, and cloud cover. While higher altitudes tend to have lower temperatures, these other factors can reduce frost occurrence. For example, higher humidity or wind can keep the surface from reaching the dew point, lessening the chance of frost. Additionally, the wider temperature ranges at higher altitudes can lead to warmer nights due to cloud insulation, further lowering the potential for frost. In contrast, latitude has a more direct impact on frost index through its influence on solar radiation. Therefore, latitude is a more significant determinant of frost patterns than altitude, resulting in a relatively weak relationship between frost index and elevation. These alterations in the frost index are pivotal for the strategic planning of agricultural endeavors and for comprehending ecological dynamics. In conclusion, the passage delineates how geographical elements exert influence on the incidence of frost and the duration of the frost-free interval. Such insights are indispensable for deciphering climatic patterns, strategizing agricultural activities, and managing ecosystems across various locales, particularly in a country as geographically and climatically diverse as China.

4.4. Limitations

Although this study provides a comprehensive assessment of variations of the ground frost indices in Northeast China, some limitations remain. Firstly, there are a limited number of stations in the high-altitude areas and northern regions of the study area (such as the Xiaoxing’an Mountains and the Sanjiang Plain). The data used in this study are biased as a result of observation equipment and storage conditions, especially in the 1960s and 1970s. The data employed in this study, spanning the past few decades, may also be subject to influences from various factors, including the type of ground cover and the periodic replacement of measuring equipment. Therefore, our results from the weather data of the existing sites are unable to accurately reflect the actual characteristics of the frost indices in the entire Northeast region. Secondly, crops vary in their cold tolerance, and therefore, different thresholds for frost damage are needed for different species. Using a single threshold (e.g., 0) for the frost index may oversimplify the complexity of frost events. Research could explore the use of a range of thresholds to categorize frost severity, which would provide a more nuanced understanding of the impact on different crops. Typically, frost is characterized by a daily air temperature drop below 0 °C, occurring when the average daily air temperature remains above 0 °C. This study focuses on ground frost, which is indicated by the minimum temperature at ground level (0 cm above the surface) falling below 0 °C. These distinctions will be taken into account for future research. In addition, we only analyzed the correlation between frost indices and geographic factors. Understanding the correlation between frost indices and larger-scale atmospheric circulation patterns (e.g., jet streams, blocking high-pressure systems), atmospheric oscillations (e.g., NAO, AO), and climate phenomena like ENSO can provide insights into the synoptic-scale dynamics that influence frost occurrence. Therefore, future research should aim to further understand the interactions between environmental factors such as soil moisture, vegetation cover, and topography and how these factors affect the occurrence, duration, and impact of frost disasters. Future research that investigates the frequency of frost occurrences at the beginning and end of the growing season for representative crops, projected changes in frost indices, the difference between the dates of ground and near-ground frosts (at a height of 5 cm or 2 m above the ground), the contrast between the first and last frost dates and the beginning and end of the thermal growing season, and the occurrence of minimum temperatures significantly below zero degrees in the thermal growing season will greatly enhance our understanding of the agricultural and meteorological phenomenon of frost. Such studies will empower us to more thoroughly understand and forecast the impact of frost on agricultural systems, facilitating the adoption of robust strategies to alleviate its detrimental effects and to bolster the resilience and sustainability of agricultural production.

5. Conclusions

In this study, we focused on an important agriculture climate index, ground frost, and defined three frost indices to quantify the dynamic changes of the frost in Northeast China. For the period of 1961–2020, the spatial distribution of LSF, FFF, and FFP exhibited obvious horizontal and vertical zonal characteristics. The Mohe station was the region with the shortest frost-free period, the latest last spring frost, and the earliest first fall frost in Northeast China. In the past few decades, the LSL, FFF, and FFP of most sites have significantly advanced, delayed, and extended, with only two sites showing no change in FFF. Moreover, the frost indices underwent an abrupt change in the late 1990s. In addition, the research results showed that LSF was positively correlated with geographic factors (latitude, longitude, and altitude), while FFF and FFP were both negatively correlated with geographical features. Among them, latitude has the greatest impact on frost indices. The research findings underscore the complexity of climate dynamics in Northeast China and the need for comprehensive understanding and adaptation strategies. For farmers and policymakers, this information can guide decisions related to crop selection, land use planning, and the development of climate resilience measures. It also contributes to the broader scientific understanding of climate change’s effects on regional climates and ecosystems, which is crucial for global climate change mitigation and adaptation efforts.

Author Contributions

Conceptualization, T.W. and X.S.; methodology, T.W. and X.S.; software, T.W.; validation, G.F. and H.Z.; formal analysis, T.W.; investigation, G.F.; resources, X.S.; data curation, T.W.; writing—original draft preparation, T.W.; writing—review and editing, X.S., G.F., and H.Z.; visualization, H.Z.; supervision, X.S.; project administration, X.S.; funding acquisition, X.S. All authors have read and agreed to the published version of the manuscript.

Funding

This research was funded by National Natural Science Foundation of China (42371070), Key Research Program of Frontier Sciences, CAS (ZDBS-LY-7019), Natural Science Foundation of Jilin Province (20210101104JC), and Youth Innovation Promotion Association, CAS (Y2023069).

Institutional Review Board Statement

Not applicable.

Informed Consent Statement

Not applicable.

Data Availability Statement

The data presented in this study are available upon request from the corresponding author. The data are not publicly available due to privacy.

Acknowledgments

The authors thank the anonymous reviewers and editors, whose comments notably contributed to the improvement of this manuscript.

Conflicts of Interest

The authors declare no conflicts of interest.

References

  1. IPCC. Climate Change 2021: The Physical Science Basis; IPCC: Geneva, Switzerland, 2021.
  2. Pérez, J.; Correa-Araneda, F.; López-Rojo, N.; Basaguren, A.; Boyero, L. Extreme temperature events alter stream ecosystem functioning. Ecol. Indic. 2021, 121, 106984. [Google Scholar] [CrossRef]
  3. Zhao, Q.; Guo, Y.; Ye, T.; Gasparrini, A.; Tong, S.L.; Overcenco, A.; Urban, A.; Schneider, A.; Entezari, A.; Vicedo-Cabrera, A.M.; et al. Global, regional, and national burden of mortality associated with non-optimal ambient temperatures from 2000 to 2019: A three-stage modelling study. Lancet Planet Health 2021, 5, e415–e425. [Google Scholar] [CrossRef] [PubMed]
  4. Shen, X.; Jiang, M.; Lu, X.; Liu, X.; Liu, B.; Zhang, J.; Wang, X.; Tong, S.; Lei, G.; Wang, S.; et al. Aboveground biomass and its spatial distribution pattern of herbaceous marsh vegetation in China. Sci. China Earth Sci. 2021, 64, 1115–1125. [Google Scholar] [CrossRef]
  5. Ma, R.; Xia, C.; Liu, Y.; Wang, Y.; Zhang, J.; Shen, X.; Lu, X.; Jiang, M. Spatiotemporal Change of Net Primary Productivity and Its Response to Climate Change in Temperate Grasslands of China. Front. Plant Sci. 2022, 13, 899800. [Google Scholar] [CrossRef] [PubMed]
  6. Shen, X.; Liu, Y.; Zhang, J.; Wang, Y.; Ma, R.; Liu, B.; Lu, X.; Jiang, M. Asymmetric Impacts of Diurnal Warming on Vegetation Carbon Sequestration of Marshes in the Qinghai Tibet Plateau. Global Biogeochem. Cycles 2022, 36, e2022GB007396. [Google Scholar] [CrossRef]
  7. Shen, X.; Shen, M.; Wu, C.; Penuelas, J.; Ciais, P.; Zhang, J.; Freeman, C.; Palmer, P.I.; Liu, B.; Henderson, M.; et al. Critical role of water conditions in the responses of autumn phenology of marsh wetlands to climate change on the Tibetan Plateau. Glob. Change Biol. 2023, 30, e17097. [Google Scholar] [CrossRef] [PubMed]
  8. Haggag, M.; Rezk, E.; El-Dakhakhni, W. Machine learning prediction of climate-induced disaster injuries. Nat. Hazards 2023, 116, 3645–3667. [Google Scholar] [CrossRef]
  9. Zhang, Z.; Wang, P.; Chen, Y.; Zhang, S.; Tao, F.; Liu, X. Spatial pattern and decadal change of agro-meteorological disasters in the main wheat production area of China during 1991–2009. J. Geogr. Sci. 2014, 24, 387–396. [Google Scholar] [CrossRef]
  10. Xu, X.; Tang, Q. Spatiotemporal variations in damages to cropland from agrometeorological disasters in mainland China during 1978–2018. Sci. Total Environ. 2021, 785, 147247. [Google Scholar] [CrossRef]
  11. Guan, X.; Zang, Y.; Meng, Y.; Liu, Y.; Lv, H.; Yan, D. Study on spatiotemporal distribution characteristics of flood and drought disaster impacts on agriculture in China. Int. J. Disast. Risk Re. 2021, 64, 102504. [Google Scholar] [CrossRef]
  12. Li, Y.; Zhao, S.; Wang, G. Spatiotemporal Variations in Meteorological Disasters and Vulnerability in China During 2001–2020. Front. Earth Sc. 2021, 9, 789523. [Google Scholar] [CrossRef]
  13. Xu, X.; Tang, Q. Meteorological disaster frequency at prefecture-level city scale and induced losses in mainland China during 2011–2019. Nat. Hazards 2021, 109, 827–844. [Google Scholar] [CrossRef]
  14. Yeşilırmak, E. Climatology and trends in temperature-based agroclimatic indices over western Anatolia, Türkiye. Theor. Appl. Climatol. 2022, 150, 1233–1252. [Google Scholar] [CrossRef]
  15. Tonelli, E.; Vitali, A.; Malandra, F.; Camarero, J.J.; Colangelo, M.; Nolè, A.; Ripullone, F.; Carrer, M.; Urbinati, C. Tree-ring and remote sensing analyses uncover the role played by elevation on European beech sensitivity to late spring frost. Sci. Total Environ. 2023, 857, 159239. [Google Scholar] [CrossRef] [PubMed]
  16. Papagiannaki, K.; Lagouvardos, K.; Kotroni, V.; Papagiannakis, G. Agricultural losses related to frost events: Use of the 850 hPa level temperature as an explanatory variable of the damage cost. Nat. Hazards Earth Syst. Sci. 2014, 14, 2375–2386. [Google Scholar] [CrossRef]
  17. Girardin, M.P.; Guo, X.J.; Gervais, D.; Metsaranta, J.; Campbell, E.M.; Arsenault, A.; Isaac-Renton, M.; Hogg, E.H. Cold-season freeze frequency is a pervasive driver of subcontinental forest growth. Proc. Natl. Acad. Sci. USA 2022, 119, e2117464119. [Google Scholar] [CrossRef] [PubMed]
  18. Meehl, G.A.; Tebaldi, C.; Nychka, D. Changes in frost days in simulations of twentyfirst century climate. Clim. Dyn. 2004, 23, 495–511. [Google Scholar] [CrossRef]
  19. Vitasse, Y.; Bottero, A.; Cailleret, M.; Bigler, C.; Fonti, P.; Gessler, A.; Levesque, M.; Rohner, B.; Weber, P.; Rigling, A.; et al. Contrasting resistance and resilience to extreme drought and late spring frost in five major European tree species. Glob. Change Biol. 2019, 25, 3781–3792. [Google Scholar] [CrossRef] [PubMed]
  20. Anandhi, A.; Perumal, S.; Gowda, P.H.; Knapp, M.; Hutchinson, S.; Harrington, J.; Murray, L.; Kirkham, M.B.; Rice, C.W. Long-term spatial and temporal trends in frost indices in Kansas, USA. Clim. Change 2013, 120, 169–181. [Google Scholar] [CrossRef]
  21. Charalampopoulos, I.; Droulia, F. Frost Conditions Due to Climate Change in South-Eastern Europe via a High-Spatiotemporal-Resolution Dataset. Atmosphere 2022, 13, 1407. [Google Scholar] [CrossRef]
  22. Parker, L.E.; Zhang, N.; Abatzoglou, J.T.; Ostoja, S.M.; Pathak, T.B. Observed Changes in Agroclimate Metrics Relevant for Specialty Crop Production in California. Agronomy 2022, 12, 205. [Google Scholar] [CrossRef]
  23. Charalampopoulos, I. Agrometeorological Conditions and Agroclimatic Trends for the Maize and Wheat Crops in the Balkan Region. Atmosphere 2021, 12, 671. [Google Scholar] [CrossRef]
  24. Chen, R.; Wang, J.; Li, Y.; Song, Y.; Huang, M.; Feng, P.; Qu, Z.; Liu, L. Quantifying the impact of frost damage during flowering on apple yield in Shaanxi province, China. Eur. J. Agron. 2023, 142, 126642. [Google Scholar] [CrossRef]
  25. Tait, A.; Zheng, X. Mapping Frost Occurrence Using Satellite Data. J. Appl. Meteorol. 2003, 42, 193–203. [Google Scholar] [CrossRef]
  26. Chmielewski, F.-M.; Müller, A.; Bruns, E. Climate changes and trends in phenology of fruit trees and field crops in Germany, 1961–2000. Agr. Forest Meteorol. 2004, 121, 69–78. [Google Scholar] [CrossRef]
  27. Graczyk, D.; Szwed, M. Changes in the Occurrence of Late Spring Frost in Poland. Agronomy 2020, 10, 1835. [Google Scholar] [CrossRef]
  28. Drepper, B.; Gobin, A.; Van Orshoven, J. Spatio-temporal assessment of frost risks during the flowering of pear trees in Belgium for 1971–2068. Agr. Forest Meteorol. 2022, 315, 108822. [Google Scholar] [CrossRef]
  29. Gaumont-Guay, D.; Margolis, H.A.; Bigras, F.J.; Raulier, F. Characterizing the frost sensitivity of black spruce photosynthesis during cold acclimation. Tree Physiol. 2003, 23, 301–311. [Google Scholar] [CrossRef]
  30. Tang, J.; Wang, P.; Li, X.; Yang, J.; Wu, D.; Ma, Y.; Li, S.; Jin, Z.; Huo, Z. Disaster event-based spring frost damage identification indicator for tea plants and its applications over the region north of the Yangtze River, China. Ecol. Indic. 2023, 146, 109912. [Google Scholar] [CrossRef]
  31. Yang, W.; Parsons, D.; Mao, X. Exploring limiting factors for maize growth in Northeast China and potential coping strategies. Irrig. Sci. 2023, 41, 321–335. [Google Scholar] [CrossRef]
  32. Augspurger, C.K. Reconstructing patterns of temperature, phenology, and frost damage over 124 years: Spring damage risk is increasing. Ecology 2013, 94, 41–50. [Google Scholar] [CrossRef]
  33. Lamichhane, J.R. Rising risks of late-spring frosts in a changing climate. Nat. Clim. Change 2021, 11, 554–555. [Google Scholar] [CrossRef]
  34. Sanguesa-Barreda, G.; Di Filippo, A.; Piovesan, G.; Rozas, V.; Di Fiore, L.; Garcia-Hidalgo, M.; Garcia-Cervigon, A.I.; Munoz-Garachana, D.; Baliva, M.; Olano, J.M. Warmer springs have increased the frequency and extension of late-frost defoliations in southern European beech forests. Sci. Total Environ. 2021, 775, 145860. [Google Scholar] [CrossRef]
  35. Helali, J.; Oskouei, E.A.; Hosseini, S.A.; Saeidi, V.; Modirian, R. Projection of changes in late spring frost based on CMIP6 models and SSP scenarios over cold regions of Iran. Theor. Appl. Climatol. 2022, 149, 1405–1418. [Google Scholar] [CrossRef]
  36. Scheifinger, H.; Menzel, A.; Koch, E.; Peter, C. Trends of spring time frost events and phenological dates in Central Europe. Theor. Appl. Climatol. 2003, 74, 41–51. [Google Scholar] [CrossRef]
  37. Rahimi, M.; Hajjam, S.; Khalili, A.; Kamali, G.A.; Stigter, C.J. Risk analysis of first and last frost occurrences in the Central Alborz region, Iran. Int. J. Climatol. 2007, 27, 349–356. [Google Scholar] [CrossRef]
  38. Anandhi, A.; Zion, M.S.; Gowda, P.H.; Pierson, D.C.; Lounsbury, D.; Frei, A. Past and future changes in frost day indices in Catskill Mountain region of New York. Hydrol. Process. 2013, 27, 3094–3104. [Google Scholar] [CrossRef]
  39. Malinovic-Milicevic, S.; Stanojevic, G.; Radovanovic, M.M. Recent changes in first and last frost dates and frost-free period in Serbia. Geogr. Ann. A 2017, 100, 44–58. [Google Scholar] [CrossRef]
  40. Biazar, S.M.; Ferdosi, F.B. An investigation on spatial and temporal trends in frost indices in Northern Iran. Theor. Appl. Climatol. 2020, 141, 907–920. [Google Scholar] [CrossRef]
  41. Nikolova, N.; Matev, S.; Rachev, G.; Ivanova, D. Characteristics of first and last frost occurrences and the length of frost-free season in Bulgaria. J. Environ. Manag. 2020, 22, 85–94. [Google Scholar]
  42. Koźmiński, C.; Nidzgorska-Lencewicz, J.; Mąkosza, A.; Michalska, B. Ground Frosts in Poland in the Growing Season. Agriculture 2021, 11, 573. [Google Scholar] [CrossRef]
  43. Kunkel, K.E.; Easterling, D.R.; Hubbard, K.; Redmond, K. Temporal variations in frost-free season in the United States: 1895–2000. Geophys. Res. Lett. 2004, 31, L03201. [Google Scholar] [CrossRef]
  44. Helali, J.; Momenzadeh, H.; Oskouei, E.A.; Lotfi, M.; Hosseini, S.A. Trend and ENSO-based analysis of last spring frost and chilling in Iran. Meteorol. Atmos. Phys. 2021, 133, 1203–1221. [Google Scholar] [CrossRef]
  45. Gabbrielli, M.; Perego, A.; Acutis, M.; Bechini, L. A review of crop frost damage models and their potential application to cover crops. Ital. J. Agron. 2022, 17, 2046. [Google Scholar] [CrossRef]
  46. Masaki, Y. Future frost risks in the Tohoku region of Japan under a warming climate—Interpretation of regional diversity in terms of seasonal warming. Theor. Appl. Climatol. 2022, 147, 473–485. [Google Scholar] [CrossRef]
  47. Liu, B.; Henderson, M.; Xu, M. Spatiotemporal change in China’s frost days and frost-free season, 1955–2000. J. Geophys. Res. Atmos. 2008, 113, D12104. [Google Scholar] [CrossRef]
  48. Li, H.; Liu, G.; Han, C.; Yang, Y.; Chen, R. Quantifying the Trends and Variations in the Frost-Free Period and the Number of Frost Days across China under Climate Change Using ERA5-Land Reanalysis Dataset. Remote Sens. 2022, 14, 2400. [Google Scholar] [CrossRef]
  49. Yue, Z.; Xu, Z.; Wang, Y. The Spatio–Temporal Variation of Spring Frost in Xinjiang from 1971 to 2020. Atmosphere 2022, 13, 1087. [Google Scholar] [CrossRef]
  50. Han, R.; Li, W.; Ai, W.; Song, Y.; Ye, D.; Hou, W. The Climatic Variability and Influence of First Frost Dates in Northern China. Acta Geogr. Sin. 2010, 65, 525–532. [Google Scholar]
  51. Zhang, Z.; Xu, X.; Guo, C.; Cai, M.; Yuan, Z.; Zhang, M. Spatial and temporal characteristics and influencing factors of frost date in the Yellow River Basin from 1960 to 2020. Arid. Land Geogr. 2022, 45, 1685–1694. [Google Scholar]
  52. Meng, Q.; Hou, P.; Wu, L.; Chen, X.; Cui, Z.; Zhang, F. Understanding production potentials and yield gaps in intensive maize production in China. Field Crops Res. 2013, 143, 91–97. [Google Scholar] [CrossRef]
  53. Zhao, J.; Guo, J.; Mu, J. Exploring the relationships between climatic variables and climate-induced yield of spring maize in Northeast China. Agr. Ecosyst. Environ. 2015, 207, 79–90. [Google Scholar] [CrossRef]
  54. Li, Z.; Yang, P.; Tang, H.; Wu, W.; Yin, H.; Liu, Z.; Zhang, L. Response of maize phenology to climate warming in Northeast China between 1990 and 2012. Reg. Environ. Change 2013, 14, 39–48. [Google Scholar] [CrossRef]
  55. Zhao, J.; Yang, X.; Liu, Z.; Lv, S.; Wang, J.; Dai, S. Variations in the potential climatic suitability distribution patterns and grain yields for spring maize in Northeast China under climate change. Clim. Change 2016, 137, 29–42. [Google Scholar] [CrossRef]
  56. Qin, Z.; Peng, T.; Singh, V.P.; Chen, M. Spatio-temporal variations of precipitation extremes in Hanjiang River Basin, China, during 1960–2015. Theor. Appl. Climatol. 2019, 138, 1767–1783. [Google Scholar] [CrossRef]
  57. Zong, X.; Yin, Y.; Cui, T.; Hou, W.; Deng, H. Spatiotemporal analysis of consecutive extreme wet days in China from 1980 to 2020. Int. J. Climatol. 2023, 43, 2975–2988. [Google Scholar] [CrossRef]
  58. Dai, X.; Wang, L.; Li, X.; Gong, J.; Cao, Q. Characteristics of the extreme precipitation and its impacts on ecosystem services in the Wuhan Urban Agglomeration. Sci. Total Environ. 2023, 864, 161045. [Google Scholar] [CrossRef] [PubMed]
  59. Ezaz, G.T.; Zhang, K.; Li, X.; Shalehy, M.H.; Hossain, M.A.; Liu, L. Spatiotemporal changes of precipitation extremes in Bangladesh during 1987–2017 and their connections with climate changes, climate oscillations, and monsoon dynamics. Glob. Planet. Change 2022, 208, 103712. [Google Scholar] [CrossRef]
  60. Ning, X.; Liu, G.; Zhang, L.; Qin, X.; Zhou, S.; Qin, Y. The spatio-temporal variations of frost-free period in China from 1951 to 2012. J. Geogr. Sci. 2017, 27, 23–42. [Google Scholar] [CrossRef]
  61. Yang, Y.; Wang, H.; Liu, C.; Feng, R.; Wang, Y.; Li, H. Spatiotemporal variations of seasonal temperature at different percentiles in the three provinces of northeast China from 1961 to 2019. Int. J. Climatol. 2022, 42, 5342–5358. [Google Scholar] [CrossRef]
  62. Ma, L.; Lu, R.; Chen, D. Warming hiatus of extreme temperature across China’s cold regions during 1998–2018. Front. Earth Sci. 2022, 16, 846–864. [Google Scholar] [CrossRef]
  63. Wang, X.; Wu, G.; Qin, Y. Day-to-Day Temperature Variability in China During Last 60 Years Relative to Arctic Oscillation. Earth Space Sci. 2022, 9, e2022EA002587. [Google Scholar] [CrossRef]
  64. Yan, Y.; You, Q.; Wu, F.; Pepin, N.; Kang, S. Surface mean temperature from the observational stations and multiple reanalyses over the Tibetan Plateau. Clim. Dyn. 2020, 55, 2405–2419. [Google Scholar] [CrossRef]
  65. Meng, C.; Zhang, L.; Gou, P.; Huang, Q.; Ma, Y.; Miao, S.; Ma, W.; Xu, Y. Assessments of future climate extremes in China by using high-resolution PRECIS 2.0 simulations. Theor. Appl. Climatol. 2021, 145, 295–311. [Google Scholar] [CrossRef]
  66. Yu, Y.; Duan, S.-B.; Li, Z.-L.; Chang, S.; Xing, Z.; Leng, P.; Gao, M. Interannual Spatiotemporal Variations of Land Surface Temperature in China From 2003 to 2018. IEEE J. Sel. Topics Appl. Earth Observ. Remote Sens. 2021, 14, 1783–1795. [Google Scholar] [CrossRef]
  67. Lu, M.; Sun, H.; Yan, D.; Xue, J.; Yi, S.; Gui, D.; Tuo, Y.; Zhang, W. Projections of thermal growing season indices over China under global warming of 1.5 °C and 2.0 °C. Sci. Total Environ. 2021, 781, 146774. [Google Scholar] [CrossRef]
  68. Shang, L.; Liao, J.; Xie, S.; Tu, Z.; Liao, H.; Zhong, K. Dynamic changes in the thermal growing season and their association with atmospheric circulation in China. Int. J. Biometeorol. 2022, 66, 545–558. [Google Scholar] [CrossRef]
  69. Škvareninová, J.; Lukasová, V.; Borsányi, P.; Kvas, A.; Vido, J.; Štefková, J.; Škvarenina, J. The effect of climate change on spring frosts and flowering of Crataegus laevigata—The indicator of the validity of the weather lore about “The Ice Saints”. Ecol. Indic. 2022, 145, 109688. [Google Scholar] [CrossRef]
  70. Ru, X.; Jiang, Y.; Luo, Q.; Wang, R.; Feng, X.; Wang, J.; Wang, Z.; Li, M.; Qu, Z.; Su, B.; et al. Evaluating late spring frost risks of apple in the Loess Plateau of China under future climate change with phenological modeling approach. Sci. Hortic. 2023, 308, 111604. [Google Scholar] [CrossRef]
  71. Shen, X.; Liu, B.; Henderson, M.; Wang, L.; Jiang, M.; Lu, X. Vegetation Greening, Extended Growing Seasons, and Temperature Feedbacks in Warming Temperate Grasslands of China. J. Clim. 2022, 35, 5103–5117. [Google Scholar] [CrossRef]
  72. Vitasse, Y.; Lenz, A.; Korner, C. The interaction between freezing tolerance and phenology in temperate deciduous trees. Front. Plant Sci. 2014, 5, 541. [Google Scholar] [CrossRef]
  73. Kukal, M.S.; Irmak, S.U.S. Agro-Climate in 20(th) Century: Growing Degree Days, First and Last Frost, Growing Season Length, and Impacts on Crop Yields. Sci. Rep. 2018, 8, 6977. [Google Scholar] [CrossRef] [PubMed]
  74. Potop, V.; Zahraniček, P.; Türkott, L.; Štěpánek, P.; Soukup, J. Risk occurrences of damaging frosts during the growing season of vegetables in the Elbe River lowland, the Czech Republic. Nat. Hazards 2014, 71, 1–19. [Google Scholar] [CrossRef]
  75. McCabe, G.J.; Betancourt, J.L.; Feng, S. Variability in the start, end, and length of frost-free periods across the conterminous United States during the past century. Int. J. Climatol. 2015, 35, 4673–4680. [Google Scholar] [CrossRef]
  76. Masaki, Y. First and last frost date determinations based on meteorological observations in Japan: Trend analysis and estimation scheme construction. Theor. Appl. Climatol. 2021, 145, 411–426. [Google Scholar] [CrossRef]
  77. Yu, L.; Zhong, S.; Bian, X.; Heilman, W.E.; Andresen, J.A. Temporal and spatial variability of frost-free seasons in the Great Lakes region of the United States. Int. J. Climatol. 2014, 34, 3499–3514. [Google Scholar] [CrossRef]
  78. Erlat, E.; Türkeş, M. Dates of frost onset, frost end and the frost-free season in Turkey: Trends, variability and links to the North Atlantic and Arctic Oscillation indices, 1950-2013. Clim. Res. 2016, 69, 155–176. [Google Scholar] [CrossRef]
  79. Sun, W.; Ren, R.; Liu, Y.; Wang, J.; Wang, L.; Liu, X.; Jiu, S.; Wang, S.; Zhang, C. Non-uniform changes of growing conditions for sweet cherry trees responses to climate warming in main production regions of China. Int. J. Climatol. 2022, 42, 10464–10481. [Google Scholar] [CrossRef]
  80. Wypych, A.; Ustrnul, Z.; Sulikowska, A.; Chmielewski, F.M.; Bochenek, B. Spatial and temporal variability of the frost-free season in Central Europe and its circulation background. Int. J. Climatol. 2016, 37, 3340–3352. [Google Scholar] [CrossRef]
  81. Thibeault, J.M.; Seth, A.; Garcia, M. Changing climate in the Bolivian Altiplano: CMIP3 projections for temperature and precipitation extremes. J. Geophys. Res. Atmos. 2010, 115, D08103. [Google Scholar] [CrossRef]
  82. Wang, K.; Dickinson, R.E. Contribution of solar radiation to decadal temperature variability over land. Proc. Natl. Acad. Sci. USA 2013, 110, 14877–14882. [Google Scholar] [CrossRef] [PubMed]
  83. Wang, K.; Ma, Q.; Li, Z.; Wang, J. Decadal variability of surface incident solar radiation over China: Observations, satellite retrievals, and reanalyses. J. Geophys. Res. Atmos. 2015, 120, 6500–6514. [Google Scholar] [CrossRef]
  84. Du, J.; Wang, K.; Wang, J.; Ma, Q. Contributions of surface solar radiation and precipitation to the spatiotemporal patterns of surface and air warming in China from 1960 to 2003. Atmos. Chem. Phys. 2017, 17, 4931–4944. [Google Scholar] [CrossRef]
  85. Wang, T.; Zhou, D.; Shen, X. Spatial-temporal variations of Köppen climate types in China. Terr. Atmos. Ocean. Sci. 2021, 32, 483–496. [Google Scholar] [CrossRef]
  86. Zhu, L.; Fan, G. Assessment and projection of elevation-dependent warming over the Tibetan Plateau by CMIP6 models. Theor. Appl. Climatol. 2022, 147, 1713–1723. [Google Scholar] [CrossRef]
  87. Kad, P.; Blau, M.T.; Ha, K.-J.; Zhu, J. Elevation-dependent temperature response in early Eocene using paleoclimate model experiment. Environ. Res. Lett. 2022, 17, 114038. [Google Scholar] [CrossRef]
  88. Brázdil, R.; Zahradníček, P.; Dobrovolný, P.; Štěpánek, P.; Trnka, M. Observed changes in precipitation during recent warming: The Czech Republic, 1961–2019. Int. J. Climatol. 2021, 41, 3881–3902. [Google Scholar] [CrossRef]
  89. García-Martín, A.; Paniagua, L.L.; Moral, F.J.; Rebollo, F.J.; Rozas, M.A. Spatiotemporal Analysis of the Frost Regime in the Iberian Peninsula in the Context of Climate Change (1975–2018). Sustainability 2021, 13, 8491. [Google Scholar] [CrossRef]
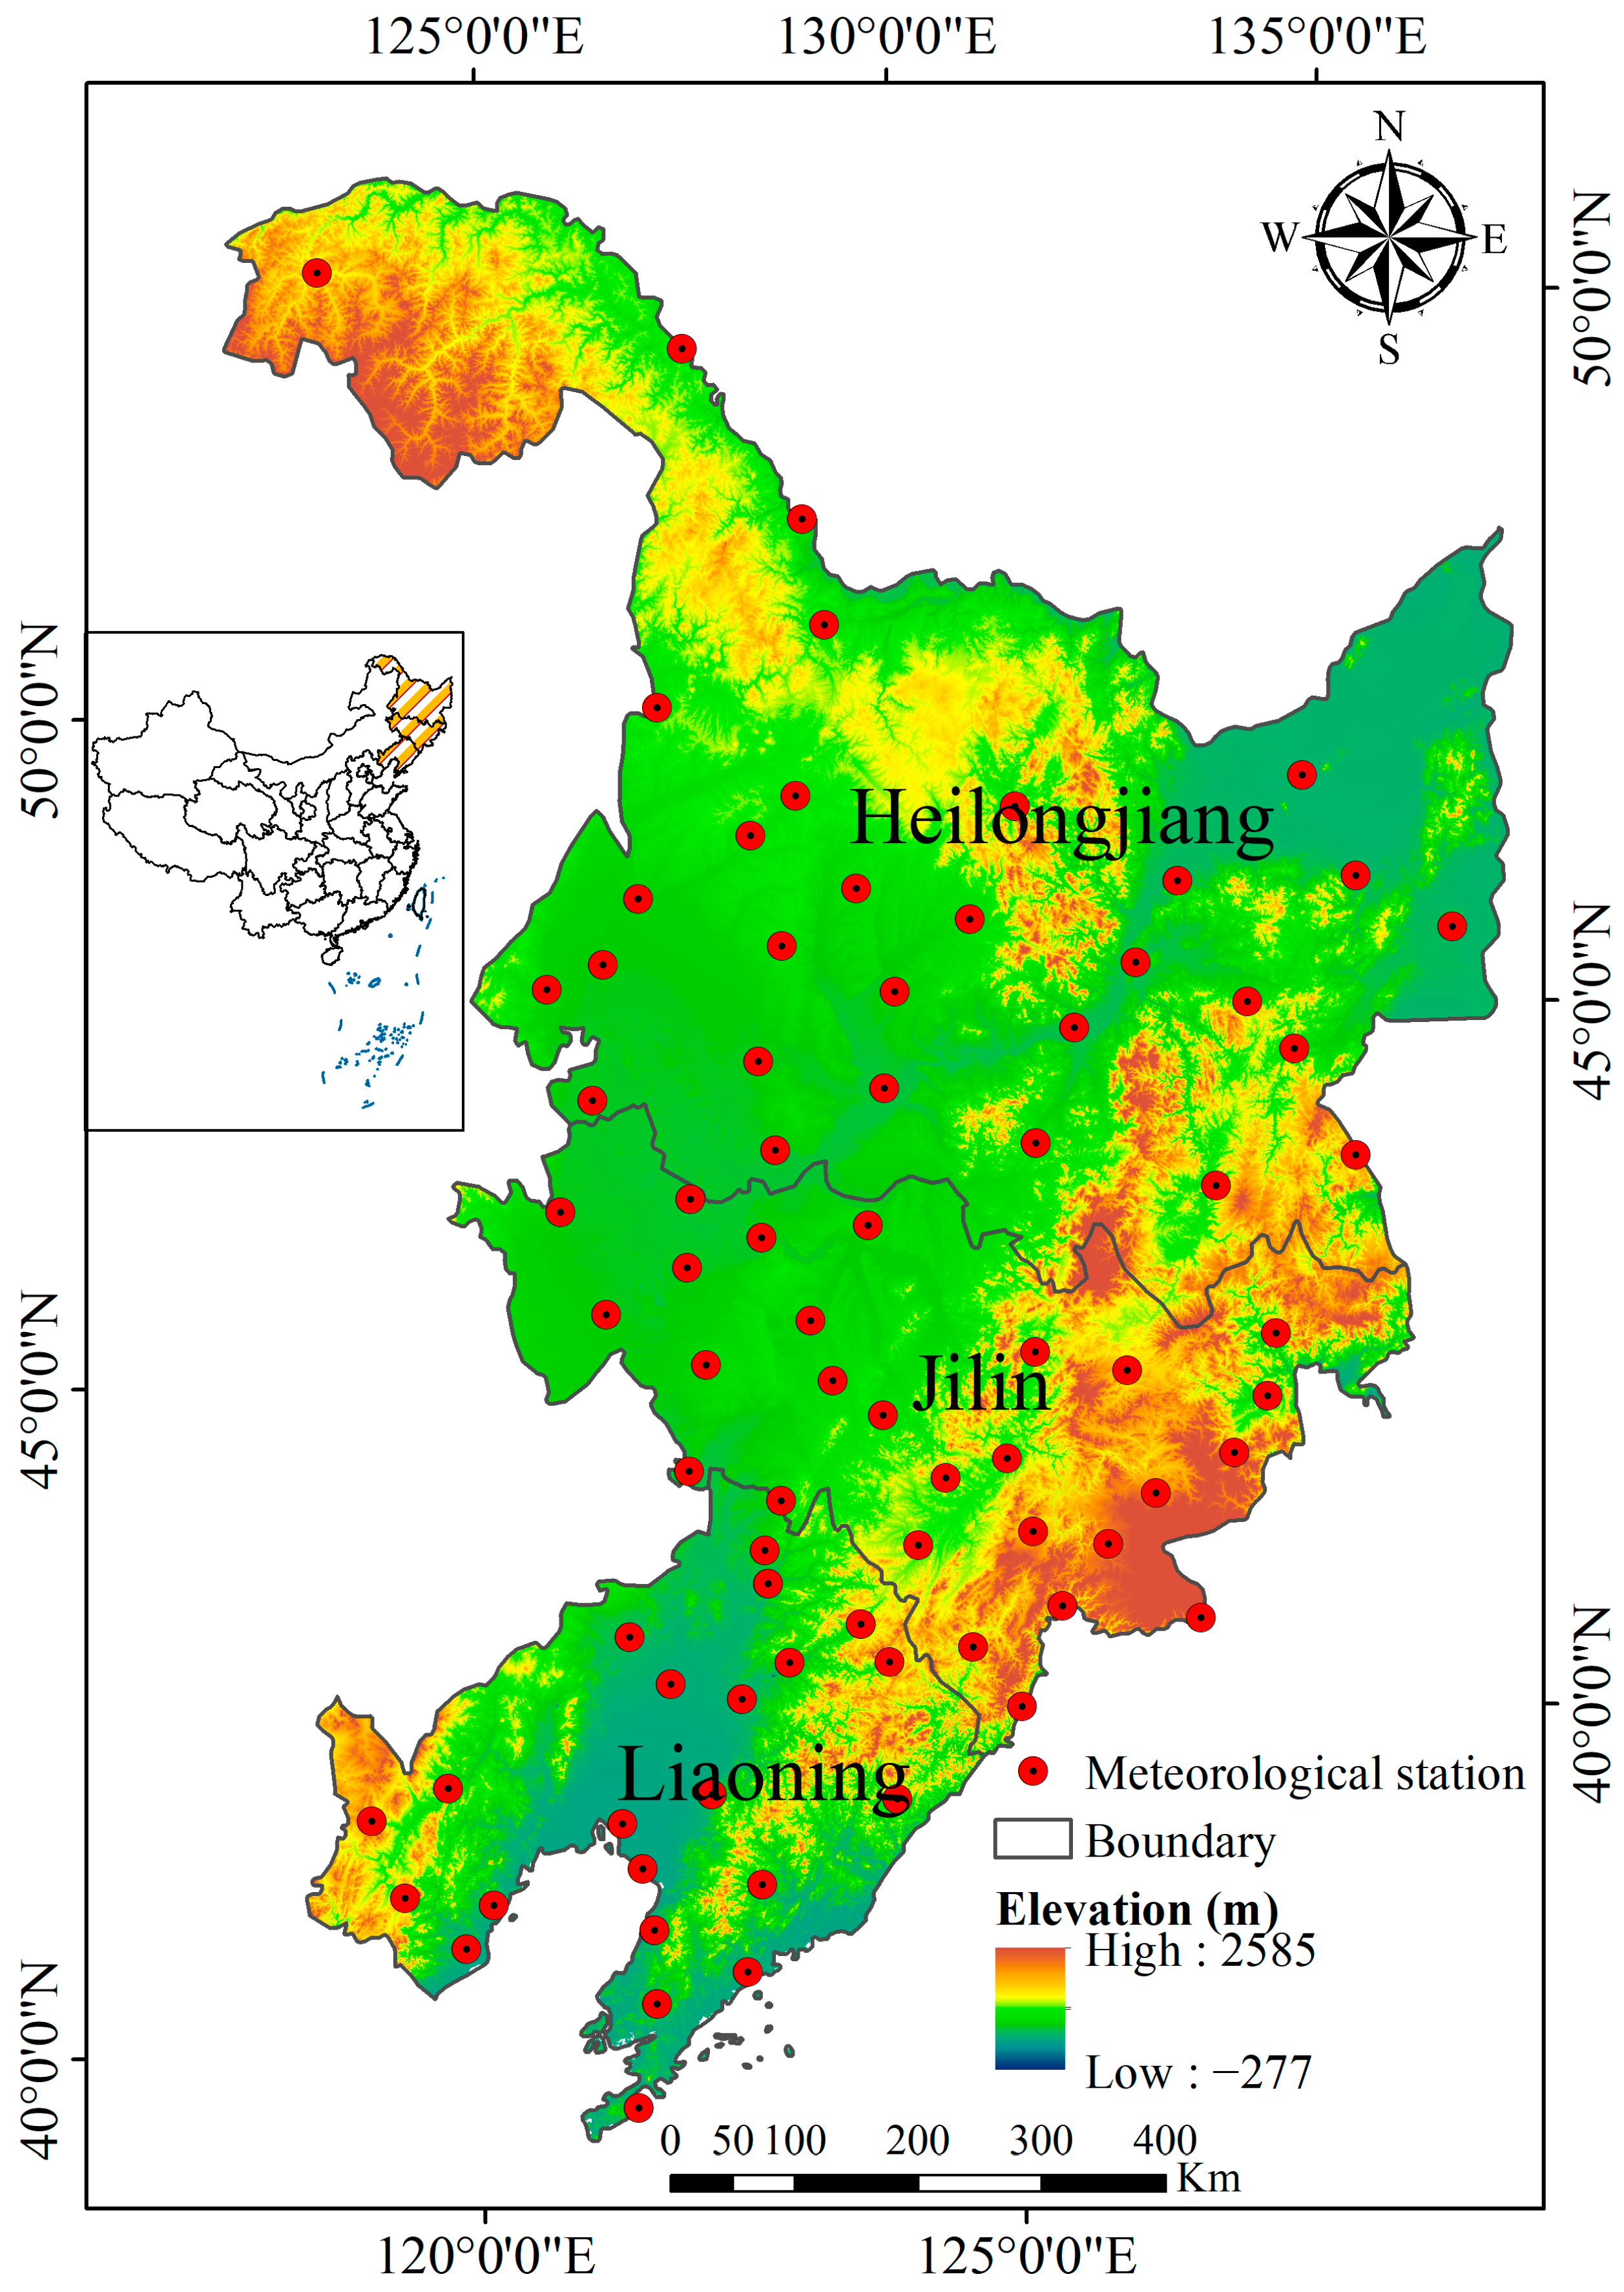
Figure 1. The topography and meteorological station distribution in the Northeast China.
Atmosphere 15 00817 g001
Figure 2. The spatial distribution of average frost indices: (a) last spring frost (LSF), (b) first fall frost (FFF), and (c) frost-free period (FFP) in Northeast China during the period of 1961–2020.
Atmosphere 15 00817 g002
Figure 3. The temporal variation in the average frost indices: (a) last spring frost (LSF), (b) first fall frost (FFF), and (c) frost-free period (FFP) in Northeast China during the period of 1961–2020. The shaded areas represent the 95% confidence intervals of the linear fitting curves.
Atmosphere 15 00817 g003
Figure 4. The temporal variation in the average frost indices (last spring frost (LSF), first fall frost (FFF), and frost-free period (FFP)) for three regions during the period of 1961–2020: (a) Heilongjiang Province, (b) Jilin Province, and (c) Liaoning Province. The shaded area represents the 95% confidence intervals of the linear fitting curve.
Atmosphere 15 00817 g004
Figure 5. The spatial distribution of changing rates of the frost indices: (a) last spring frost (LSF), (b) first fall frost (FFF), and (c) frost-free period (FFP) in Northeast China during the period of 1961–2020.
Atmosphere 15 00817 g005
Figure 6. The spatial pattern of change trends in the frost indices: (a) last spring frost (LSF), (b) first fall frost (FFF), and (c) frost-free period (FFP) in Northeast China during the period of 1961–2020. |Z| ≥ 1.96, 2.58 indicates that the trend is significant at the 0.05, 0.01 levels, respectively.
Atmosphere 15 00817 g006
Figure 7. Mutation analysis of the frost indices: (a) last spring frost (LSF), (b) first fall frost (FFF), and (c) frost-free period (FFP) in Northeast China during the period of 1961–2020.
Atmosphere 15 00817 g007
Figure 8. Relationship between the frost indices and latitude: (a) last spring frost (LSF), (b) first fall frost (FFF), (c) frost-free period (FFP).
Atmosphere 15 00817 g008
Figure 9. Relationship between the frost indices and longitude: (a) last spring frost (LSF), (b) first fall frost (FFF), (c) frost-free period (FFP).
Atmosphere 15 00817 g009
Figure 10. Relationship between the frost indices and elevation: (a) last spring frost (LSF), (b) first fall frost (FFF), (c) frost-free period (FFP).
Atmosphere 15 00817 g010
Table 1. The number of stations with positive (significant at the 0.05 level), negative (significant at the 0.05 level), and no trends in frost indices across Northeast China during 1961–2020; “no trend” indicates that the corresponding Sen’s slope is equal to 0.
ZonesIndicesNumber of Stations with
PositiveNo TrendNegative
Northeast ChinaLSF 5 (74)
FFF12 (65)2
FFP1 (78)
Heilongjiang ProvinceLSF (30)
FFF7 (22)1
FFP(30)
Jilin ProvinceLSF (27)
FFF3 (24)
FFP(27)
Liaoning ProvinceLSF 5 (17)
FFF2 (19)1
FFP1 (21)
Disclaimer/Publisher’s Note: The statements, opinions and data contained in all publications are solely those of the individual author(s) and contributor(s) and not of MDPI and/or the editor(s). MDPI and/or the editor(s) disclaim responsibility for any injury to people or property resulting from any ideas, methods, instructions or products referred to in the content.