Article

Particulate and Gaseous Emissions from a Large Two-Stroke Slow-Speed Marine Engine Equipped with Open-Loop Scrubber under Real Sailing Conditions

by
Achilleas Grigoriadis
1,
Nikolaos Kousias
1,
Anastasios Raptopoulos-Chatzistefanou
1,
Håkan Salberg
2,
Jana Moldanová
2,
Anna-Lunde Hermansson
3,
Yingying Cha
2,
Anastasios Kontses
1,
Zisimos Toumasatos
1,
Sokratis Mamarikas
1 and
Leonidas Ntziachristos
1,*
1
Department of Mechanical Engineering, Aristotle University, P.O. Box 458, 54124 Thessaloniki, Greece
2
IVL Swedish Environmental Research Institute, 40014 Gothenburg, Sweden
3
Department of Mechanics and Maritime Sciences, Chalmers University of Technology, Horselgangen 4, 41756 Gothenburg, Sweden
*
Author to whom correspondence should be addressed.
Atmosphere 2024, 15(7), 845; https://doi.org/10.3390/atmos15070845
Submission received: 3 June 2024 / Revised: 8 July 2024 / Accepted: 13 July 2024 / Published: 17 July 2024
(This article belongs to the Special Issue Engine Emissions: Assessment and Control)

Abstract

:
Particulate and gaseous emissions were studied from a large two-stroke slow-speed diesel engine equipped with an open-loop scrubber, installed on a 78,200 metric tonnes (deadweight) containership, under real operation. This paper presents the on-board emission measurements conducted upstream and downstream of the scrubber with heavy fuel oil (HFO) and ultra-low sulfur fuel oil (ULSFO). Particle emissions were examined under various dilution ratios and temperature conditions, and with two thermal treatment setups, involving a thermodenuder (TD) and a catalytic stripper (CS). Our results show a 75% SO2 reduction downstream of the scrubber with the HFO to emission-compliant levels, while the use of the ULSFO further decreased SO2 levels. The operation of the scrubber produced higher particle number levels compared to engine-out, attributed to the condensational growth of nanometer particle cores, salt and the formation of sulfuric acid particles in the smaller size range, induced by the scrubber. The use of a TD and a CS eliminates volatiles but can generate new particles when used in high-sulfur conditions. The results of this study contribute to the generally limited understanding of the particulate and gaseous emission performance of open-loop scrubbers in ships and could feed into emission and air quality models for estimating marine pollution impacts.

1. Introduction

The maritime sector is responsible for transporting over 80% of global trade by volume [1], but the drawback of this activity is its significant contribution to air pollution, air quality degradation [2] and adverse effects on human health [3,4]. Ships emit high quantities of harmful pollutants, such as sulfur oxides (SOX), nitrogen oxides (NOX) [5] and particulate matter (PM) [6,7], as well as species contributing to climate warming (CO2, black carbon, etc.) [8]. Particulate properties, such as particle number (PN) concentration and particle size distribution (PSD), are also of significant importance [9,10], due to the severe consequences of PM on human health [11], since most of the particles emitted by combustion in ships are found in the ultrafine region [12], below 100 nm [13,14,15,16]. Nanoparticles can penetrate deeply into the respiratory system, impacting the lungs, and can also cause cardiovascular issues, affecting the brain and other organs. In general, nanoparticles are a source of serious human diseases [17,18].
The International Maritime Organization (IMO) has taken actions to reduce shipping greenhouse gas (GHG) emissions, which were projected to reach up to 17% of global CO2 emissions by 2050 [19]. Energy-efficient designs and operational requirements for ships are being applied, as a strategy to minimize losses and, therefore, the carbon footprint [20,21], and requirements for monitoring and reporting of CO2 by ship operators in the European Union (EU) [22] and at international level [23] are being put forward. In addition, the EU emission trading system (ETS) has been established, to limit CO2 emissions and impose a cost on those emissions [24,25]. NOX emissions are regulated in the context of engine certification and are subject to further geospatial restrictions in low-emission areas, called nitrogen emission control areas (NECA) [26]. SOX emissions have been regulated by the reduction of maximum fuel sulfur content (FSC) from 3.5% to 0.5% on a mass basis on a global scale [27]. In addition, a stricter FSC limit of 0.1% is applicable in sulfur emission control areas (SECA). Current shipping legislation does not regulate particulate emissions [12].
The drawback of using low-sulfur fuels is the rise in fuel expenditure [28]. An alternative enabled by IMO and often adopted is the utilization of cheaper high-sulfur HFO in combination with exhaust gas cleaning systems, so-called scrubbers [29]. Scrubbers have the ability to decrease exhaust SO2 emissions, typically by up to 99% [5,30], so as to provide reductions equivalent to low-sulfur fuel criteria. Three types of scrubbers are technically feasible and are most often installed in ships: open-loop, closed-loop and hybrid ones [30]. Open-loop scrubbers use the natural alkalinity of seawater to clean the exhaust, while closed-loop ones most often utilize freshwater with an added alkaline chemical [31]. Hybrid scrubbers can operate in both configurations, depending on the restrictions imposed over different sailing areas [32,33]. An important difference between open-loop and closed-loop operation is that for the former, large volumes of untreated wash water are released directly into the sea, while for the latter only smaller volumes of polluted bleed-off water are released from the system, and the majority of the pollutants in the wash water are handled in port facilities [34].
The number of scrubber installations on ships has been dramatically increasing since the introduction of the 0.5% global sulfur cap, from only 8 globally scrubber-equipped ships in 2008 to 313 in 2016, which further escalated to 4341 in 2020 [35]. Hence, it is imperative to characterize the emission performance of such emission control systems. To evaluate emissions downstream of scrubbers, a few studies have performed on-board measurements on ships equipped with scrubbers in real-world conditions [19,36,37,38,39], as well as on engines with scrubbers placed on test beds [40,41,42]. All three types of scrubbers have been tested in the literature: open-loop [37,43], closed-loop [36,40] and hybrid ones [44,45]. Exhaust was characterized for gases and particles both upstream and downstream of scrubbers in the mentioned literature studies, in order to compare emission levels and to evaluate scrubber performance. Winnes et al. (2020), Zhou et al. (2017), Santos et al. (2022) and Karjalainen et al. (2022) [36,40,41,43] also performed additional emission measurements of the same engine, utilizing low-sulfur fuel (the scrubber was deactivated). This allowed for a comparison of the emission effects of low-sulfur fuel with those observed downstream of the scrubber. Sampling has been conducted based on the ISO 8178 method [46] in several studies [15,47,48], but this method is not suitable when FSC is greater than around 0.8% [49]. Winnes et al. (2020) and Fridell & Salo, (2016) [36,37] measured the PN and the PSD both upstream and downstream of a scrubber and applied thermal treatment to the sample, using a TD, in order to vaporize volatile particles.
As demonstrated in the preceding section, there are only a handful of studies looking at scrubber emissions. Better understanding of emission performance downstream of scrubbers is of importance, in order to evaluate the effect of shipping on air quality and human health, in particular near populated areas. The levels and characteristics of particle emissions at the outlet of the scrubber depend both on engine operation and scrubber performance parameters [19]. Such parameters correspond to engine load [36], system type and age [45], sulfur restrictions in the geographical location of cruising (ECA/other particular regional restrictions or global IMO FSC) [33], wash-water alkalinity (seawater or added chemical) [32] and the specific operation of the scrubber by the ship crew, as well as to the combination of these parameters during actual sailing. Particles are expected to be captured by the scrubber’s seawater droplets and discharged into the sea, thereby reducing atmospheric emissions [13,37]. However, new particles can form downstream of the scrubber, primarily due to salt cores from seawater and sulfuric acid particles under high-sulfur and high-humidity conditions [19,41]. Our study aimed to investigate these specific mechanisms by examining the PSD both upstream and downstream of the open-loop scrubber and providing insights into the particulate contributions downstream of scrubbers.
This paper intends to contribute to our better understanding of scrubber effects by presenting the particulate and gaseous emissions of an actual vessel equipped with a slow-speed two-stroke engine and an open-loop scrubber during real-world operation over a 7-day measurement campaign. The objective was to collect real performance data, in order to feed emission and air pollution modelling tools with emission factors (EF) downstream of a scrubber both for open-seas operation and, especially, for operation near inhabited port regions.

2. Materials and Methods

2.1. Measurement Campaign

The on-board measurement campaign was performed on a 300 m long container vessel, between 16 and 24 November 2021, on a voyage from the port of Rotterdam, Netherlands to the port of Gebze, Turkey. The ship was built in 2002 and was equipped with a two-stroke slow-speed diesel (SSD) main engine (ME), with nominal power of 62 MW at 98 rpm that could transport 6160 twenty-foot-equivalent units (TEUs). The ship was also fitted with four medium-speed diesel (MSD) auxiliary engines (AEs) operating at a constant speed of 720 rpm, each producing 2900 kW at maximum power, to feed the different hoteling loads, especially when the ship was berthed at port and the ME was turned off. A summary of the main specifications of the vessel is presented in Table 1.
The ship sailed at an average speed of 18.4 knots during the cruising phase of the trip, similar to its indicated service speed, while the engine load over the same period was around 36%. The ship was mostly cruising in stable operating conditions, except for the final voyage segment, when the engine load was mostly transient, varying between 30% and 10%. The map on Figure S1 (left) illustrates the ship’s voyage along with the color rendering of the ME load (in %) and the speed over ground (SOG, in knots) ratio, designating the speed and load fluctuations throughout the voyage.
The ship was equipped with an open-loop exhaust gas cleaning system, in order to comply with the global 0.5% FSC cap and the stricter 0.1% FSC limit inside SECAs and ports, where fuel with high-sulfur content is used. The exhaust lines of both the ME and the AEs entered the same scrubber and exited on a common funnel. The physical dimensions of the scrubber tower were 13.8 m in height and 4.5 m in diameter. Three pumps for seawater feeding were used to maintain the necessary seawater flow inside the scrubber. The seawater flow rate ranged from 200 to 1200 m3/h, depending on the total exhaust flowrate that had to be cleaned. Along with the main scrubber unit and its components, a dedicated software package was also installed on the ship, from the scrubber manufacturer, to measure and monitor several parameters, including those required by regulations, i.e., the SO2/CO2 ratio in the exhaust, the pH and turbidity in the water effluent and the inlet and outlet exhaust temperatures.

2.2. Fuels

Three types of fuels were used on the ship’s ME during the on-board campaign. Two batches of HFO fuel (further called HFO1 and HFO2) were used, having FSCs of 2.64% and 2.45%, respectively, and one ULSFO (0.1% FSC). The ship started its voyage by using HFO1 and, after two days, on 18 November, the HFO2 was fed into the fuel system. In the final stage of the trip, on 23 November, the fuel was changed to ULSFO, when the full fuel transition from HFO2 to ULFSO lasted for 5 h. The map presented in Figure S1 (right) illustrates the geographical positions of the fuels used, as well as the two fuel changeover processes, from HFO1 to HFO2 and, finally, from HFO2 to ULSFO. One-liter fuel samples were collected from each fuel batch, as well as from the engine lubricant, for further laboratory analysis. The samples were analyzed for their chemical composition, including their metals and ash content.

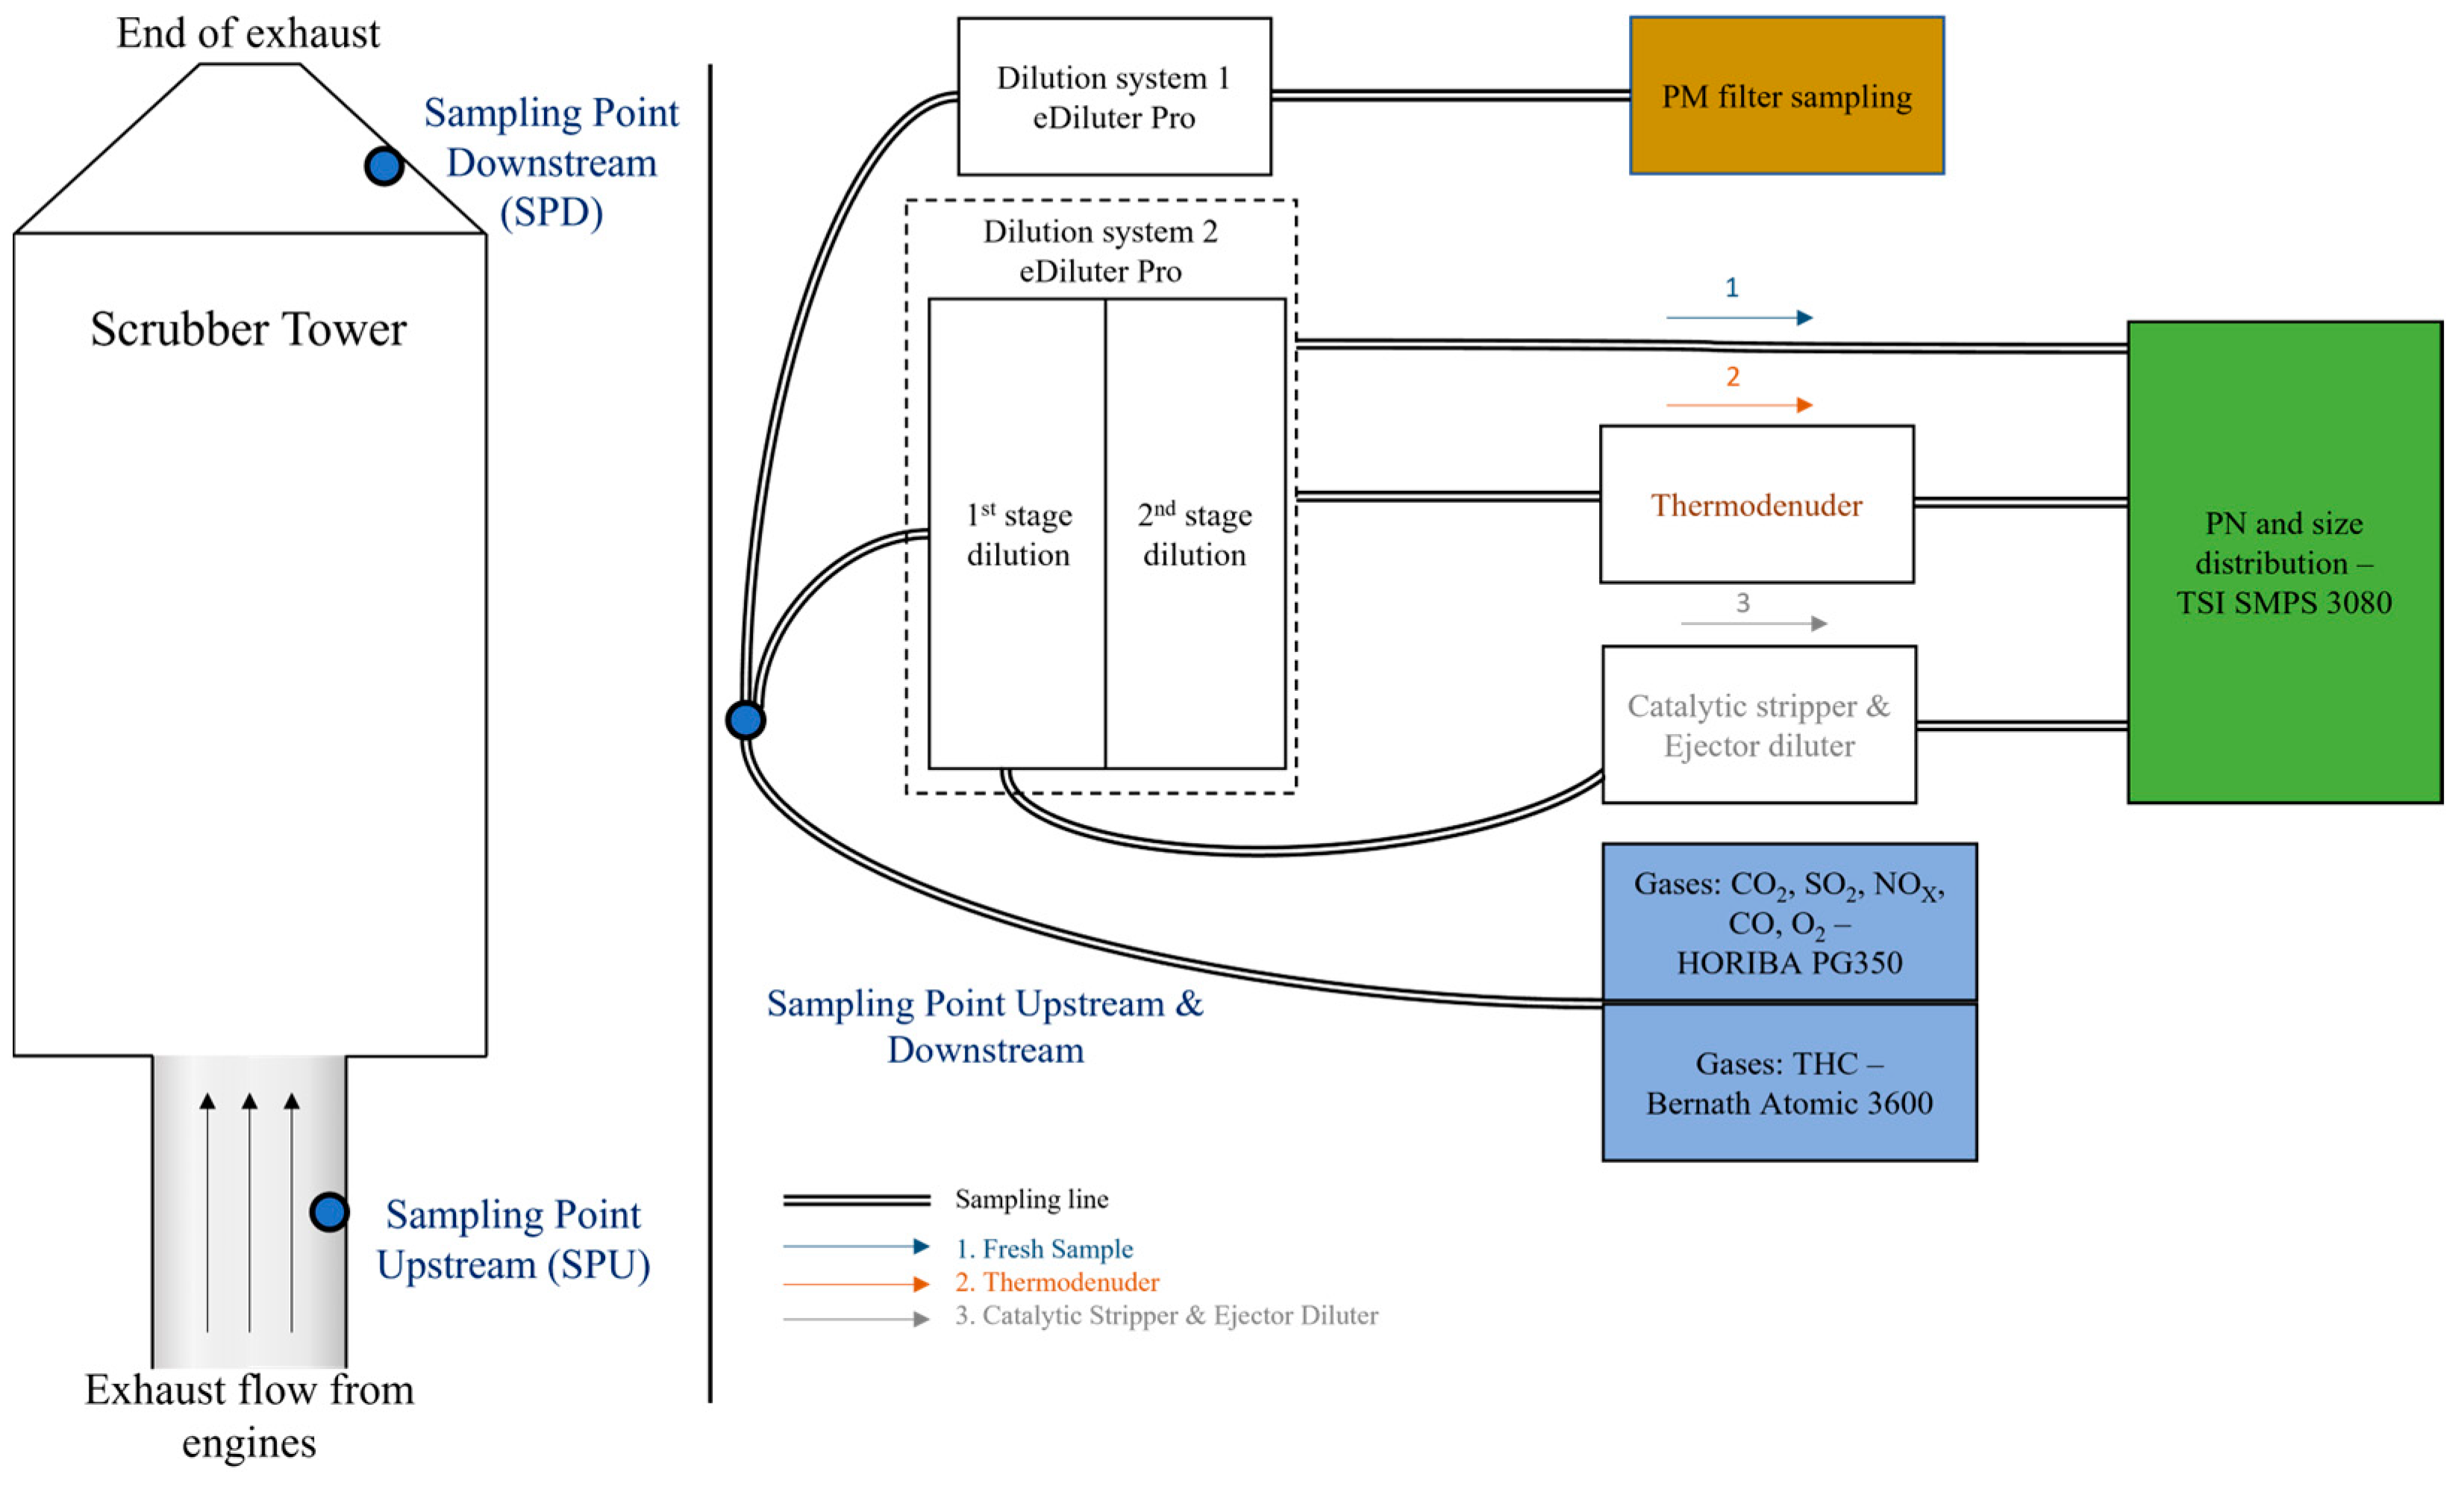
2.3. Testing and Sampling

The emitted particles were examined with a variety of sampling systems and conditions, as shown in Figure 1. Two different units of the same dilution system (eDiluter Pro, Dekati, Kangasala, Finland) were utilized for the sampling and dilution of the exhaust gas from the stack through an L-shaped probe. The eDiluter Pro is a two-stage dilution system operating on cleaned pressurized air, where the first stage is heated (150 °C or 250 °C), followed by the second non-heated stage [50]. The total dilution ratio (DR) after the second stage ranged between 25:1 and 100:1, based on the measurement requirements. The DR was monitored and verified with simultaneous CO2 concentration measurements in the stack and in the diluted sample. The first eDiluter Pro (dilution system 1) was used for collection of samples on PM filters and absorbents for off-line analyses: PM gravimetry and chemical characterization of the exhaust (particle speciation, polycyclic aromatic hydrocarbons (PAHs) and non-methane volatile organic compounds (NMVOC) and aldehydes). The results of the filter-based PM and chemical characterization will be presented in a future dedicated publication. The second eDiluter (dilution system 2) was connected to the online instrument for PN measurements.
Samples were extracted from two different locations, upstream and downstream of the scrubber tower, which were designated as sampling point upstream (SPU) and downstream (SPD), respectively, as illustrated in Figure 1. The sampling method followed, the dilution systems and the instrumentation were the same for the two sampling points. The eDiluter was connected to the sampling probes by a transfer line, which was insulated and heated at 150 °C. This was primarily important for the SPD, to avoid condensation of the wet and cold exhaust on the probe but was also implemented for the SPU. These transfer lines were spanned for 2.5 m and 1 m at the SPU and SPD, respectively. The SPU transfer line was longer than the one on the SPD, due to lack of suitable space and ease of accessibility. The diluted sample was led through a 12 m insulated copper line to the instrument room, where the sample was split and fed to the individual instruments by Tygon tubing. The instrument room provided an ideal setting for instrument installation, since it was air-conditioned and equally spanned, between the SPU and the SPD.
Gaseous emissions were measured in raw exhaust by a multi-gas analyzer (PG 350 E, Horiba, Kyoto, Japan) and by a flame ionization detector (FID) (Bernath Atomic 3006, SICK, Waldkirch, Germany) for THC (total hydrocarbons), which both operated with a 1 s time resolution. A non-dispersive infrared (NDIR) analyzer was utilized to measure SO2, CO2 and CO, and a chemiluminescence analyzer (CLA) was utilized for NOX in the Horiba system. The exhaust sample was extracted by a probe connected to a ceramic filter and then led to the instruments with a sampling line heated to 180 °C. The length of the heated sampling line was 15 m.
PSD and PN concentrations were measured with a scanning mobility particle sizer (SMPS 3080, TSI, Shoreview, MN, USA) comprising a differential mobility analyzer (DMA 3081, TSI, Shoreview, MN, USA) and a condensation particle counter (CPC 3776, TSI, Shoreview, MN, USA), covering a particle range from 5.9 to 225 nm. The instruments and the respective operation principles for gaseous and particulate pollutants are described in Table 2.
Three alternative sample conditioning schemes were studied, to characterize the total, i.e., volatile and non-volatile, and non-volatile particles alone with two different thermal treatment configurations, as indicated in Figure 1. The eDiluter Pro was used as the main dilution system for all three sampling schemes. In the first sampling scheme, the diluted sample was directly fed into the instruments after the second dilution stage of the eDiluter. This was denoted as the “Fresh” sample. In the second scheme, a thermodenuder (TD, Dekati, Kangasala, Finland) [51] was applied after the second dilution stage of the eDiluter. The TD comprised a heating stage at 300 °C, to vaporize the semi-volatile particles, and the vaporized material was then collected on the activated carbon wall surfaces. Hence, only non-volatile particles at 300 °C penetrated the TD. This will be henceforth referred to as the “Thermodenuder”. For the “Fresh” and “Thermodenuder” configurations, the sample was taken after the second dilution. The third dilution scheme utilized a slightly modified commercial catalytic stripper (CS) with oxidation, sulfur and nitrogen storage capabilities, identical to the one that was used by Amanatidis et al. (2018) [51]. The CS was designed to operate along with an ejector diluter (ED, Dekati, Kangasala, Finland) providing a DR of 12:1. To maintain a relatively high concentration, despite the additional dilution, the sample for the CS + ED was taken from the first dilution stage of the eDiluter at a nominal DR ranging between 5:1 and 10:1. The CS + ED was heated at 350 °C, to evaporate volatile and semi-volatile particles. This scheme was denoted as “catalytic stripper + ejector diluter”.
The three sampling configurations were selected to emphasize different particle treatment mechanisms, each attributed to distinct removal processes. The “Fresh” configuration focused solely on the heat treatment of the sampling lines [52]. The “TD” configuration utilized adsorption into active charcoal [53], while the “CS + ED” configuration emphasized oxidation [54]. The latter two are presumed to be more effective in removing volatile particles, since the extended length of the sampling lines may cause the re-volatilization of volatile particles in the case of thermal treatment alone. Additionally, it was also of interest to examine the CS’s behavior when reaching its maximum sulfur storage capacity. Comparing the three schemes with the relevant automotive legislation sampling requirements [55,56,57], the last configuration aligned more closely with commercial implementations (e.g., AVL particle counter, APC). Nevertheless, all three configurations were expected to meet the requirement of achieving >99% removal of ≥30 nm tetracontane (CH3(CH2)38CH3) particles.
Before commencing the campaign, the instruments were calibrated, to ensure the reliability of the measurements. The eDiluter instruments were brand new, so no additional calibration was necessary. The active carbon cartridges of the TD were replaced with new ones prior to use. The catalytic stripper was brand new, and the ejector diluter was properly cleaned prior to the measurements. The sampling lines were calibrated using the SMPS NanoScan (NanoScan SMPS 3910, TSI, Shoreview, MN, USA), and the induced losses were identified and included in the total system losses. Additionally, the CPC instrument never reached its limit during the measurements.
The eDiluter continuously reported its operational status and indicated any issues, which were checked daily throughout the campaign. The SMPS and CPC similarly displayed their status conditions. Whenever a problem was reported, such as a low butanol level, the root cause was identified and resolved promptly. No major issues arose during the campaign.
At the SPU, the raw exhaust from the engine was measured, while at the SPD, the scrubbed exhaust was collected. Therefore, the effect of the scrubber from the same engine with the use of HFO could be evaluated. Measurements were also performed for the ULSFO operation at the SPD but with the scrubber deactivated. So, in this case, we considered this to be an equivalent sampling condition to the SPU used for the HFO. Thus, the effect of the fuel (HFO and ULSFO) from the same engine could be assessed, and an emissions comparison between ULSFO and HFO combined with a scrubber could also be performed. Specifically, HFO1 was sampled at the SPD, HFO1 + HFO2 were sampled at the SPU under equivalent engine conditions and HFO2 was sampled at the SPD under the lower engine load. The measurement conditions, sampling systems and points are presented in Table S2.
Table 3 presents the summarized measurement durations (expressed in hours) for the gaseous pollutants, THC and PN concentrations at each sampling point. Notably, the majority of these measurements were taken downstream of the scrubber.
The PN concentrations and size distributions were corrected for losses, primarily occurring in the eDiluter, the rather long sampling copper transfer lines, the TD, the CS sampling lines and the CS + ED. The losses were considered per size range, based on the SMPS size range (Figure 2). For estimating sampling line losses, an SMPS NanoScan (NanoScan SMPS 3910, TSI, Shoreview, MN, USA) was utilized, which measured particles at various size ranges, initially at a position downstream of the eDiluter and then, after the 12 m transfer line, upstream of the SMPS. Therefore, particle losses produced in the sampling transfer lines could be assessed per size range. The losses induced from the eDiluter and TD were estimated based on the manufacturers’ technical recommendations [52,58]. The losses for the CS were estimated according to a similar oxidation catalyst utilized by Giechaskiel et al. (2009) [53].
As seen from Figure 2, the losses were found to increase for smaller particles. Specifically, particle losses of up to 40% from the sampling lines were observed, which were mainly attributed to diffusion, and which decreased with increasing particle diameter. In the sampling line connecting the first stage of the eDiluter to the CS and the line connecting the CS to the ED, the losses were estimated to be constant at 20% for the whole size range. These losses were attributed to thermophoresis, since these lines were not insulated and were exposed to room temperature while hot exhaust was passing through. The losses associated with the eDiluter primarily resulted from the turbulent flow and the high residence time of the sample in the system [59]. TD losses, mainly attributed to diffusion in the adsorber section, were reduced with the increase in particle diameter and remained constant at 25%. Losses of up to 14% were found for smaller particles in the CS, due to diffusion and thermophoresis, and they were minimized with increasing particle diameter [60]. In general, particle penetration losses increased for smaller particles, due to diffusion and thermal losses [51].

3. Results and Discussion

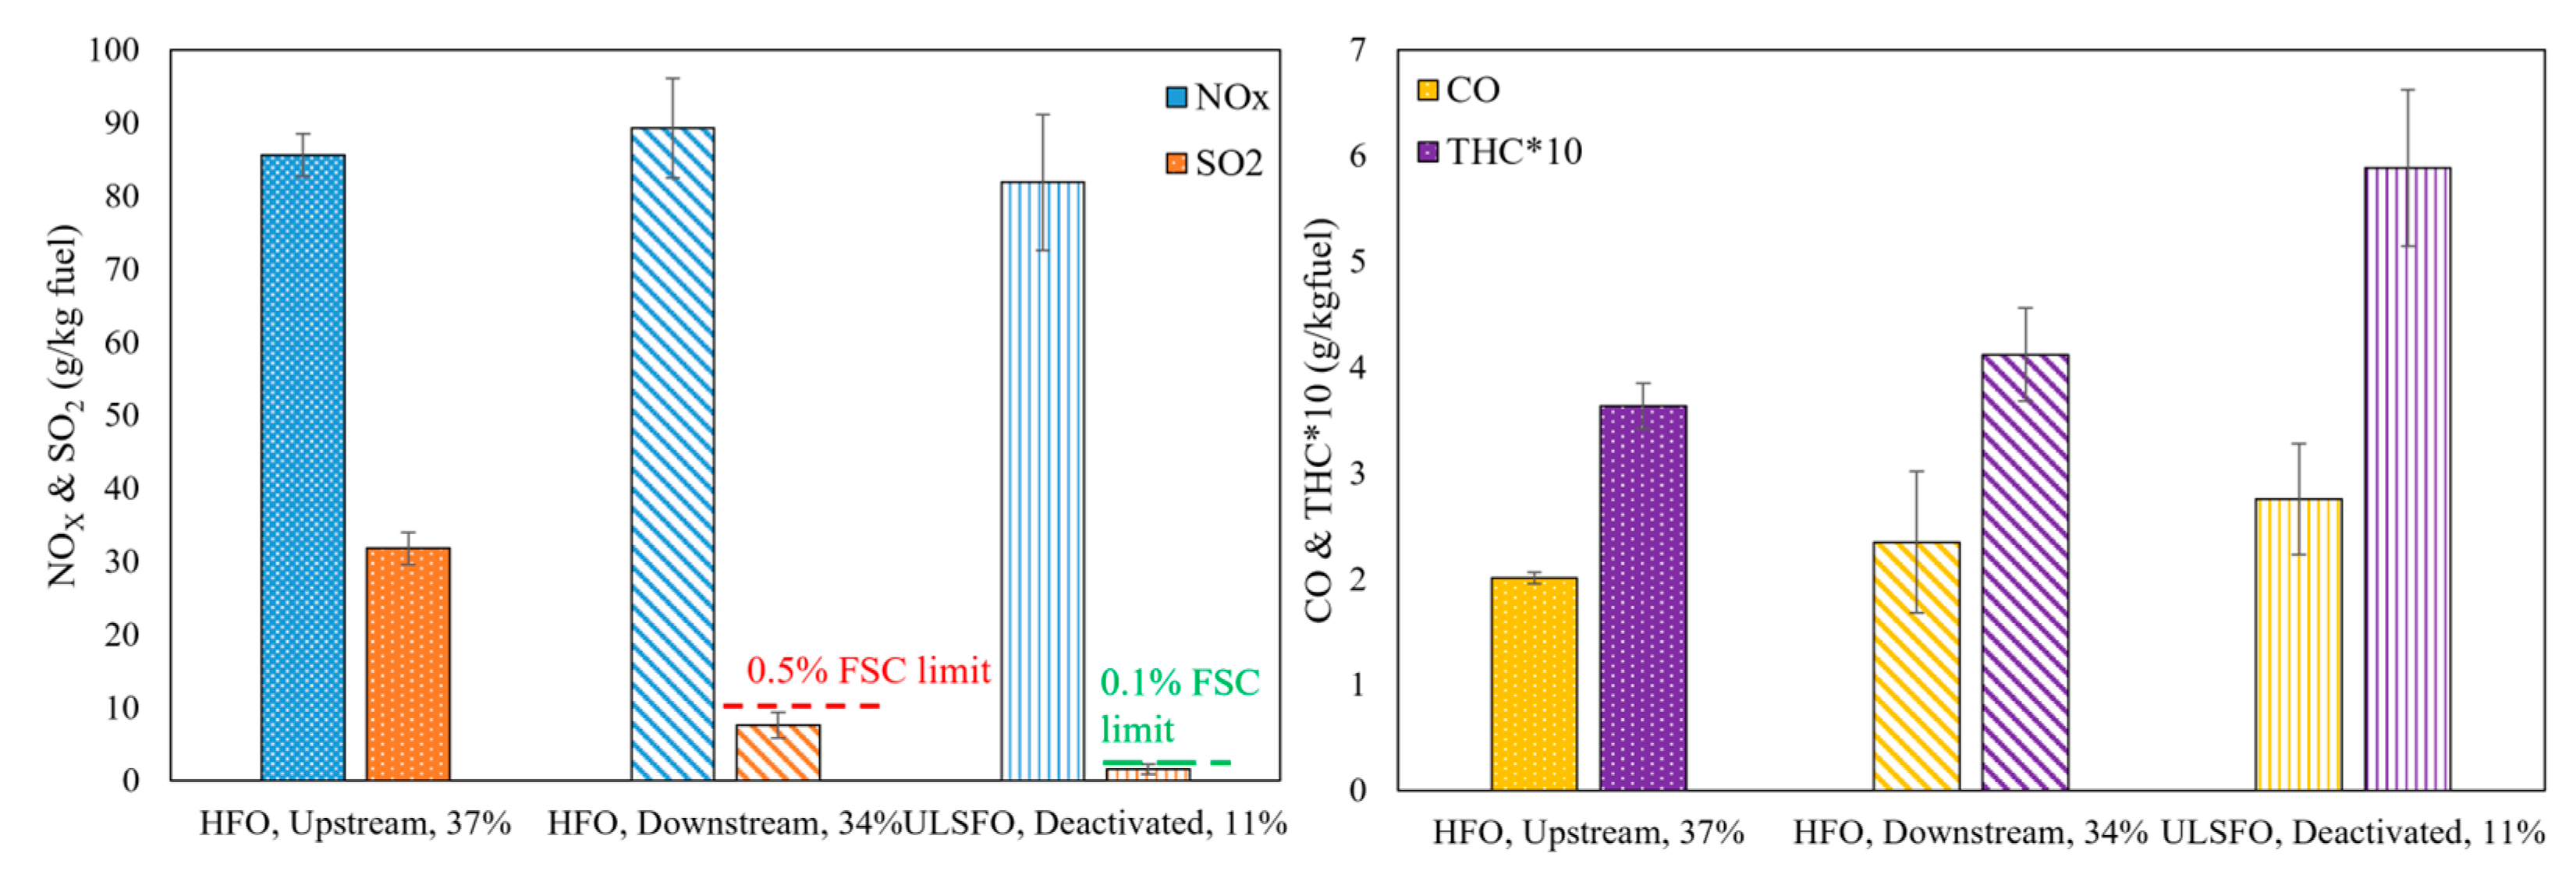
3.1. Overview of Gaseous Emissions

The SO2, NOX, CO and THC emission levels (in g/kg fuel) at the examined sampling points upstream and downstream of the scrubber and for the different fuel types are displayed in Figure 3, where the mean engine load for each sampling point is also indicated. These values correspond to the mean of the measured values with a 1 s resolution for all the examined periods at the respective sampling points. The emission levels from the individual sampling periods of the different sampling points are shown in Table S1, along with the engine load, type and batch of fuel and the specific fuel oil consumption (SFOC). The error bars in Figure 3 correspond to the standard deviation of the measurements for each sampling point.
As expected, much higher SO2 was measured upstream of the scrubber (31.8 g/kg fuel) than downstream (7.63 g/kg fuel), which shows that the scrubber decreased SO2 emissions by 75% at this setting, to a level complying with the 0.5% global sulfur limit (10 g/kg fuel equivalent—red dashed line). The scrubber was not operating at its full capacity, since the actual seawater flow rate ranged between 640–725 m3/h during the particular cruising phase. Use of the ULSFO resulted in the lowest overall SO2 levels, since this fuel had a sulfur content complying with the stricter 0.1% limit (2 g/kg fuel equivalent—green dashed line) and, generally, SO2 depends on the fuel quality [61]. The estimated FSC equivalences downstream of the scrubber were in the range of 0.39% to 0.45%, depending on the fuel batch (HFO1 and HFO2) and operating conditions. Lehtoranta et al. (2019), Winnes et al. (2020), Fridell & Salo, (2016), Ushakov et al. (2020), and Zhou et al. (2017) and Johnson et al. (2018) [5,36,37,38,40,45] reported scrubber efficiencies of up to 99% in SO2 reduction. In our study, the calculated SO2/CO2 ratios according to [62] were always lower than 21.7, which corresponds to the global 0.5% IMO FSC limit. This was also cross-checked with the scrubber monitoring equipment recordings that were provided by the vessel crew. As a result, since regulation compliance was accomplished, there was no need for the ship operator to further increase the scrubbing performance, which would, in turn, have increased the energy and fuel consumption.
The NOX levels on the g/kg fuel basis varied slightly (approximately ±4%, on average) between the different operating and sampling conditions. The scrubber operation led to higher NOX emission levels by 4.3% compared to the upstream and HFO sampling condition, while the ULSFO decreased NOX emissions by 4.3% compared to HFO engine-out. Grigoriadis et al. (2021) [63] showed that a lower engine load leads to higher NOX emissions, while fuel does not play a critical role in influencing NOX emissions, since NOX formation is mainly determined by the combustion setting parameters, rather than the fuel properties, for typical liquid marine fuels (residual and distillate). In our study, the highest (94.9 g/kg fuel) and the lowest (81.5 g/kg fuel) NOX emissions were measured downstream of the scrubber at 33.5% and 32% engine load (Table S1), respectively, while the ULSFO and deactivated scrubber condition, which was measured at an 11% engine load, resulted in slightly higher NOX emission levels (81.9 g/kg fuel) than the lowest observed. In Figure S2, the mean NOX emission levels are plotted against the engine load for the different sampling points. Based on our analysis, we believe that the fluctuations in NOX levels were primarily driven by slight variations in engine load rather than being attributable to the effects of the scrubber and fuel types.
Yang et al. (2021), Winnes et al. (2020) and Jeong et al. (2023) [19,36,42] observed minor or negligible differences in NOX upstream and downstream of a scrubber and concluded that any differences were related to the different engine loads. Fridell & Salo, (2016) [37] observed a 12% NOX reduction downstream of the scrubber compared to upstream, when measured on a two-stroke SSD engine at 51% engine load. Lehtoranta et al. (2019) [5] showed a 5% decrease in NOX emissions over the scrubber, supposing that probably NOX were transferred into the effluent. In principle, any reduction over the scrubber means that NOX is captured in the droplets of the scrubbing water and further transferred either to the effluent or to the atmosphere [5]. According to our findings, the scrubber discharged less than 12% of NOX into the effluent, demonstrating its compliance with the IMO requirements. Combining our emission observations with the existing knowledge from the literature, scrubber impact on NOX is not well-established, but it is considered negligible when technologies safeguarding NOX Tier III regulation compliance are assessed.
The CO and THC emission levels appeared to rise with engine load decrease. Downstream of the scrubber and when using ULSFO, higher levels of CO and THC were found in comparison to the measurements taken upstream of the scrubber. It is noteworthy that the engine load differed between the sampling points (Figure 3 and Table S1). Our understanding is that these pollutants are mainly combustion-related [61] with limited solubility in water and, therefore, the scrubber and fuel properties did not affect their emissions quantity. Engine load emerged as the dominant parameter affecting these pollutants, as evidenced by the substantial increase in CO and THC emission levels at lower loads. Specifically, at the lowest engine load (11%), CO emissions rose by 37% and THC emissions surged by 62% compared to the levels observed at a higher engine load (37%). Similar trends with engine load for CO and THC were also observed by [63]. The mean CO and THC emission levels for the different sampling points are displayed in Figure S2.
Lehtoranta et al. (2019) and Winnes et al. (2020) [5,36] reported a 20% CO reduction downstream of the scrubber on four-stroke MSD engines, while Yang et al. (2021) [19] did not find any statistically significant differences in CO EFs, when comparing emissions upstream and downstream of the scrubber on a two-stroke engine. Fridell & Salo, (2016) [37] showed a 200% increase in CO downstream of the scrubber, without providing a specific reason for that. Compared to our results, where we found a 13% increase of THC downstream of the scrubber, Winnes et al. (2020) [36] measured a THC reduction over the scrubber of 20% to 50%, depending on the engine load, while Fridell & Salo, (2016) [37] found only a slight decrease. In our case, the scrubber seems to have adversely impacted CO and THC emissions, but, since the engine load was not constant between the upstream- and downstream-of-scrubber measurements, the impact of the scrubber could not be reliably evaluated. Scrubber operation creates backpressure, which, in turn, deteriorates engine efficiency and increases emissions [64]. In our study, we could not identify the effect of pressure drop because measurements both upstream and downstream of the scrubber were conducted with the scrubber in operation. The literature findings in conjunction with our observations are controversial, in terms of scrubber impact on CO and THC, considering also experimental uncertainties in such sampling activities. Theoretically, the scrubber should have had zero impact on these pollutants, but more evidence is still required in this direction, and also to exclude the possibility of any measurement artefacts, especially downstream of the scrubber.
The high error bars depicted for the NOX, CO and THC for measurements conducted downstream of the scrubber were related to the high number of measurements performed over different operating conditions, compared to the upstream and ULSFO measurements, as detailed in Table 3. The scrubber operation may also have affected the measurement repeatability, considering that the properties of the incoming flow water may also have changed during the operation. Since these pollutants are combustion-related [61,63], operating conditions and, mainly, engine load variance are the critical parameters that affect their emission levels.

3.2. Particulate Matter

3.2.1. Scrubber Effect

The effect of the scrubber and fuels on PN levels and the corresponding PSD are demonstrated in Figure 4. These measurements were conducted for the so-called “Fresh” sample conditions and, therefore, the total particles were obtained, including volatile and non-volatile ones. The mean PN levels and size distributions are presented in each case, together with the individual PSD along with the corresponding uncertainty range that corresponded to one standard deviation on each side of the mean value. The individual PN levels together with the fuel batch, mean load of the main engine, SFOC and sampling conditions are found in Table S2.
The PSD upstream of the scrubber appeared trimodal, with one peak at 6 nm, a second at 14 nm and a third, larger peak at 76 nm, while the PSD downstream of the scrubber was quadrimodal, with the first peak at 6 nm, a second peak at 10 nm, a third, larger one at 31 nm and the fourth one at 66 nm (Figure 4a). The PN level downstream of the scrubber was found to be higher than upstream of the scrubber by 150% (Figure 4b). The soot mode, which represented the non-volatile carbonaceous part of the particles [51], was found at the same level, both in terms of PN level and PSD in locations upstream and downstream of the scrubber. Soot emissions are mainly attributable to engine performance, combustion quality and fuel type [49]. The particles downstream of the scrubber were dominated by nanoparticles in the size range between 10 and 40 nm that were formed from nucleation of volatized fuel ash species [49,65], as seen in Figure 4a. Hot exhaust of approximately 300 °C, containing high amounts of SO2 and SO3, was inserted into the scrubber, where high humidity conditions existed, and rapidly cooled down to 40 °C, due to the presence of seawater. In such conditions, SO3 reacts with water vapor molecules, to form sulfuric acid nucleation particles [19,41]. These nuclei-sized sulfuric acid particles are not captured by coalescence with the seawater droplets and, therefore, a new high-concentration particle mode is generated downstream of the scrubber. Salt cores, originating from seawater, are formed through the evaporation of water in the presence of hot exhaust gases. Thus, the increased PN downstream of the scrubber (Figure 4b) was probably due to the enhanced nucleation mode that seemed to be produced by the scrubber, through nucleation or condensation on smaller particles. The increased PN levels downstream of the scrubber were also enhanced by the fact that the scrubber was inefficient in removing soot mode particles:
S O 3 + H 2 O = H 2 S O 4
On the right side of Figure 4, the mean PSD upstream and downstream of the scrubber, as well as with ULSFO use, of Figure 4a are separately demonstrated, along with the corresponding uncertainty ranges, expressed by one standard deviation. The variance was rather high, due to the utilization of two different HFO batches and variable DRs during the campaign, for both the upstream- and downstream-of-the-scrubber measurements, as well as the different dilution temperatures upstream of the scrubber and the variable engine loads when downstream of the scrubber. In the ULSFO case, the ship was cruising at a slow speed (about 12 knots) and the engine load was low and slightly variable (10%), which created additional measurement uncertainty.
Fridell & Salo, (2016) [37] observed a bimodal PSD forming upstream of the scrubber, with a first high peak at approximately 10 nm and a second lower one at about 50 nm, and a unimodal PSD downstream of the scrubber, with a peak at around 50 nm. The sampling scheme comprised a dilution system providing a DR of 64:1 to 109:1. The PN emission levels over the scrubber were reduced by 84% compared to engine-out, when HFO with 2.3% FSC was used. Kuittinen et al. (2021) [13] measured a bimodal PSD upstream of the scrubber, which was dominated by ultrafine particles in the size range of 20 to 40 nm and a lower-concentration soot mode between 30 and 100 nm. They also reported that the scrubber reduced particle concentrations in the nucleation mode, mainly due to volatile species of smaller particles, and increased soot mode particles in the size range over 50 nm. The sampling system utilized a porous tube diluter (PTD) along with an ejector diluter with a nominal DR of 12:1 and 8:1, respectively, and an SMPS for PSD measurements with a size range of 10–414 nm. A 92% PN reduction was observed when utilizing a scrubber with 0.7% FSC HFO. A unimodal PSD at about 50 nm was found by Santos et al. (2022) [41] upstream of the scrubber, while a bimodal PSD with a first peak at about 20 nm and a second one at 60 nm downstream of the scrubber was identified, due to the formation of primary-mode sulfuric acid particles induced by the scrubber. This research team used a two-stage dilution system at a ratio between 60:1 and 126:1 and an SMPS measuring particles at a range of 15.1 to 661.2 nm. Winnes et al. (2020) [36] reported significant decreases (around 80%) of total PN over the scrubber.
Typically, PSD upstream and downstream of scrubbers, as reported in the previously mentioned literature sources, has display either unimodal or bimodal characteristics. In contrast, our findings revealed trimodal PSD upstream of the scrubber and quadrimodal PSD downstream. In studies by [13,37], scrubbers were found to reduce particles in the nucleation mode. However, in our research, as well as in the results presented by [41], an opposing trend was observed, primarily due to the formation of new particles. Consequently, this disparity resulted in decreased and increased downstream-of-the-scrubber PN emission levels for the former and latter sources, respectively.
The integration of the literature findings with our own experimental observations reveals a certain level of controversy regarding the impact of scrubbers on PN emissions. PN emission levels and PSD discrepancies between our results and the existing literature findings may be attributed to a multitude of factors. These may include variations in engine types and specifications, engine load operations, engine age, the type of fuel utilized and its respective sulfur content. Additionally, the target FSC equivalent, based on the area of sailing, can also contribute to differences. Other relevant factors encompass wash-water alkalinity, engine and scrubber wear and the specific operation of the scrubber by the crew, particularly in terms of controlling the seawater flow rate. Such a complex interplay of factors underscores the necessity for comprehensive research to ensure a holistic understanding of scrubber influences on PN emissions and PSD in various operating conditions.
Another critical element contributing to discrepancies between research studies is the variability in the sampling schemes and conditions and instrumentations employed. The choice of sampling locations, sampling lines and their length, the proper heat line application and DR and dilution temperature can significantly influence the obtained results. To ensure more consistent and reliable data, it is crucial for future research to standardize particle sampling methodologies and adopt advanced, precise instrumentation in PN emission experiments.

3.2.2. Fuel Effect

The ULSFO led to a bimodal PSD with a first peak at 6 nm and a second, higher peak at 53 nm. The lowest PN levels were observed for ULSFO use, reduced by 55% compared to engine-out (Figure 4b). This is consistent with the findings of Lack et al. (2009) [66], who observed a higher number of smaller-sized particles when using high-sulfur fuels compared to low-sulfur fuels. The use of ULSFO changed the PSD compared to upstream of the scrubber and HFO, moving nucleation and soot mode to smaller particle diameters (Figure 4a). This was in contrast to the findings of Ntziachristos et al. (2016) [49], who observed similar PSD between HFO and low-sulfur fuel oil (LSFO) on a four-stroke engine tested at 25% load. Low-sulfur fuels or MGO produced 70%-lower PN levels compared to downstream of the scrubber under the same engine conditions, as shown by [43]. This was similar to our study, where we found an 82% decrease of PN with ULSFO, compared to that downstream of the scrubber.

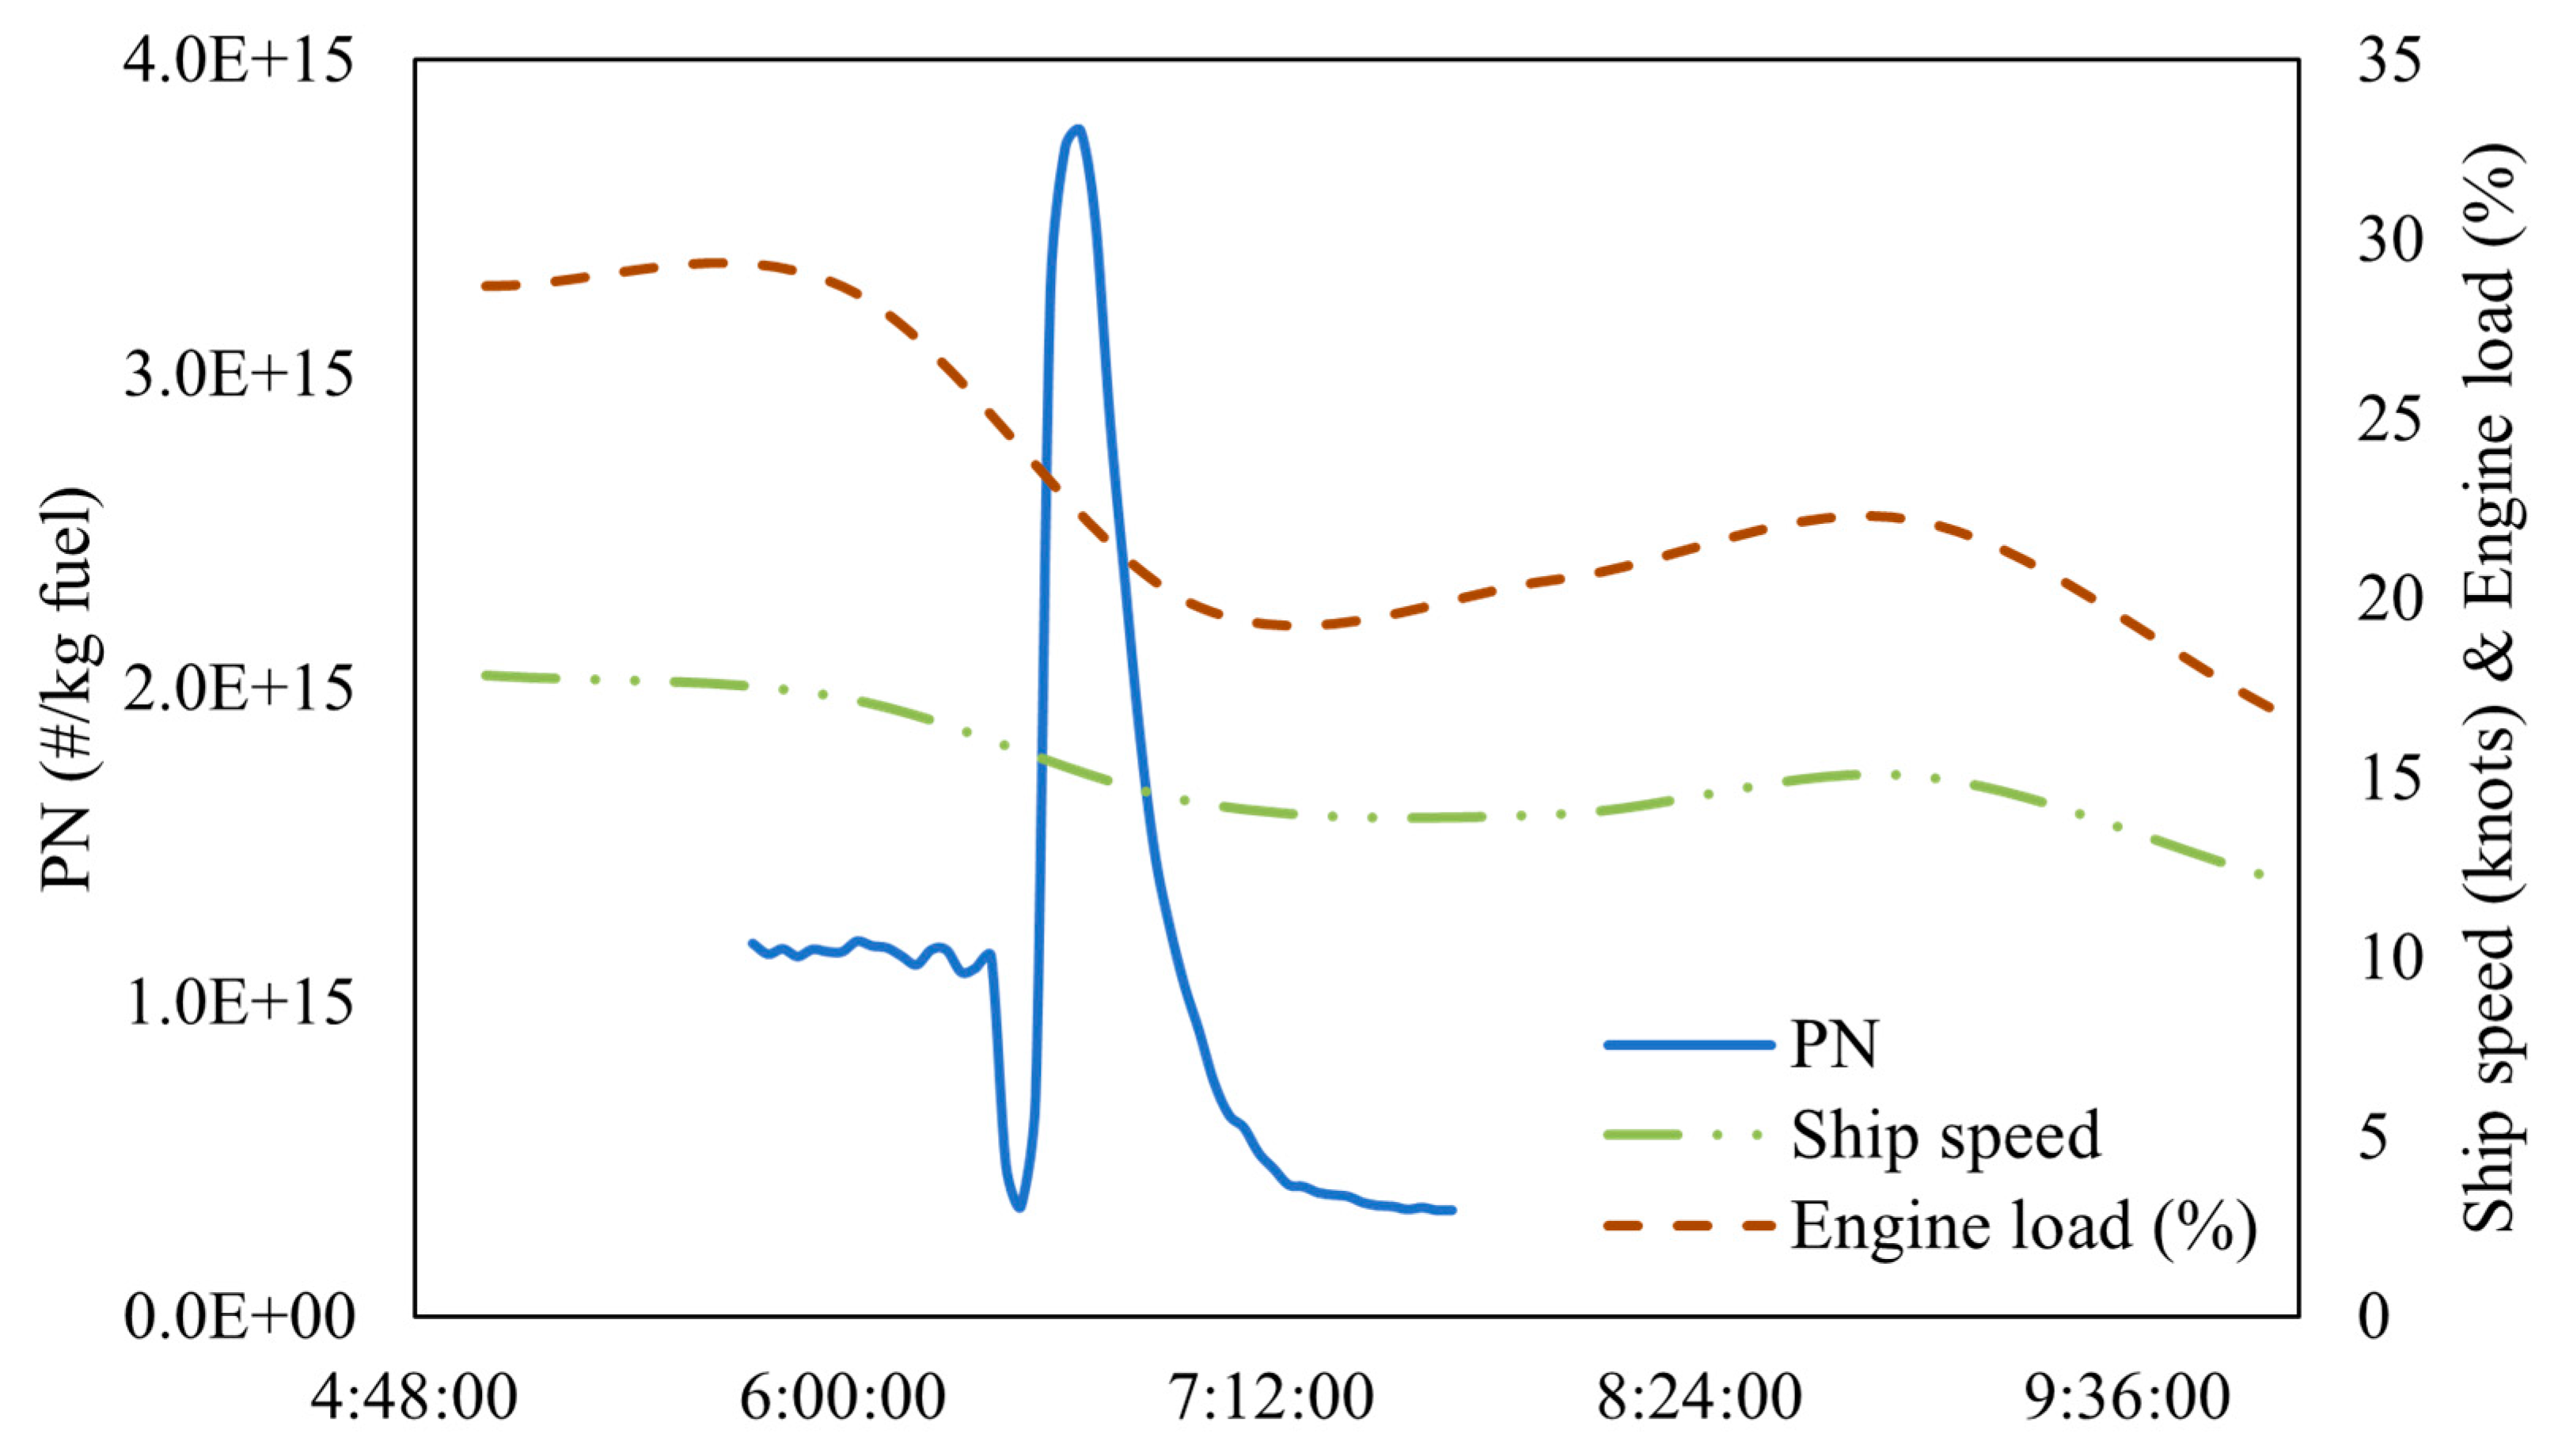
3.2.3. Fuel Transition

The transition from HFO2 to ULSFO took place as the ship approached the Turkish territorial waters, due to restrictions on the use of open-loop systems [33]. The PN concentrations were also measured during the fuel transition process and the mean PN emission level is presented in Table S2. The mean fuel transition PN emission level was of the same magnitude as most of the downstream scrubber PN levels and higher than the ULSFO one. In Figure 5, the PN emission levels at the fuel transition phase are presented over time for the ship’s trip, along with the ship speed (in knots) and the engine load (in %).
During the fuel changeover process, both HFO and ULSFO were supplied to the ME, with decreasing HFO flow and increasing ULSFO, in parallel with the scrubber operation, until the HFO in the fuel pipes was completely consumed. The ship decreased its speed at this stage, from 17 to 12 knots, and the engine load fluctuated between 28% and 17%, further contributing to the transient effect. Based on the data provided from the ship operator, the fuel change procedure lasted for 5 h, with this time being required for the ULSFO to be stabilized for combustion in the ME. In Figure 5, only two hours of the PN fuel transition time series are depicted, due to malfunction of the eDiluter heater and, therefore, the last three hours of measurement data were considered invalid.

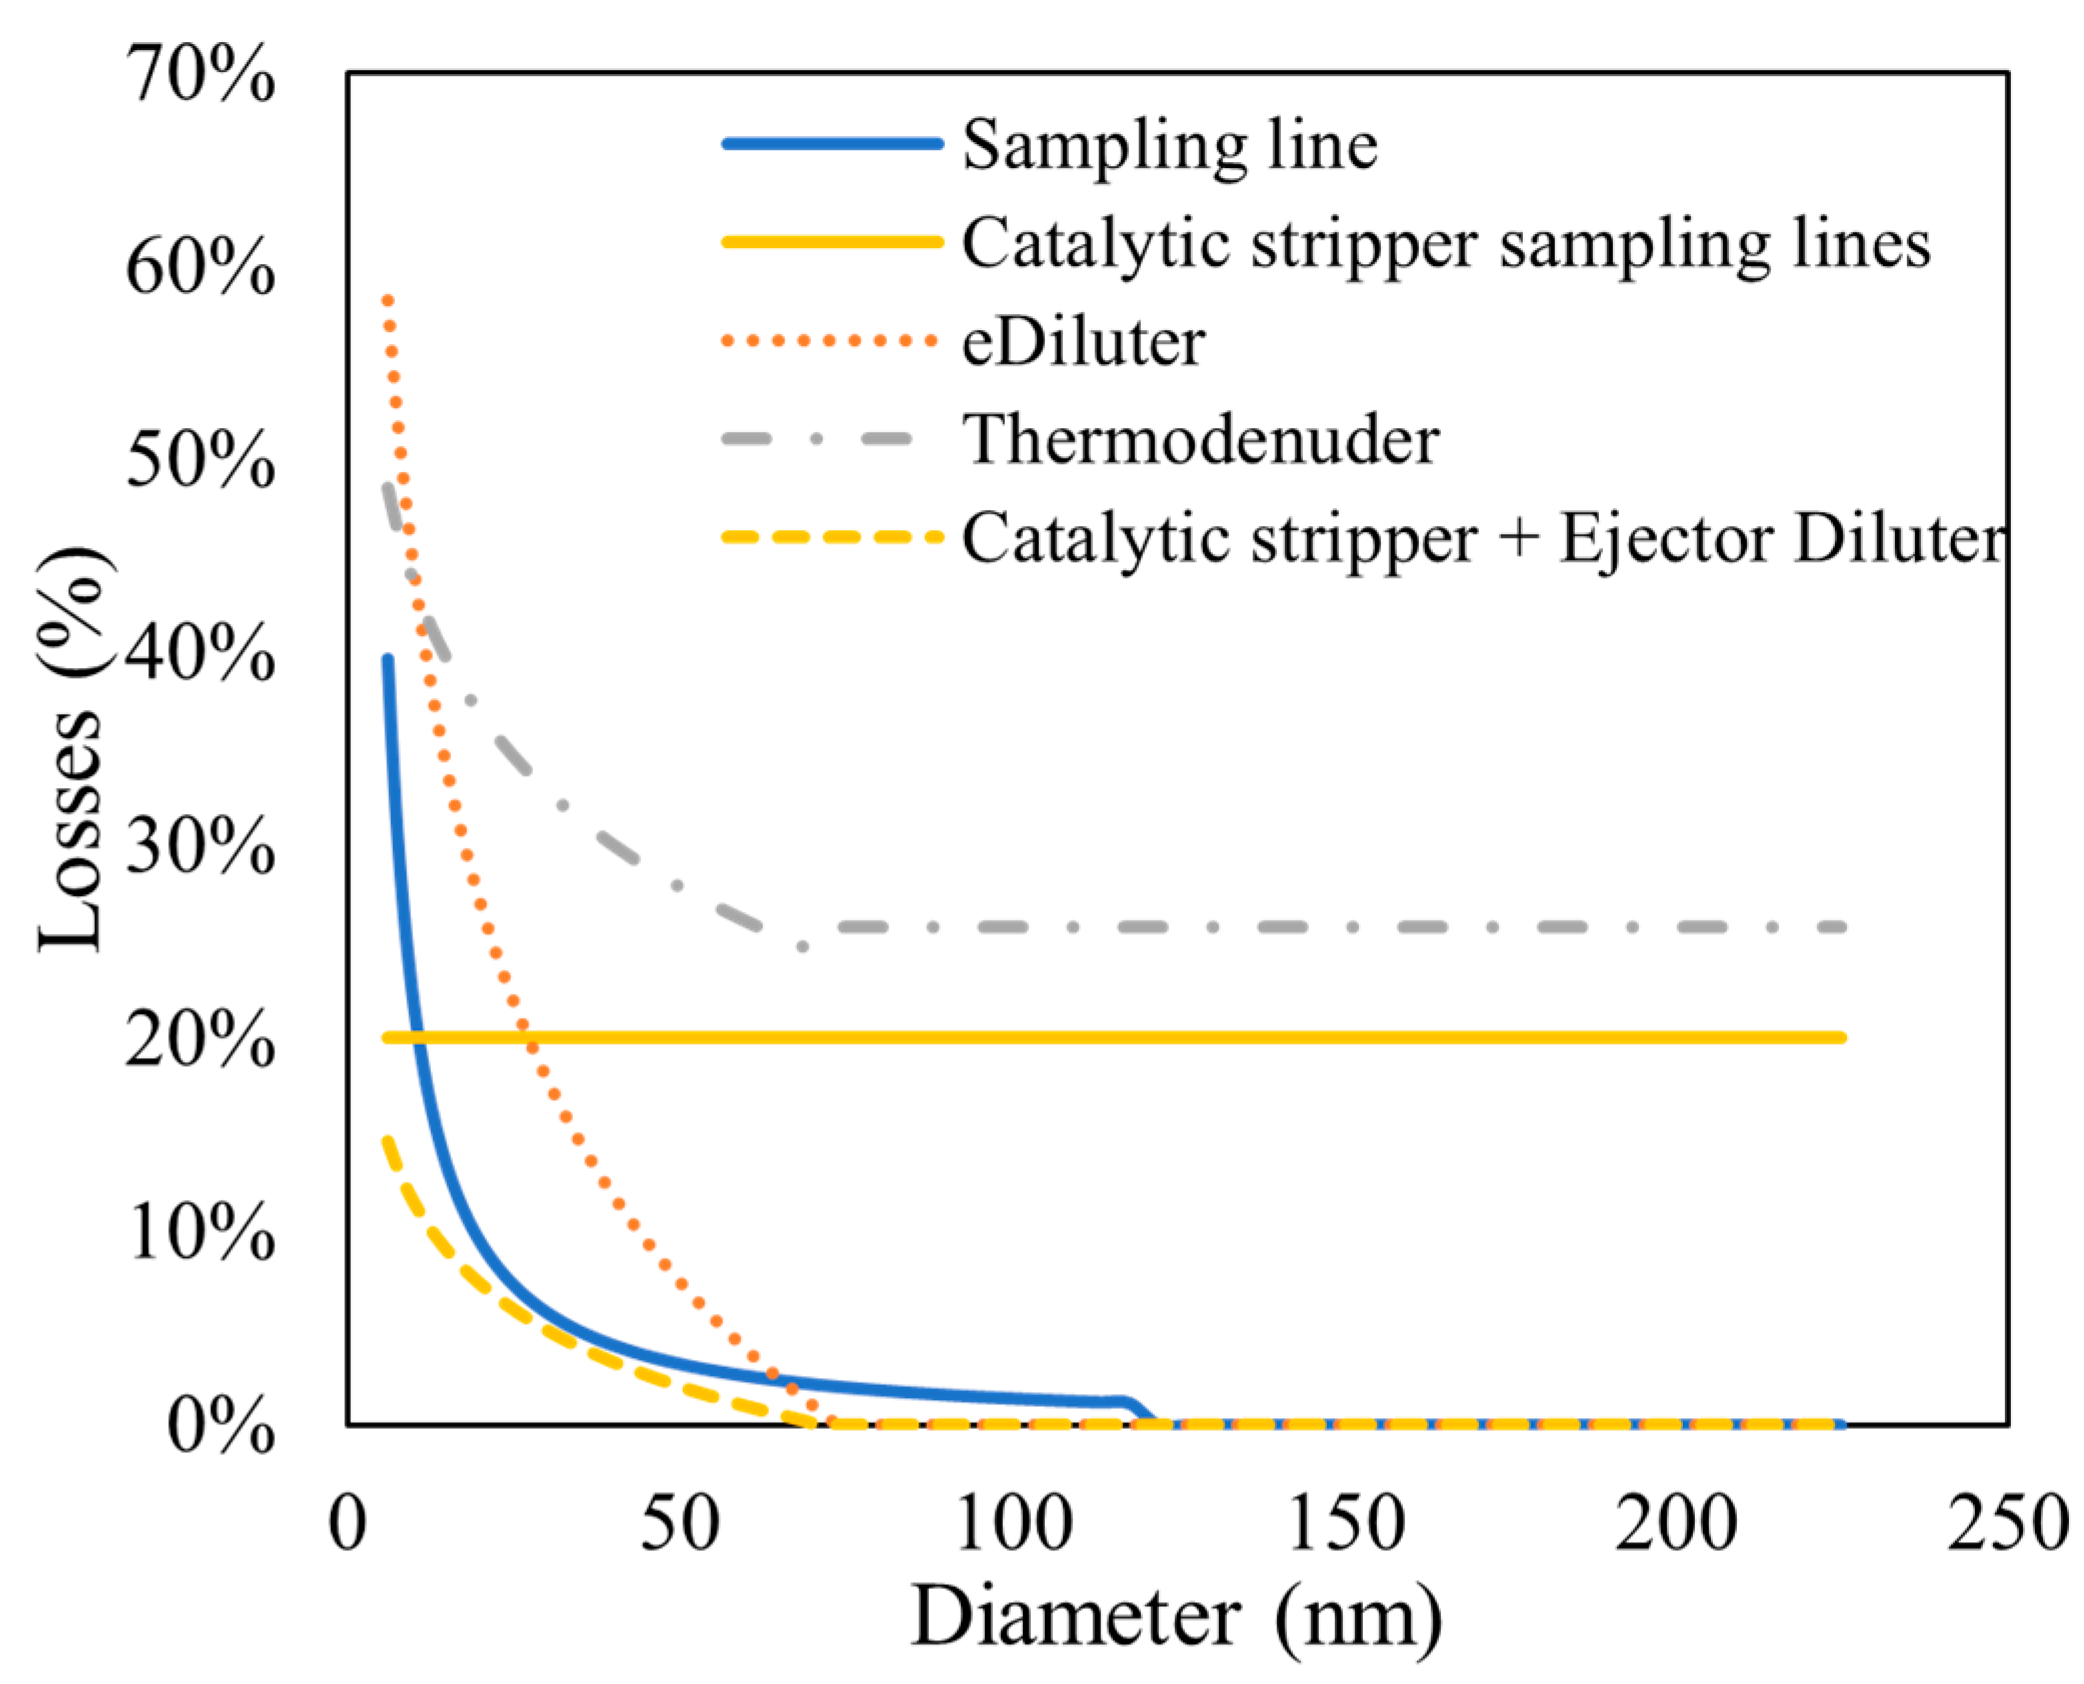
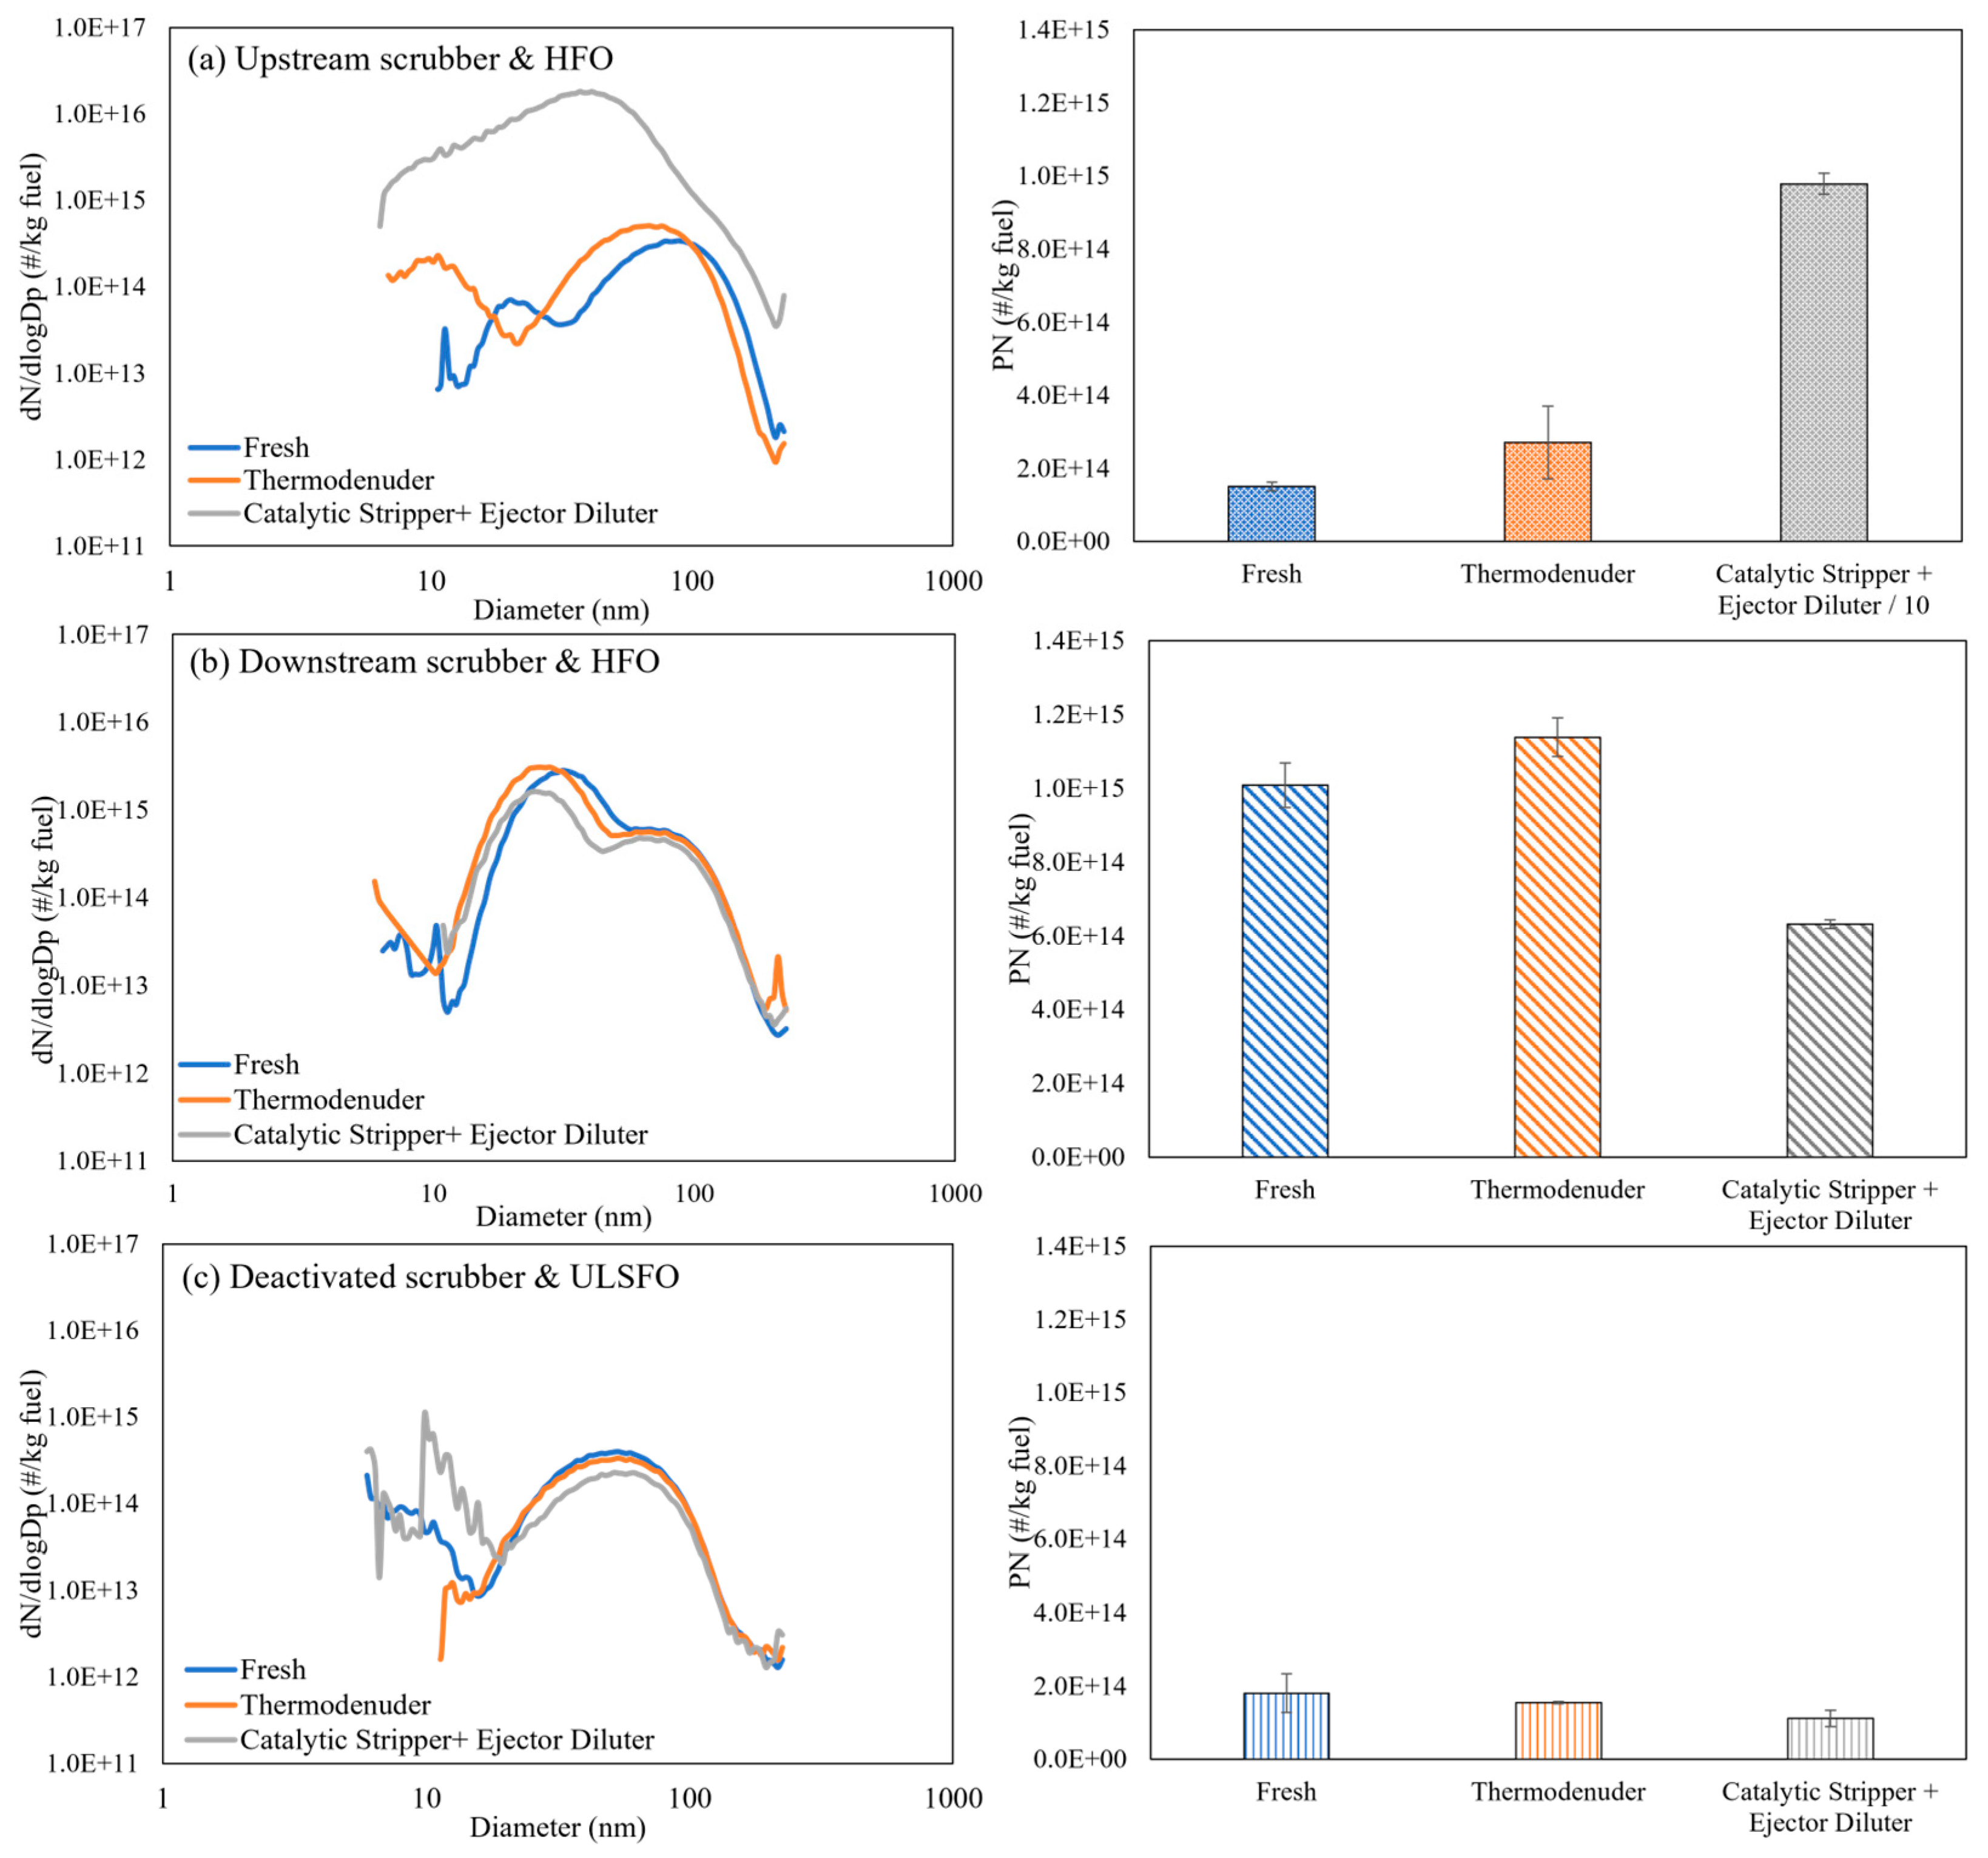
3.2.4. Effects of Sample Conditioning

The effects of sample conditioning on the PSD and PN emission levels are depicted in Figure 6. Measurements were conducted on the “Fresh” samples taken directly from the primary eDiluter, as well as with the utilization of TD and CS + ED removing volatiles. The individual PN levels, together with fuel type, sampling point, layout scheme, sampling conditions (DR and dilution temperature), mean load of the main engine and SFOC, are found in Table S2.
The PSD of the “Fresh” sample upstream of the scrubber was trimodal, with a first peak at 11 nm, a second one at 20 nm and a third one of higher concentration at 88 nm (Figure 6a). The use of the TD, for samples collected upstream of the scrubber, shifted the PSD to smaller particles and the distribution was altered to bimodal, with a first mode at 10.5 nm and the second, higher peak at 68.5 nm. The CS + ED completely changed the PSD to unimodal, with a peak at 41 nm. The TD actually increased the PN by 80% compared with the “Fresh” sample, most probably due to the formation of artifact particles in the nucleation mode. The soot mode with the TD remained at the same level compared to “Fresh”, both in terms of concentration and PSD, with only a slight shift in size. This artifact creation of particles was clearly described by [51], who observed re-nucleation of smaller particles, starting from 5 nm downstream of a similar TD, when the temperature exceeded a certain threshold (approximately 250 °C) under high-sulfur conditions (>200 ppbv).
Use of a CS + ED to isolate non-volatile particles upstream of the scrubber resulted in the PN concentration increasing 65-fold compared to the “Fresh” sample. Amanatidis et al. (2013) [54] showed that in the presence of oxygen and high-sulfur conditions, such as combustion of marine HFO, sulfur is stored in the form of sulfates in the CS’s sulfur trap. They also observed generation of sulfate particles, which grew from 5 nm to 50 nm in a short time period, when exposed to high-sulfur conditions. Particle generation also depends on the CS geometry, design and storage capabilities. In our case, the increased SO2 concentration upstream of the scrubber, due to the utilization of fuels with high FSCs, accompanied by high quantities of NOX (approximately 1500 ppm), reduced the adsorbent ability of the CS and, therefore, sulfate and nitrate particles were generated. Specifically, we believe that the CS adsorbent material (Barium oxide, BaO) had reached its nitrogen and sulfur storage capacity during the first CS measurement, downstream of the scrubber, which lasted about 2 h. We then observed that the PN concentration was increased by 2000% in the first 5 min of the second CS testing, upstream of the scrubber, meaning that the CS + ED configuration was creating new particles.
Use of a TD downstream of the scrubber produced a trimodal PSD (Figure 6b), similar to the “Fresh” sample, but with a slight shift of each mode to smaller particles. The TD PN was higher than the “Fresh” sample by 12%, mainly due to re-nucleation of particles in the size range between 10–30 nm when exposed to high-sulfur conditions [51]. Even downstream of the scrubber, sulfur was found in increased concentrations of various sulfur-based components (SO2, SO3, sulfates), compared to the use of low-sulfur fuels, since the scrubber could not completely abate the sulfur particle species [19]. Moreover, the high operating temperature of 300 °C probably decreased the adsorption efficiency of the TD and promoted the onset of re-nucleation, due to the reduction of the residence time of the species in the low temperature region of the TD that allowed adsorption in the denuding section [51]. Unfortunately, no measurements at a lower TD temperature were available, to compare findings.
The PSD downstream of the scrubber, using the CS + ED, displayed a bimodal pattern, with a higher first peak at 20 nm and a lower second peak at 70 nm, shifting the PSD to smaller particles. The respective CS + ED PN emission level was 37% lower compared to the “Fresh” sample one, meaning that the CS + ED eliminated the majority of volatile and semi-volatile particles downstream of the scrubber.
Winnes et al. (2020) and Fridell & Salo, (2016) [36,37] used a TD, which heated the sample at 300 °C, to vaporize volatile particles, when they measured upstream and downstream of a scrubber with HFO. Fridell & Salo, (2016) [37] reported a bimodal PSD upstream of the scrubber, characterized by a primary peak at 15 nm and a second, higher peak at 50 nm. Similarly, downstream of the scrubber, the PSD was also bimodal, featuring a first peak at 20 nm and a second, higher peak at 50 nm. The utilization of the TD was found to reduce both upstream- and downstream-of-the-scrubber PN emission levels when compared to “Fresh” samples. Winnes et al. (2020) [36] showed that upstream-of-scrubber PSD was bimodal for all engine loads tested (32%, 49%, 76%), with a first peak at smaller than 10 nm particles and a second, higher peak at 50 nm, but with higher loads producing higher PN concentrations. Downstream of the scrubber, the PSD seemed to be bimodal and trimodal at higher (76%) and lower (48%) engine load, respectively, but with higher concentrations compared to upstream ones [36]. For the downstream scrubber case, the effect of the TD on the reduction of volatiles was unclear, since concentrations were comparable before and after the TD. In both the literature sources, the implementation of a TD upstream of the scrubber appeared highly effective in removing the majority of volatiles, up to 85%, in contrast to our study, where formation of particles was observed. Downstream of the scrubber, the TD had a negligible impact on PN concentrations, suggesting that the majority of the volatiles had been removed by the scrubber, as reported in both the aforementioned literature sources. In our study, we noted an increase in concentration, attributed to the re-nucleation of particles within the size range of 10 to 30 nm.
In the ULSFO and deactivated scrubber case (Figure 6c), the TD showed a bimodal PSD, with a first peak at 6 nm and a second one at 53 nm, while the CS + ED was trimodal, with a first peak at 6 nm, a second one at 10 nm and a third one at 51 nm. Even for the ULSFO with much less FSC (0.1%), the CS + ED induced the generation of new artifact particles in the size range of 10 to 20 nm. The PN levels with the TD and CS + ED were reduced by 14% and 38%, respectively, compared to the “Fresh” sample PN. This means that the volatiles were diminished by the TD and were further eliminated by the CS + ED, due to the higher heating temperature (350 °C). The high error bars for the “Fresh” sample and the CS + ED with ULSFO were related to the unstable sailing conditions of the ship, which was slow-steaming (12 knots), and the engine was working at an extremely low engine load (10%) during these measurements, thereby affecting the PSD and PN emission levels.
Both thermal treatment systems generated new particles under high-sulfur conditions. The TD created artifact particles in the smaller size range both upstream and downstream of the scrubber, although the PN levels remained comparable to the “Fresh” sample. The CS + ED system, when used upstream of the scrubber with HFO, formed particles, due to the stored sulfur and nitrogen in the instrument’s sulfur trap, resulting in higher PN levels compared to the “Fresh” sample. Downstream of the scrubber, the CS + ED system effectively evaporated the volatiles. Generally, the widely acknowledged and commonly employed measurement techniques for separating volatiles and non-volatile particles in road vehicle applications may not be as effective in ships using HFO. Especially, downstream of the scrubber, where high-humidity conditions exist, PSD should be interpreted carefully, as we have identified significant particle artifact formation in several cases. Moreover, different TD and CS systems may exhibit different performance, so our results may not hold true for every commercial system available.

4. Policy Implications

This analysis underscores the need to thoroughly assess the environmental performance of scrubbers, in terms of both gaseous and particulate pollutants, to accurately estimate shipping pollution impacts. Scrubbers have demonstrated the ability to decrease SO₂ emissions to compliant levels, including the stricter 0.1% FSC threshold. However, a significant drawback identified in our analysis is the increased PN levels resulting from nanoparticle emissions, which can have severe human health effects and, consequently, increase external costs [67]. It is important to note that our analysis was based on the results of a single measurement campaign and, therefore, could not be generalized for the entire scrubber fleet. Additionally, particle emissions from various literature sources have shown a reduction downstream of scrubbers [13,37]. The results for open-loop scrubbers cannot be extended to other types, such as closed-loop scrubbers, which operate on a different principle, by adding an alkaline chemical to freshwater [31]. Various factors, including engine type, scrubber type, fuel and lube oil, seawater properties, alkaline chemical properties and quantity and specific ship operation by the crew, may affect scrubber emission performance [68]. Moreover, apart from air pollution, the impact of scrubbers on the marine environment should also be evaluated [69]. Genitsaris et al. (2024) collected scrubber effluent discharge from the same ship and observed the biodegradation of PAHs in the sea, which originated from the scrubber effluent [70]. This biodegradation is considered a positive impact of scrubbers, as these PAHs would otherwise have been emitted into the atmosphere. Overall, it can be seen that scrubbers have environmental impacts that go beyond the mere reduction of exhaust SOX, highlighting the need for more research aiming at better understanding their effects on both air and marine environments. The maritime sector should focus on alternative solutions, such as low- or zero-carbon fuels, which have the potential to reduce both GHG and air pollutant emissions. This approach will help the industry comply with increasingly stringent regulatory frameworks and contribute to more sustainable maritime operations. Due to their severe consequences on human health, new policies should be established, to regulate particulate emissions from the shipping sector.

5. Conclusions

This study provided the particulate and gaseous emission levels along with the PSD from a large two-stroke SSD engine equipped with an open-loop scrubber. These values were derived from a 7-day measurement campaign conducted on a large containership, which performed a scheduled voyage between two international ports. This was the first time in the worldwide literature that real-sailing-conditions measurements were conducted on an open-loop scrubber used to abate emissions from such a large engine with a maximum power output of 62 MW. Another special and unique element of this study was the first application of both TD and CS + ED on a marine engine environment during on-board testing. The developed EFs downstream of scrubbers can be fed into emission and air pollution models, to identify their overall effect on the environment and human health and, thus, to support policy makers in promoting new effective emission control policies and regulations.
The results of this study contribute to the generally limited understanding of the particulate and gaseous emission performance of open-loop scrubbers in ships. The emission levels of gaseous pollutants, NOX, CO and THC were found to be unaffected by the scrubber operation but were mostly dependent on engine load. As expected from the literature findings, SO2 emissions were reduced to compliant levels downstream of the scrubber, while ULSFO SO2 levels were even lower. In contrast, downstream of the scrubber higher PN levels, by 150%, were found compared to engine-out, which were mostly attributable to the condensational growth of nanometer particle cores, salt and the formation of sulfuric acid particles in the smaller size range, induced by the scrubber. In terms of fuel, the ULSFO showed lower PN levels compared to the HFO fuel batches. A TD and CS + ED were applied to evaporate the volatiles, but in our study were seen to generate new particles under high-humidity-and-sulfur conditions. The TD created artifact particles in the smaller size range both upstream and downstream of the scrubber. Upstream of the scrubber, the use of CS + ED resulted in the generation of artifact particles at levels over 65 times higher than the “Fresh” sample under high-oxygen-and-sulfur conditions, while downstream of the scrubber the PN level was reduced by 37%.
Despite the notable rise in the installation of scrubbers on newbuild and retrofit ships worldwide, scrubber emission performance is quite unclear, since it can effectively abate SO2 emissions but produce nanoparticles, based on the results of this study. Therefore, more research is needed in this area, to comprehensively address the remaining challenges in scrubbers’ emissions effectiveness. Scrubber manufacturers should address the formation of nanoparticles induced by scrubbers and should implement innovative engineering solutions optimized for both SOX and particulate abatement. Future research should further elaborate on the environmental performance of different scrubber types, both open-loop and closed-loop, considering their impact on emissions to the atmosphere and sea. This study also highlights the importance of appropriate particle testing conditions for marine engines under various DR, temperature and thermal treatment configurations, as well as the additional complexity induced by the scrubber. This should be further investigated in future research, as the necessity of creating a standardized marine measurement protocol is obvious for accurate shipping emissions estimation.

Supplementary Materials

The following supporting information can be downloaded at https://www.mdpi.com/article/10.3390/atmos15070845/s1: Figure S1: Map designating the ship’s voyage and the color rendering of the mean load (in %) of the main engine and the speed-over-ground-(in knots) ratio (left); Map illustrating the geographical locations of each fuel used and the two changeover processes during the voyage (right). Table S1: Mean NOX, SO2, CO and THC emission levels (in g/kg fuel) and standard deviation for different sampling points, fuel types, mean load (in %) of the main engine and specific fuel oil consumption (in g fuel/kWh). Figure S2: Mean emission levels (in g/kg fuel) for NOX (left) and CO and THC (right) in relation to engine load (in %) for the different sampling points; Squares corresponding to upstream of the scrubber with HFO, circles corresponding to downstream of the scrubber and HFO and triangles to deactivated scrubber with ULSFO. Table S2: Mean PN emission levels (in #/kg fuel) and standard deviation (and number of individual values in parenthesis) for different sampling points, fuel types, sampling scheme (layout, dilution, temperature), mean load (in %) of the main engine and specific fuel oil consumption (in g fuel/kWh).

Author Contributions

Conceptualization, H.S., J.M. and L.N.; methodology, A.G. and L.N.; validation, N.K., A.R.-C., J.M., A.K., Z.T., S.M. and L.N.; formal analysis, A.G., N.K., A.R.-C., H.S. and Y.C.; investigation, A.G., N.K., A.R.-C., H.S. and A.-L.H.; resources, N.K., A.R.-C., H.S. and L.N.; data curation, A.G., N.K., A.R.-C., H.S., J.M. and Y.C.; writing—original draft preparation, A.G.; writing—review and editing, N.K., A.R.-C., J.M., A.-L.H., A.K., Z.T., S.M. and L.N.; visualization, A.G. and J.M.; supervision, H.S., J.M. and L.N.; project administration, H.S., J.M., A.-L.H. and L.N.; funding acquisition, J.M. and L.N. All authors have read and agreed to the published version of the manuscript.

Funding

This research was funded by the European Union’s Horizon 2020 research and innovation programme Evaluation, control and Mitigation of the EnviRonmental Impacts of shipping Emissions (EMERGE project), grant number 874990.

Institutional Review Board Statement

Not applicable.

Informed Consent Statement

Not applicable.

Data Availability Statement

The data presented in this study are available on request from the corresponding author, due to privacy reasons.

Acknowledgments

This work was conducted within the framework of the EMERGE project. The EMERGE project has received funding from the European Union’s Horizon 2020 research and innovation program under grant agreement Nr.874990.

Conflicts of Interest

The authors declare no conflicts of interest.

Abbreviations

AEauxiliary engine
APCAVL particle counter
CLAchemiluminescence analyzer
COcarbon monoxide
CScatalytic stripper
DRdilution ratio
ECAemission control area
EDejector diluter
EFemission factor
EUEuropean Union
FIDflame ionization detector
FSCfuel sulfur content
GHGgreenhouse gas
HFOheavy fuel oil
IMOInternational Maritime Organization
MEmain engine
MSDmedium speed diesel
NDIRnon-dispersive infrared
NECAnitrogen emission control area
NMVOCnon-methane volatile organic compounds
PAHpolycyclic aromatic hydrocarbons
PMparticulate matter
PNparticulate number
PSDparticle size distribution
Rpmrevolutions per minute
SECAsulfur emission control area
SFOCspecific fuel oil consumption
SMPSscanning mobility particle sizer
SOGspeed over ground
SPDsampling point downstream
TDthermodenuder
TEUtwenty-foot-equivalent unit
THCtotal hydrocarbon
ULSFOultra-low sulfur fuel oil

References

  1. United Nations Conference on Trade and Development. Review of Maritime Transport 2022; United Nations Conference on Trade and Development: Geneva, Switzerland, 2023; ISBN 9789211130737. [Google Scholar]
  2. Matthias, V.; Bewersdorff, I.; Aulinger, A.; Quante, M. The Contribution of Ship Emissions to Air Pollution in the North Sea Regions. Environ. Pollut. 2010, 158, 2241–2250. [Google Scholar] [CrossRef]
  3. Winebrake, J.J.; Corbett, J.J.; Green, E.H.; Lauer, A.; Eyring, V. Mitigating the Health Impacts of Pollution from Oceangoing Shipping: An Assessment of Low-Sulfur Fuel Mandates. Environ. Sci. Technol. 2009, 43, 4776–4782. [Google Scholar] [CrossRef] [PubMed]
  4. Zhang, F.; Chen, Y.; Su, P.; Cui, M.; Han, Y.; Matthias, V.; Wang, G. Variations and Characteristics of Carbonaceous Substances Emitted from a Heavy Fuel Oil Ship Engine under Different Operating Loads. Environ. Pollut. 2021, 284, 117388. [Google Scholar] [CrossRef] [PubMed]
  5. Lehtoranta, K.; Aakko-Saksa, P.; Murtonen, T.; Vesala, H.; Kuittinen, N.; Rönkkö, T.; Ntziachristos, L.; Karjalainen, P.; Timonen, H.; Teinilä, K. Particle and Gaseous Emissions from Marine Engines Utilizing Various Fuels and Aftertreatment Systems. In Proceedings of the 29th CIMAC World Congress on Combustion Engine, Vancouver, QC, Canada, 10–14 June 2019; p. 399. [Google Scholar]
  6. Viana, M.; Hammingh, P.; Colette, A.; Querol, X.; Degraeuwe, B.; de Vlieger, I.; van Aardenne, J. Impact of Maritime Transport Emissions on Coastal Air Quality in Europe. Atmos Environ. 2014, 90, 96–105. [Google Scholar] [CrossRef]
  7. Wang, Z.; Zhang, X.; Guo, J.; Hao, C.; Feng, Y. Particle Emissions from a Marine Diesel Engine Burning Two Kinds of Sulphur Diesel Oils with an EGR & Scrubber System: Size, Number & Mass. Process Saf. Environ. Prot. 2022, 163, 94–104. [Google Scholar] [CrossRef]
  8. IMO. Fourth IMO GHG Study 2020 Full Report; IMO: London, UK, 2020. [Google Scholar]
  9. Alanen, J.; Isotalo, M.; Kuittinen, N.; Simonen, P.; Martikainen, S.; Kuuluvainen, H.; Honkanen, M.; Lehtoranta, K.; Nyyssönen, S.; Vesala, H.; et al. Physical Characteristics of Particle Emissions from a Medium Speed Ship Engine Fueled with Natural Gas and Low-Sulfur Liquid Fuels. Environ. Sci. Technol. 2020, 54, 5376–5384. [Google Scholar] [CrossRef] [PubMed]
  10. Jayaram, V.; Agrawal, H.; Welch, W.A.; Miller, J.W.; Cocker, D.R. Real-Time Gaseous, PM and Ultrafine Particle Emissions from a Modern Marine Engine Operating on Biodiesel. Environ. Sci. Technol. 2011, 45, 2286–2292. [Google Scholar] [CrossRef] [PubMed]
  11. Milojević, S.; Glišović, J.; Savić, S.; Bošković, G.; Bukvić, M.; Stojanović, B. Particulate Matter Emission and Air Pollution Reduction by Applying Variable Systems in Tribologically Optimized Diesel Engines for Vehicles in Road Traffic. Atmosphere 2024, 15, 184. [Google Scholar] [CrossRef]
  12. Di Natale, F.; Carotenuto, C. Particulate Matter in Marine Diesel Engines Exhausts: Emissions and Control Strategies. Transp. Res. D Transp. Environ. 2015, 40, 166–191. [Google Scholar] [CrossRef]
  13. Kuittinen, N.; Jalkanen, J.P.; Alanen, J.; Ntziachristos, L.; Hannuniemi, H.; Johansson, L.; Karjalainen, P.; Saukko, E.; Isotalo, M.; Aakko-Saksa, P.; et al. Shipping Remains a Globally Significant Source of Anthropogenic PN Emissions Even after 2020 Sulfur Regulation. Environ. Sci. Technol. 2021, 55, 129–138. [Google Scholar] [CrossRef]
  14. Grigoriadis, A. Onboard Particulate and Gaseous Emission Measurements from Slow Speed Marine Engine Equipped with Open-Loop Scrubber under Real World Operation. In Proceedings of the International Conference on Postgraduate Research in Maritime Technology, Online, 29 November 2023. [Google Scholar]
  15. Chu-Van, T.; Ristovski, Z.; Pourkhesalian, A.M.; Rainey, T.; Garaniya, V.; Abbassi, R.; Jahangiri, S.; Enshaei, H.; Kam, U.S.; Kimball, R.; et al. On-Board Measurements of Particle and Gaseous Emissions from a Large Cargo Vessel at Different Operating Conditions. Environ. Pollut. 2018, 237, 832–841. [Google Scholar] [CrossRef] [PubMed]
  16. Grigoriadis, A.; Kousias, N.; Raptopoulos, A.; Mamarikas, S.; Kontses, A.; Toumasatos, Z.; Salberg, H.; Lunde-Hermansson, A.; Moldanová, J.; Ntziachristos, L.; et al. Particulate and Gaseous Emissions from a Large 2-Stroke Slow Speed Marine Engine Equipped with Open-Loop Scrubber under Real Sailing Conditions. In Proceedings of the Joint TAP and S&E Conference, Gothenburg, Sweden, 27 September 2023. [Google Scholar]
  17. Vallabani, N.V.S.; Gruzieva, O.; Elihn, K.; Juárez-Facio, A.T.; Steimer, S.S.; Kuhn, J.; Silvergren, S.; Portugal, J.; Piña, B.; Olofsson, U.; et al. Toxicity and Health Effects of Ultrafine Particles: Towards an Understanding of the Relative Impacts of Different Transport Modes. Environ. Res. 2023, 231, 116186. [Google Scholar] [CrossRef]
  18. Vouitsis, I.; Portugal, J.; Kontses, A.; Karlsson, H.L.; Faria, M.; Elihn, K.; Juárez-Facio, A.T.; Amato, F.; Piña, B.; Samaras, Z. Transport-Related Airborne Nanoparticles: Sources, Different Aerosol Modes, and Their Toxicity. Atmos Environ. 2023, 301, 119698. [Google Scholar] [CrossRef]
  19. Yang, J.; Tang, T.; Jiang, Y.; Karavalakis, G.; Durbin, T.D.; Wayne Miller, J.; Cocker, D.R.; Johnson, K.C. Controlling Emissions from an Ocean-Going Container Vessel with a Wet Scrubber System. Fuel 2021, 304, 121323. [Google Scholar] [CrossRef]
  20. GloMEEP Project Coordination Unit. Ship Emissions Toolkit. Guide No.1: Rapid Assessment of Ship Emissions in the National Context; GloMEEP Project Coordination Unit: London, UK, 2018. [Google Scholar]
  21. IMO. Initial IMO Strategy on Reduction of GHG Emissions from Ships; IMO: London, UK, 2018. [Google Scholar]
  22. European Commission. Integrating Maritime Transport Emissions in the EU’s Greenhouse Gas Reduction Policies; European Commission: Brussels, Belgium, 2013. [Google Scholar]
  23. IMO. Inclusion of Regulations on Energy Efficiency for Ships in MARPOL Annex VI; IMO: London, UK, 2011. [Google Scholar]
  24. Bettles, J.; Perez, A.; Björk, S.; Barcarolo, D.; Hintze, M. Assessing Impacts of EU and US Policies on Accelerated Deployment of Alternative Maritime Fuels Transatlantic Testing Ground; Center for Zero Carbon Shipping: Copenhagen, Denmark, 2024. [Google Scholar]
  25. Xu, L.; Zhang, M.; Xiao, G. Opportunities and Challenges of EU ETS to the Global Marine Industry. Front Mar Sci 2024, 11, 1382498. [Google Scholar] [CrossRef]
  26. IMO. List of Special Areas, Emission Control Areaw and Particularly Sensitive Sea Areas; IMO: London, UK, 2023. [Google Scholar]
  27. IMO. Effective Date of Implementation of the Fuel Oil Standard in Regulatio 14.1.3 of MARPOL VI; IMO: London, UK, 2016. [Google Scholar]
  28. Weng, J.; Han, T.; Shi, K.; Li, G. Impact Analysis of ECA Policies on Ship Trajectories and Emissions. Mar. Pollut. Bull. 2022, 179, 113687. [Google Scholar] [CrossRef] [PubMed]
  29. Zannis, T.C.; Katsanis, J.S.; Christopoulos, G.P.; Yfantis, E.A.; Papagiannakis, R.G.; Pariotis, E.G.; Rakopoulos, D.C.; Rakopoulos, C.D.; Vallis, A.G. Marine Exhaust Gas Treatment Systems for Compliance with the IMO 2020 Global Sulfur Cap and Tier III NOx Limits: A Review. Energies 2022, 15, 3638. [Google Scholar] [CrossRef]
  30. De Lauretis, R.; Ntziachristos, L.; Trozzi, C.; Fontelle, J.-P.; Fridell, E.; Grigoriadis, A.; Hill, N.; Kilde, N.; Lavender, K.; Mamarikas, S.; et al. EMEP/EEA Air Pollutant Emission Inventory Guidebook 2019, Update 2021; EMEP/EEA: Brussels, Belgium, 2021. [Google Scholar]
  31. Brynolf, S.; Magnusson, M.; Fridell, E.; Andersson, K. Compliance Possibilities for the Future ECA Regulations through the Use of Abatement Technologies or Change of Fuels. Transp. Res. D Transp. Environ. 2014, 28, 6–18. [Google Scholar] [CrossRef]
  32. Tran, T.A. Research of the Scrubber Systems to Clean Marine Diesel Engine Exhaust Gases on Ships. J. Mar. Sci. Res. Dev. 2017, 7, 1000243. [Google Scholar] [CrossRef]
  33. Hermansson, A.-L.; Hassellöv, I.M.; Grönholm, T.; Jalkanen, J.P.; Fridell, E.; Parsmo, R.; Hassellöv, J.; Ytreberg, E. Strong Economic Incentives of Ship Scrubbers Promoting Pollution. Nat. Sustain. 2024, 7, 812–822. [Google Scholar] [CrossRef]
  34. Altarriba, E.; Rahiala, S.; Tanhuanpää, T. Open-Loop Scrubbers and Restricted Waterways: A Case Study Investigation of Travemünde Port and Increased Sulphur Emissions Immediately After the Scrubbers Are Turned Off. TransNav 2023, 17, 465–471. [Google Scholar] [CrossRef]
  35. Comer, B.; Georgeff, E.; Osipova, L. Air Emissions and Water Pollution Discharges from Ships with Scrubbers; International Council on Clean Transportation: Washington, DC, USA, 2020. [Google Scholar]
  36. Winnes, H.; Fridell, E.; Moldanová, J. Effects of Marine Exhaust Gas Scrubbers on Gas and Particle Emissions. J. Mar. Sci. Eng. 2020, 8, 299. [Google Scholar] [CrossRef]
  37. Fridell, E.; Salo, K. Measurements of Abatement of Particles and Exhaust Gases in a Marine Gas Scrubber. Proc. Inst. Mech. Eng. Part M J. Eng. Marit. Environ. 2016, 230, 154–162. [Google Scholar] [CrossRef]
  38. Ushakov, S.; Stenersen, D.; Einang, P.M.; Ask, T.Ø. Meeting Future Emission Regulation at Sea by Combining Low-Pressure EGR and Seawater Scrubbing. J. Mar. Sci. Technol. 2020, 25, 482–497. [Google Scholar] [CrossRef]
  39. Rutherford, D.; Comer, B.; Johnson, K.; Miller, W.; Durbin, T.; Jiang, Y.; Yang, J.; Karavalakis, G.; Cocker, D.; Fofi, E.; et al. Black Carbon Measurement Methods and Emission Factors from Ships; University of California: Riverside, CA, USA, 2016. [Google Scholar]
  40. Zhou, J.; Zhou, S.; Zhu, Y. Characterization of Particle and Gaseous Emissions from Marine Diesel Engines with Different Fuels and Impact of After-Treatment Technology. Energies 2017, 10, 1110. [Google Scholar] [CrossRef]
  41. Santos, L.F.E.; Salo, K.; Thomson, E.S. Quantification and Physical Analysis of Nanoparticle Emissions from a Marine Engine Using Different Fuels and a Laboratory Wet Scrubber. Environ. Sci. Process Impacts 2022, 24, 1769–1781. [Google Scholar] [CrossRef] [PubMed]
  42. Jeong, S.; Bendl, J.; Saraji-Bozorgzad, M.; Käfer, U.; Etzien, U.; Schade, J.; Bauer, M.; Jakobi, G.; Orasche, J.; Fisch, K.; et al. Aerosol Emissions from a Marine Diesel Engine Running on Different Fuels and Effects of Exhaust Gas Cleaning Measures. Environ. Pollut. 2023, 316, 120526. [Google Scholar] [CrossRef] [PubMed]
  43. Karjalainen, P.; Teinilä, K.; Kuittinen, N.; Aakko-Saksa, P.; Bloss, M.; Vesala, H.; Pettinen, R.; Saarikoski, S.; Jalkanen, J.P.; Timonen, H. Real-World Particle Emissions and Secondary Aerosol Formation from a Diesel Oxidation Catalyst and Scrubber Equipped Ship Operating with Two Fuels in a SECA Area. Environ. Pollut. 2022, 292, 118278. [Google Scholar] [CrossRef] [PubMed]
  44. Lehtoranta, K.; Aakko-Saksa, P.; Murtonen, T.; Vesala, H.; Ntziachristos, L.; Rönkkö, T.; Karjalainen, P.; Kuittinen, N.; Timonen, H. Particulate Mass and Nonvolatile Particle Number Emissions from Marine Engines Using Low-Sulfur Fuels, Natural Gas, or Scrubbers. Environ. Sci. Technol. 2019, 53, 3315–3322. [Google Scholar] [CrossRef]
  45. Johnson, K.; Miller, W.; Yang, J. Evaluation of a Modern Tier 2 Ocean-Going Vessel Equipped with a Scrubber; Final report prepared for CARB; University of California: Riverside, CA, USA, 2018. [Google Scholar]
  46. ISO 8178-1; Reciprocating Combustion Engines—Exhaust Emission Measurement—Part 1: Test-Bed Measurement of Gaseous Particulate Emissions. ISO: Geneva, Switzerland, 2020.
  47. Agrawal, H.; Malloy, Q.G.J.; Welch, W.A.; Wayne Miller, J.; Cocker, D.R. In-Use Gaseous and Particulate Matter Emissions from a Modern Ocean Going Container Vessel. Atmos Environ. 2008, 42, 5504–5510. [Google Scholar] [CrossRef]
  48. Winnes, H.; Fridell, E. Emissions of NOX and Particles from Manoeuvring Ships. Transp. Res. D Transp. Environ. 2010, 15, 204–211. [Google Scholar] [CrossRef]
  49. Ntziachristos, L.; Saukko, E.; Lehtoranta, K.; Rönkkö, T.; Timonen, H.; Simonen, P.; Karjalainen, P.; Keskinen, J. Particle Emissions Characterization from a Medium-Speed Marine Diesel Engine with Two Fuels at Different Sampling Conditions. Fuel 2016, 186, 456–465. [Google Scholar] [CrossRef]
  50. Niemelä, V.; Lamminen, E. Performance Evaluation of the Dekati® EDiluterTM Conditioning System. In Proceedings of the 29th CRC Real World Emissions Workshop, Long Beach, CA, USA, 10–13 March 2019. [Google Scholar]
  51. Amanatidis, S.; Ntziachristos, L.; Karjalainen, P.; Saukko, E.; Simonen, P.; Kuittinen, N.; Aakko-Saksa, P.; Timonen, H.; Rönkkö, T.; Keskinen, J. Comparative Performance of a Thermal Denuder and a Catalytic Stripper in Sampling Laboratory and Marine Exhaust Aerosols. Aerosol Sci. Technol. 2018, 52, 420–432. [Google Scholar] [CrossRef]
  52. Dekati. Dekati EDiluter Pro Performance Evaluation; Dekati: Kangasala, Finland, 2020. [Google Scholar]
  53. Giechaskiel, B.; Carriero, M.; Martini, G.; Krasenbrink, A.; Scheder, D. Calibration and Validation of Various Commercial Particle Number Measurement Systems. SAE Int. J. Fuels Lubr. 2009, 2, 512–530. [Google Scholar]
  54. Amanatidis, S.; Ntziachristos, L.; Giechaskiel, B.; Katsaounis, D.; Samaras, Z.; Bergmann, A. Evaluation of an Oxidation Catalyst (“catalytic Stripper”) in Eliminating Volatile Material from Combustion Aerosol. J. Aerosol. Sci. 2013, 57, 144–155. [Google Scholar] [CrossRef]
  55. European Commission. Commission Regulation (EU) 2017/1151; European Commission: Brussels, Belgium, 2017. [Google Scholar]
  56. United Nations. Agreement Concerning the Adoption of Uniform Technical Prescriptions for Wheeled Vehicles, Equipment and Parts Which Can Be Fitted and/or Be Used on Wheeled Vehicles and the Conditions for Reciprocal Recognition of Approvals Granted on the Basis of These Prescriptions; Regulation No. 49; United Nations: New York, NY, USA, 2015. [Google Scholar]
  57. United Nations. Agreement Concerning the Adoption of Uniform Technical Prescriptions for Wheeled Vehicles, Equipment and Parts Which Can Be Fitted and/or Be Used on Wheeled Vehicles and the Conditions for Reciprocal Recognition of Approvals Granted on the Basis of These Prescriptions, Regulation No. 83; United Nations: New York, NY, USA, 2015. [Google Scholar]
  58. Dekati. Dekati Thermodenuder, User Manual; Dekati: Kangasala, Finland, 2011. [Google Scholar]
  59. Shin, D.; Seo, H.; Hong, K.J.; Kim, H.J.; Kim, Y.J.; Han, B.; Lee, G.Y.; Chun, S.N.; Hwang, J. Dilution Ratio and Particle Loss Performance of a Newly Developed Ejector Porous Tube Diluter Compared to a Commercial Diluter. Aerosol Air Qual. Res. 2020, 20, 2396–2403. [Google Scholar] [CrossRef]
  60. Melas, A.D.; Koidi, V.; Deloglou, D.; Daskalos, E.; Zarvalis, D.; Papaioannou, E.; Konstandopoulos, A.G. Development and Evaluation of a Catalytic Stripper for the Measurement of Solid Ultrafine Particle Emissions from Internal Combustion Engines. Aerosol Sci. Technol. 2020, 54, 704–717. [Google Scholar] [CrossRef]
  61. Milojević, S.; Savić, S.; Marić, D.; Stopka, O.; Krstić, B.; Stojanović, B. Correlation between Emission and Combustion Characteristics with the Compression Ratio and Fuel Injection Timing in Tribologically Optimized Diesel Engine. Tehnicki Vjesnik 2022, 29, 1210–1219. [Google Scholar] [CrossRef]
  62. IMO. 2021 Guidelines for Exhaust Gas Cleaning Systems; IMO: London, UK, 2021. [Google Scholar]
  63. Grigoriadis, A.; Mamarikas, S.; Ioannidis, I.; Majamäki, E.; Jalkanen, J.P.; Ntziachristos, L. Development of Exhaust Emission Factors for Vessels: A Review and Meta-Analysis of Available Data. Atmos Environ. X 2021, 12, 100142. [Google Scholar] [CrossRef]
  64. Lee, B.K.; Raj Mohan, B.; Byeon, S.H.; Lim, K.S.; Hong, E.P. Evaluating the Performance of a Turbulent Wet Scrubber for Scrubbing Particulate Matter. J. Air Waste Manag. Assoc. 2013, 63, 499–506. [Google Scholar] [CrossRef]
  65. Kasper, A.; Aufdenblatten, S.; Forss, A.; Mohr, M.; Burtscher, H. Particulate Emissions from a Low-Speed Marine Diesel Engine. Aerosol Sci. Technol. 2007, 41, 24–32. [Google Scholar] [CrossRef]
  66. Lack, D.A.; Corbett, J.J.; Onasch, T.; Lerner, B.; Massoli, P.; Quinn, P.K.; Bates, T.S.; Covert, D.S.; Coffman, D.; Sierau, B.; et al. Particulate Emissions from Commercial Shipping: Chemical, Physical, and Optical Properties. J. Geophys. Res. Atmos. 2009, 114, 2008JD011300. [Google Scholar] [CrossRef]
  67. van Essen, H.; van Wijngaarden, L.; Schroten, A.; Sutter, D.; Bieler, C.; Maffii, S.; Brambilla, M.; Fiorello, D.; Fermi, F.; Parolin, R.; et al. Handbook on the External Costs of Transport. European Commnission: Brussels, Belgium, 2019. [Google Scholar]
  68. Genitsaris, S.; Kourkoutmani, P.; Stefanidou, N.; Michaloudi, E.; Gros, M.; García-Gómez, E.; Petrović, M.; Ntziachristos, L.; Moustaka-Gouni, M. Effects from Maritime Scrubber Effluent on Phytoplankton and Bacterioplankton Communities of a Coastal Area, Eastern Mediterranean Sea. Ecol. Inform. 2023, 77, 102154. [Google Scholar] [CrossRef]
  69. Picone, M.; Russo, M.; Distefano, G.G.; Baccichet, M.; Marchetto, D.; Volpi Ghirardini, A.; Lunde Hermansson, A.; Petrovic, M.; Gros, M.; Garcia, E.; et al. Impacts of Exhaust Gas Cleaning Systems (EGCS) Discharge Waters on Planktonic Biological Indicators. Mar. Pollut. Bull. 2023, 190, 114846. [Google Scholar] [CrossRef] [PubMed]
  70. Genitsaris, S.; Stefanidou, N.; Hatzinikolaou, D.; Kourkoutmani, P.; Michaloudi, E.; Voutsa, D.; Gros, M.; García-Gómez, E.; Petrović, M.; Ntziachristos, L.; et al. Marine Microbiota Responses to Shipping Scrubber Effluent Assessed at Community Structure and Function Endpoints. Environ. Toxicol. Chem. 2024, 43, 1012–1029. [Google Scholar] [CrossRef]
Figure 1. Layout of the measurement setup.
Atmosphere 15 00845 g001
Figure 2. Dilution system, sampling copper transfer line, thermodenuder, catalytic stripper sampling lines and catalytic stripper + ejector diluter losses in relation to particle size diameter.
Atmosphere 15 00845 g002
Figure 3. Mean emission levels (in g/kg fuel) of SO2, NOX, CO and THC at different sampling points upstream and downstream of the scrubber and fuel type (HFO and ULSFO). Mean load (in %) of the main engine during the sampling at the point is indicated for each sampling point. The error bars correspond to two standard deviations of the measured values in 1 s resolution. The equivalent SO2 for the 0.5% and 0.1% FSC values are represented by red and green horizontal lines, respectively, on the left panel. THC is presented as THC*10.
Atmosphere 15 00845 g003
Figure 4. Mean PN size distribution (a) and PN emission levels (b) in (#/kg fuel) on “Fresh” sample, measured upstream and downstream of the scrubber with HFO and deactivated scrubber with ULSFO. Individual mean PN size distributions per each sampling point (right panels) are depicted along with error bars that correspond to standard deviation.
Atmosphere 15 00845 g004
Figure 5. PN emission levels over time of the ship’s trip for the fuel transition (HFO2 to ULSFO) in relation to ship speed (knots) and engine load (%).
Atmosphere 15 00845 g005
Figure 6. Mean PN size distributions (left panels) and mean PN emission levels (right panels) in (#/kg fuel) on “Fresh” sample, with “Thermodenuder” and with “Catalytic Stripper + Ejector Diluter”: (a) upstream scrubber with HFO, (b) downstream scrubber with HFO and (c) deactivated scrubber with ULSFO. The error bars correspond to standard deviation. PN upstream of the scrubber with “Catalytic stripper + Ejector diluter” is presented as PN/10.
Atmosphere 15 00845 g006
Table 1. Tested ship specifications and technical parameters.
ParameterValue
Gross tonnage (tonnes)75,201
Deadweight (tonnes)78,243
Length (m)300
Breadth (m)40.1
Container capacity (20-foot equivalent units—TEUs)6160
Year built2002
Main engineWärtsilä-Sulzer 12RTA96C
Main engine power (kW)/nominal rpm62,587/98
Auxiliary engineDaihatsu 8DK32
Auxiliary engine power-mechanical (kW)/nominal rpm2942/720
Design/service speed (knots)25/18
Table 2. Online instruments and analysis method for reference measurements of gaseous pollutants and particulates.
PollutantInstrumentOperational PrincipleRangeUncertainty
SO2Horiba PG 350ENon-dispersive infrared (NDIR)0–500 ppm (vol)±5 ppm
NOXChemiluminescence analyzer (CLA)0–2500 ppm (vol)±12.5 ppm
CO2Non-dispersive infrared (NDIR)0–30% vol±0.3% vol
O2Para-magnetic0–25%vol±0.25% vol
CONon-dispersive infrared (NDIR)0–1000 ppm (vol)±10 ppm
THCBernath Atomic BA 3006Flame ionization detector (FID)0.05 ppm-10% (vol)±0.1% vol
PN concentration and size distributionTSI SMPS 3080 and CPC 3776Particle size classification and particle counter5.9–225 nm±10%
Table 3. Measurement durations (in hours) of gaseous pollutants, THC and PN concentrations for each sampling point.
Sampling PointGaseous PollutantsTHCPN Concentration
Upstream scrubber4.606.3312.0
Downstream scrubber36.06.7516.7
ULSFO and deactivated scrubber7.270.7337.23
Disclaimer/Publisher’s Note: The statements, opinions and data contained in all publications are solely those of the individual author(s) and contributor(s) and not of MDPI and/or the editor(s). MDPI and/or the editor(s) disclaim responsibility for any injury to people or property resulting from any ideas, methods, instructions or products referred to in the content.

