Article

Experimental Research on Regulated and Unregulated Emissions from E20-Fuelled Vehicles and Hybrid Electric Vehicles

1
College of Mechanical and Energy Engineering, Beijing University of Technology, Beijing 100124, China
2
Beijing Vehicle Emissions Management Center, Beijing 100176, China
*
Author to whom correspondence should be addressed.
Atmosphere 2024, 15(6), 669; https://doi.org/10.3390/atmos15060669
Submission received: 11 May 2024 / Revised: 25 May 2024 / Accepted: 29 May 2024 / Published: 31 May 2024
(This article belongs to the Special Issue Engine Emissions: Assessment and Control)

Abstract

:
Ethanol as a renewable fuel has been applied in fuel vehicles (FVs), and it is promising in hybrid electric vehicles (HEVs). This work aims to investigate the emission characteristics of ethanol applied in both FVs and plug-in hybrid electric vehicles (PHEVs). The paper conducted a real-road test of an internal combustion FV and PHEV, respectively, based on the world light vehicle test cycle (WLTC) by using gasoline and regular gasoline under different temperature conditions. The use of E10 and E20 in FVs has been effective in reducing the conventional emissions of the vehicles. At 23 °C, E10 and E20 reduced the conventional emissions including carbon monoxide (CO), total hydrocarbon compound (THC), non-methane hydrocarbon compound (NMHC), particulate matter (PM), and particulate number (PN) by 15.40–31.11% and 11.00–44.13% respectively. At 6 °C, E10 and E20 reduced conventional emissions including THC, CO, and PM by 2.15–8.61% and 11.02–13.34%, respectively. However, nitrogen oxide (NOX) emissions increased to varying degrees. The reduction trend of non-conventional emissions including methane (CH4), nitrous oxide (N2O), and carbon dioxide (CO2) from FVs fueled with E10 and E20 is not significant for vehicles. Overall, the emission reduction effect of E20 is better than that of E10, and the emission reduction effect of ethanol gasoline on vehicle emissions is reduced at low temperatures. Lower ambient temperatures increase vehicle emissions in the low-speed segment but decrease vehicle emissions in the ultra-high-speed segment. HEV emissions of THC, CO, PN, and PM are reduced by 25.28%, 12.72%, 77.34%, and 64.59%, respectively, for E20 compared to gasoline, and the use of E20 in HEVs contributes to the reduction of overall vehicle emissions.

1. Introduction

In recent years, air pollution has become a global focal point of concern. Vehicle exhaust emissions are a major contributor to air pollution, prompting the worldwide exploration of more environmentally friendly and lower-emission fuels [1,2]. Ethanol, as a biofuel, distinguishes itself by being derived from plant biomass, offering renewable advantages compared to traditional petroleum fuels [3]. This renewability implies that ethanol usage helps reduce dependence on finite resources and towards a more sustainable direction. Ethanol has been utilized as a partial alternative to gasoline due to its advantages of clean combustion, high sustainability [4,5], and knock resistance related to the high-octane number and intake-flow cooling effect. Additionally, the combustion of ethanol fuel releases relatively less carbon dioxide [6]. Ethanol is produced from energy crops by the hydrolysis and sugar fermentation process, helping offset CO2 emissions from vehicle operations [7]. This presents a potential pathway to reduce the transportation sector’s contribution to climate change. Ethanol has a high-octane number, a high oxygen content, is sulfur-free and aromatics-free, and can be blended with petrol and diesel, thus improving the anti-knock properties of the fuel, promoting engine combustion, and reducing vehicle emissions. However, ethanol as an alternative fuel has some shortcomings. The calorific value of ethanol fuel is lower than that of gasoline, which can lead to lower fuel economy and cold-starting problems at lower ambient temperatures.
For instance, Zhang et al. [8] conducted WLTC on six gasoline vehicles, and the results indicated that the use of E10 gasoline led to a reduction in average vehicle emissions of CO, THC, and PM, while PN emissions showed an increase. Karavalakis et al. [9] conducted chassis emission tests on seven vehicles with different specifications. Their research revealed that the use of E10 and E20 gasoline resulted in reduced emissions of THC, NMHC, and CO compared to regular gasoline. However, NOX emissions exhibited varying degrees of increase. LV et al. [10] also reported an increase in CO emissions from vehicles fueled with ethanol gasoline. Additionally, Hilton et al. [11] demonstrated that the utilization of E20 fuel in vehicle emission testing contributed to reduced emissions of CH4, THC, CO, and NOX. In low-temperature environments, vehicle emissions during cold starts tend to increase. Zhu et al. [12] discovered that vehicles using E10 gasoline in such conditions exhibited significantly higher levels of PM and PN emissions compared to regular gasoline. Suarez et al. [13] observed that low-temperature environments can intensify the emissions of CO, THC, and NOX from vehicles, with the majority of emissions occurring during the cold start phase. Alvarez et al. [14] determined that hybrid vehicles’ fuel consumption in low-temperature environments is generally comparable to that of traditional gasoline vehicles, but there is an elevated risk of CO emissions compared to the latter. Additionally, some researchers have noted that ethanol gasoline can exacerbate CH4 and CO2 emissions under low-temperature conditions, thereby exacerbating the greenhouse effect [15,16]. The greenhouse effect has a growing impact on the Earth’s environment, with motor vehicle exhaust being a significant source of greenhouse gases, including CO2, N2O, and CH4. Researchers assess the impact of exhaust emissions on the greenhouse effect using the global warming potential (GWP) [17,18]. Yu et al. [19] demonstrated that hybrid vehicles have a lower heating effect factor compared to regular gasoline vehicles, which is further supported by the findings of Zhang et al. [20].
PHEVs are widely recognized as an effective method for reducing emissions and mitigating vehicle exhaust emissions [21,22,23,24]. The combination of hybrid vehicles with low-emission fuels holds great promise. The results of related studies show that hybrids have reduced CO2 emissions and fuel consumption, but CO, THC, and other emissions are not significantly reduced [25,26,27]. Garcia et al. [28] conducted research indicating that the emissions from vehicles using a combination of E10 gasoline and hybrid mode are relatively clean. Zhang et al. [29] found that the use of E10 gasoline in dedicated hybrid engines can effectively reduce greenhouse gas emissions. However, there is currently limited research on the combination of higher proportions of ethanol gasoline with hybrid power. It is suggested that the utilization of lower-emission E20 gasoline combined with hybrid power may be one of the most viable approaches for addressing exhaust emissions and mitigating the greenhouse effect in the future.
Therefore, to investigate the promising possibility of ethanol fuel application in HEVs, this work conducted a real-road test of an internal combustion FV and HEV, respectively, based on WLTC by using E20 ethanol gasoline and regular gasoline under different temperature conditions. The emission characteristics of ethanol gasoline applied in both FVs and HEVs were studied through emission factors and global warming potential (GWP) factors, and the concept of emission factors was introduced to explore the impact of vehicle speed on emissions in conjunction with the four speed ranges of WLTC.

2. Experimental Setup

2.1. Fuel Properties

This study investigated the physical and chemical characteristics of E20 ethanol gasoline in comparison to 95 octane gasoline, which serves as a reference fuel in the Chinese market. The composition of E20 gasoline consists of 19.63% ethanol and the density of E20 gasoline at 20 °C is measured to be 741.7 kg/cm3. The composition of E10 gasoline consists of 10.47% ethanol and the density of E10 gasoline at 20 °C is measured to be 744.7 kg/cm3. The testing of gasoline samples was performed by China Petroleum and Chemical Corporation, and specific detection methods were employed to evaluate the properties of the gasoline samples. The obtained results are summarized in Table 1.

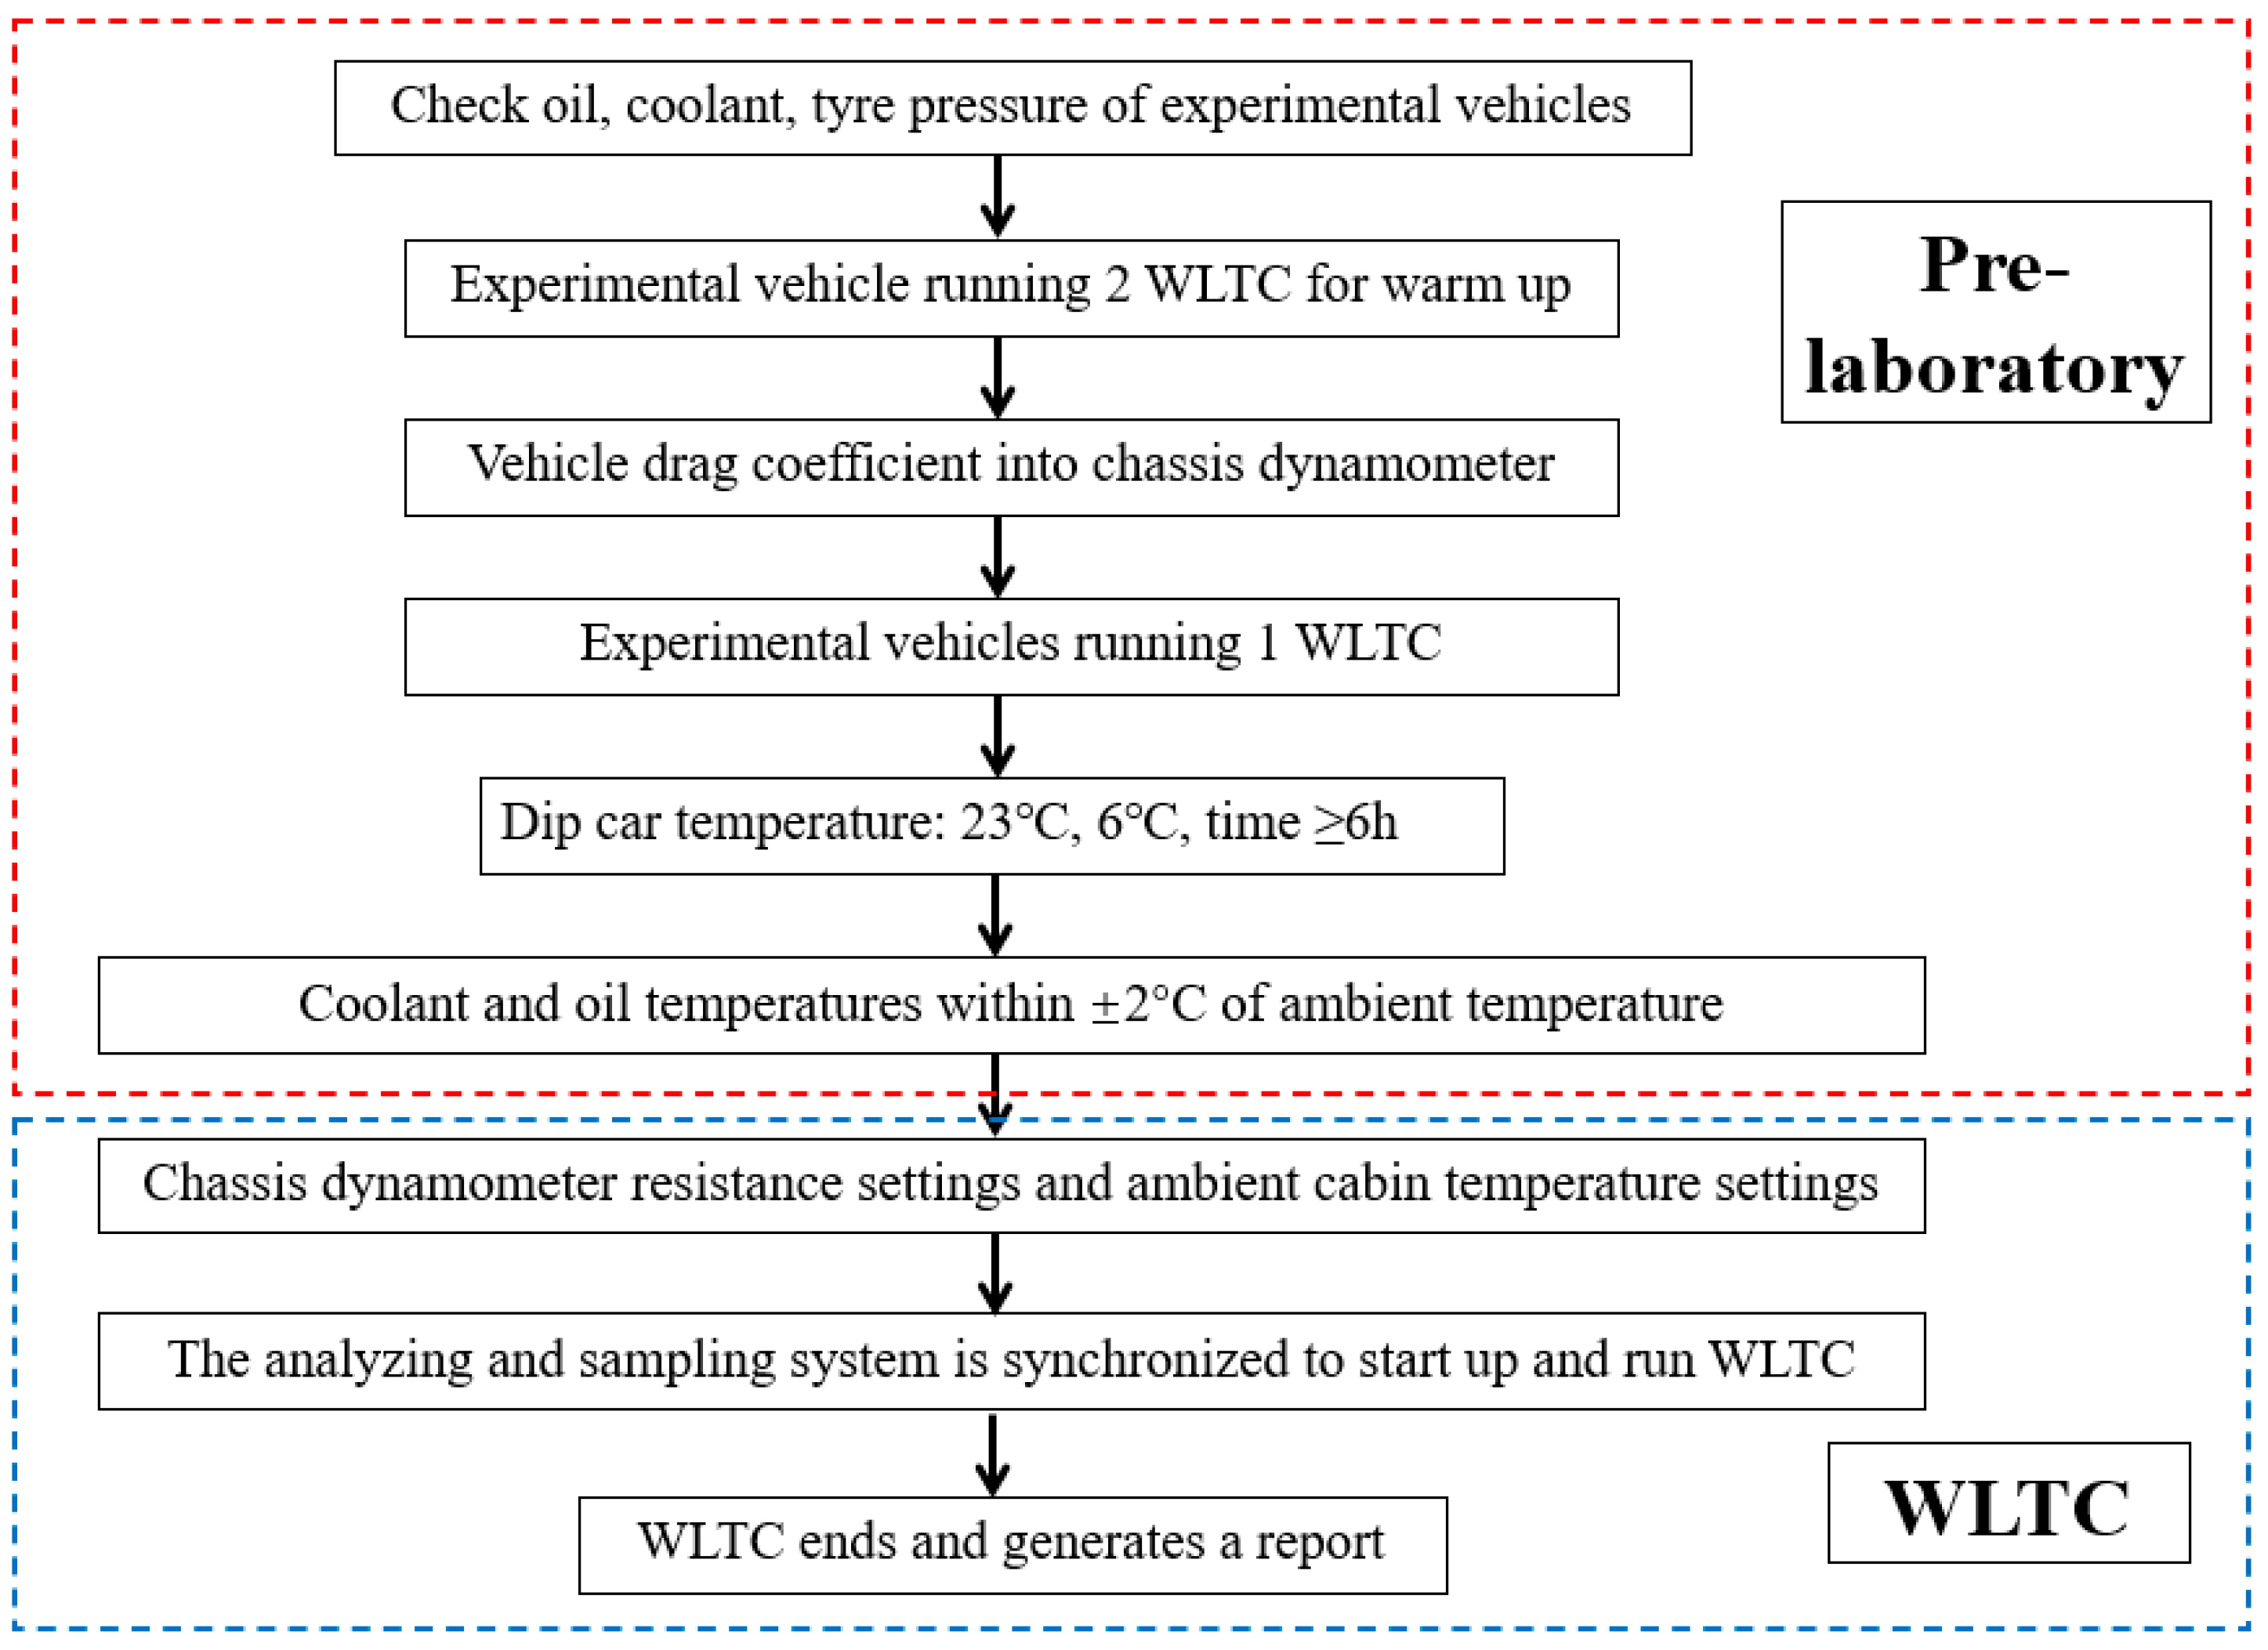
2.2. Chassis Dynamometer Experiments

Emission tests were carried out using the WLTC, which adheres to the certification procedures specified in the light-duty China-6 standard. The WLTC is a standardized test cycle employed for the approval of new vehicle models. It consists of four driving stages: low-speed (589 s), medium-speed (590 to 1022 s), high-speed (1023 to 1477 s), and extra-high-speed (1478 to 1800 s). The maximum speed achieved during the cycle is 131.3 km/h, and the total distance covered is 23.26 km.
In this study, two vehicles were selected for comparison: an FV conforming to the China-5 standard and an HEV conforming to the China-6 standard. The main specifications of the two test vehicles are provided in Table 2. It is important to note that all test vehicles in this study were not equipped with an exhaust gas recirculation (EGR) system.
In this experimental setup, the same vehicle is utilized for the research. For different gasoline experiments, the following steps were used to clean the oil system of the experimental vehicle:
(1)
Empty the fuel tank of the experimental vehicle and fill the tank with experimental fuel.
(2)
Place the vehicle on the chassis dynamometer, run a WLTC test cycle, and then empty the fuel tank.
(3)
Fill the fuel tank with experimental fuel again and repeat step (2).
(4)
Fill up the experimental vehicle with experimental fuel and run the WLTC test cycle.
(5)
Switch to a different experimental fuel and repeat steps (1) to (4).
The sequence of using different gasoline in the same vehicle was (1) petrol; (2) E10; (3) E20.
The flow of the experiment is shown in Figure 1. Prior to the experiment, the test vehicle is required to be soaked at room temperature (23 ± 1) °C for a minimum of 6 h. This soaking period ensures that the temperature difference between the intake air, cooling water, and the emission control device, as well as the ambient environment, does not exceed ±2 °C. In order to investigate the emission characteristics of ethanol gasoline under low-temperature conditions, the room temperature is adjusted to 6 ± 1 °C, and the vehicle is soaked for at least 6 h in this controlled environment. For HEV, a battery depletion test was conducted. The test was carried out with the laboratory vehicle’s battery level below 12% to ensure that the vehicle’s power during the testing process was solely derived from the engine.

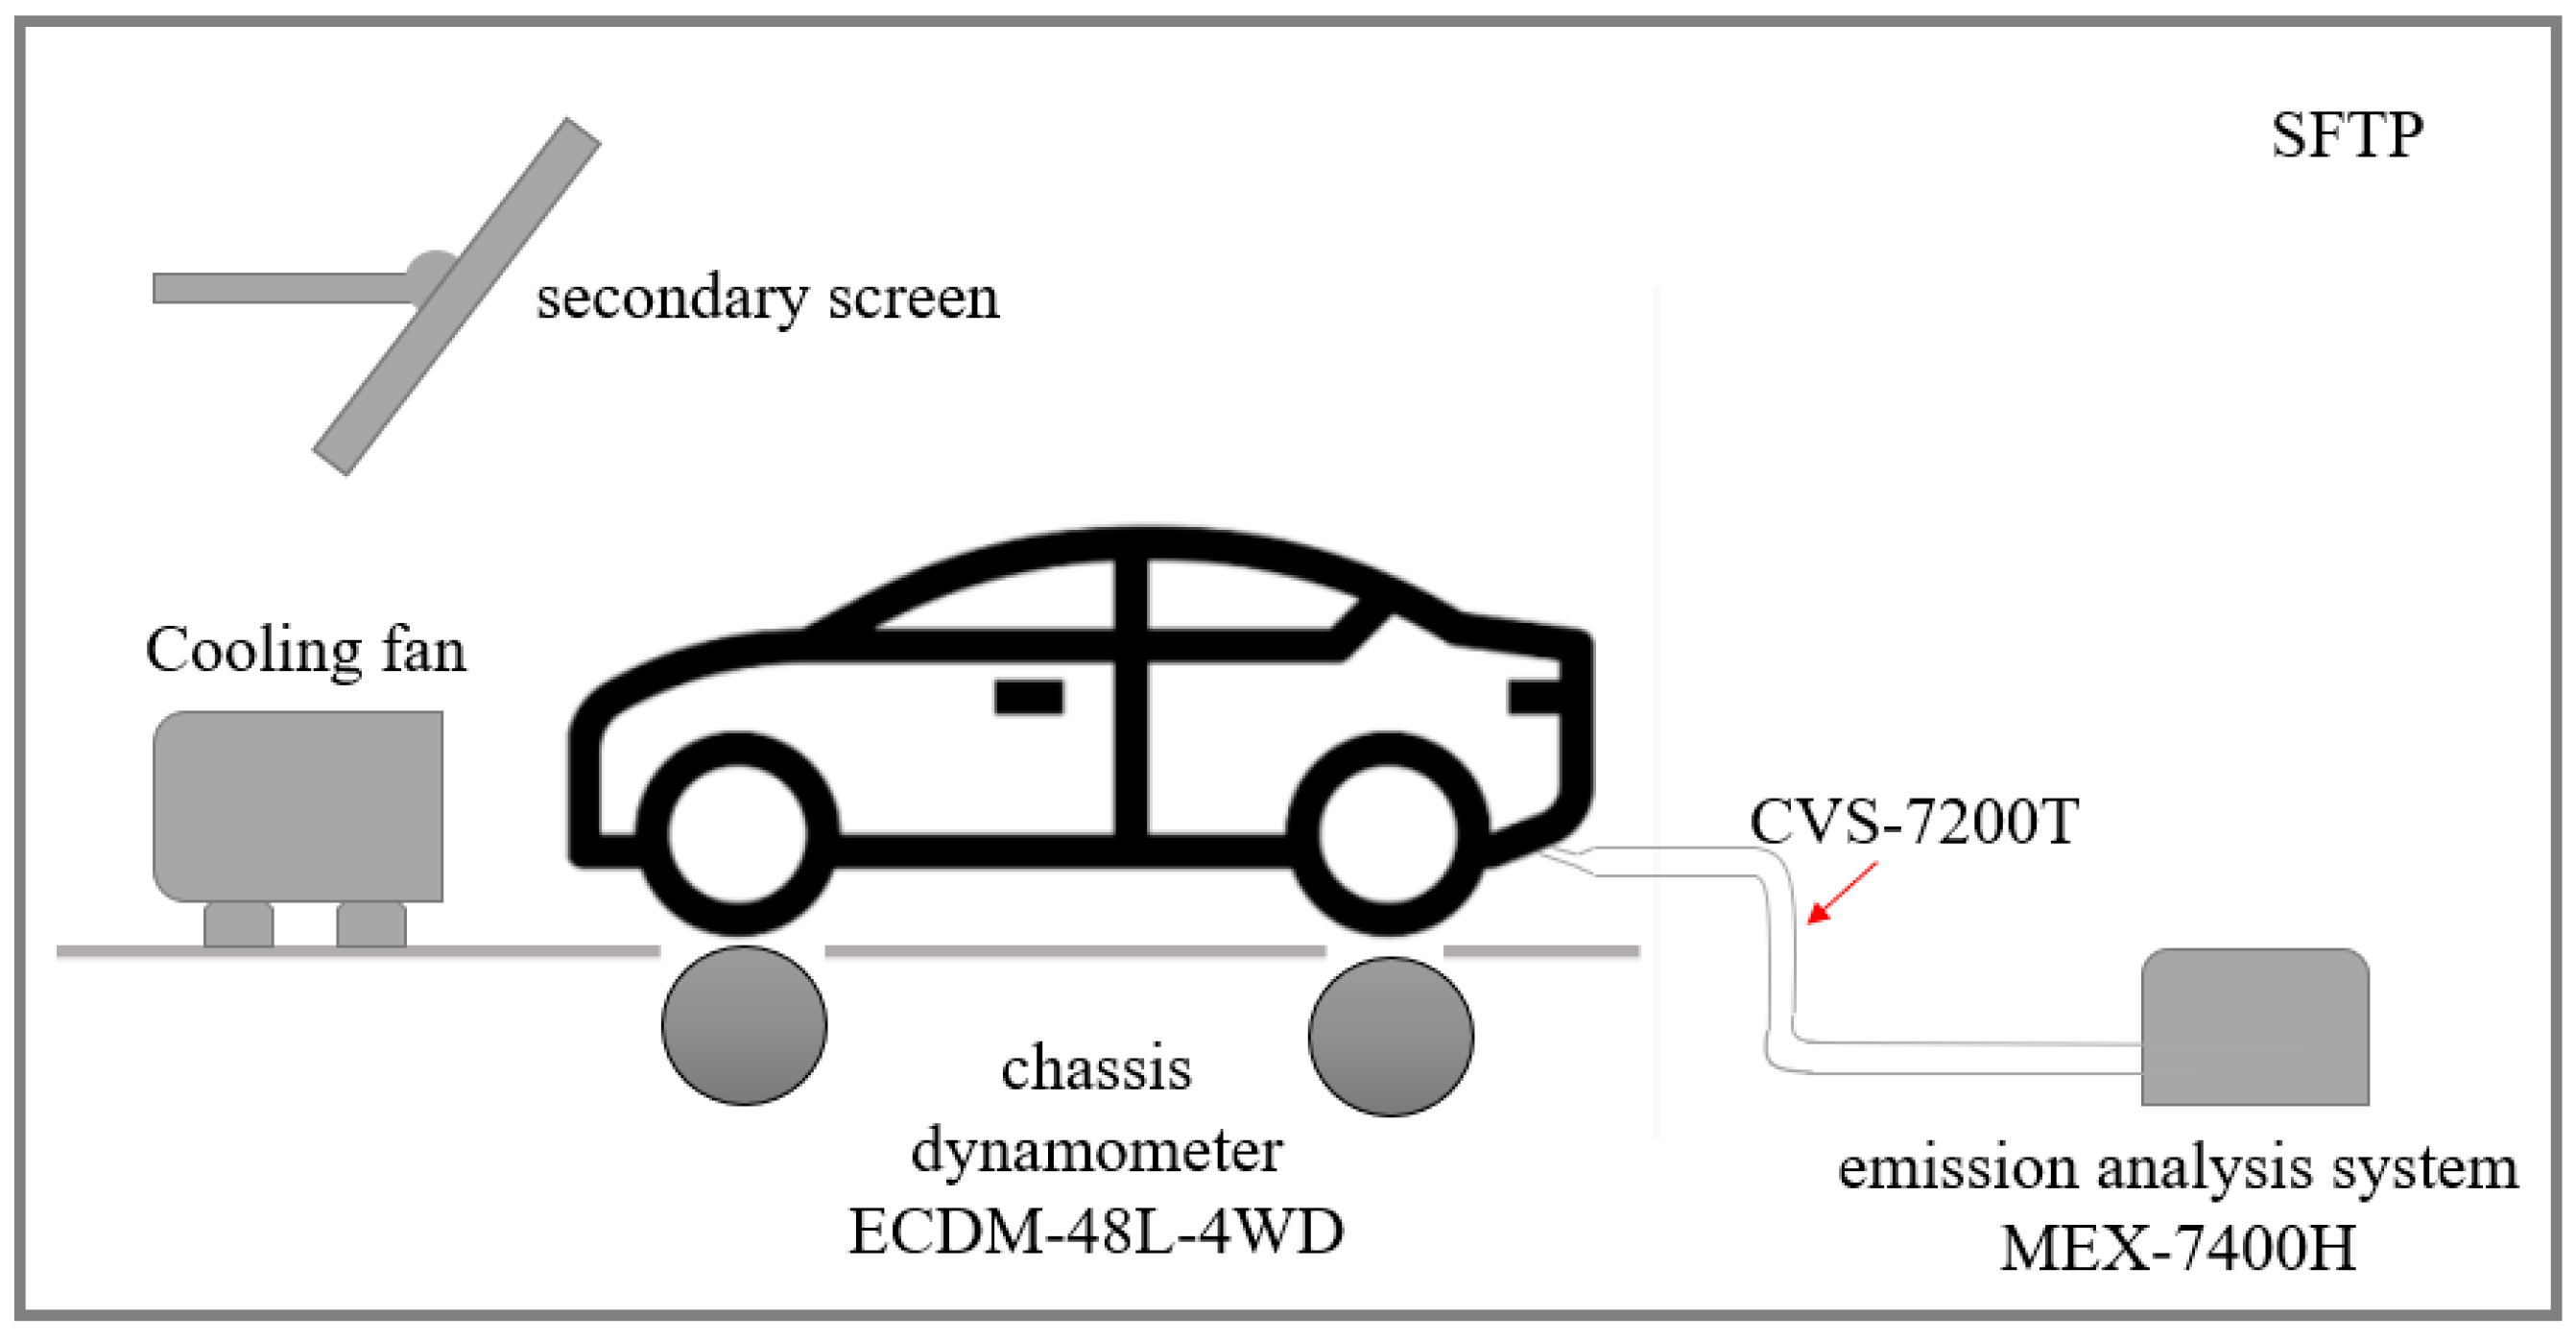
2.3. Sampling and Analytical Instrumentation

The experimental equipment mainly consists of an environmental simulation chamber, a chassis dynamometer, an emission analysis system, a cooling fan, etc. The model of the environmental simulation chamber is the SFTP of IMTECH, Germany, which can simulate the environment under 0~45 °C and 10~95% RH. The model of the chassis dynamometer is the ECDM-48L-4WD of MAHA, Germany, which has an adjustable axle spacing of 2~4 m, and the maximum speed is up to 200 km/h.
The analysis system utilized in this study was the MEXA-7400LE by HORIBA, Kyoto City, Japan. The measurement of CO and CO2 in the exhaust was performed using non-spectral infrared (NDIR) technology. The THC (total hydrocarbon) content in the exhaust was measured using a hydrogen ion flame detector (FID). The NOX in the exhaust was measured using chemiluminescence (CLS). For the detection of N2O emissions, gas chromatography coupled with an electron capture detector (GC + ECD) was employed. CH4 emissions were detected using gas chromatography with a hydrogen ion flame detector (GC + FID).
A 47 nm PALL glass-fiber filter was installed on a HORIBA DLS-7100 particle sampling system to perform gravimetric PM measurement. After each test, the filter was carefully removed and weighed using a Sartorius SE2-F (Göttingen, Germany) precision scale with a resolution of 0.1 mg. The weighing process took place in a HORIBA CHAM-1000 microbalance clean chamber to ensure a controlled environment for accurate measurements. For the measurement of PN, a HORIBA MEXA-1000SPCS was employed (Figure 2).

2.4. Data Processing Methods

The emission factor results from all experiments were obtained by modifying the test equipment and calculating correlation coefficients.
In order to compare the impacts of different pollutants on the greenhouse effect, the global warming potential (GWP) was utilized as a comparative index. GWP is calculated by multiplying the greenhouse gas emission factor by the GWP factor per unit of greenhouse gas, as outlined in Formula (1). The GWP factors per unit of CO2, N2O, and CH4 gases are 1, 298, and 25, respectively. The calculation Formula (1) is presented below:
G W P = m i × G W P i
In Formula (1), the variable mi represents the emission factor of greenhouse gas i, which is measured in mg/km. The variable GWPi represents the GWP factor of greenhouse gas i.
The emission data of the experimental vehicles were normalized and processed as shown in Formula (2):
y i = x i x m i n x m a x x m i n
In Formula (2), y i is the normalized factor for emission i, x i is the emission factor for emission i, x m i n is the minimum value of the emission factor for emission i, and x m a x is the maximum value in the emission factor for emission i.
In order to compare the overall emission differences between hybrid and fuel vehicles burning gasoline and E20, an emission reduction factor K is introduced, see Formula (3)
k i = M i ( g a s o l i n e ) M i ( E 20 ) M i ( g a s o l i n e )
In Formula (3), k i is the emission reduction factor for emission i, dimensionless; M i ( g a s o l i n e ) is the emission factor for emission i when the vehicle is fueled with gasoline; and M i ( E 20 ) is the emission factor for emission i when the vehicle is fueled with ethanol E20.

2.5. Ambient Temperature Error Analysis

In this paper, a number of tests were conducted at 23 °C and 6 °C, and under the 23 °C setting condition, the average temperature was 23.464 °C, the standard deviation was 0.156, and the dispersion coefficient was 0.665%. The ambient temperature was increased due to the prolonged operation of the vehicle in the ultra-high-speed stage, but the overall ambient temperature was close to the 23 °C set in the environmental warehouse. Under the 6 °C setting condition, the average temperature is 6.291 °C, the standard deviation is 0.311, and the dispersion coefficient is 4.944%. The actual ambient temperature is close to the setting of 6 °C, which meets the experimental requirements (Figure 3).

3. Results and Discussion

3.1. Regulated and Unregulated Emissions

The emissions of CO, THC, NOX, PM, and PN were measured and analyzed in accordance with the relevant regulations. The emission factor is a crucial parameter for evaluating the level of pollutant emissions from motor vehicles [30,31,32]. Figure 3 shows the emission factors for conventional emissions from gasoline, E10, and E20 combustion in FVs.
From Figure 4a, it can be seen that the THC emission factors of gasoline vehicles burning E10 and E20 decreased by 29.08% and 40.51% at 23 °C compared to gasoline, and decreased by 4.57% and 13.34% at 6 °C. Ethanol can make the quenching layer inside the internal combustion engine thinner and reduce the THC emission generated by quenching, and the THC emission factors of vehicles at 6 °C were significantly higher than those at 23 °C. At 6 °C, the THC emission factors of gasoline, E10, and E20 increased by 34.20%, 80.58%, and 95.49%, respectively, and the increases of E10 and E20 were larger than that of gasoline. The low temperature cuts down the THC emission reduction effect of ethanol gasoline, which is due to the higher latent heat of vaporization and specific heat capacity of ethanol, which reduces the temperature of the cylinder wall surface and exacerbates the cold excitation effect of the wall surface. At the same time, because of the lower gas mixing degree and slower combustion rate of the combustion engine, the gas mixture of the combustion engine is less homogeneous. At the same time, the gas mixture of the internal combustion engine decreases in uniformity and the combustion rate slows down at low temperatures, resulting in an increase in THC due to incomplete combustion.
From Figure 4b, it can be seen that the CO emission factors of gasoline vehicles burning E10 and E20 are reduced by 16.78% and 11.00% at 23 °C compared to gasoline, and by 8.61% and 11.83% at 6 °C. The low temperature cuts down the CO emission reduction effect of burning ethanol gasoline in vehicles, and the combustion and flame propagation speed of ethanol is higher than that of gasoline, which helps to reduce CO emissions generated by incomplete combustion.
From Figure 4c, it can be seen that the NOX emission factor of gasoline vehicles burning E10 and E20 increased by 16.78% and 11.00% at 23 °C compared to gasoline, and 44.75% and 37.56% at 6 °C. Ethanol gasoline’s increased NOX emissions [33,34,35] and the oxygen concentration and temperature in the combustion chamber are important factors affecting the generation of NOX. The higher the oxygen concentration, and the higher the temperature, the faster the NOX generation rate. Compared with gasoline, the high oxygen content of E10 and E20 increases NOX emissions; even though the oxygen content of E20 is higher than that of E10, the aromatic and sulfur content of E10 is higher than that of E20, and the latent heat of vaporization of E20 is higher than that of E10, which leads to lower temperatures in the combustion chamber and reduced NOX emissions [36], which in combination results in a lower NOX emission factor for E20 than for E10.
From Figure 4d, it can be seen that the PN emission factors of gasoline vehicles burning E10 and E20 decrease by 31.11% and 39.02% at 23 °C compared to gasoline and increase by 17.68% and 11.57% at 6 °C. Low temperatures lead to a drastic increase in the emission of PN; the vapor pressure of ethanol decreases with the decrease in ambient temperature by a larger amount than that of gasoline; and the mixture homogeneity and fuel quality are poorer for ethanol than for gasoline, thus leading to a larger increase in the emission of PN for ethanol gasoline at lower ambient temperatures. Ethanol results in poorer mixture homogeneity and fuel quality compared to gasoline, resulting in a greater increase in PN emissions from ethanol gasoline at lower ambient temperatures.
From Figure 4e it can be seen that the PM emission factor for FVs burning E10 and E20 is reduced by 31.11% and 39.02% at 23 °C compared to gasoline, and by 2.15% and 11.02% at 6 °C. The slightly higher vapor pressures and low evaporation temperatures in the first half of E10 and E20 and good evaporation leads to a more complete combustion in the cylinders, which results in a reduction in the production and emission of PM [37]. Ethanol combustion is relatively cleaner than gasoline due to its simple molecular structure and internal oxygen content. During combustion, ethanol is less likely to form carbon and hydrogen fragments and polycyclic aromatic hydrocarbons (PAHs). PAHs are closely related precursors to in-cylinder particulate matter formation [38]. Low ambient temperatures exacerbate fuel vaporization and mixture formation and stronger ethanol evaporation, which in turn exacerbates PM production, making ethanol gasoline less effective in reducing PM emissions at low temperatures [39].
Overall, lower ambient temperatures result in a significant increase in vehicle emissions. The effect of a low-temperature environment on gaseous pollutant emissions mainly occurs in the starting stage, mainly because at this time, the engine temperature is low, friction is high, oil and gas mixing is thicker, and raw engine emissions are high. In addition, in the first few minutes of cold start, the TWC temperature is low and the purification efficiency is poor, which also causes high emissions; as the TWC temperature rises, its catalytic efficiency gradually improves, and the influence of ambient temperature on gaseous pollutant emissions also decreases.
In Figure 5a the CO2 emission factor chart for FV at 23 °C and 6 °C is presented. At 23 °C, the CO2 emissions for the three fuels are relatively close, differing by no more than 5%. Ethanol gasoline shows a slight reduction in emissions. At 6 °C, CO2 emissions are slightly higher than that at 23 °C due to increased fuel consumption caused by low temperatures. This, in turn, leads to an increase in CO2 emissions.
From Figure 5b, it can be seen that the N2O emission factor of gasoline vehicles burning E10 increased by 96.87%, E20 decreased by 10.70% and 11.00% compared to gasoline at 23 °C, and E10 and E20 decreased by 32.87% and 46.00% at 6 °C. N2O is a by-product of the catalytic conversion of gaseous pollutants by the TWC under specific conditions [40,41]. The higher NOX emissions from the E10 and E20 at 23 °C led to an increase in N2O emissions. The higher sulfur content of the E10 in this test delayed the time for the catalytic system to reach its operating temperature, resulting in an increase in N2O emissions, while the E20 showed a significant reduction in N2O emissions due to its low sulfur content and high oxygen content. Engine start-up leads to an increase in N2O emissions [42]. Low ambient temperatures lead to a dramatic increase in N2O emissions at 6 °C.
From Figure 5c, it can be seen that the CH4 emission factors of gasoline vehicles burning E10 and E20 were reduced by 13.44% and 9.47% at 23 °C compared with gasoline, and 15.30% and 1.53% at 6 °C. The CH4 emission factors of the test vehicle tests were closer to the results of Suarez et al. for ethanol gasoline tests of 1–7 mg/km [43], and the high percentage of the advantage of ethanol gasoline on vehicle CH4 emission is not obvious. From Figure 5d, it can be seen that the NMHC emission factors of gasoline vehicles burning E10 and E20 were reduced by 30.91% and 44.13% compared with gasoline at 23 °C, and 3.68% and 14.31% at 6 °C. The trends of NMHC emission and THC emission were similar, and ethanol gasoline can effectively reduce the NMHC emission of vehicles.
From Figure 5e, it can be seen that the GWP emission factors of different fuels are relatively close to each other. Additionally, from Equation (1), it can be seen that the CO2 emission factor is still the main source of the GWP factor and that reducing fuel consumption and improving the thermal efficiency of the engine is still the key to reducing the greenhouse effect in the long term, and the reduction of ambient temperatures makes the GWP factor of the vehicle increase.
The overall emissions of E20 and E10 are better than those of gasoline, the emissions of E20 are relatively lower, and the high proportion of ethanol has a better emission reduction effect on vehicles. Lower ambient temperatures increase the emissions of gasoline, E10, and E20, but the overall emissions of E10 and E20 are lower than gasoline at low ambient temperatures, and lower ambient temperatures also make ethanol gasoline less effective in reducing emissions. The overall emissions of a vehicle burning E10 are higher at 23 °C and 6 °C, and the emissions of E10 are higher than those of gasoline under some working conditions, which is related to the higher sulfur and benzene contents in E10. The overall emission reduction effect of E20 is better (Figure 6).

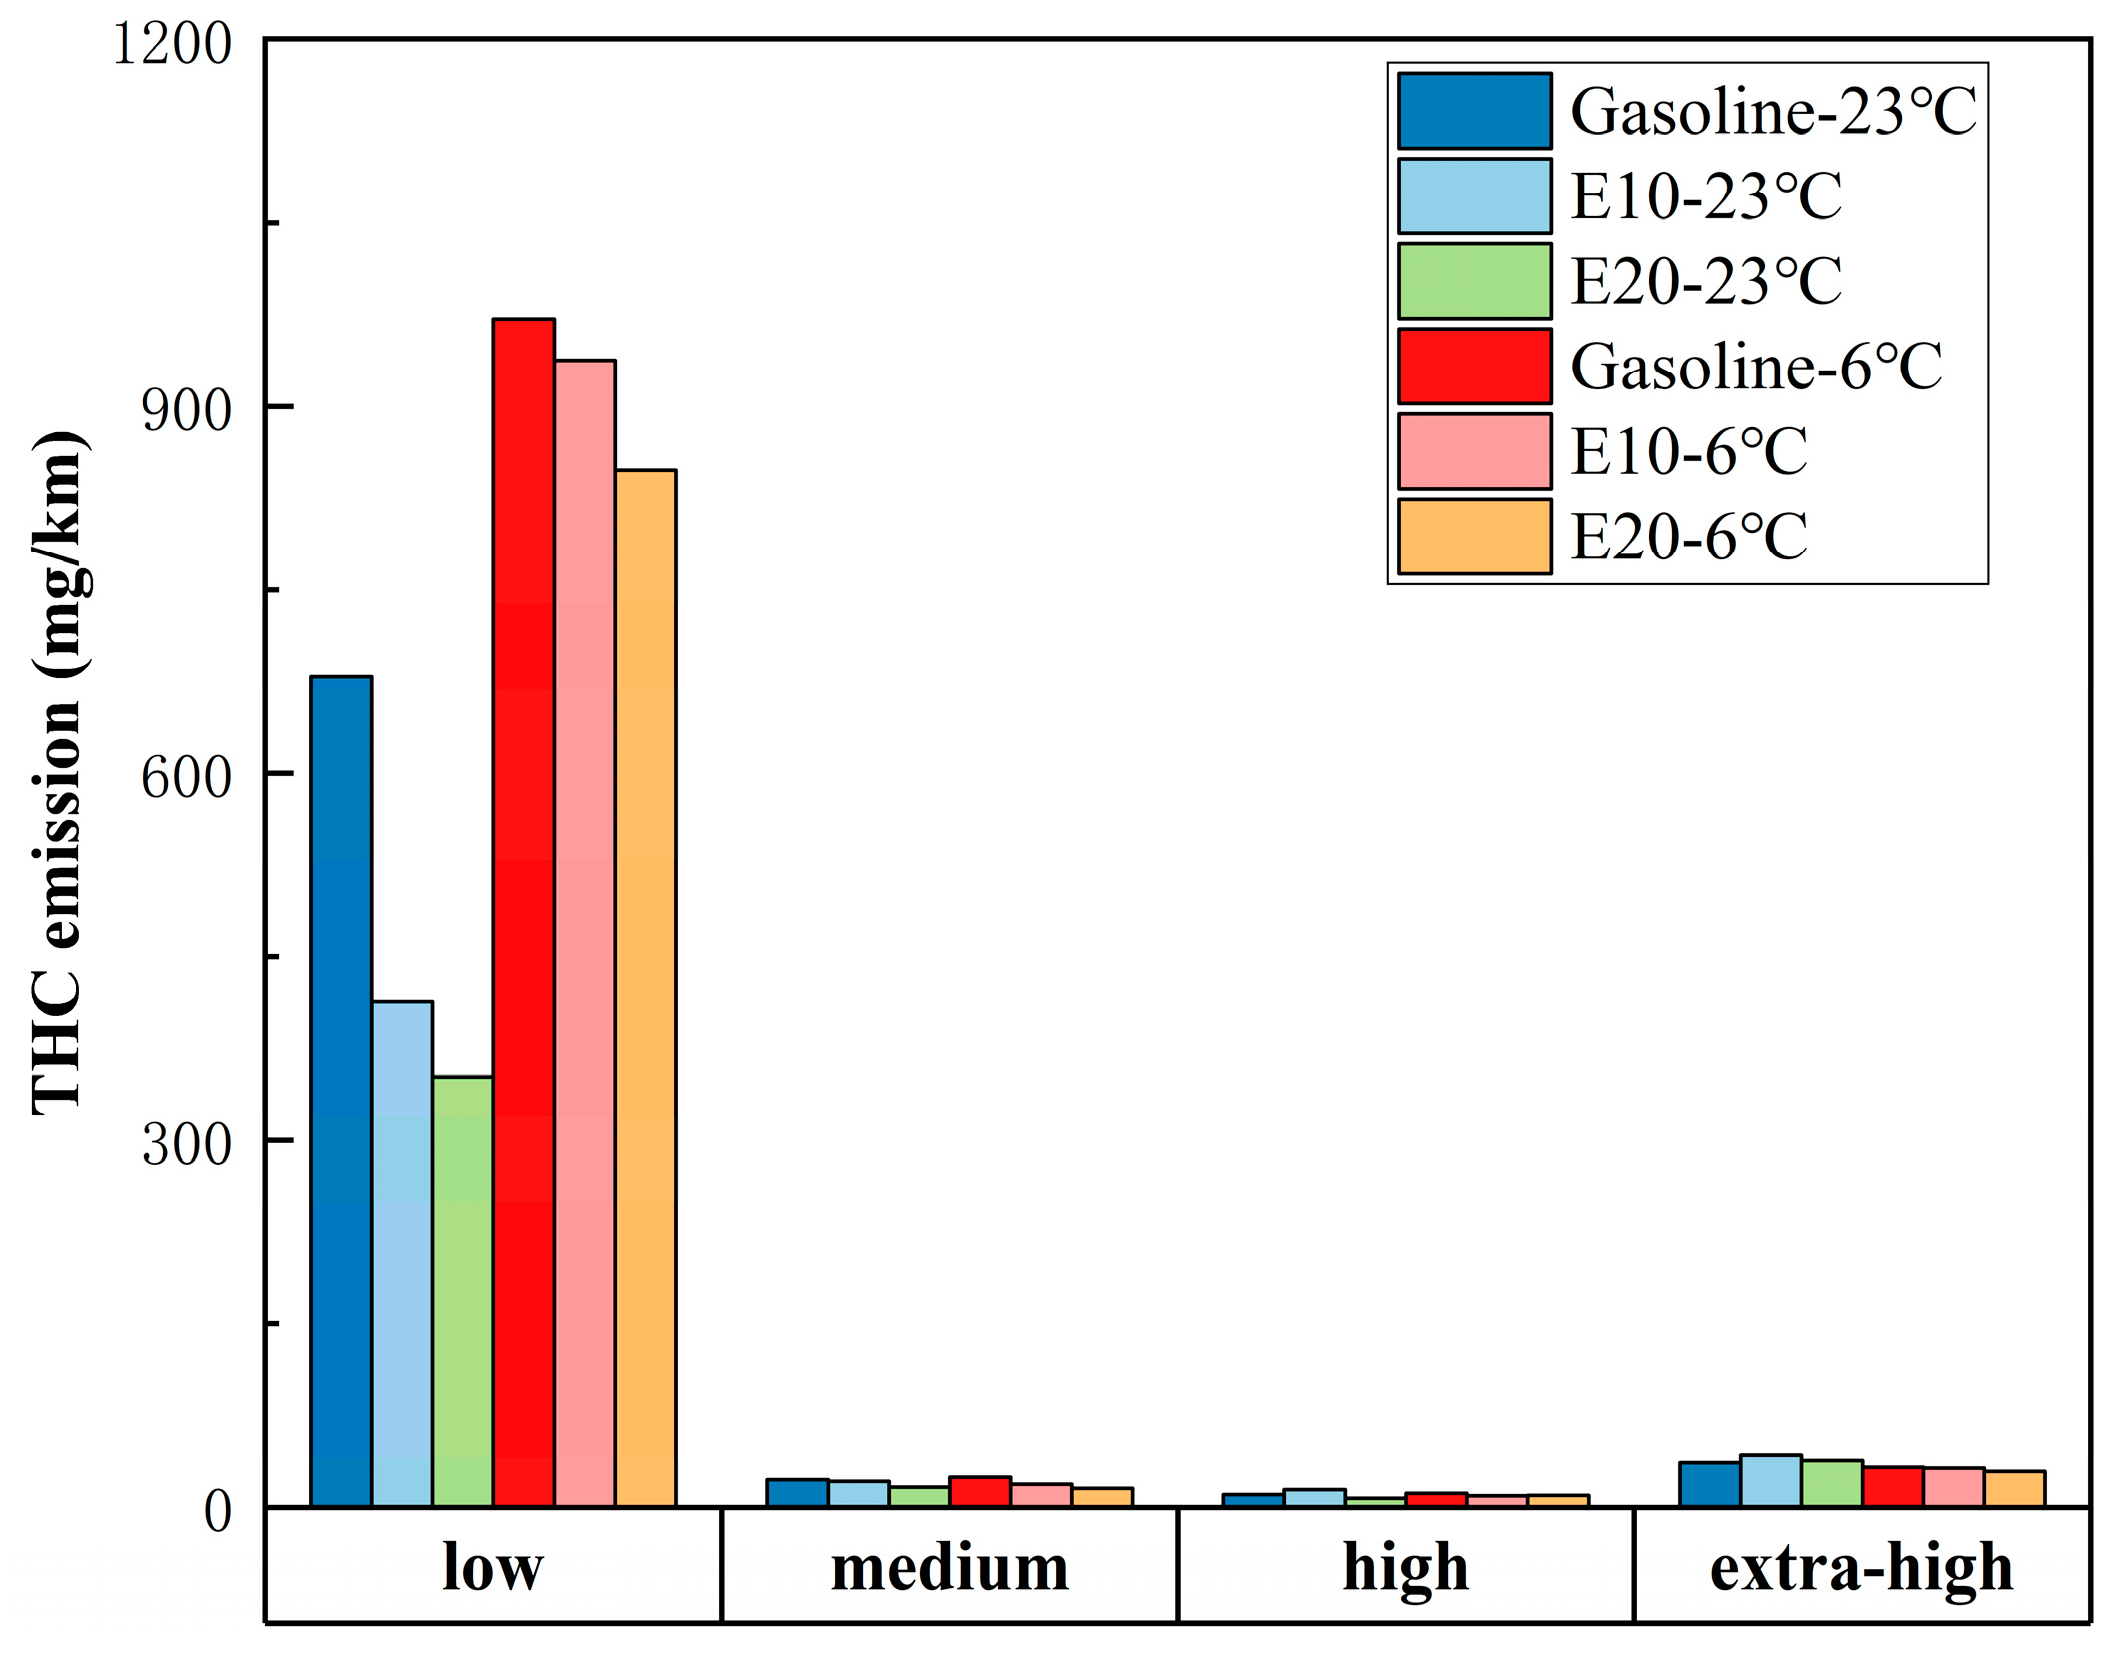
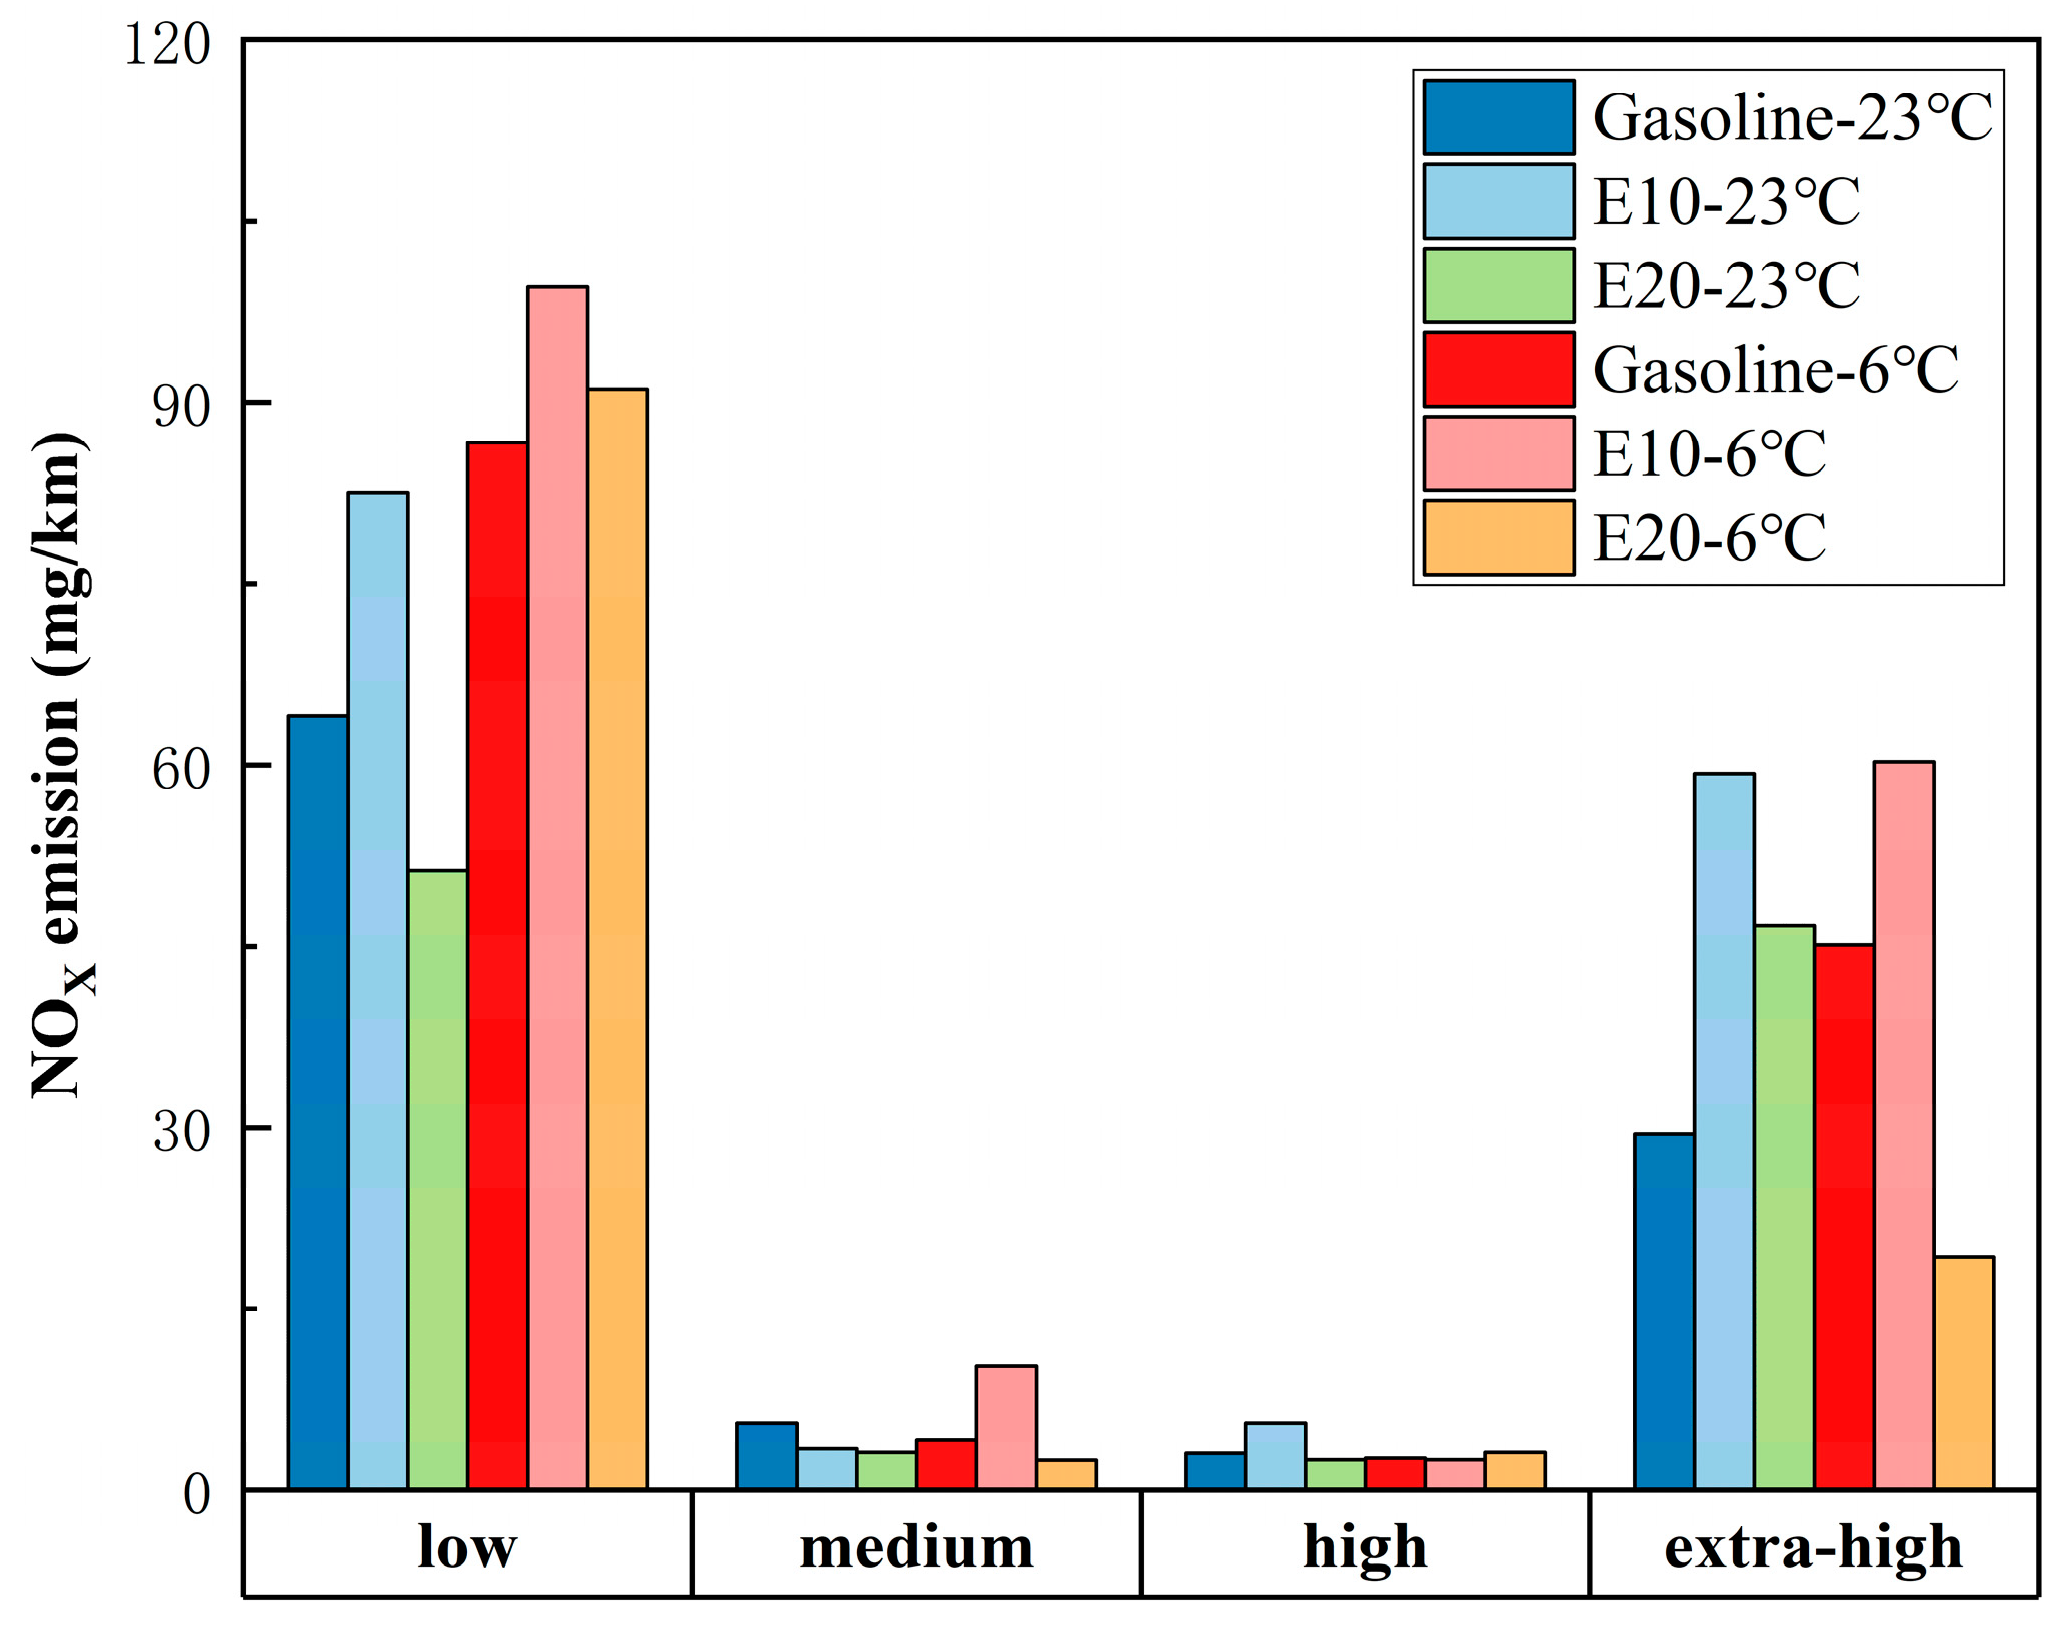
3.2. WLTC Emissions in Different Speed Bands

Vehicle operating speed has a significant impact on vehicle emissions, therefore, this paper analyses and discusses the emissions of FVs burning gasoline, E10, and E20 ethanol gasoline at four speed bands of the WLTC.
From Figure 7, it can be seen that the THC emission factor of the vehicle in the low-speed section is the highest, and the THC emission factors of gasoline vehicles fueled with E10 and E20 in the low-speed section are 39.13% and 48.13% lower than those of gasoline at 23 °C, and 3.47% and 12.75% lower than those of gasoline at 6 °C. Additionally, the higher content of oxygen in ethanol gasoline decreases the emission of THC, which improves the THC emission of the vehicle in the low-speed section at the time of cold start. In the high-speed and ultra-high-speed segments, the THC emission of the vehicle burning E10 is higher than that of gasoline, and factors such as the high aromatic content and benzene content in the fuel led to the increase in THC emission from incomplete combustion, which leads to the higher emissions of E10 than gasoline in this condition. The THC emission factors of gasoline, E10, and E20 in the low-speed segment at 6 °C increase by 292.099 mg/km compared to 23 °C (42.99%), 524.26 mg/km (126.77%) and 495.254 mg/km (140.545%), respectively, at 6 °C. The higher the proportion of ethanol, the greater the increase, and the weaker the emission reduction effect of ethanol gasoline at low temperatures.
As can be seen from Figure 8, the CO emission is higher in the low and high-speed sections, and relatively lower in other speed sections. The CO emission factors of E10 and E20 in the low-speed section at 23 °C are 60.66% and 61.00% lower than that of gasoline, while the emissions of E10 and E20 are close to each other. The high content of oxygen and the higher combustion and flame propagation speeds of ethanol in ethanol gasoline helps to reduce the CO emission of the vehicle in the low-speed section. The CO emission of E10 and E20 is higher than that of gasoline in the ultra-high-speed section because the vehicle traveling speed is higher in this stage, the engine is under high load conditions, and the low calorific value of E10 and E20 will increase the fuel injection of the engine, which leads to an increase in CO emissions. The CO emission factor of the vehicle in the low-speed section is higher than that of 23 °C at 6 °C, but that of the high-speed section is lower than that of 23 °C at 6 °C. A lower ambient temperature still makes the vehicle CO emission increase, and the CO emission of E20 is higher than that of E10 in the low-speed section. Ethanol gasoline has a high boiling point, slow gasification rate, lower mixture formation rate and combustion rate than gasoline, and worse sensitivity to ambient temperature, thus leading to the increase in the emission of the high proportion of ethanol gasoline in the start-up of the low-speed section.
As can be seen in Figure 9, the NOX emissions from the vehicle are higher in the low and ultra-high-speed segments, and E10 has the highest emissions in these two speed segments due to the aromatic and sulfur content of the fuel; E20 has higher NOX emissions than gasoline in the ultra-high-speed segment, but lower than gasoline in all other speed segments. The NOX emissions from gasoline combustion in the vehicle at 6 °C and the NOX emissions from E10 and E20 in the low-speed segment at 6 °C compared to those at 23 °C increased by 22.592 mg/km (35.28%), 17.016 mg/km (20.63%), and 39.841 mg/km (77.76%), respectively, at 6 °C. The NOX emission in the low-speed band increases due to the decrease in the ambient temperature, the poor efficiency of the aftertreatment system caused by the cold start under the low ambient temperature, and the increase in the fuel consumption and the incomplete combustion also contribute to the increase in NOX emission. However, the NOX emissions of gasoline, E10, and E20 in the ultra-high-speed section at 6 °C were reduced by 3.852 mg/km (3.47%), 10.492 mg/km (13.33%), and 8.961 mg/km (13.57%), respectively, compared with those at 23 °C, i.e., analyzed as a whole, the low temperature exacerbated the NOX emissions of the vehicle in the low-speed section and reduced the NOX emissions of the vehicle in the NOX emission in the ultra-high-speed segment, and ethanol gasoline is more affected by the reduction in ambient temperature than gasoline.
From Figure 10, it can be seen that the PN emission factor of the vehicle in the low-speed section is the highest, and the PN emission factors of E10 and E20 are 50.44% and 69.91% lower than those of gasoline, respectively, and the ethanol gasoline, with its high oxygen content and high vapor pressure, can effectively inhibit the generation of particulate matter in the low-speed section. The PN emission factors of gasoline, E10, and E20 in a vehicle at an ambient temperature of 6 °C increased by 2.11 × 10¹¹/km (17.92%), 8.94 × 10¹¹/km (110.10%), and 9.029×10¹¹/km (125.60%), respectively, compared with those at 23 °C. The change in the vapor pressure of ethanol with the decrease in ambient temperature is larger than that of gasoline. Ethanol results in poorer mixture homogeneity and fuel quality compared to gasoline, which leads to a greater increase in PN emissions from ethanol gasoline when the ambient temperature decreases.
In conclusion, the emissions of the test vehicles are mainly concentrated in the low-speed section. E10 and E20 effectively reduce the emissions of the vehicles in the low-speed section, and the high oxygen content of ethanol gasoline helps to improve the combustion conditions of the vehicles in the low-speed section during cold start. The emissions of E10 and E20 are higher than those of gasoline in the ultra-high-speed section, and the high engine load and low calorific value of ethanol gasoline in this stage led to the deterioration of the combustion conditions and an increase in the emissions. Lower ambient temperatures increase vehicle emissions, except for CO; the vehicle emissions at 6 °C have a significant increase compared to 23 °C. Compared to gasoline, E10 and E20 are more susceptible to the lower ambient temperature causing the emissions to increase. As the ambient temperature decreases, ethanol gasoline’s advantage of reducing vehicle emissions is reduced; from the analysis of the speed band, an ambient temperature decrease increases the vehicle emissions in the low-speed band, but it will reduce the vehicle emissions in the ultra-high-speed band. The speed band analysis shows that lower ambient temperatures increase vehicle emissions in the low-speed band, but decrease vehicle emissions in the ultra-high-speed band.

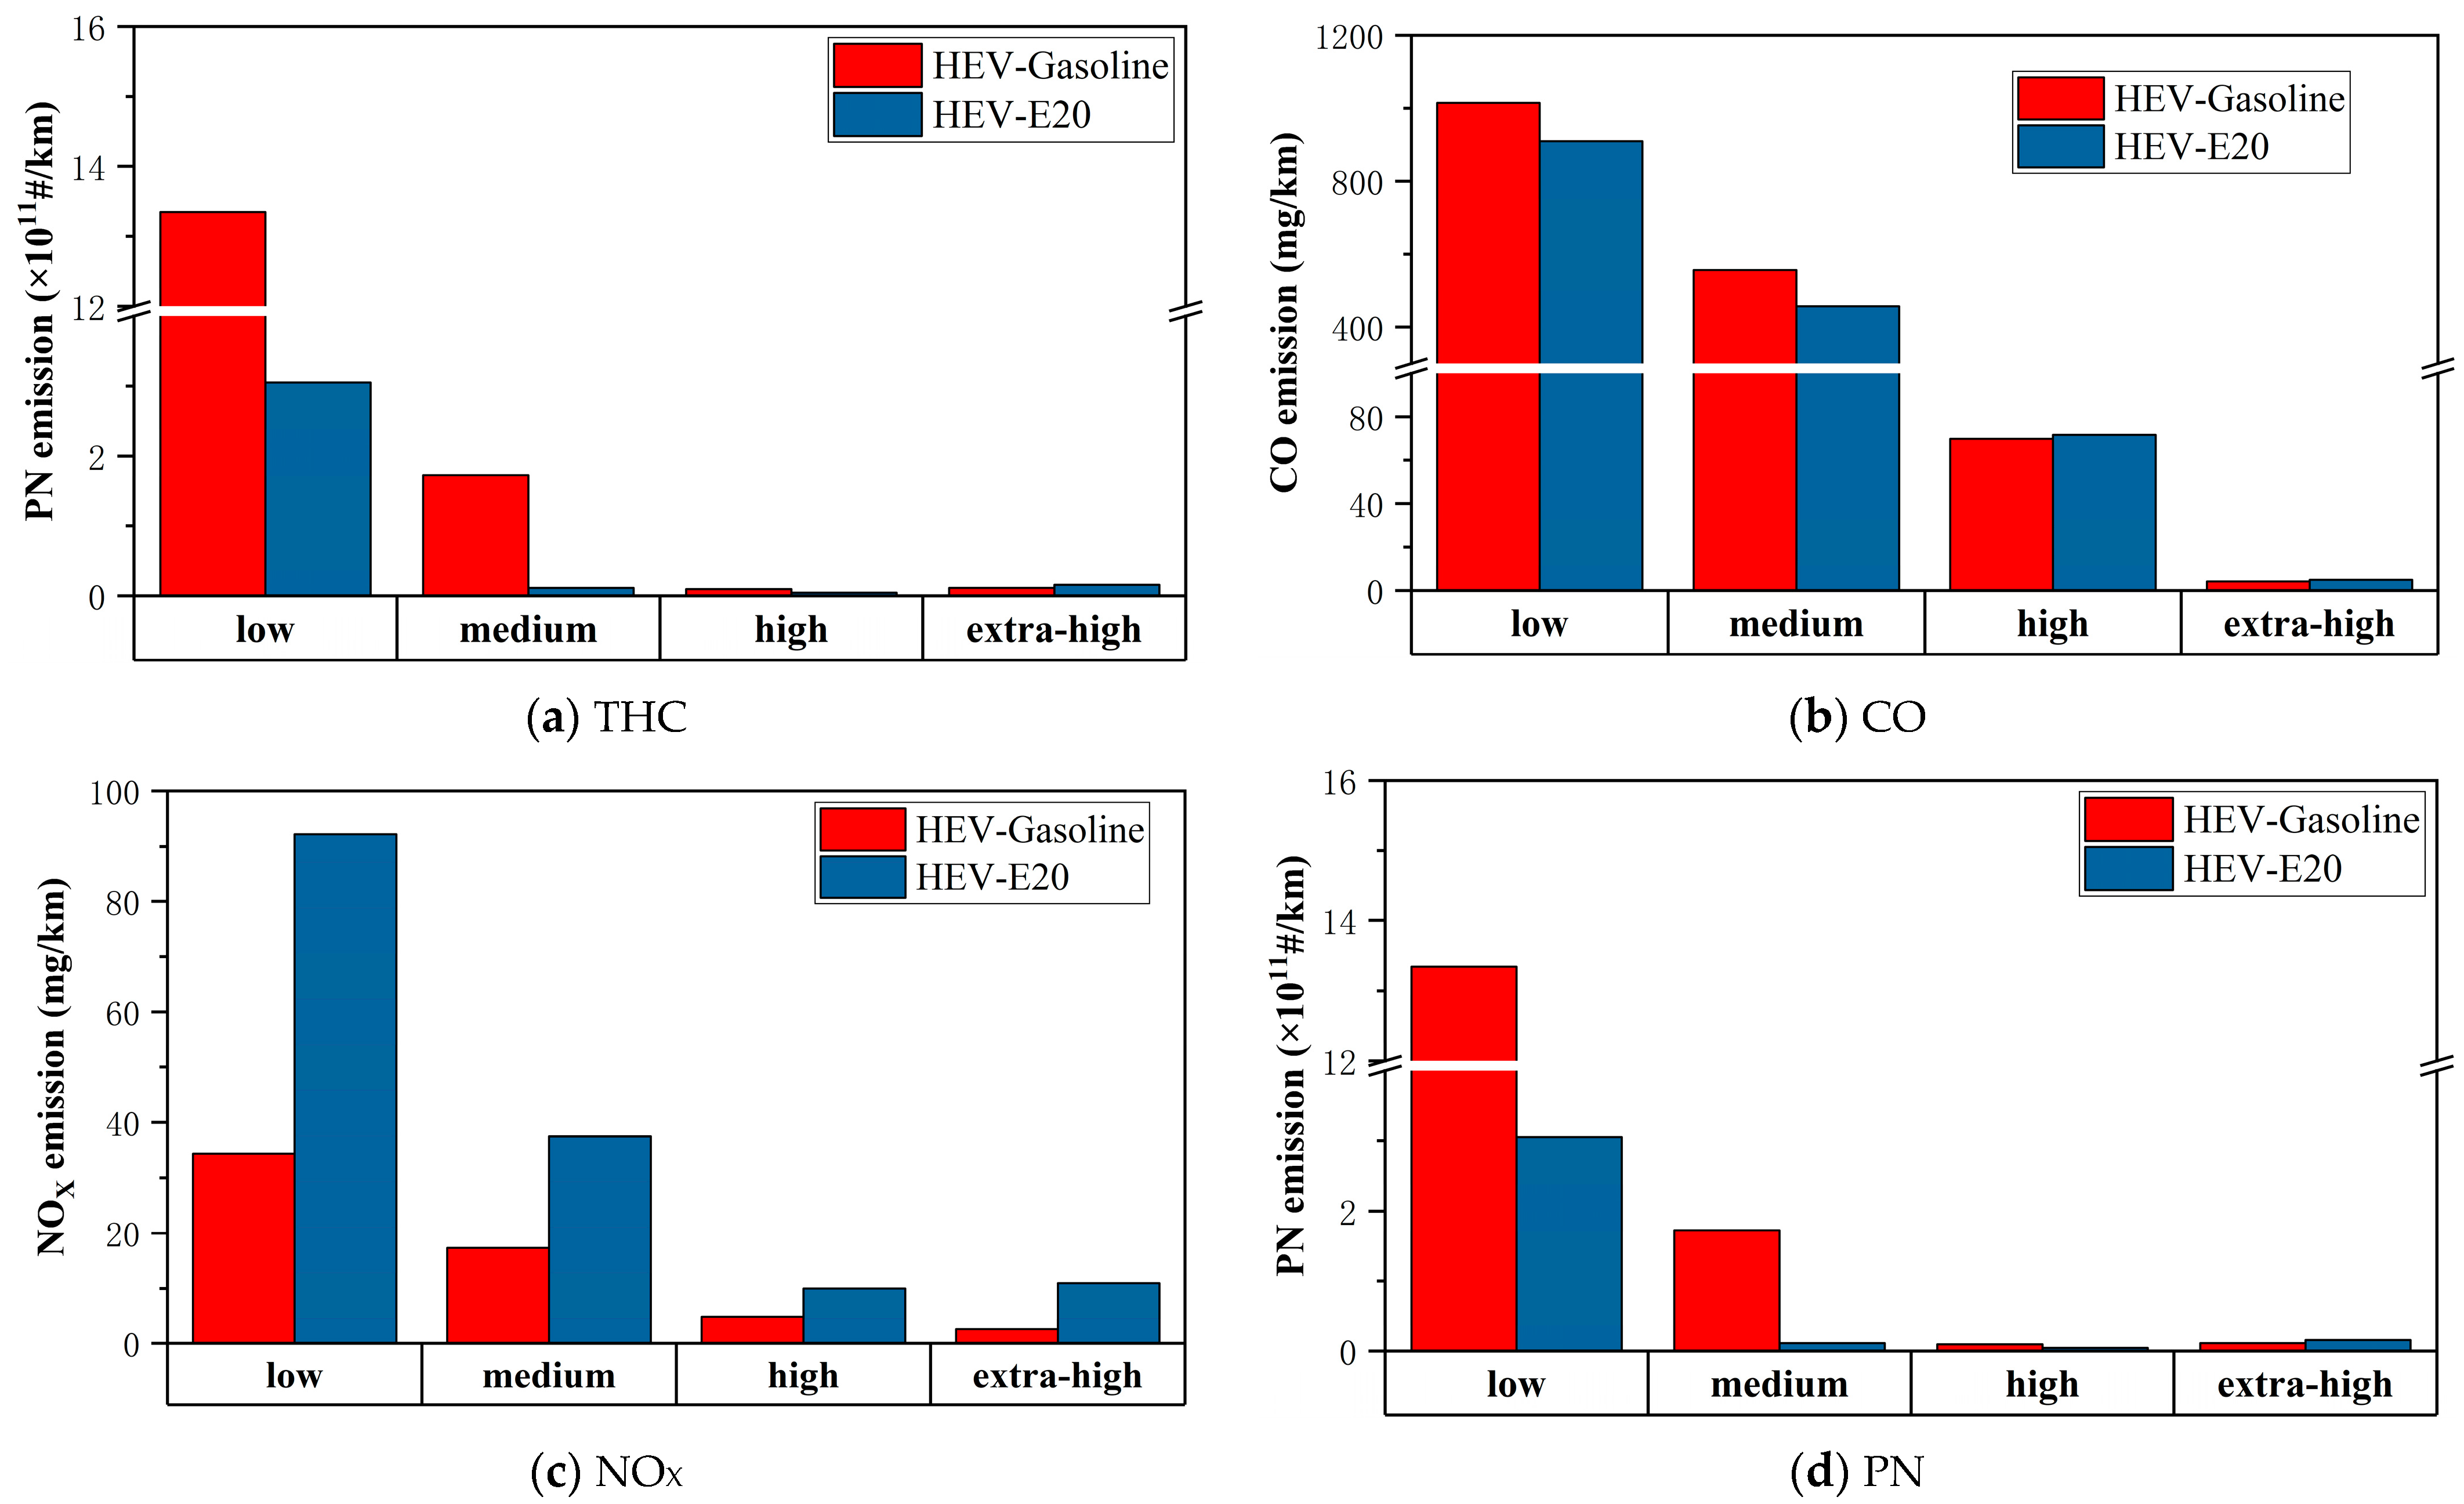
3.3. Emissions from the Combustion of E20 Ethanol Gasoline in Hybrid Vehicles

A comparison of tests on vehicles fueled with E10 and E20 at different ambient temperatures showed that the emissions of E20 were overall superior to those of gasoline and E10 and that the emissions of the hybrid vehicle were also superior, so gasoline and E20 were fueled on a hybrid vehicle and the WLTC cycle was carried out on a full vehicle rotating hub test rig.
From Figure 11, it can be seen that E20 has a better emission reduction effect in hybrid vehicles, and most of the pollutant emissions are lower than that of gasoline, in which the emission factors of THC, CO, PN, and PM are reduced by 25.28%, 12.72%, 77.34%, and 64.59%, respectively; the emission factors of NOX, CH4, and N2O are increased by 155.33%, 43.24%, and 36.23%, respectively; and the CO2 emission factors do not change much. The hybrid vehicle has a certain reduction in vehicle emissions due to the proper intervention of its electric motor.
Figure 12 shows the emission factor of conventional emissions of hybrid vehicles burning gasoline and E20. From Figure 12a, it can be seen that the vehicle burning E20 in the low-speed section reduced the THC emission factor by 38.65% compared to gasoline. E20 reduced the vehicle in the moment of start-up and low-speed section of the THC emissions but exacerbated the vehicle in the medium-speed section, high-speed section, and ultra-high-speed emissions. From Figure 12b, it can be seen that hybrid vehicle E20 combustion reduces CO emissions in the speed section and medium-speed section, the emissions in the high-speed section and ultra-high-speed section are close to each other, and the CO emissions of the hybrid vehicle are lower in the ultra-high-speed section of the high-speed section and the high-speed section. From Figure 12c, it can be seen that NOX emissions of the hybrid vehicle combustion E20 are higher than that of gasoline in all speed sections, the oxygen content of E20 is higher, and the high oxygen content contributes to the generation of NOX, which leads to the increase in the emissions and the increase in the emissions of the gasoline vehicle. The emission trend of E20 and gasoline is the same, but the increasing trend is higher than that of gasoline vehicles, and the use of ethanol gasoline in hybrid vehicles will exacerbate the NOX emission of the vehicles. From Figure 12d, it can be seen that the PN emission of E20 combusted in hybrid vehicles in the low-speed and middle-speed bands is much lower than that of gasoline, with a decrease of 77.1% and 93.47%, respectively, which has an obvious effect on emission reduction.
Overall, E20 in hybrid vehicles is effective in reducing conventional emissions, and the high oxygen content of E20 helps to reduce CO, THC, and PN emissions but exacerbates NOX emissions. The experimental vehicles emit the largest proportion of emissions in the low- and medium-speed bands and the use of E20 in hybrid vehicles reduces the emissions in these two speed bands; the emissions of hybrid vehicles using E20 are higher than those of gasoline in the high-speed and ultra-high-speed bands, but the emissions in these two speed bands are lower overall, and, therefore, do not have much impact on the overall trend.
Figure 13 shows that the overall emission reduction coefficient of hybrid vehicles using E20 is not as good as that of FVs, the emission reduction coefficients of THC, NOX, CH4, and N2O are lower than that of FVs, and the emission reduction coefficients of PM and PN are higher than that of FVs. Combustion of E20 in hybrid vehicles can effectively reduce particulate emissions, and the emission reduction effect is better than that of gasoline vehicles. The emission reduction effect of other emissions is not as good as that of gasoline vehicles, and the emissions of hybrid vehicles are lower. Hybrid vehicles have frequent start-stop conditions, which on the whole results in the emission reduction coefficient of other emissions being lower than that of gasoline vehicles. The engine power of hybrid vehicles is generally smaller and due to the battery system its weight will be larger. The specific power of hybrid vehicles (54 Kw/t) is smaller than the specific power of gasoline vehicles (67 Kw/t), therefore, in the same driving conditions of the emissions of the engine load are greater. The calorific value of E20 is lower than that of gasoline and it is easier to have incomplete combustion, resulting in an increase in the overall emissions. Although the emission reduction coefficient of hybrid vehicles is not as good as that of gasoline vehicles, the emission reduction coefficient of conventional emissions is positive, i.e., the combustion of E20 can effectively reduce the conventional emissions of the vehicle. For non-conventional emissions, the combustion of E20 in hybrid vehicles makes the emission of CH4 and N2O increase, which should be given special attention in subsequent applications.

4. Conclusions

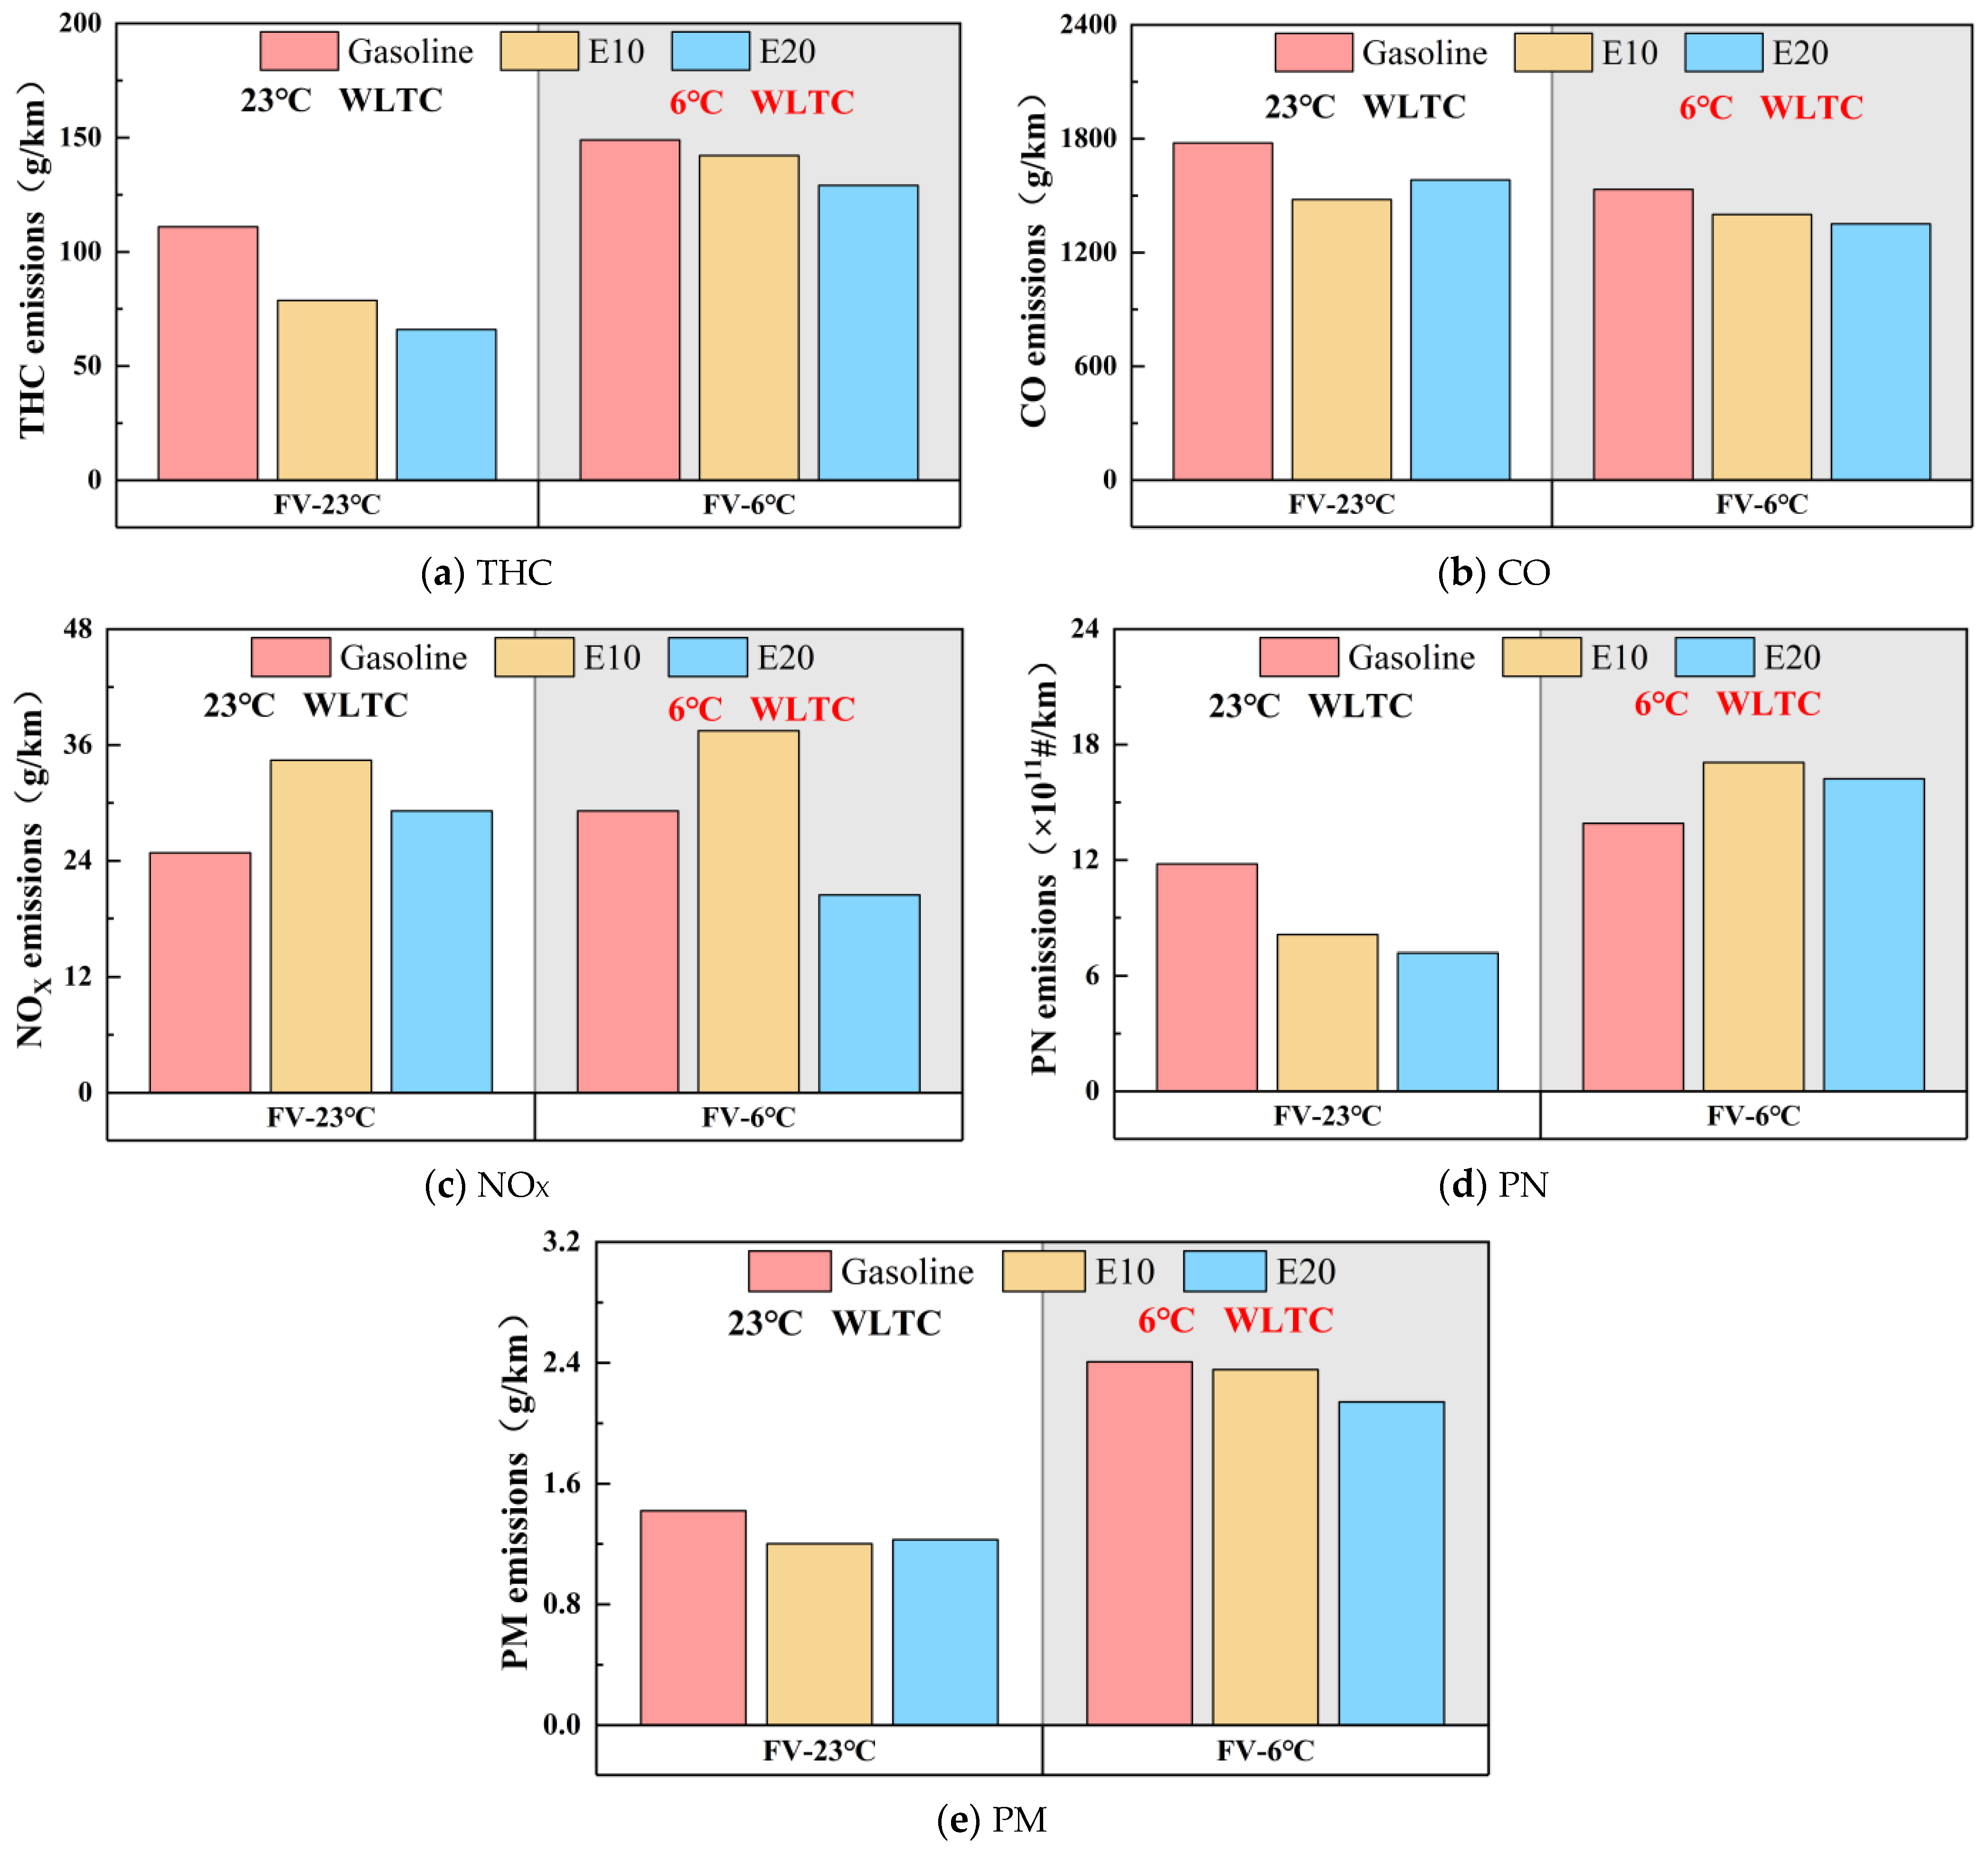
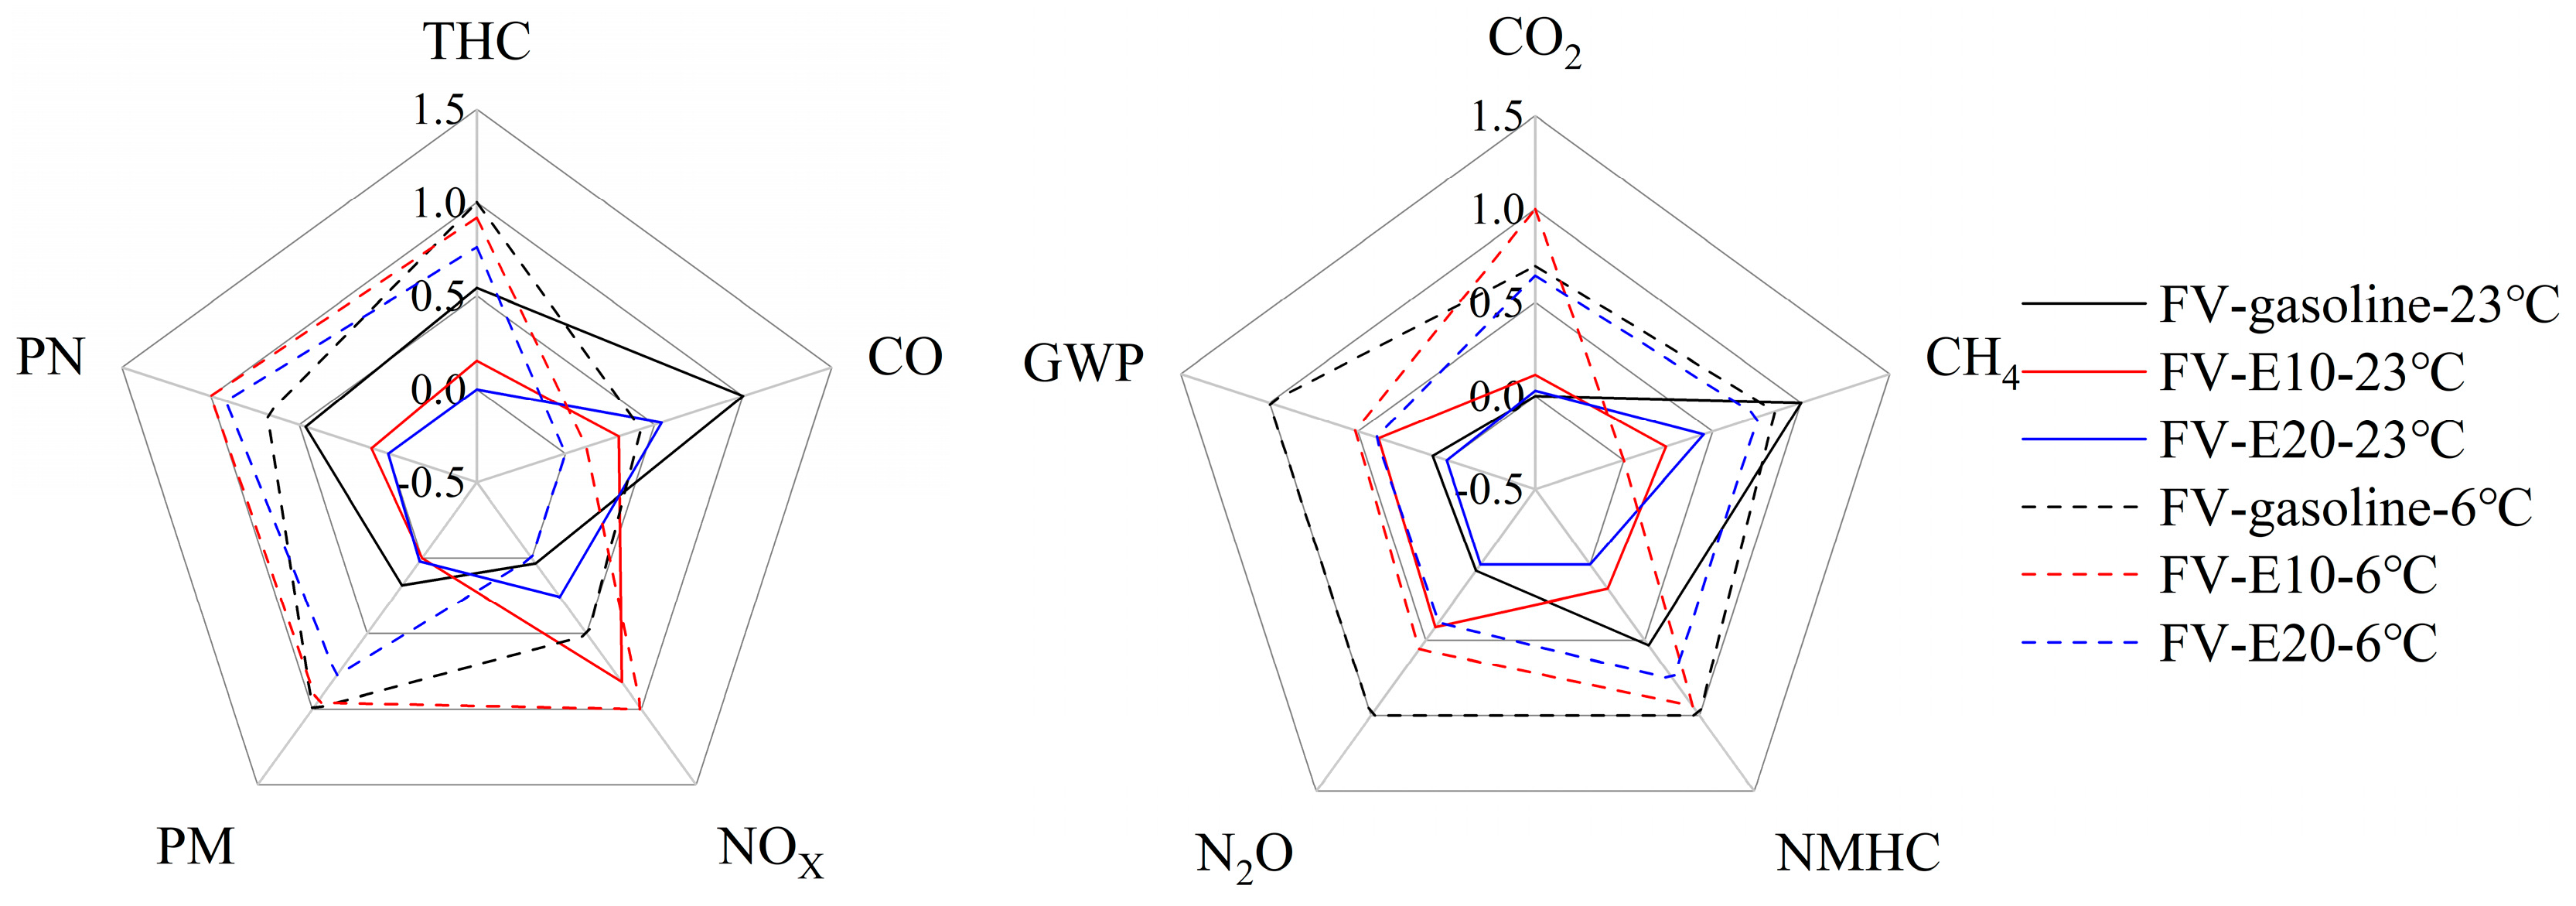
  • The use of E10 and E20 in FVs effectively reduces the conventional emissions of the vehicles: at 23 °C, E10 and E20 reduce the conventional emissions (THC, CO, NMHC, PM, PN) by 15.40–31.11% and 11.00–40.51%, but increase NOX emissions by 63.42% and 17.86%; at 6 °C, E10 and E20 reduce the conventional emissions (THC, CO, PM) by 2.15–8.61% and 11.02–13.34%, but increase PN emissions by 44.75% and 37.56%. At 6 °C, E10 and E20 reduced the conventional emissions (THC, CO, PM) by 2.15–8.61% and 11.02–13.34%, but increased the PN emissions by 44.75% and 37.56%. Overall, the emission reduction effect of E20 is better than that of E10, but the emission reduction effect of ethanol gasoline for conventional emissions is reduced at low temperatures.
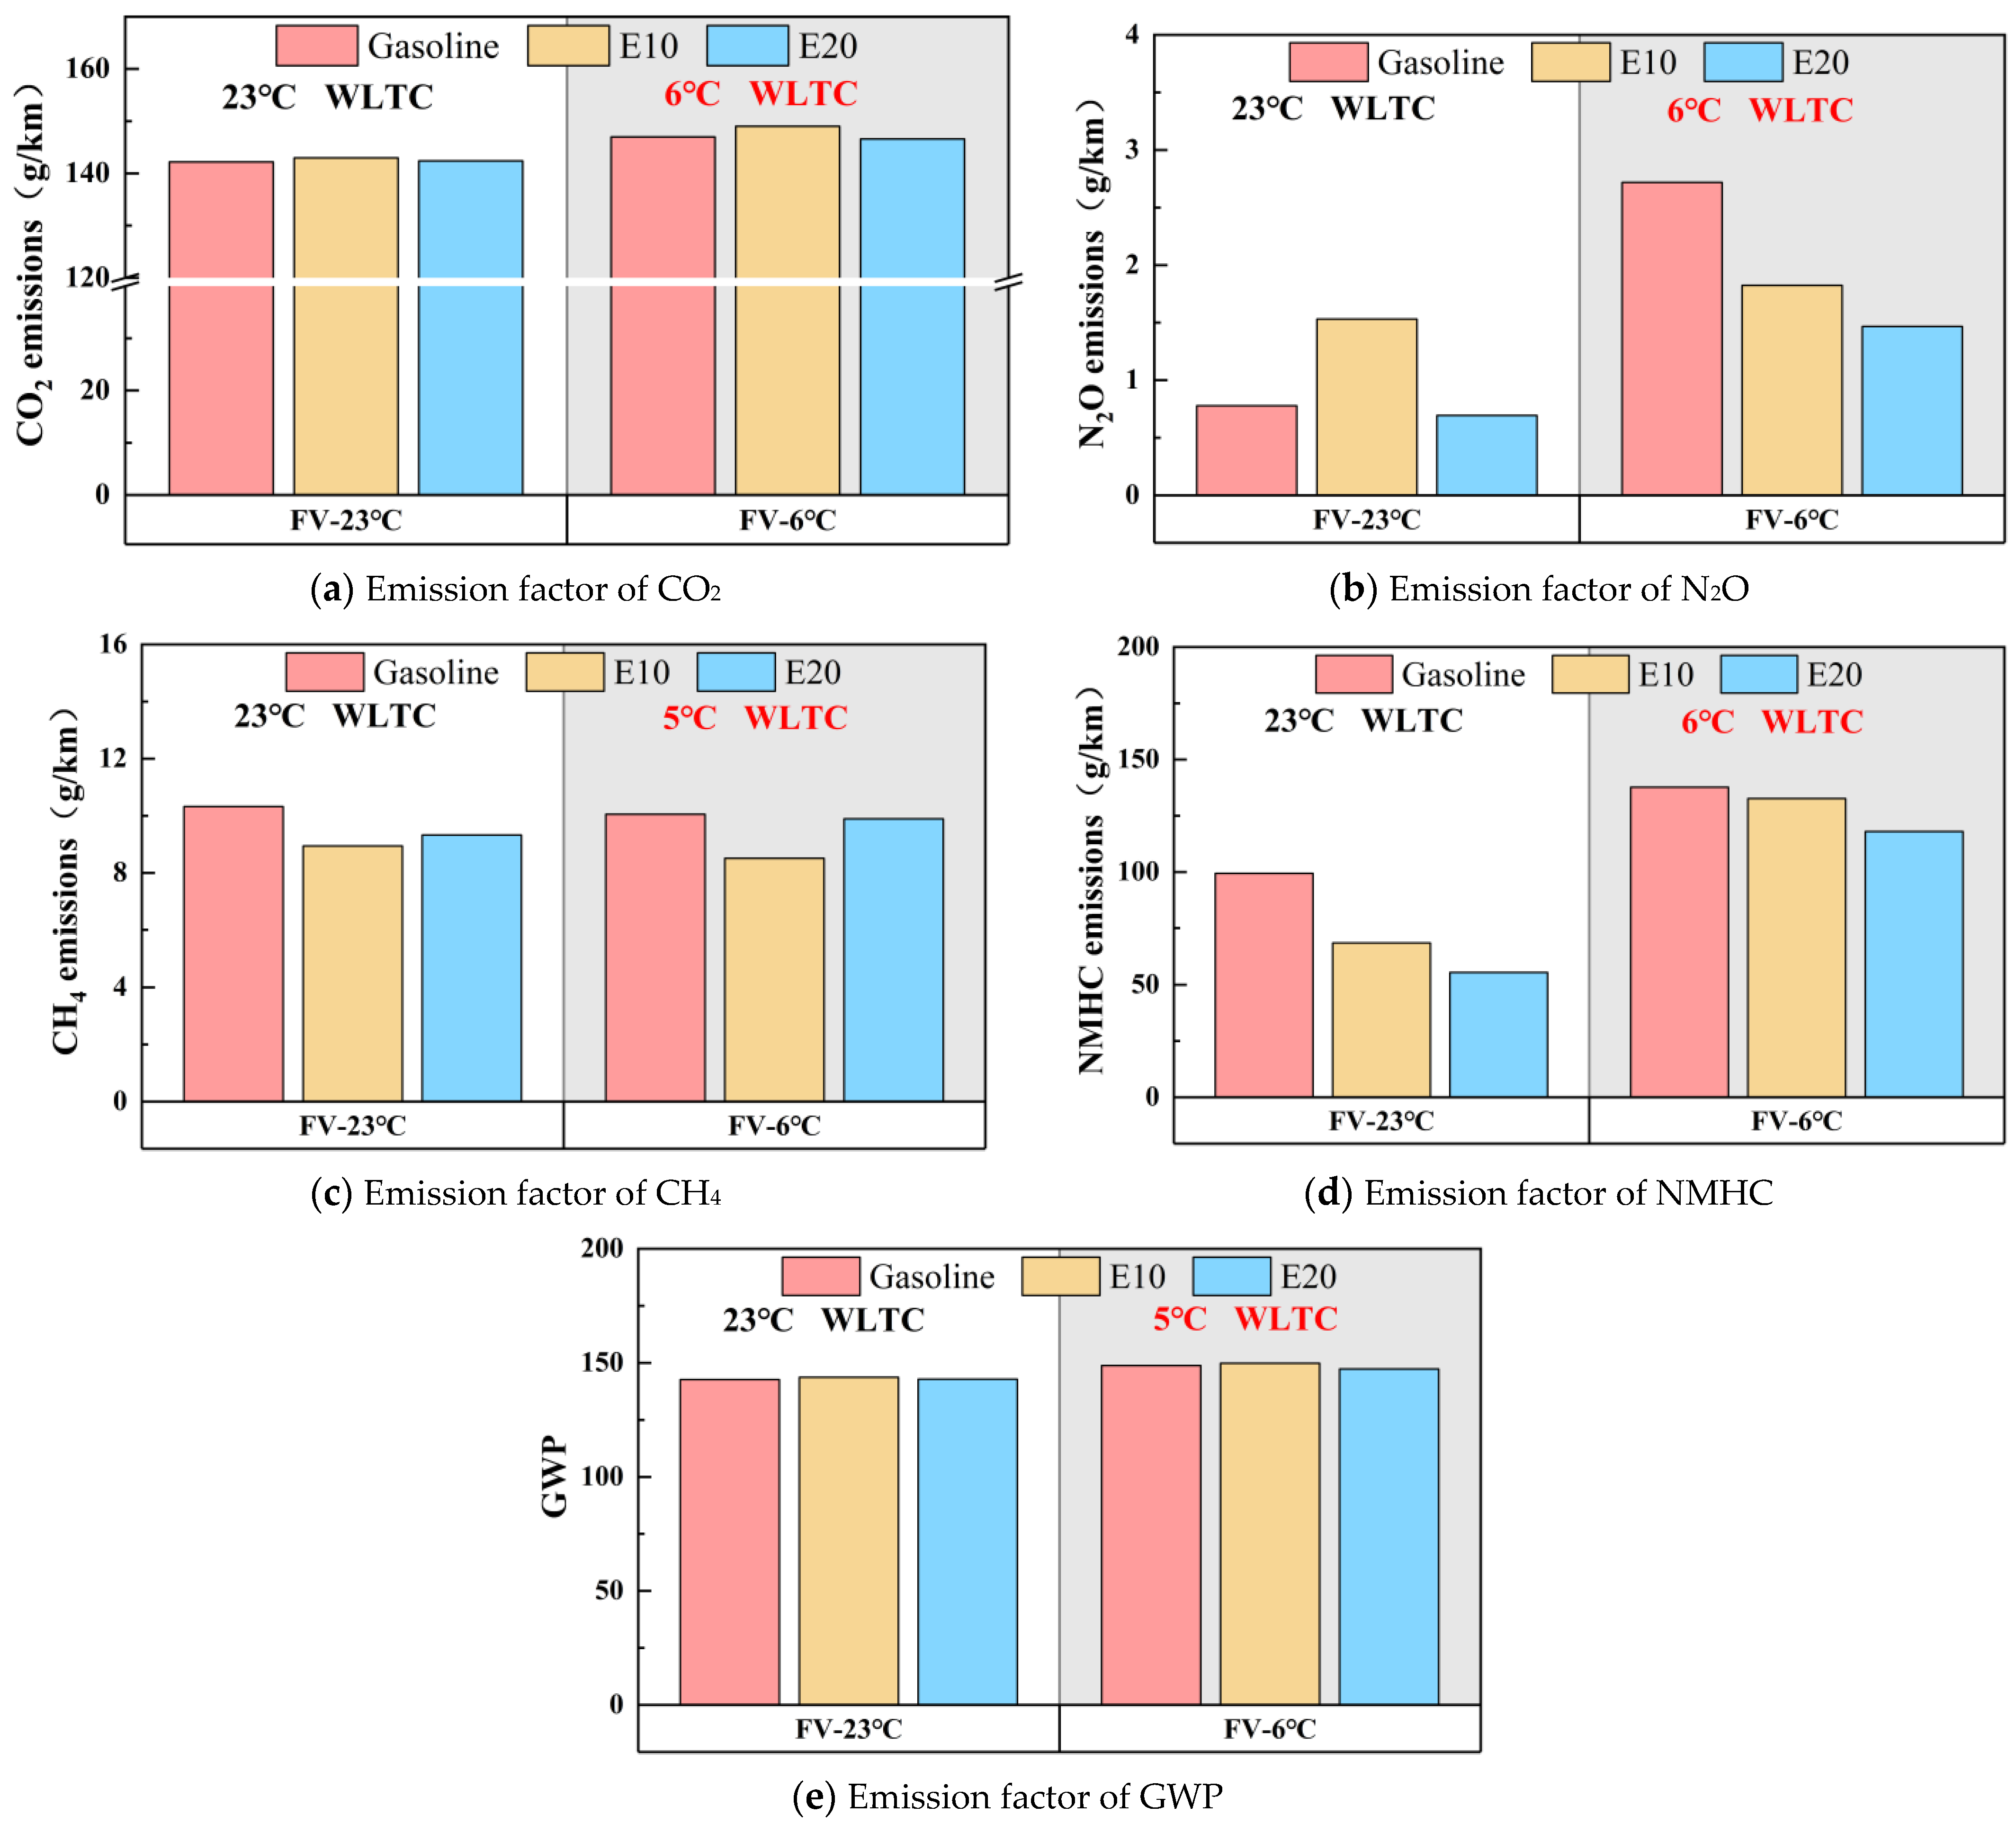
  • Gasoline vehicles burning E10 and E20 do not have a significant trend in reducing the non-conventional emissions (CH4, N2O, CO2) of the vehicles. At 23 °C, E10 and E20 reduce CH4 emissions by 3.44% and 9.47%. E10 and E20 do not have the same trend in N2O emissions, in which E10 increases N2O emissions by 96.87%, and E20 reduces them by 10.70%. The CO2 emissions were close, and the CO2 emissions of E10 and E20 were slightly higher than that of gasoline; at 6 °C, E10, and E20 made the CH4 emission decrease by 15.30% and 1.53%, the N2O emission decrease by 32.87% and 46.00%. The CO2 emissions were close, and the CO2 emissions of E20 were slightly lower than that of gasoline, and the emission reduction of E20 was overall better than that of E10. The overall emission reduction effect of E20 is better than that of E10.
  • A lower ambient temperature increases vehicle emissions. Except for CO, vehicle emissions at 6 °C increase significantly compared to 23 °C. Compared to gasoline, E10 and E20 are more susceptible to lower ambient temperatures making the emissions increase. As the ambient temperature decreases, ethanol gasoline’s advantage for vehicle emissions reduction is reduced; analyzed from the speed band, lower ambient temperatures increase the emissions of the vehicle in the low-speed band, but it will lower the vehicle emissions in the ultra-high-speed range.
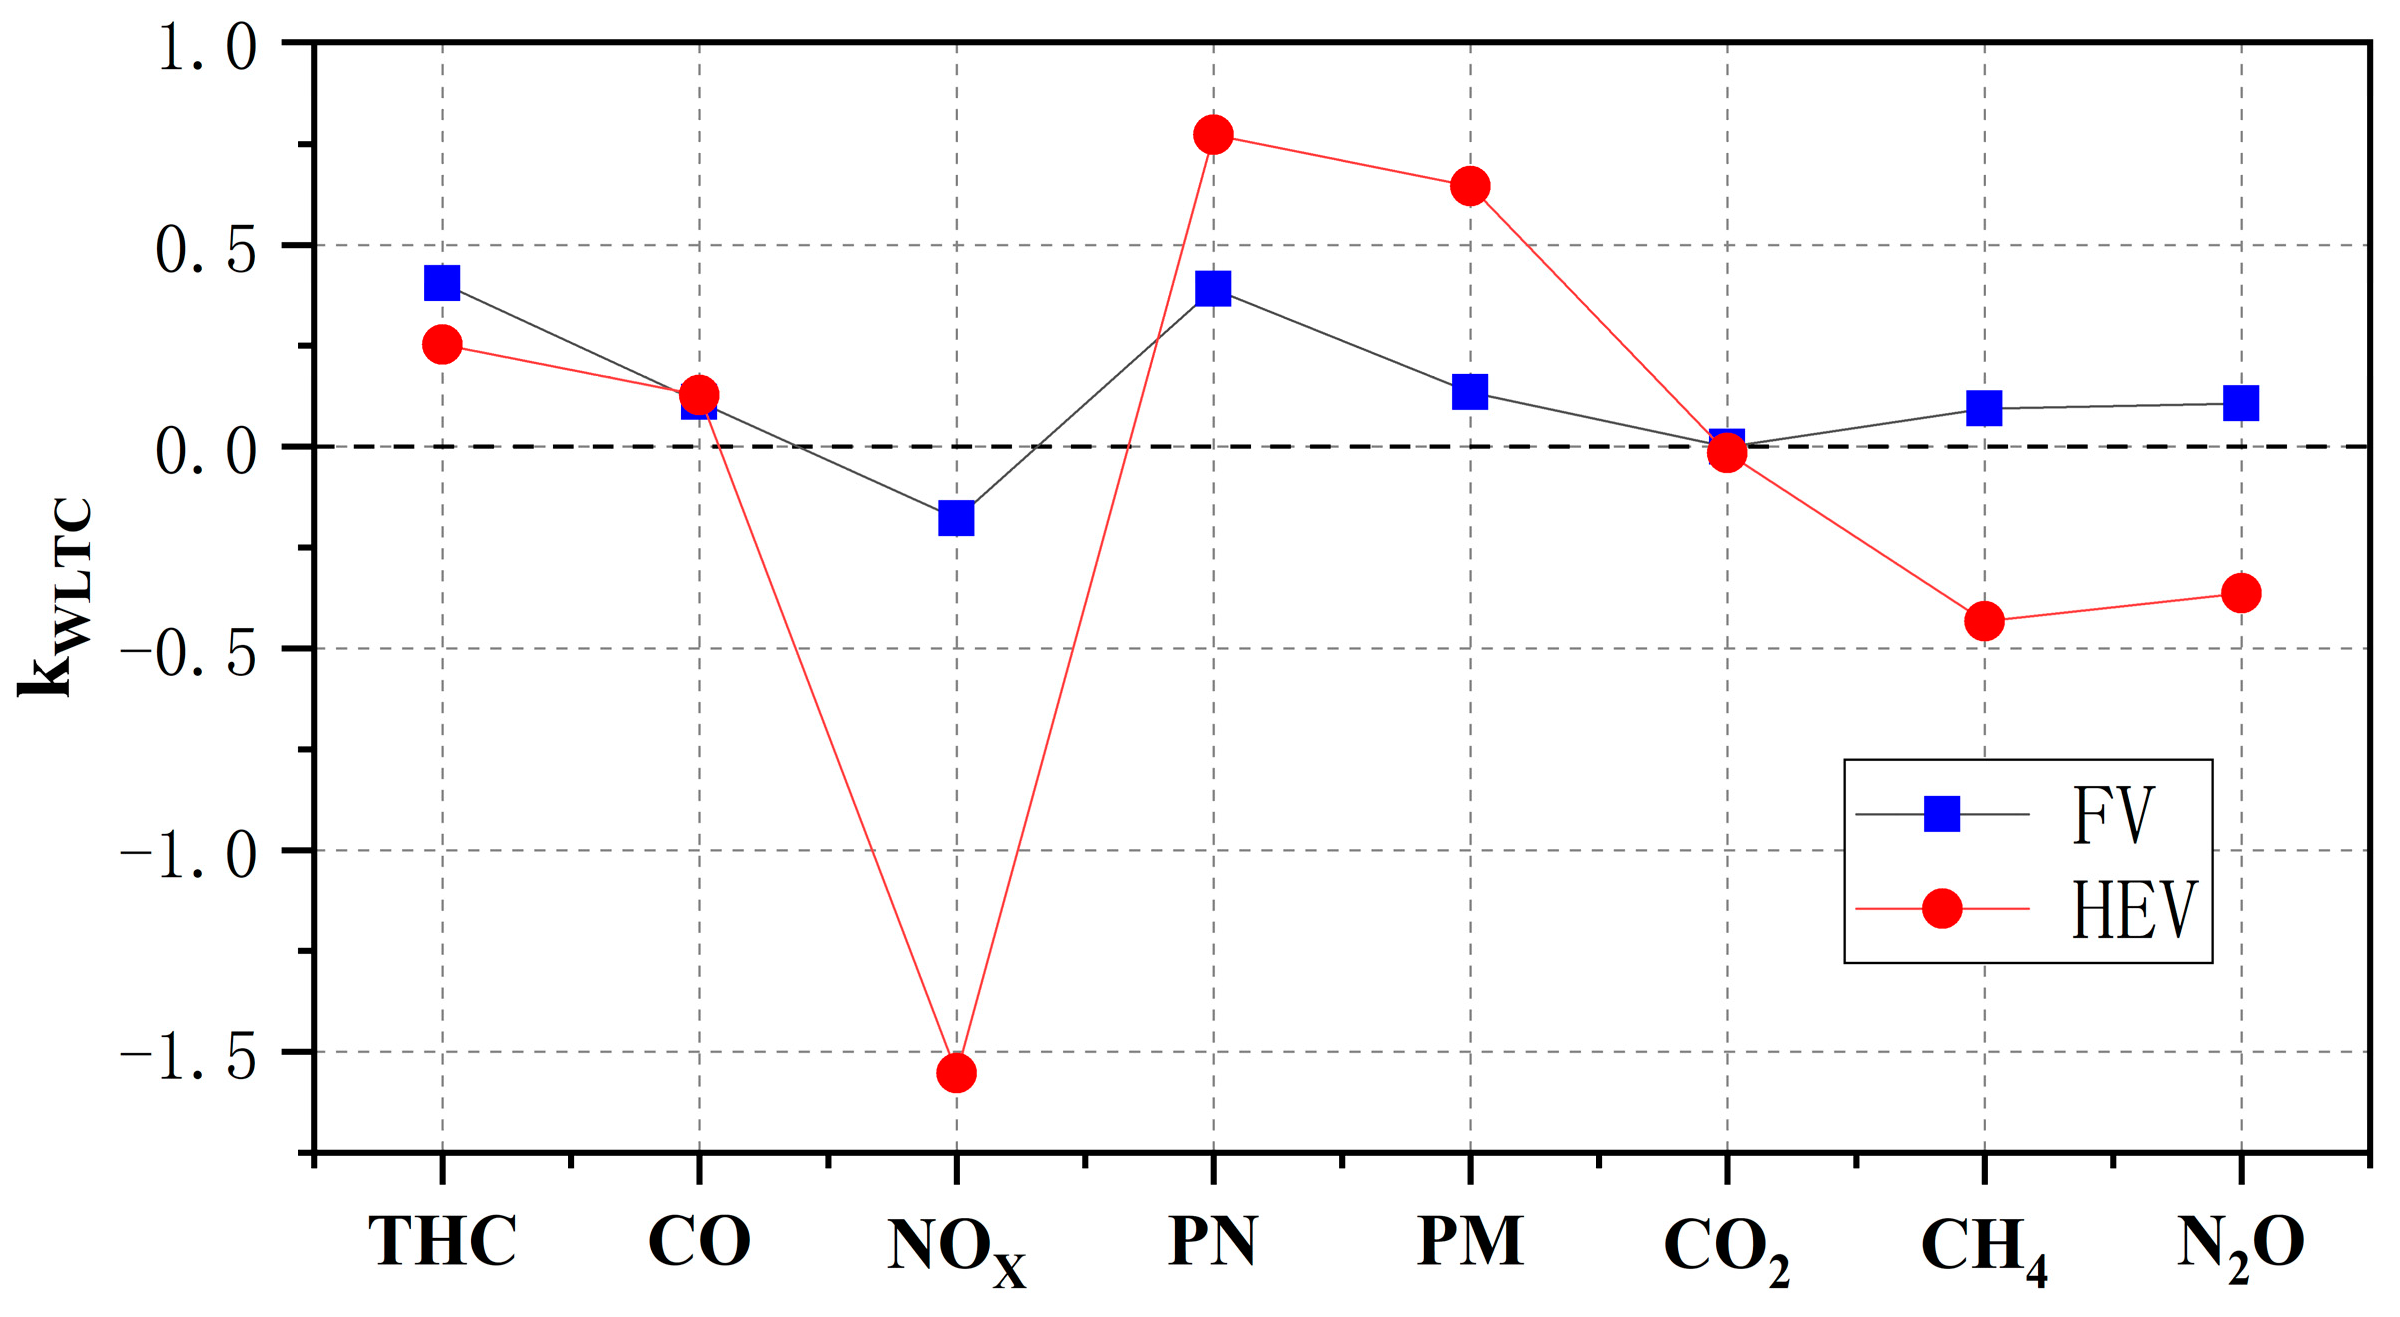
  • The emissions of THC, CO, PN, and PM from hybrid vehicles burning E20 are reduced by 25.28%, 12.72%, 77.34%, and 64.59% compared with those of gasoline, but the emissions of NOX, CH4, and N2O appear to increase, and hybrid vehicles burning E20 can further reduce the emissions efficiently; the comparison of the emission reduction effects of hybrid vehicles burning E20 and gasoline vehicles burning E20 shows that the emission reduction effects of other emissions are not as good as those of gasoline vehicles. A comparison of the emission reduction effect of hybrid vehicles using E20 and gasoline vehicles using E20 shows that the reduction effect of particulate matter of hybrid vehicles is better, and the reduction effect of other emissions is not as good as that of gasoline vehicles.
  • In summary, compared with gasoline, vehicle emissions can be effectively reduced by burning E10 and E20. At room temperature, the promotion of E10 and E20 ethanol gasoline can effectively reduce vehicle emissions. However, in low-temperature areas, the emission reduction effect of ethanol gasoline decreases, and the promotion of ethanol gasoline should be carefully considered.

Author Contributions

Conceptualization, T.Q.; methodology, T.Q.; software, Y.Z.; validation, Y.Z. and Z.C.; formal analysis, Y.Z.; investigation, D.G., F.S. and T.W.; resources, Y.L.; data curation, Y.Z. and Z.C.; writing—original draft preparation, Y.Z.; writing—review and editing, Y.L.; visualization, Y.Z.; supervision, Y.L.; project administration, Y.L.; funding acquisition, Y.L. All authors have read and agreed to the published version of the manuscript.

Funding

National Natural Science Foundation (52371302).

Institutional Review Board Statement

Not applicable.

Informed Consent Statement

Not applicable.

Data Availability Statement

The data presented in this study are contained within this article.

Acknowledgments

We gratefully acknowledge the financial support for this work by the National Natural Science Foundation (52371302) and Beijing University of Technology.

Conflicts of Interest

The authors declare no conflict of interest.

References

  1. Ma, T.; Li, C.; Luo, J.; Frederickson, C.; Tang, T.; Durbin, T.D.; Johnson, K.C.; Karavalakis, G. In-use NOX and black carbon emissions from heavy-duty freight diesel vehicles and near-zero emissions natural gas vehicles in California’s San Joaquin Air Basin. Sci. Total Environ. 2024, 907, 168188. [Google Scholar] [CrossRef]
  2. Luo, Z.; Wang, Y.; Lv, Z.; He, T.; Zhao, J.; Wang, Y.; Gao, F.; Zhang, Z.; Liu, H. Impacts of vehicle emission on air quality and human health in China. Sci. Total Environ. 2022, 813, 152655. [Google Scholar] [CrossRef] [PubMed]
  3. Jhang, S.; Lin, Y.; Chen, K.; Lin, S.; Batterman, S. Evaluation of fuel consumption, pollutant emissions and well-to-wheel GHGs assessment from a vehicle operation fueled with bioethanol, gasoline and hydrogen. Energy 2020, 209, 118436. [Google Scholar] [CrossRef]
  4. Hoque, N.; Biswas, W.; Mazhar, I.; Howard, I. Environmental Life Cycle Assessment of Alternative Fuels for Western Australia’s Transport Sector. Atmosphere 2019, 10, 398. [Google Scholar] [CrossRef]
  5. Storch, M.; Hinrichsen, F.; Wensing, M.; Will, S.; Zigan, L. The effect of ethanol blending on mixture formation, combustion and soot emission studied in an optical DISI engine. Appl. Energy 2015, 156, 783–792. [Google Scholar] [CrossRef]
  6. Huang, J.; Yuan, Z.; Duan, Y.; Liu, D.; Fu, Q.; Liang, G.; Li, F.; Huang, X. Quantification of temperature dependence of vehicle evaporative volatile organic compound emissions from different fuel types in China. Sci. Total Environ. 2022, 813, 152661. [Google Scholar] [CrossRef] [PubMed]
  7. Sakthivel, P.; Subramanian, K.A.; Mathai, R. Experimental study on unregulated emission characteristics of a two-wheeler with ethanol-gasoline blends (E0 to E50). Fuel 2020, 262, 116504. [Google Scholar] [CrossRef]
  8. Zhang, M.; Ge, Y.; Wang, X.; Xu, H.; Tan, J.; Hao, L. Effects of ethanol and aromatic compositions on regulated and unregulated emissions of E10-fuelled China-6 compliant gasoline direct injection vehicles. Renew. Energy 2021, 176, 12. [Google Scholar] [CrossRef]
  9. Karavalakis, G.; Durbin, T.D.; Shrivastava, M.; Zheng, Z.; Villela, M.; Jung, H. Impacts of ethanol fuel level on emissions of regulated and unregulated pollutants from a fleet of gasoline light-duty vehicles. Fuel 2012, 93, 549–558. [Google Scholar] [CrossRef]
  10. Lv, Z.; Yang, L.; Wu, L.; Peng, J.; Zhang, Q.; Sun, M.; Mao, H.; Min, J. Comprehensive Analysis of the Pollutant Characteristics of Gasoline Vehicle Emissions under Different Engine, Fuel, and Test Cycles. Energies 2022, 15, 622. [Google Scholar] [CrossRef]
  11. Hilton, B.; Duddy, B. The effect of E20 ethanol fuel on vehicle emissions. Proc. Inst. Mech. Eng. Part D-J. Automob. Eng. 2009, 22, 1577–1586. [Google Scholar] [CrossRef]
  12. Zhu, R.; Hu, J.; He, L.; Zu, L.; Bao, X.; Lai, Y.; Su, S. Effects of ambient temperature on regulated gaseous and particulate emissions from gasoline-, E10-and M15-fueled vehicles. Front. Environ. Sci. Eng. 2021, 15, 14. [Google Scholar] [CrossRef]
  13. Suarez-Bertoa, R.; Astorga, C. Impact of cold temperature on Euro 6 passenger car emissions. Environ. Pollut. 2018, 234, 12. [Google Scholar] [CrossRef] [PubMed]
  14. Alvarez, R.; Weilenmann, M. Effect of low ambient temperature on fuel consumption and pollutant and CO2 emissions of hybrid electric vehicles in real-world conditions. Fuel 2012, 97, 6. [Google Scholar] [CrossRef]
  15. Clairotte, M.; Adam, T.W.; Zardini, A.A.; Manfredi, U.; Martini, G.; Krasenbrink, A.; Vicet, A.; Tournie, E.; Astorga, C. Effects of low temperature on the cold start gaseous emissions from light duty vehicles fuelled by ethanol-blended gasoline. Appl. Energy 2013, 102, 11. [Google Scholar] [CrossRef]
  16. Amanda, A.M.; Rodrigo AD, R.; José, R.S. Cold start and full cycle emissions from a flexible fuel vehicle operating with natural gas, ethanol and gasoline. J. Nat. Gas Sci. Eng. 2014, 17, 94–98. [Google Scholar]
  17. Challa, R.; Kamath, D.; Anctil, A. Well-to-wheel greenhouse gas emissions of electric versus combustion vehicles from 2018 to 2030 in the US. J. Environ. Manag. 2022, 308, 114592. [Google Scholar] [CrossRef] [PubMed]
  18. Derwent, R.G. Global Warming Potential (GWP) for Methane: Monte Carlo Analysis of the Uncertainties in Global Tropospheric Model Predictions. Atmosphere 2020, 11, 486. [Google Scholar] [CrossRef]
  19. Yu, A.; Wei, Y.; Chen, W.; Peng, N.; Peng, L. Life cycle environmental impacts and carbon emissions: A case study of electric and gasoline vehicles in China. Transp. Res. 2018, 65, 409–420. [Google Scholar] [CrossRef]
  20. Zhang, X.; Gao, F.; Gong, X.; Wang, Z.; Liu, Y. Comparison of Climate Change Impact Between Power System of Electric Vehicles and Internal Combustion Engine Vehicles. In Proceedings of the Chinese Materials Conference, Yinchuan, China, 6–12 July 2017; Springer: Singapore, 2017. [Google Scholar]
  21. Suarez-Bertoa, R.; Astorga, C. Unregulated emissions from light-duty hybrid electric vehicles. Atmos. Environ. 2016, 136, 10. [Google Scholar] [CrossRef]
  22. Mandev, A.; Ploetz, P.; Sprei, F. The effect of plug-in hybrid electric vehicle charging on fuel consumption and tail-pipe emissions. Environ. Res. Commun. 2021, 3, 081001. [Google Scholar] [CrossRef]
  23. Selleri, T.; Melas, A.; Ferrarese, C.; Franzetti, J.; Giechaskiel, B.; Suarez-Bertoa, R. Emissions from a Modern Euro 6d Diesel Plug-In Hybrid. Atmosphere 2022, 13, 1175. [Google Scholar] [CrossRef]
  24. Ehrenberger, S.; Konrad, M.; Philipps, F. Pollutant emissions analysis of three plug-in hybrid electric vehicles using different modes of operation and driving conditions. Atmos. Environ. 2020, 234, 117612. [Google Scholar] [CrossRef]
  25. He, L.; You, Y.; Zheng, X.; Zhang, S.; Li, Z.; Zhang, Z.; Wu, Y.; Hao, J. The impacts from cold start and road grade on real-world emissions and fuel consumption of gasoline, diesel and hybrid-electric light-duty passenger vehicles. Sci. Total Environ. 2022, 851, 158045. [Google Scholar] [CrossRef] [PubMed]
  26. Huang, Y.; Surawski, N.C.; Organ, B.; Zhou, J.L.; Tang, O.H.H.; Chan, E.F.C. Fuel consumption and emissions performance under real driving: Comparison between hybrid and conventional vehicles. Sci. Total Environ. 2019, 659, 275–282. [Google Scholar] [CrossRef] [PubMed]
  27. Prati, M.V.; Costagliola, M.A. Real driving emissions of Euro 6 electric/gasoline hybrid and natural gas vehicles. Transp. Res. Part D Transp. Environ. 2022, 113, 103509. [Google Scholar] [CrossRef]
  28. Garcia, A.; Monsalve-Serrano, J.; Martinez-Boggio, S.; Roso, V.R.; Santos, N.D.S.A. Potential of bio-ethanol in different advanced combustion modes for hybrid passenger vehicles. Renew. Energy 2020, 150, 20. [Google Scholar] [CrossRef]
  29. Zhang, H.; Liu, S.; Lei, N.; Fan, Q.; Wang, Z. Leveraging the benefits of ethanol-fueled advanced combustion and supervisory control optimization in hybrid biofuel-electric vehicles. Appl. Energy 2022, 326, 15. [Google Scholar] [CrossRef]
  30. Stettler, M.E.J.; Woo, M.; Ainalis, D.; Achurra-Gonzalez, P.; Speirs, J.; Cooper, J.; Lim, D.; Brandon, N.; Hawkes, A. Review of Well-to-Wheel lifecycle emissions of liquefied natural gas heavy goods vehicles. Appl. Energy 2023, 333, 15. [Google Scholar] [CrossRef]
  31. Zhang, M.; Ge, Y.; Li, J.; Wang, X.; Tan, J.; Hao, L.; Xu, H.; Hao, C.; Wang, J.; Qian, L. Effects of ethanol and aromatic contents of fuel on the non-regulated exhaust emissions and their ozone forming potential of E10-fueled China-6 compliant vehicles. Atmos. Environ. 2021, 264, 118688. [Google Scholar] [CrossRef]
  32. Dardiotis, C.; Fontaras, G.; Marotta, A.; Martini, G.; Manfredi, U. Emissions of modern light duty ethanol flex-fuel vehicles over different operating and environmental conditions. Fuel 2015, 140, 531–540. [Google Scholar] [CrossRef]
  33. Myung, C.; Choi, K.; Cho, J.; Kim, K.; Baek, S.; Lim, Y.; Park, S. Evaluation of regulated, particulate, and BTEX emissions inventories from a gasoline direct injection passenger car with various ethanol blended fuels under urban and rural driving cycles in Korea. Fuel 2020, 262, 116406. [Google Scholar] [CrossRef]
  34. Song, C.; Zhou, Y.; Huang, R.; Wang, Y.; Huang, Q.; Lue, G.; Liu, K. Influence of ethanol–diesel blended fuels on diesel exhaust emissions and mutagenic and genotoxic activities of particulate extracts. J. Hazard. Mater. 2007, 149, 355–363. [Google Scholar] [CrossRef]
  35. Hsieh, W.D.; Chen, R.H.; Wu, T.L.; Lin, T.H. Engine performance and pollutant emission of an SI engine using ethanol-gasoline blended fuels. Atmos. Environ. 2002, 36, 403–410. [Google Scholar] [CrossRef]
  36. Lin, Y.; Jhang, S.; Lin, S.; Chen, K. Comparative effect of fuel ethanol content on regulated and unregulated emissions from old model vehicles: An assessment and policy implications. Atmos. Pollut. Res. 2021, 12, 66–75. [Google Scholar] [CrossRef]
  37. Zhu, R.; Hu, J.; Bao, X.; He, L.; Lai, Y.; Zu, L.; Li, Y.; Su, S. Investigation of tailpipe and evaporative emissions from China IV and Tier 2 passenger vehicles with different gasolines. Transp. Res. Part D Transp. Environ. 2017, 50, 305–315. [Google Scholar] [CrossRef]
  38. McCaffery, C.; Durbin, T.D.; Johnson, K.C.; Karavalakis, G. The effect of ethanol and iso-butanol blends on polycyclic aromatic hydrocarbon (PAH) emissions from PFI and GDI vehicles. Atmos. Pollut. Res. 2020, 11, 2056–2067. [Google Scholar] [CrossRef]
  39. Catapano, F.; Di Iorio, S.; Magno, A.; Sementa, P.; Vaglieco, B.M. Effect of ethanol blends, E10, E25 and E85 on sub-23 nm particle emissions and their volatile fraction at exhaust of a high-performance GDI engine over the WLTC. Fuel 2022, 327, 125184. [Google Scholar] [CrossRef]
  40. Mendoza-Villafuerte, P.; Suarez-Bertoa, R.; Giechaskiel, B.; Riccobono, F.; Bulgheroni, C.; Astorga, C.; Perujo, A. NOX, NH3, N2O and PN real driving emissions from a Euro Ⅵ heavy-duty vehicle. Impact of regulatory on-road test conditions on emissions. Sci. Total Environ. 2017, 609, 546–555. [Google Scholar] [CrossRef]
  41. Mejia-Centeno, I.; Fuentes, G.A. Nitrous oxide formation during light-off over a commercial pd-containing three-way catalytic converter: The effect of low-sulfur gasoline. Chem. Eng. Commun. 2009, 196, 1140–1151. [Google Scholar] [CrossRef]
  42. Brinklow, G.; Herreros, J.M.; Rezaei, S.Z.; Doustdar, O.; Tsolakis, A.; Kolpin, A.; Millington, P. Non-carbon greenhouse gas emissions for hybrid electric vehicles: Three-way catalyst nitrous oxide and ammonia trade-off. Int. J. Environ. Sci. Technol. 2023, 20, 12521–12532. [Google Scholar] [CrossRef]
  43. Suarez-Bertoa, R.; Zardini, A.A.; Keuken, H.; Astorga, C. Impact of ethanol containing gasoline blends on emissions from a flex-fuel vehicle tested over the Worldwide Harmonized Light duty Test Cycle (WLTC). Fuel 2015, 143, 10. [Google Scholar] [CrossRef]
Figure 1. Experimental procedures.
Atmosphere 15 00669 g001
Figure 2. Schematic diagram of the experimental setup.
Atmosphere 15 00669 g002
Figure 3. The ambient temperature of the ambient bin at (a) 23 °C and (b) 6 °C.
Atmosphere 15 00669 g003
Figure 4. Regulated emissions.
Atmosphere 15 00669 g004
Figure 5. Unregulated emissions.
Atmosphere 15 00669 g005
Figure 6. Radar chart of emission factors.
Atmosphere 15 00669 g006
Figure 7. THC emissions.
Atmosphere 15 00669 g007
Figure 8. CO emissions.
Atmosphere 15 00669 g008
Figure 9. NOX emissions.
Atmosphere 15 00669 g009
Figure 10. PN emissions.
Atmosphere 15 00669 g010
Figure 11. Hybrid vehicle emissions.
Atmosphere 15 00669 g011
Figure 12. Emission factors for gasoline and E20 combustion in hybrid vehicles.
Atmosphere 15 00669 g012
Figure 13. Emission reduction factors for FV and PHEV burning E20 under the WLTC cycle.
Atmosphere 15 00669 g013
Table 1. Physical and chemical properties of E10 and E20 ethanol gasoline and gasoline.
UnitsGasolineE10E20
Ethanol content%010.4719.63
Density (20 °C)kg/m3741.7744743.2
Reid vapor pressure (RVP)kPa57.558.158.1
10% volume evaporated temperature°C53.257.356
50% volume evaporated temperature°C93.4104.475
90% volume evaporated temperature°C168.9157.4152
Final boiling point°C196.1192.6179.5
Olefins%v/v10.27.19.5
Aromatics%v/v30.23125.1
Benzene%v/v0.580.690.51
Oxygen%m/m2.364.316.9
Sulfurmg/kg3.45.54.3
Table 2. Specifications of the test vehicles.
ParameterFuel Vehicle (FV) *Hybrid Electric Vehicle (HEV) *
Vehicle typeGasolinePlug-in hybrid
Length × width × height (mm)4663 × 1815 × 14624765 × 1837 × 1495
Preparation/total weight (kg)1270/17301500/1875
Intake modeNatural inhalationNatural inhalation
Displacement (L)1.51.5
Maximum power (kW)8581
Maximum torque (N·m)150135
Post-processingTWCTWC
* FV represents gasoline vehicles, and HEV stands for hybrid electric vehicles.
Disclaimer/Publisher’s Note: The statements, opinions and data contained in all publications are solely those of the individual author(s) and contributor(s) and not of MDPI and/or the editor(s). MDPI and/or the editor(s) disclaim responsibility for any injury to people or property resulting from any ideas, methods, instructions or products referred to in the content.

