Abstract
In this study, online ambient volatile organic compounds (VOCs) were collected at an urban site of Zhengzhou in Central China during February 2018. The VOCs characteristics, source contributions and the Chinese New Year (CNY) effects have been investigated. During the sampling period, three haze periods have been identified, with the corresponding VOCs concentrations of (92 ± 45) ppbv, (62 ± 18) ppbv and (83 ± 34) ppbv; in contrast, the concentration during non-haze days was found to be (57 ± 27) ppbv. In addition, the festival effects of the CNY were investigated, and the concentration of particulate matter precursor decreased significantly. Meanwhile, firework-displaying events were identified, as the emission intensity had been greatly changed. Both potential source contribution function (PSCF) and the concentration weighted trajectory (CWT) models results indicated that short-distance transportation was the main influencing factor of the local VOCs pollution, especially by transport from the northeast. Source contribution results by the positive matrix factorization (PMF) model showed that vehicle exhaust (24%), liquid petroleum gas and natural gas (LPG/NG, 23%), coal combustion (21%), industrial processes (16%) and solvent usages (16%) were the major sources of ambient VOCs. Although industry and solvents have low contribution to the total VOCs, their secondary organic aerosol (SOA) contribution were found to be relatively high, especially in haze-1 and haze-3 periods. The haze-2 period had the lowest secondary organic aerosol potential (SOAp) during the sampling period; this is mainly caused by the reduction of industrial and solvent emissions due to CNY.
1. Introduction
Volatile organic compounds (VOCs) are precursors of a series of secondary pollutants such as tropospheric ozone (O3) and secondary organic aerosols (SOAs), in the presence of solar radiation and NOx [1,2]. In addition, as key roles playing in the atmospheric photochemistry, VOCs also have adverse impacts on human health and vegetation [3,4]. The results of atmospheric VOCs studies have widespread concern of improving the air quality in megacities [5,6,7].
With the rapid development of urbanization and industrialization, certain regions in China are suffering from O3 pollution in summer and haze pollution throughout the year [8,9]. As VOCs play an important role in the chemical process of the above-mentioned pollution events, the research on VOCs in China has increased rapidly in the last few decades [10,11,12]. Some studies focused on the effect of VOCs on the formation mechanism of O3 and SOA in the haze period [13,14,15] and analyzed the major sources of VOCs [16,17,18]. In addition, research has suggested that severe haze pollution in China was largely driven by the formation of SOA, and VOCs play a key role in the process of SOA formation, accounting for approximately 25–30% of the mass of PM2.5 in the haze periods [19]. Zhu et al. [20] calculated the sum of biogenic and anthropogenic SOA by using VOCs data at Mount Tai, and VOCs contributed 18.1–49.1% to total SOA. Furthermore, VOCs characteristics and their contributions to the formation of SOA were significantly different under haze and non-haze conditions. Sheng et al. [2] suggested that the concentrations of the majority of VOCs during the pollution days were almost 10 times those during the clean days. Hui et al. [21] found that the SOAp of VOCs in haze days was significantly higher than that in clean days in Wuhan, with the mean values of 447 ppbv and 300 ppbv, respectively. In addition, Yang et al. [17] identified the major sources of VOCs in Beijing and their changing pattern during the PM pollution in winter. Sun et al. [16] found that 52.5% of SOA come from solvent sources in the pollution days. However, most studies were merely focused on metropolis, especially in the three most developed regions, Beijing–Tianjin–Hebei (BTH) region, Pearl River Delta (PRD) region, and Yangtze River Delta (YRD) region, and there is an apparent knowledge gap in generalized SOA formation characteristics because outcomes based on these regions with unique emissions or finite meteorological conditions limited the extrapolation of results to the entire part of China. Thus, in order to gain a fundamental understanding of SOA formation characteristics and mechanisms, more investigations for various locations over China are needed, especially for areas affected by severe haze in the central part.
Zhengzhou is one of the well-developed and most populated cities in Central China, and is a representative location of warm temperate continental monsoon climate regions. In recent years, it has frequently suffered from severe episodes of haze. Since 2013, the local government has spared no effort to reduce fine particulate matter pollution. In order to effectively solving this issue, environment researchers and specialists have conducted a great deal of studies on chemical characteristics, health risks, source identification and formation mechanisms of PM2.5 and its precursors, providing scientific guidelines for making effective air quality control policies for Zhengzhou [22,23,24]. However, most of the studies on winter haze mainly focused on the inorganic portion of particulate matter and paid less attention to VOCs, for which data during haze events towards Zhengzhou are still relatively insufficient. Thus, it is necessary to conduct in-depth research on the VOCs characteristics and their contributions to SOA formation during haze pollution.
In addition, during the Chinese New Year (CNY), anthropogenic emissions usually change significantly with population migration and fireworks [25,26]. During the period, firework displays greatly changed the emission patterns [25,27], whereas other ordinary activities (such as industrial production and traffic) are decreased with population migration [28]. The dramatic changes in anthropogenic emissions lead CNY to become a typical time to study the influence of anthropogenic activities on the pollutant levels and VOCs emission features of megacities.
To address the above-mentioned deficiencies, in this paper, we have conducted online measurements of 57 VOCs species in Zhengzhou during three haze episodes in February 2018 including the CNY period. The main objectives of this study are listed as follows: (1) to study the difference in VOCs concentration and their diurnal patterns between clean and PM-polluted periods; (2) to investigate the impacts of human activities during the CNY period; (3) to identify the key sources of VOCs and their changes during the haze periods, (4) to assess the different source contributions to the SOAp during the PM-polluted winter.
2. Materials and Methods
2.1. Site and Measurements
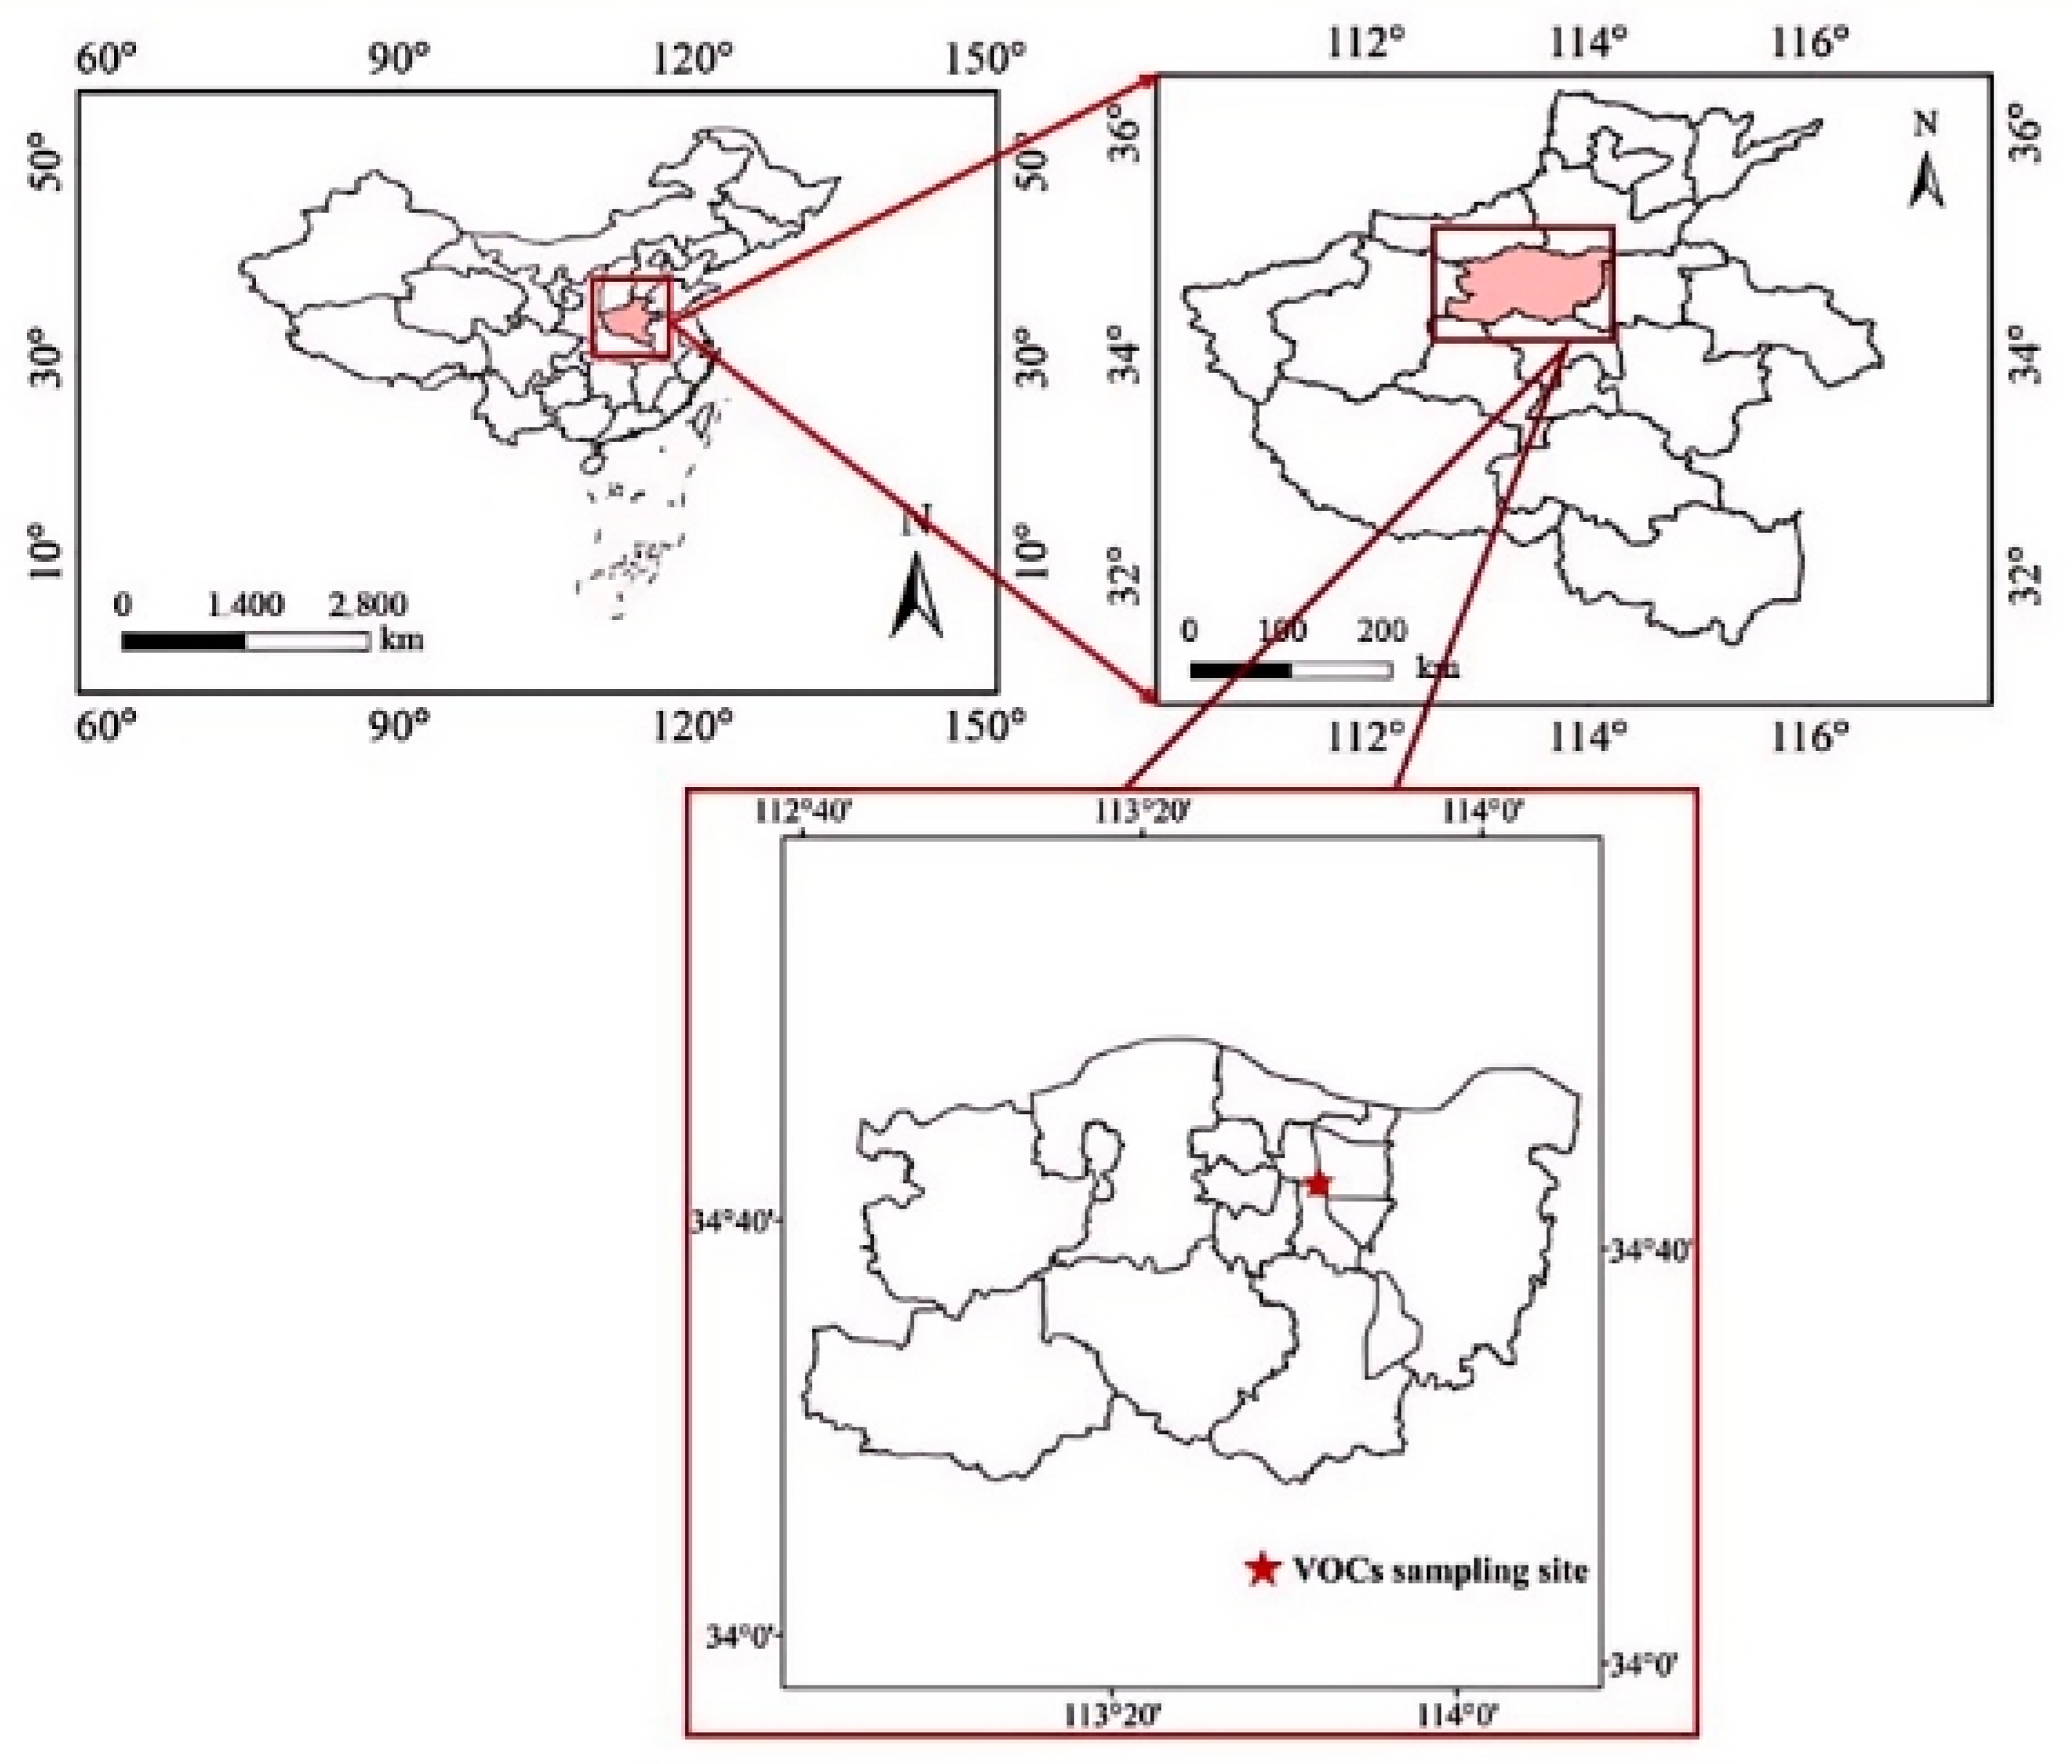
VOCs samples were collected at an urban site (34°45′36″ N,113°41′59″ E) in the Department of Environmental Protection of Henan Province. The site was surrounded by commercial and residential areas plus a number of roads; no large industrial source was detected nearby. The sample from the selected site location can represent a typical urban atmospheric environment in Zhengzhou (see Figure 1).

Figure 1.
Location of the sampling site in Zhengzhou. The red shaded areas on each map indicate the respective locations of Henan Province, Zhengzhou City, and monitoring stations.
VOCs species were continuously measured by using an auto–GC system (AMA Instruments GmbH, Ulm, Germany). The system consists of two sampling systems and two column systems, including a low-boiling point VOC analyzer for C2–C6 VOCs species and a high-boiling point BTX analyzer for C6–C12 VOCs species. The 57 VOCs species (including 29 alkanes, 10 alkenes, one alkyne, and 17 aromatics) were calibrated by the Photochemical Assessment Monitoring Stations (PAMSs) standard gas before measuring. The details of the analytical procedure and the standard gas chromatogram are presented in the Supplementary Materials (Text S1). Strict quality assurance and quality control (QA/QC) procedures were followed to assure the data quality [29,30]. During the observation period, a single-point standard gas was injected daily. After analysis, concentrations of various compounds were recorded along with their relative errors compared to the standard gas. Any deviation exceeding 20% was considered unacceptable. Weekly system-wide blank checks were performed, with the residue of each compound below the method detection limit. During the observation period, zero and span gas checks (using PAM calibration gases) were conducted monthly using the five-point method, together with the adjustment of retention time. The sampling flow rate is monitored on a monthly basis, ensuring that the relative deviation between the indicated sampling flow rate and the standard flow meter indication remains within ±5%. Additionally, leakage inspections are conducted as per the guidelines outlined in the system manual. The correlation coefficient usually varied from 0.990 to 0.999, and the detection limits ranged from 0.02 to 0.11 ppbv. The missing data due to instrument maintenance or power failure were not included in this analysis.
Meteorological data used in this study, such as atmospheric temperature (T), relative humidity (RH), ultra-violet ray (UV), precipitation (Pr), the planetary boundary layer height (PBL), wind speed (WS) and direction (WD), were obtained from the surface meteorological station of Henan monitoring center. Other datasets such as the hourly concentration of NO, NO2, CO, O3, SO2, fine particles (PM2.5) and inhalable particulate matter (PM10) were obtained from the ambient air quality observation station of Yanchang, which was adjacent to the VOCs monitoring station within 2 km distance.
2.2. PMF Model Analysis
The source concentration of VOCs was calculated with the EPA PMF 5.0 model which is a widely used receptor model for source apportionment [10,31]. Detailed information about this method was described in the user manual and related literature [6,32,33]. It should be noted that not all of the VOCs species were used in the PMF analysis. In this study, the principles for the selection of VOCs species were established based on previous studies and listed as follows. (1) Species with more than 25% data missing or below the MDLs were rejected. This followed the methodology of previous studies [34]. (2) Species with short atmospheric lifetimes were excluded because they were consumed rapidly in the atmosphere. (3) Species with representative tracers of emission sources were retained. Eventually, a total of 38 VOCs species were selected for source apportionment analysis. In this study, a five-factor solution was chosen in the PMF analysis based on (1) principal component analysis of the VOCs sample data; (2) VOCs emission inventory of the region included in this study based on field investigation; (3) radio of Qtrue (including all points) to Q robust (excluding outliers) for different factor numbers in the PMF (see Figure S2).
2.3. Calculation of SOA Formation Potential
The secondary organic aerosol potential (SOAp) was utilized to assess the capability of VOCs to produce SOA. SOAp indicates the tendency of an organic compound to form secondary organic aerosol when introduced into the ambient atmosphere, relative to the SOA formed by the same mass of toluene [35]. SOAp values are standardized with toluene set at 100. Toluene was chosen as the reference compound for the SOAp scale because of its well-characterized emissions and established role as a major anthropogenic precursor to SOA formation.
The total SOAp is obtained by weighted mass summation of each source contribution by Equation (1).
where Cj,i is the mass contribution of a VOCs source to species i (µg/cm3), and SOApi is the individual SOA formation potential of species i, as proposed by Derwent et al [35].
2.4. Geographic Origin of VOCs
In this paper, the methods of potential source contribution function (PSCF) and concentration weighted trajectory (CWT) were used to identify the geographic origins of the VOCs. A higher PSCF value means that a region has a higher probability to be a source area for VOCs emission, while a higher CWT value represents a region with a higher contribution to VOCs concentration.
2.4.1. Potential Source Contribution Function (PSCF)
The PSCF is a conditional probability function for calculating backward trajectories and identifying potential source regions [36]. The 48 h backward trajectories were calculated prior to the sampling period and the different haze events at 0:00, 6:00, 12:00 and 20:00. The simulation height was 500 m, which can accurately reflect the average flow field characteristics of the boundary layer. The meteorological parameters were provided by the National Center for Environmental Prediction. The geographical domain (i.e., 80–130° E, 15–65° N) was divided into small, equal-sized grid cells, with 1° × 1° resolution. The PSCF was calculated by using the following equation:
where mij and nij are the number of pollution tracks in the ij-th cell and all tracks passing through the same cell, respectively. To reduce the uncertainty of the cell due to the limited amount of available data [20], the PSCFij value in this study was adjusted by the weighting function Wij:
2.4.2. Concentration Weighted Trajectory (CWT)
The CWT method can reflect the concentration levels of trajectories based on pollutant concentrations [37]. The geographical domain was divided into an array with a 1° × 1° resolution. The CWT can be defined as follows:
where cij is the average weighted concentration of the trajectory l in the ij-th grid cell, and ch represents the pollutants concentrations corresponding to trajectory l. m is the total number of trajectories, and τijl is the residence time spent in the ij cell of trajectory l. Both PSCF and CWT was calculated by using TrajStat software (V1.5.1) (http://meteothink.org/docs/trajstat/index.html, accessed on 22 May 2024) [38].
3. Results and Discussion
3.1. Overview of the Measurement Results
3.1.1. Correlation Analysis of Pollutant and Meteorology Factor
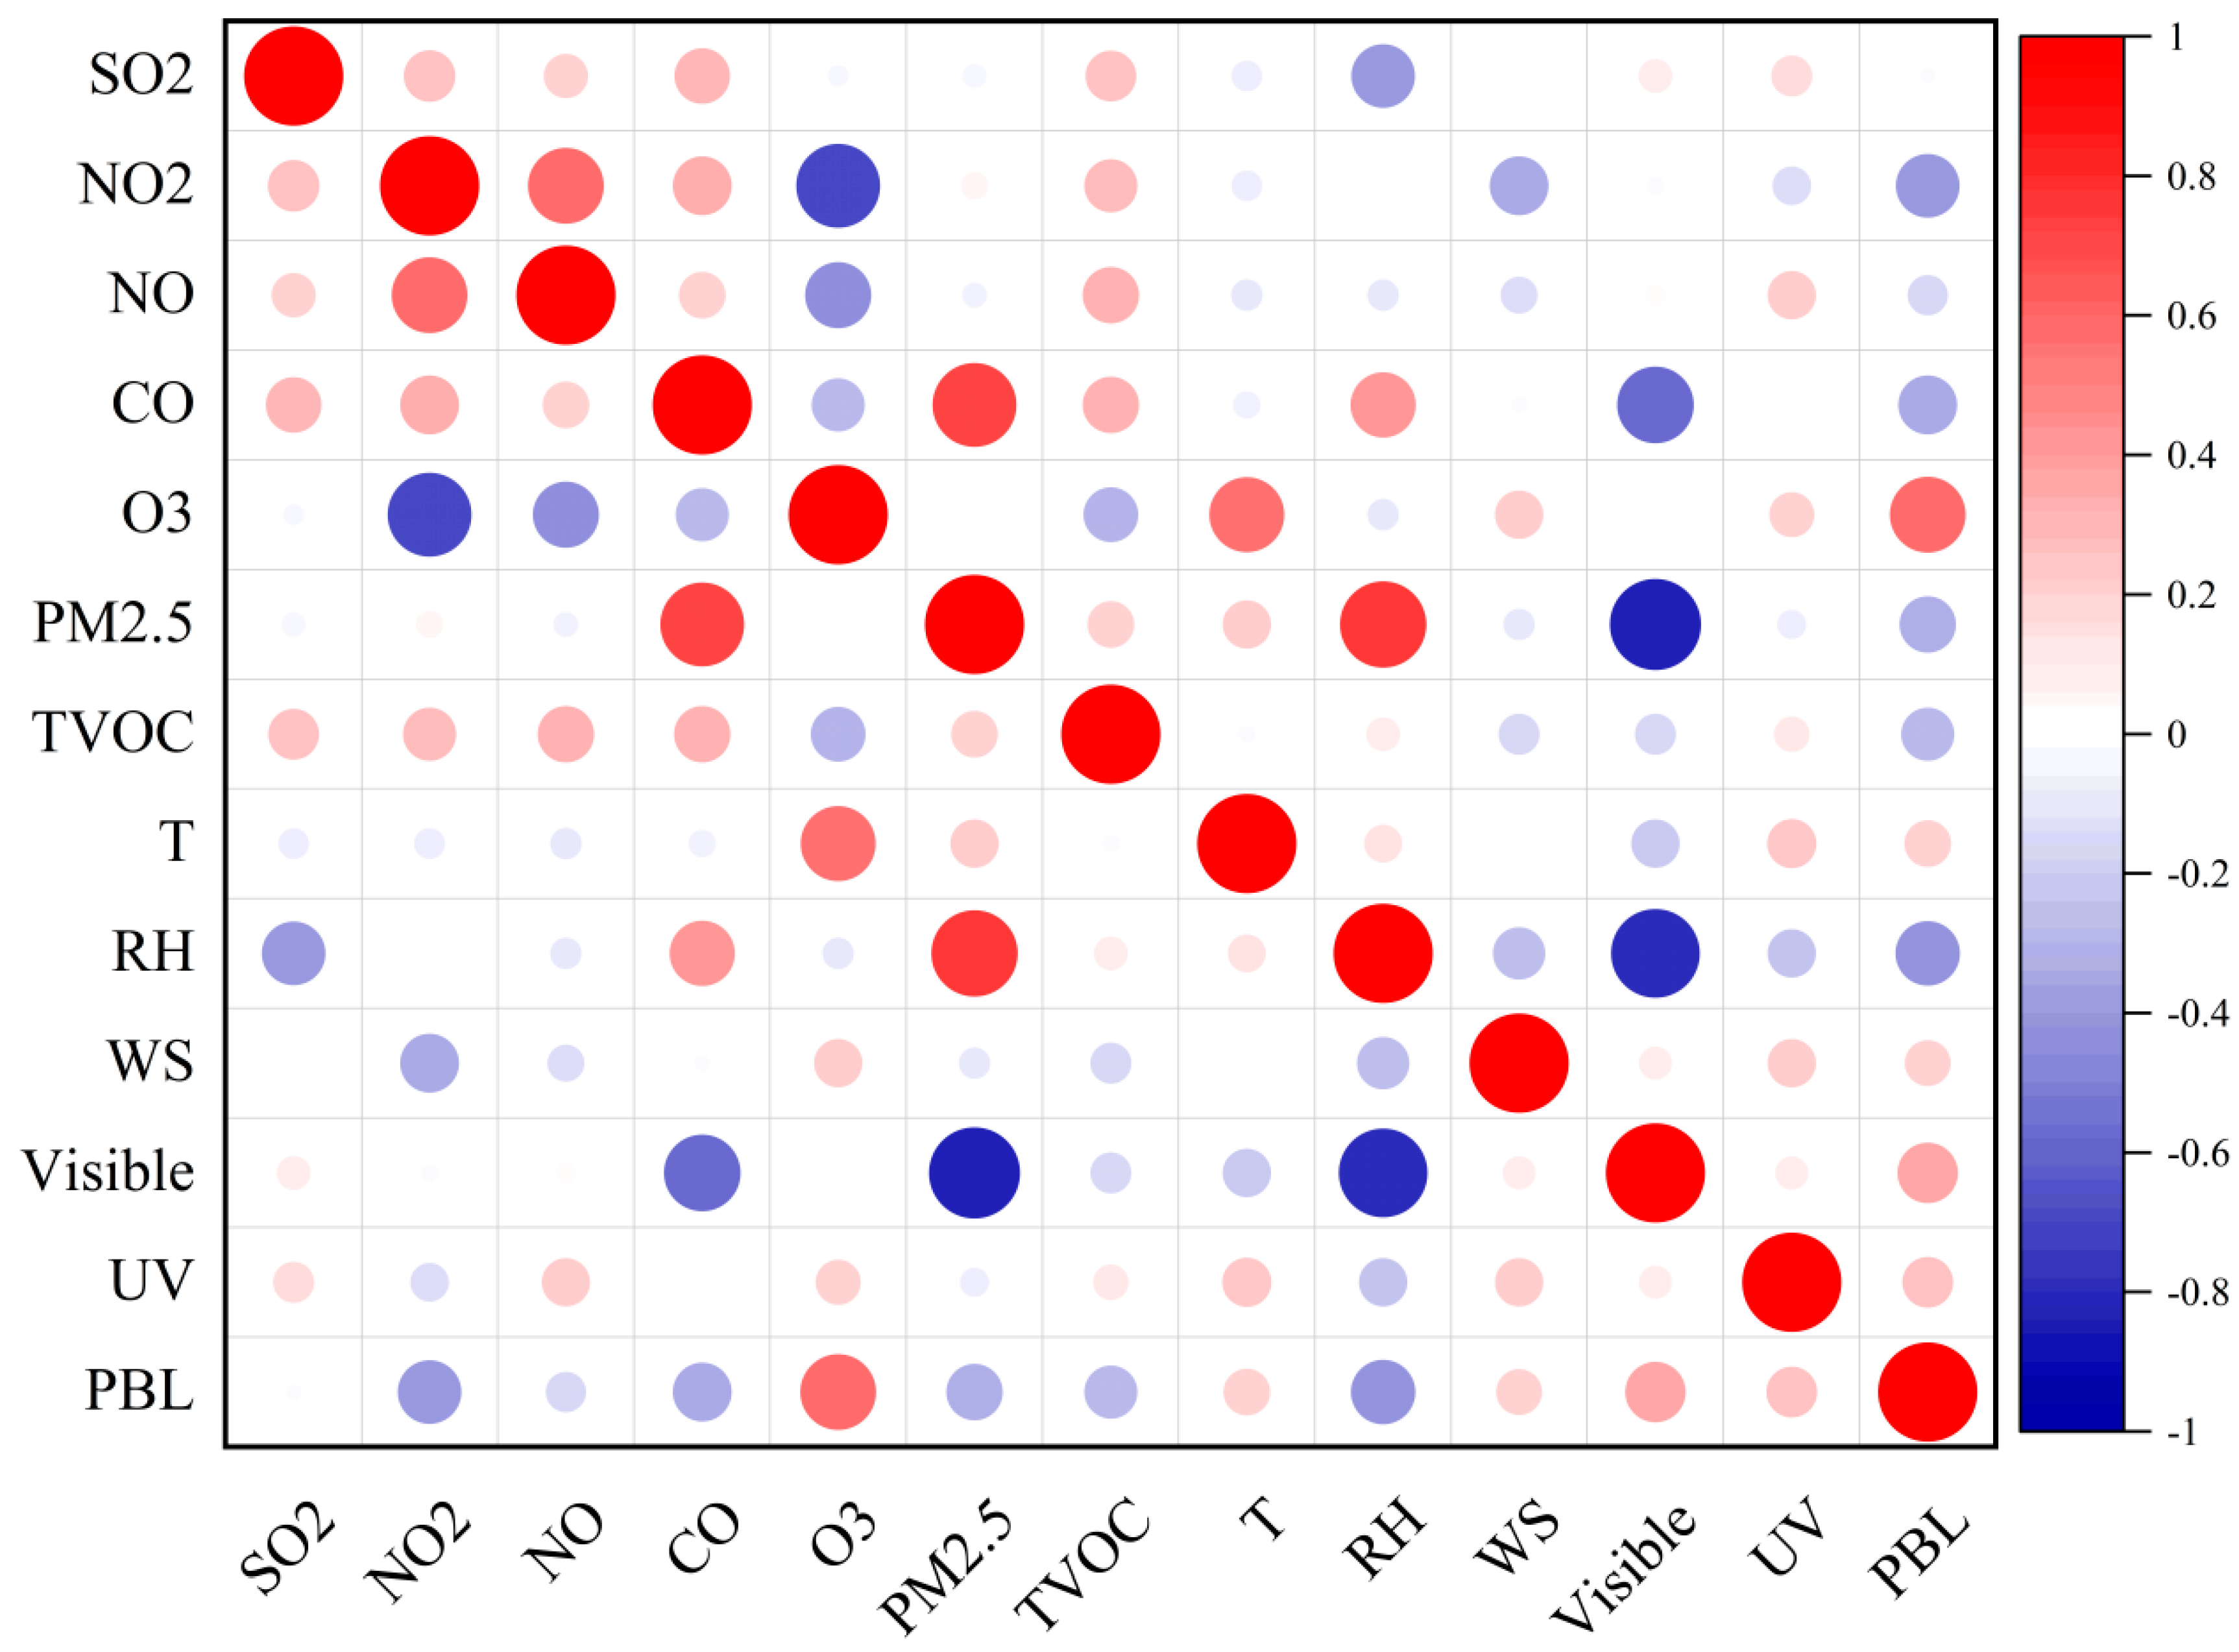
The results of the Pearson correlation analysis (r) of VOCs, trace gases and meteorological parameters investigation are shown in Figure 2. The total VOCs (TVOCs) concentration was found to be significantly correlated with meteorological factors, including RH, WS and PBL. However, for temperature, there was a negative correlation between acetylenes and T (p < 0.05). Since more combustion heating was required in the situation of lower temperatures, the resultant acetylene level increased. It should be pointed out that VOCs concentration has a significant correlation with trace gas (SO2, CO and NO2), which proved that these pollutants are homologous. VOCs concentration had positive relationship with PM2.5 (p < 0.01). As for PM2.5, it was found to be significantly correlated with NO2 and CO. With higher T and RH, and lower WS and PBL, the production of haze was promoted during the sampling period. The correlation between UV and other parameters was analyzed by selecting the data during the daytime between 8:00 and 18:00, as shown in Figure S3. UV was not correlated with TVOC, but had a significant negative correlation with aromatic concentration, indicating that the active component of aromatics played an important role in the atmospheric chemical reactions in winter [17]. In addition, UV and O3 showed a significant correlation, which proved that there were still weak photochemical reactions in winter.

Figure 2.
Pearson correlation analysis (r) of VOCs, trace gases and meteorological parameters.
3.1.2. Evolution Process
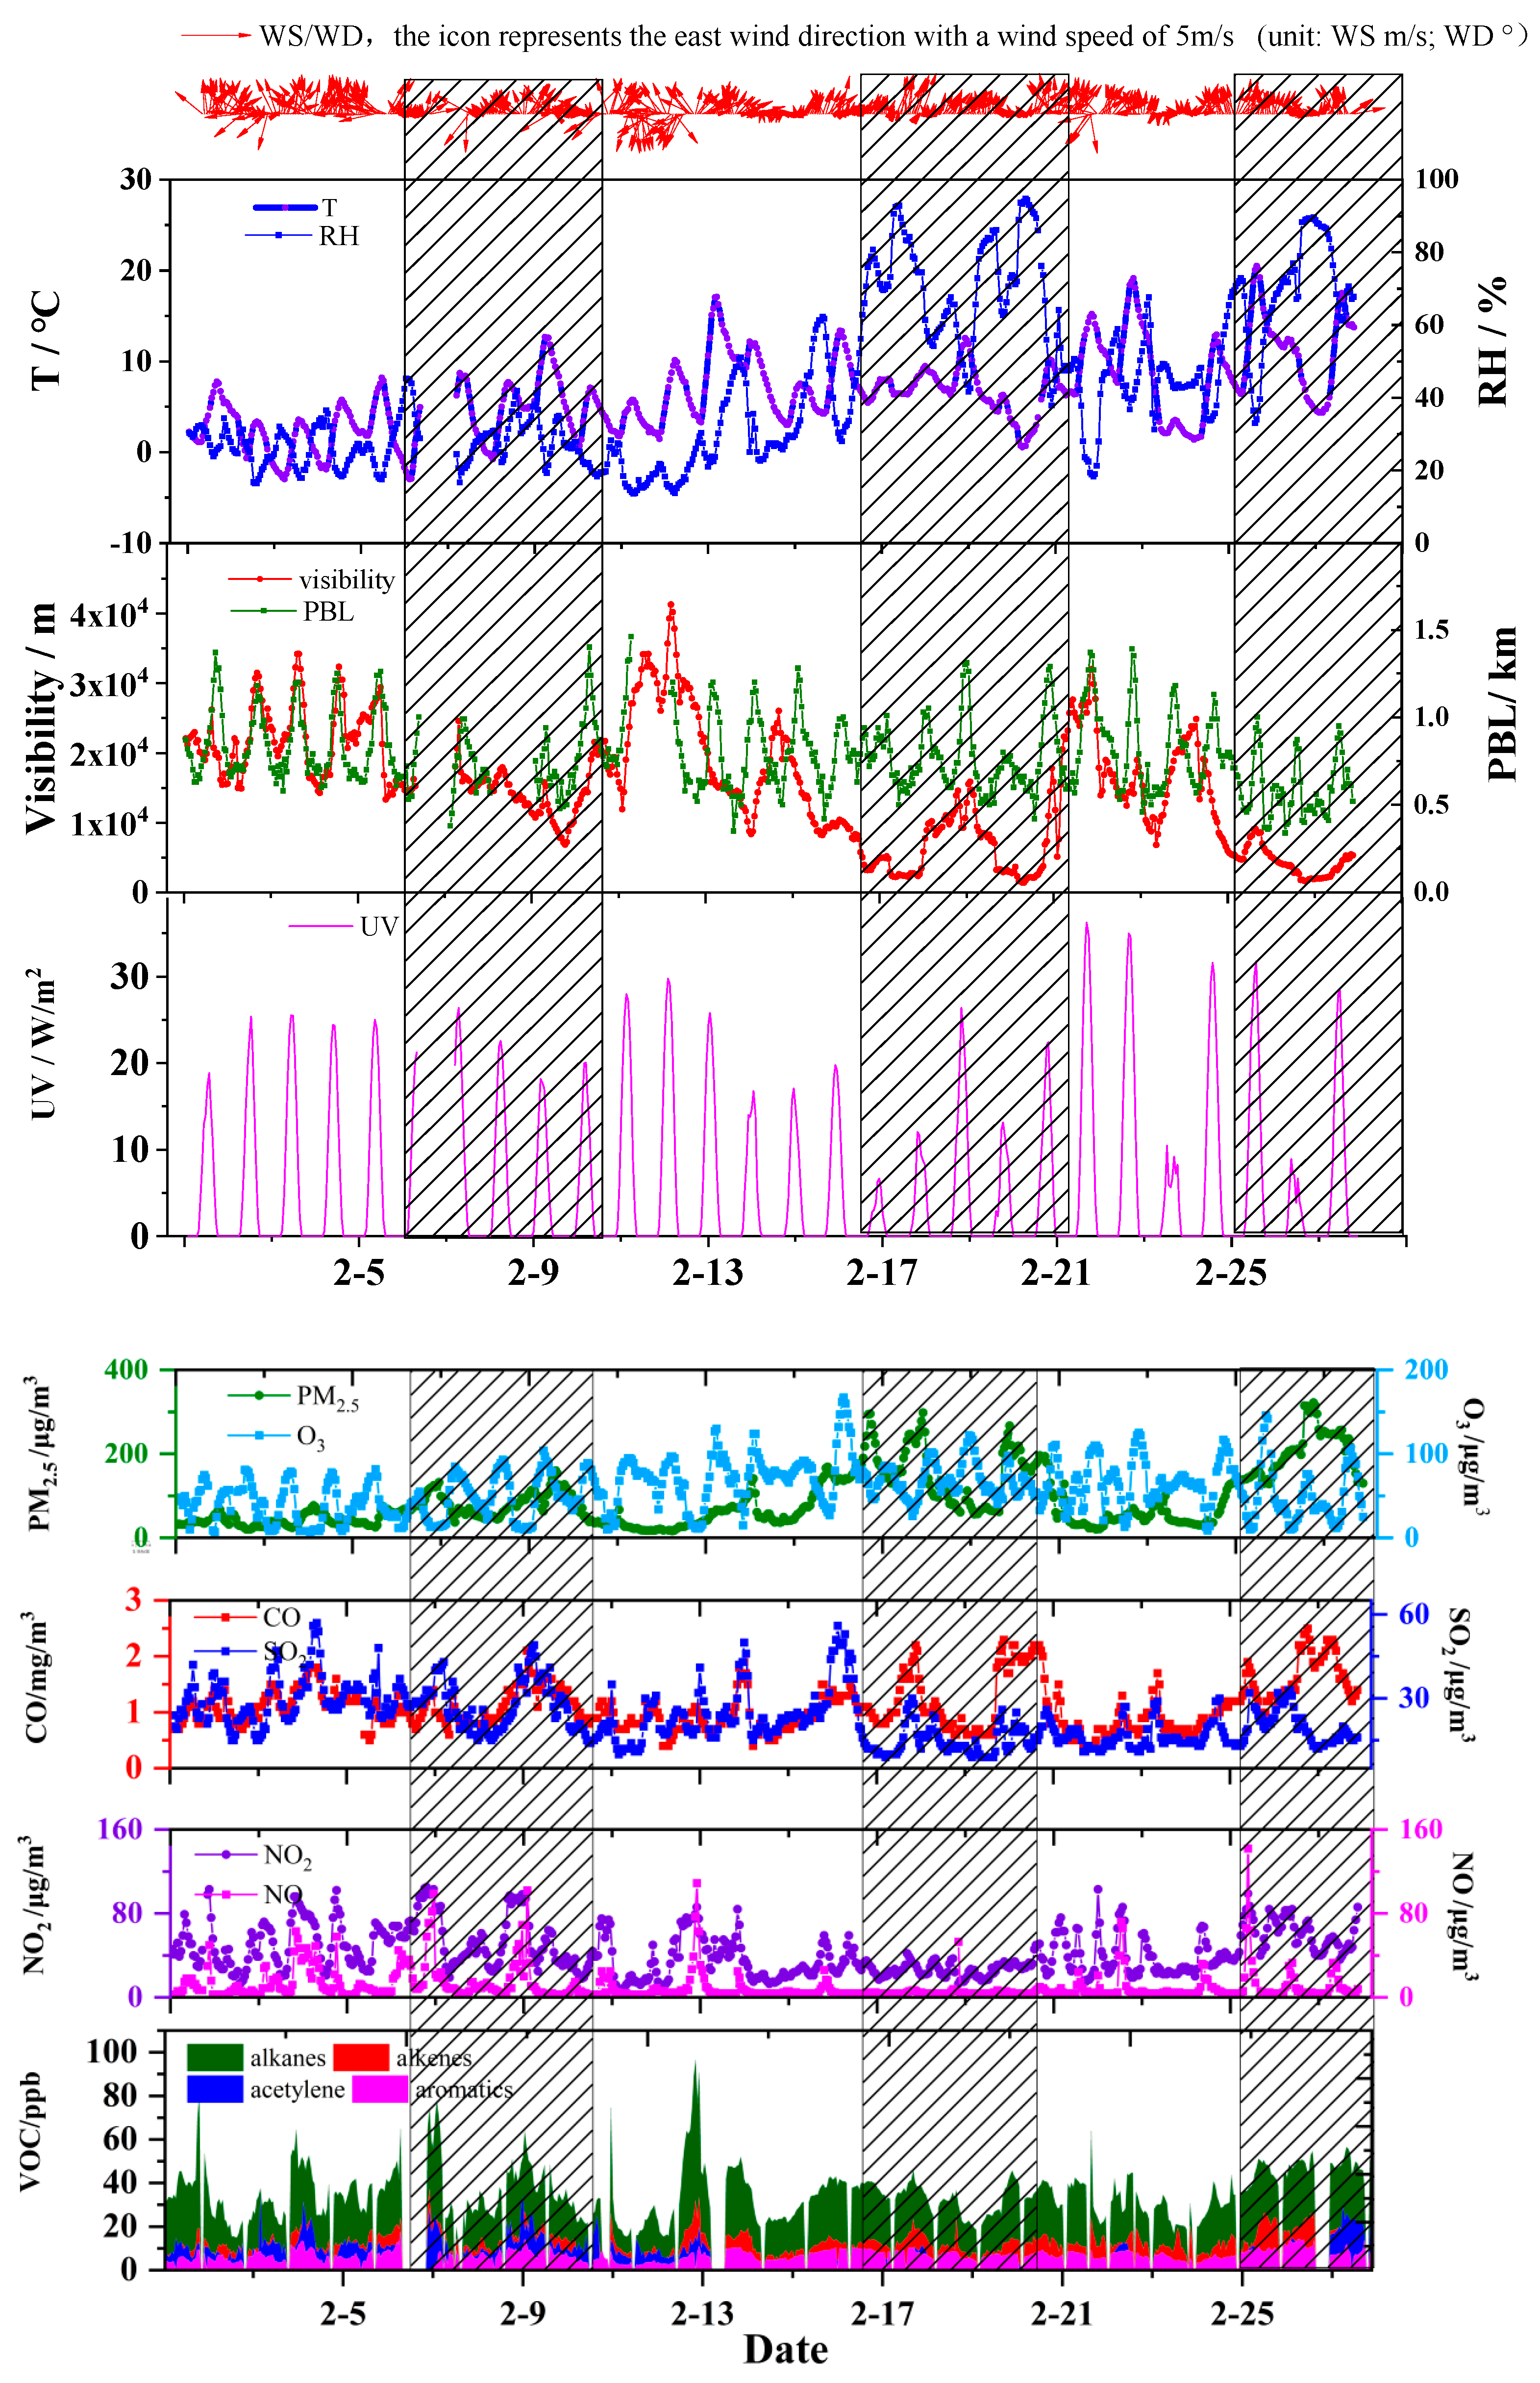
During the observation period, severe haze-fog events occurred in Zhengzhou (Figure 3). Based on the 24 h-averaged concentrations of Chinese National Ambient Air Quality Standard (PM2.5 > 75 μg/m3), the observation period in this study was classified into four stages, including one clean period and three haze periods (haze 1, 6–10 February; haze 2, 16–21 February; haze 3, 25–28 February).
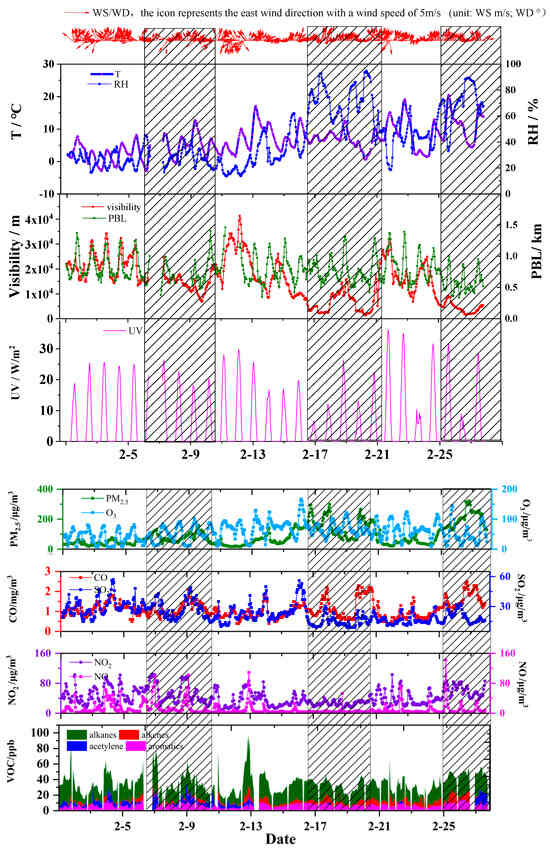
Figure 3.
Time series of air pollutants and meteorological conditions observed as at February 2018. The gray areas were the three haze periods.
During haze-1, the average concentration of PM2.5 was (101 ± 22) μg/m3, with the highest hourly concentration of 160 μg/m3. Tracer gaseous component concentrations (NO, NO2, CO and SO2) in the haze-1 period were higher than those in clean days, with the average concentrations of (22 ± 25) μg/m3, (70 ± 26) μg/m3, (1.3 ± 0.30) mg/m3 and (33 ± 7) μg/m3. Meanwhile, the average concentration of TVOC was 1.6 times higher than that in clean days. Considering that the meteorological conditions of this stage were close to those of clean days (as shown in Table S1), it is speculated that pollution in this stage was mainly caused by high local emissions [39].
With the coming of the Spring Festival, the concentration of tracer gases and VOCs in this area has significantly decreased. However, the smaller WS (mean value of 1.4 ± 0.6 m/s) and shallower planetary boundary layer height (PBL) (mean value of 0.8 ± 0.2 km) were observed in the haze-2 period. Wind speed determines the convection of the air, and PBL height plays an important role in the mixing and dispersion of air mass verticality [31]. In addition, RH was higher in this stage, which is conducive to the moisture absorption growth of particles. Meanwhile, the concentration level of SO2 and VOCs at this period were close to clean days, and the concentration of NOx are the lowest among the four periods. Adverse meteorological conditions, including smaller WS, shallower PBL and higher RH, were the key factors leading to haze pollution in this period. In the haze-2 period, the average concentration of PM2.5 was 166 μg/m3, and the mean value of the PM2.5/PM10 ratio was 0.92, which indicated that the secondary portion of particulate matter was higher. It should be noted that the maximum hourly O3 concentration in this phase was 167 μg/m3, which indicated that photochemical reaction had a significant impact on air pollution.
With the end of the holiday, the emissions of pollutants, especially motor vehicles, led to higher concentrations of NOx and VOCs in the atmosphere [40]. Combined with the higher RH and lower PBL, the haze pollution in the third period was the most serious during the sampling period and the average PM2.5 was as high as (185 ± 65) μg/m3, with the maximum level of 322 μg/m3. Serious haze often occurs in winter, due to the combination of high emission intensity of pollutants and the adverse meteorological conditions.
3.1.3. CNY Festival Effects
Considering the particularity of Spring Festival and the serious haze events in this period, the festival effects of China New Year (CNY) is focused on in this section. As shown in Figure 2, during the pre-CNY (1–14 February), CNY (15–21 February) and post-CNY (22–28 February) periods, the average mixing ratios of total VOCs were (68 ± 33), (57 ± 19) and (68 ± 31) ppbv, respectively. Compared with the non-CNY period, the mixing ratios decreased by 20% during CNY holidays. However, the fingerprints of source reduction were far greater than 20%. Compared with the period before CNY, the mixing ratios of acetylene and benzene were only 71% and 61% of those during the CNY period. Xylene, hexane and isopentane were reduced by 35%, 62% and 11%, and these three compounds can be regarded as the tracer gas of industrial processes [41], solvent utilization [6] and motor vehicles [42], respectively. The trends of VOCs were similar to these tracer gases. During the CNY festival, NOx was reduced for 32% and 38%, respectively, of that during the pre-CNY and post-CNY period, which is likely caused by the reduction of on-road vehicles.
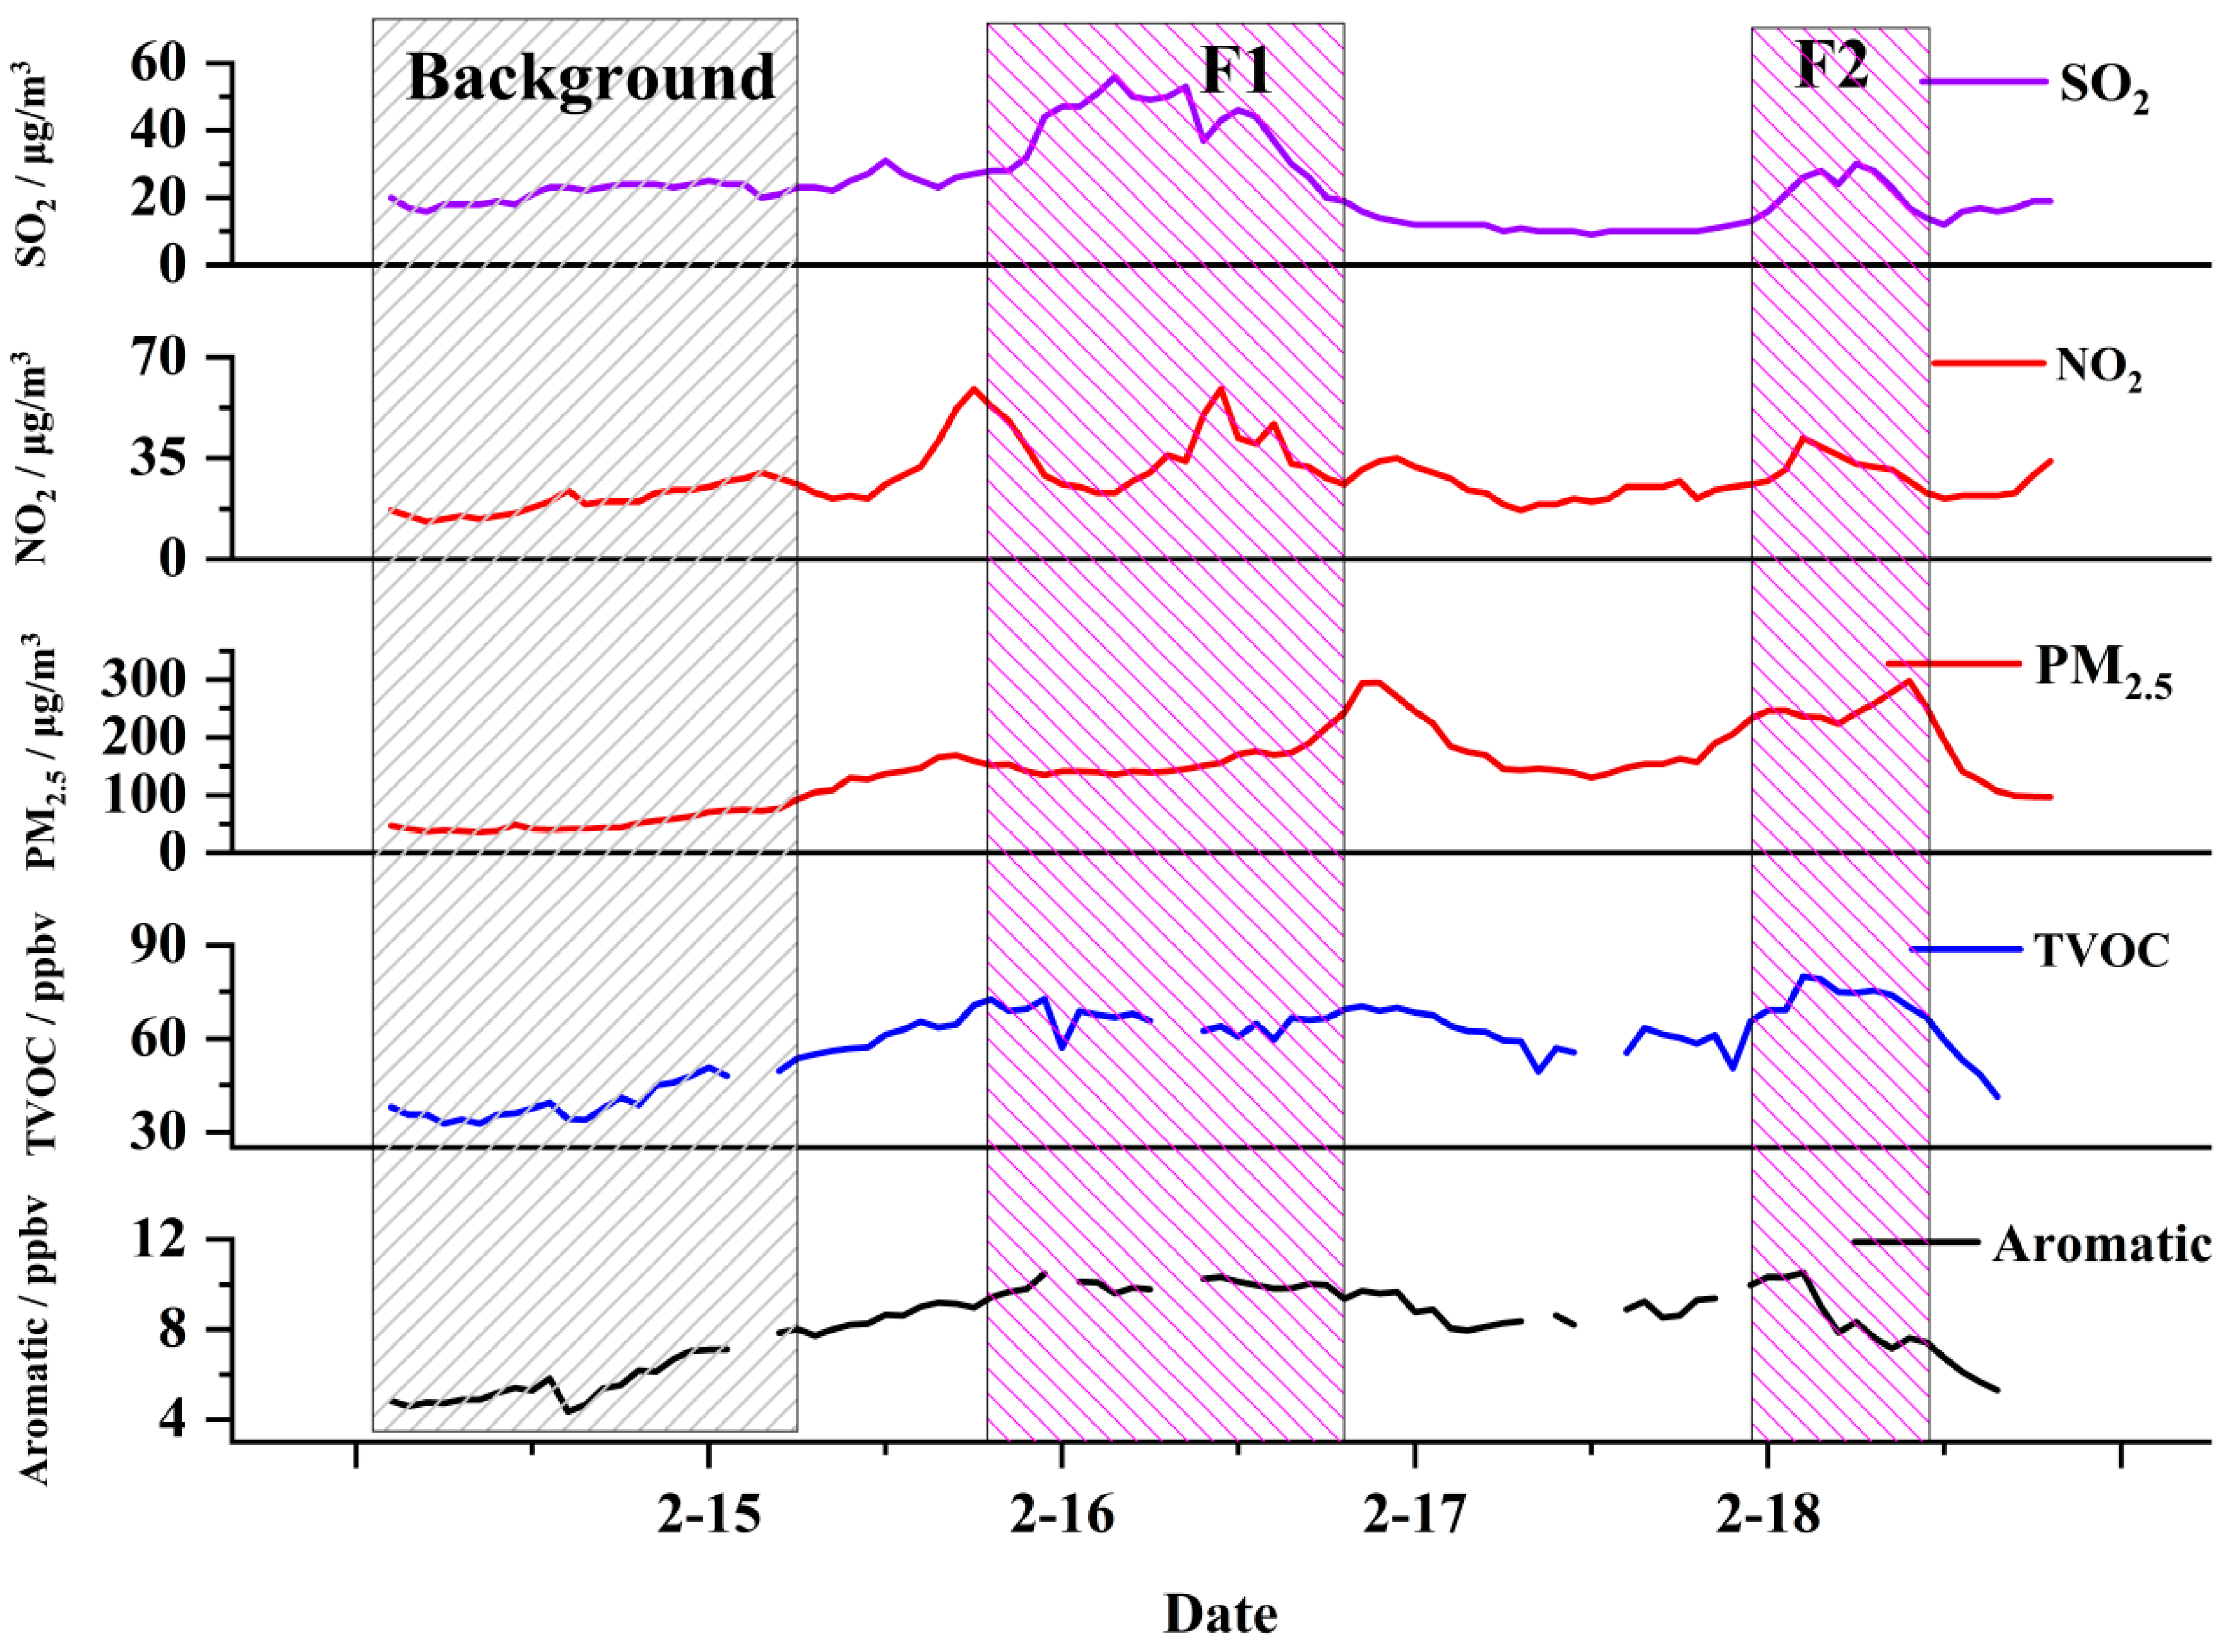
On the whole, the concentrations of particulate matter precursors decreased significantly during the CNY festival. However, the haze pollution was still severe; this could be attributed to the impact of fireworks and firecrackers on air quality. In the recent research, SO2 has been used as a tracer of fireworks events [28], and Figure 2 shows the SO2 concentration increased dramatically in 15th–18th February (around the CNY). The variations in concentrations of VOCs, PM2.5 and tracer gases (CO, NO, NO2 and SO2) from 0:00 15 February to 24:00 18 February are shown in Figure 4. From the figure, the variation of SO2 concentration indicates two firework events in the afternoon of 16 February (F1) and the morning of 18 February (F2). SO2 concentration in the F1 period increased continuously from the noon of the Spring Festival to the peak at 17:00 (56 μg/m3), and then remained at a high until midnight. The second firework event lasted for a short time, with the highest SO2 values of 30 μg/m3.
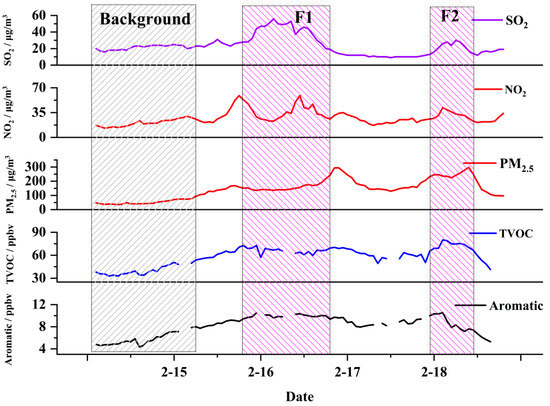
Figure 4.
Time series of TVOC, aromatic, PM2.5, SO2 and NO2 during the CNY festival. F1 and F2 represent the two firework episodes.
As shown in the Figure 4, TVOC showed a similar trend with SO2. In the firework events, TVOC concentration was higher, with the maximum mixing ratio of 69 and 80 ppb in the F1 and F2 periods, respectively, which can be explained because more VOCs were emitted from fireworks. Moreover, concentration of PM2.5 maintained a high level during the whole Spring Festival. At the night of New Year’s Eve, PM2.5 began to accumulate, possibly due to the adverse weather conditions and the impact of fireworks events around the city. During the entire F1 period, PM2.5 kept a high level, and peaked at midnight, with concentration as high as 295 μg/m3. In the F2 period, the concentration of PM2.5 was still very high, and reached the peak value shortly after the fireworks.
Fireworks events, which were an important cause of haze pollution in this period, produced a large amount of pollutants, including VOCs, particulate matter and tracer gases. Hence, a stricter control policy on fireworks should be conducted to reduce the concentrations of VOCs and other atmospheric pollutants. Although the government had legislated against fireworks activities, still it needs surveillance for further reduction of emissions and abatement of haze pollution.
3.2. Characteristics of Measured VOCs
3.2.1. Concentrations Characteristics and Chemical Composition
The concentrations of VOCs species during different haze events are presented in Table S2. The highest concentration of VOCs was measured in the haze-1 period, with a mean concentration of (92 ± 45) ppbv, followed by the haze-3 period (83 ± 34) ppbv. The concentration of VOCs in haze-2 was close to the clean period, with concentrations of (62 ± 18) ppbv and (57 ± 27) ppbv, respectively. Different haze events showed a significant difference among concentrations of each VOCs species, but alkanes were clearly the dominant group during the sampling periods, which accounted for 50% of the total. The second dominant group consisted of alkenes, followed by the group of aromatics and acetylenes. It should be noted that the active components of alkenes and aromatics in the haze-1 and haze-3 periods were higher than those in clean days, which might be one of the factors leading to the rise of SOA.
Table 1 lists the concentrations of the top 20 abundant VOCs species during different haze events. The most important VOCs species during each of the three events were C2–C4 alkanes, such as ethane, propane and n-butane. In addition, the concentrations of pentane and aromatics during the three haze events were relatively higher, suggesting that traffic emissions had affected the atmosphere environment [18]. Acetylene, a tracer of combustion [34], had a higher concentration in haze-1 (14 ± 9 ppbv) and haze-3 (12 ± 8 ppbv), while lower in haze-2 (4 ± 3 ppbv). Meanwhile, the concentration of benzene in haze-1 and haze-3 was also significantly higher than haze-2, indicating less combustion processes during the Spring Festival [42]. Tracers of industrial and solvent sources in the haze-2 period were also lower than those during the other two periods, such as aromatic and the high carbon-number alkanes [43].

Table 1.
Concentrations of the 20 most abundant species during different haze events (unit: ppbv).
3.2.2. Diurnal Variations during Haze and Clean Periods
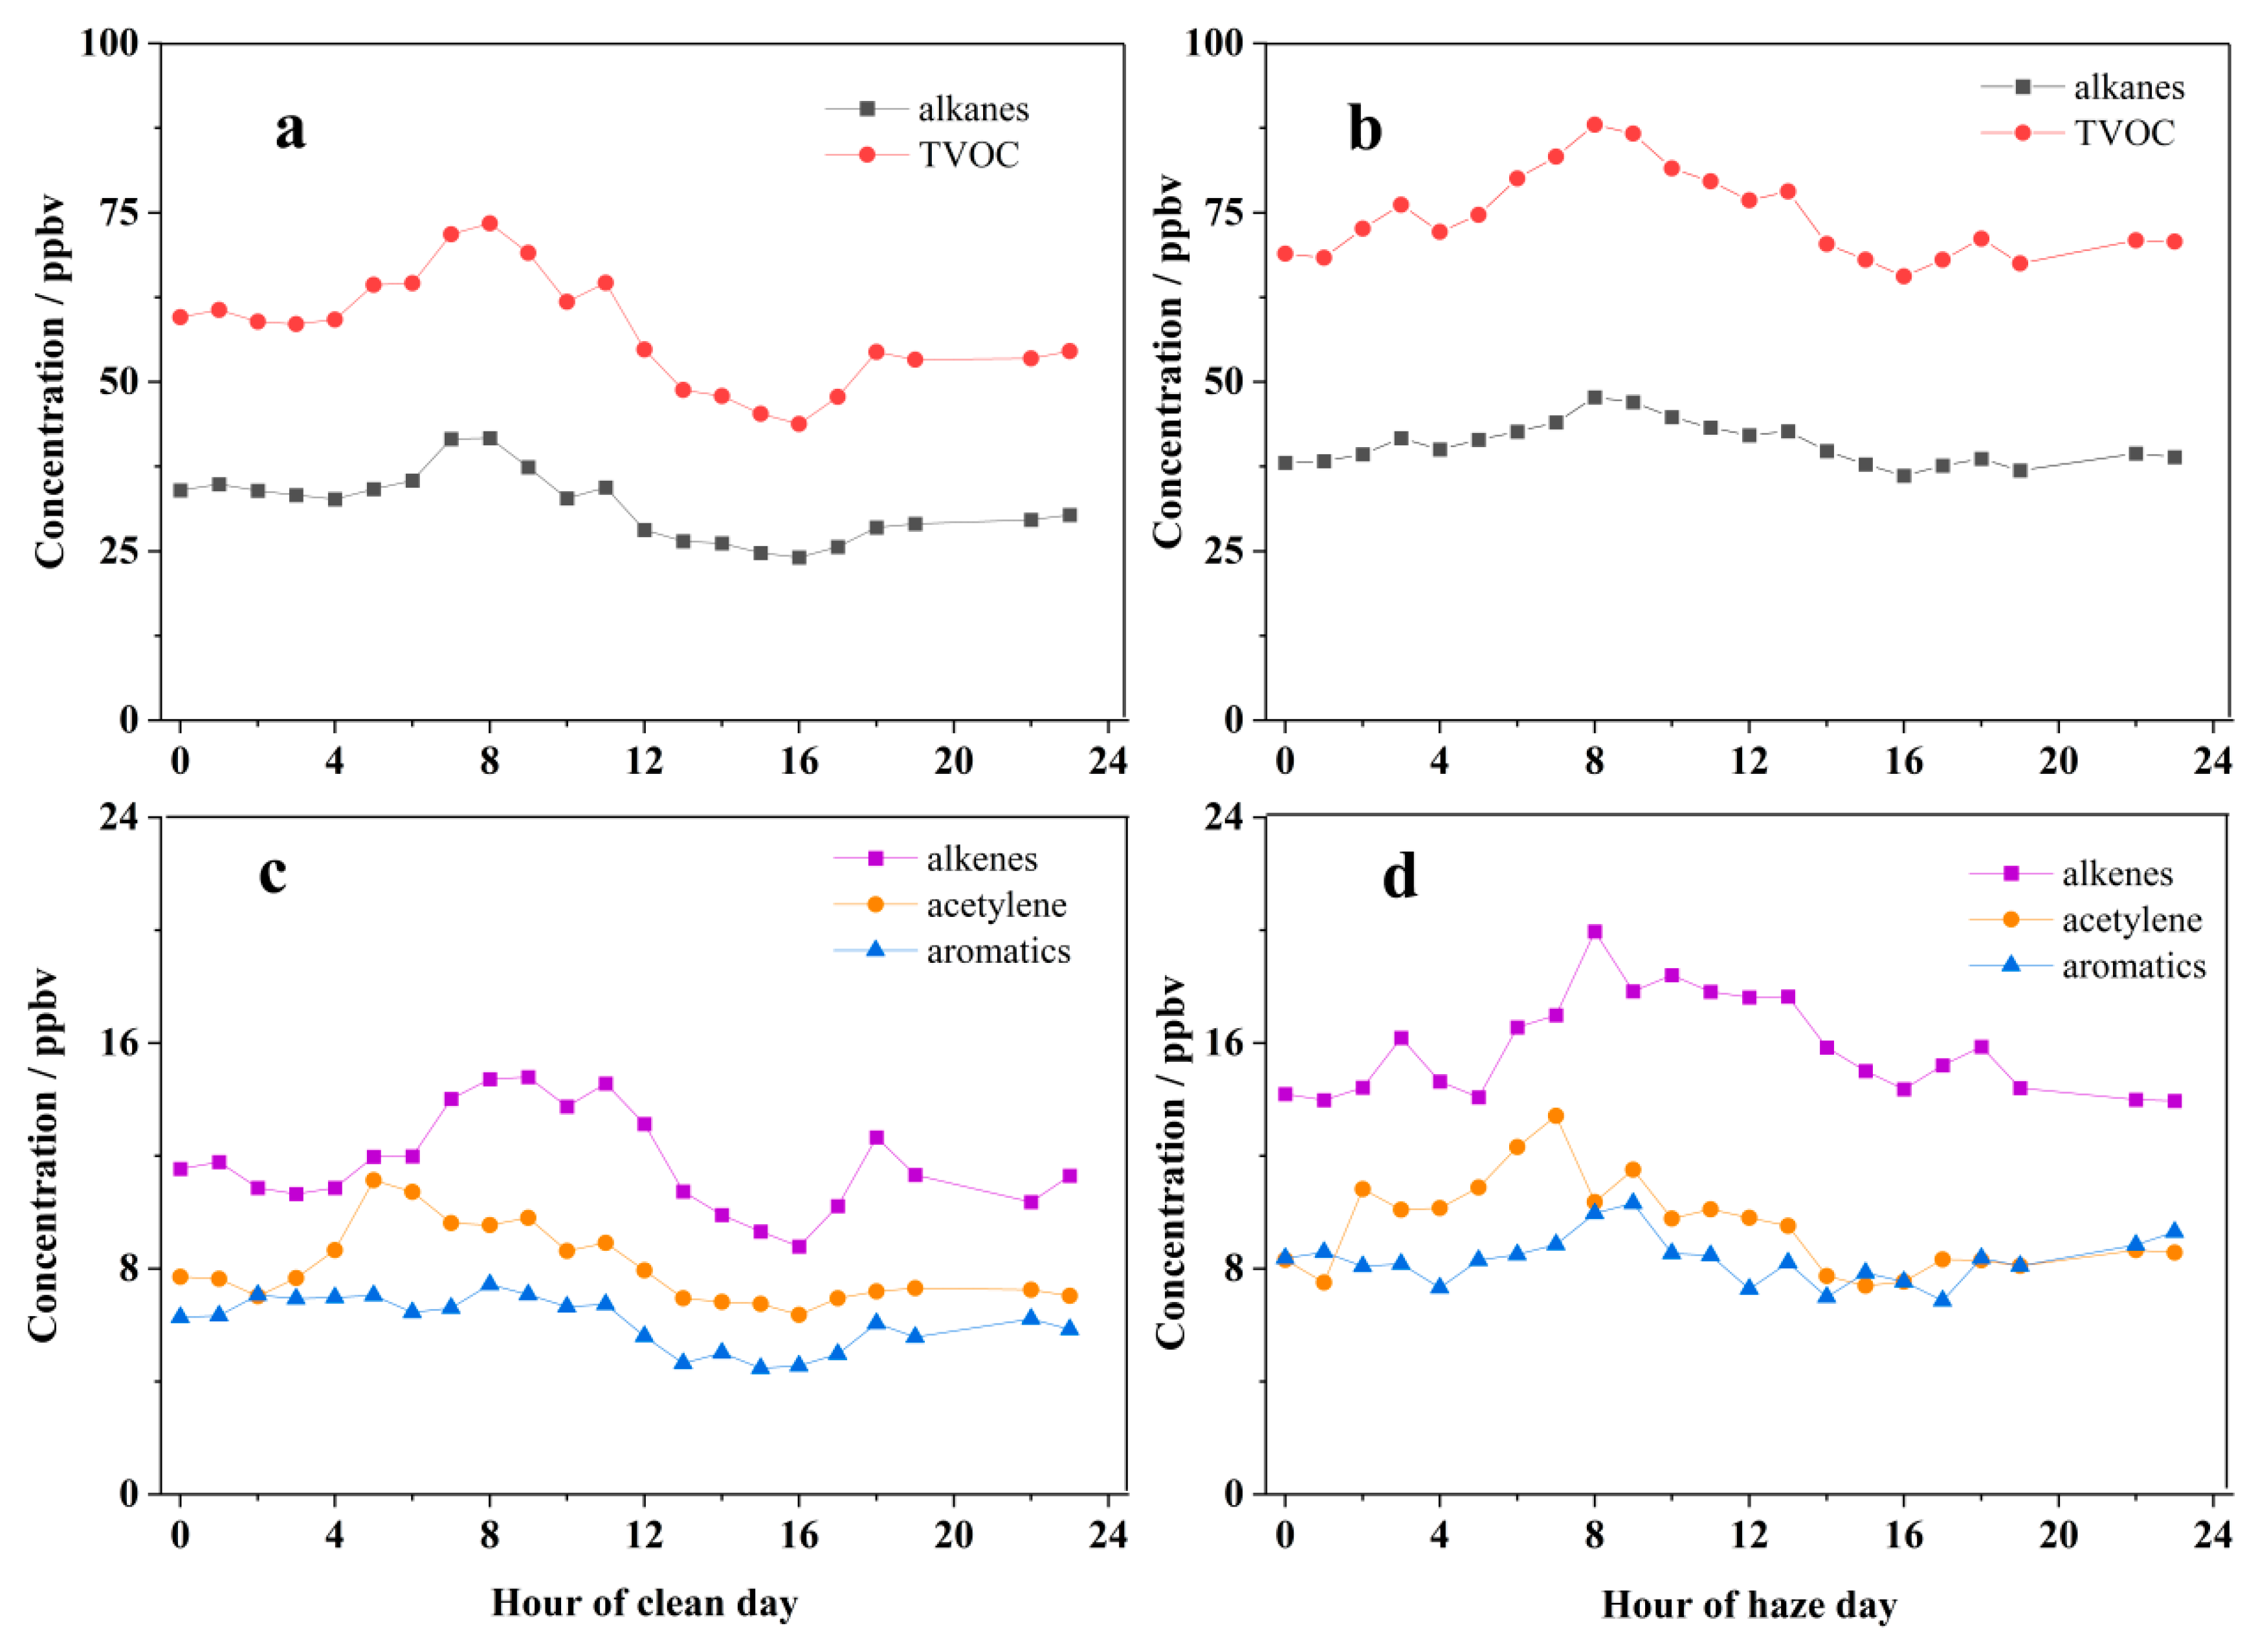
The diurnal variations of VOCs during clean and haze periods are shown in Figure 5. In general, the VOCs concentrations during polluted days are significantly higher than that during clean days. Meanwhile, VOCs maintain a high level at night, which may be enhanced by the lower temperature, shallower PBL and decreased wind speed [33]. Due to the combination of rush hour in the morning and simultaneous decrease in PBL, TVOC began to accumulate and maintained a high concentration during the morning rush hour. Afterwards, the dispersion and consumption of VOCs began to accelerate due to an increase in temperature and PBL, as well as increased WS and strong photochemistry intensity; as a result, the TVOC concentration reached the lowest level at 16:00.
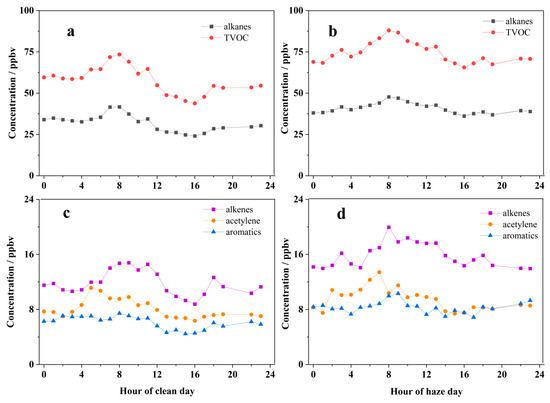
Figure 5.
Diurnal variations of VOCs during clean days (a,c) and haze days (b,d).
It should be noted that the TVOC had a minor peak at midnight during haze periods, corresponding to the variation of anthropogenic activity [28]. However, such peak has not been observed in clean days. Another notable phenomenon was that the amplitudes of the variations in VOCs concentrations, were generally larger in clean days. The daytime valley during polluted days was shallower; this indicates that more pollutants have been emitted in haze days. In conclusion, strong emission intensity of VOCs might be one cause of serious haze pollution.
3.3. Potential Source-Areas of VOCs
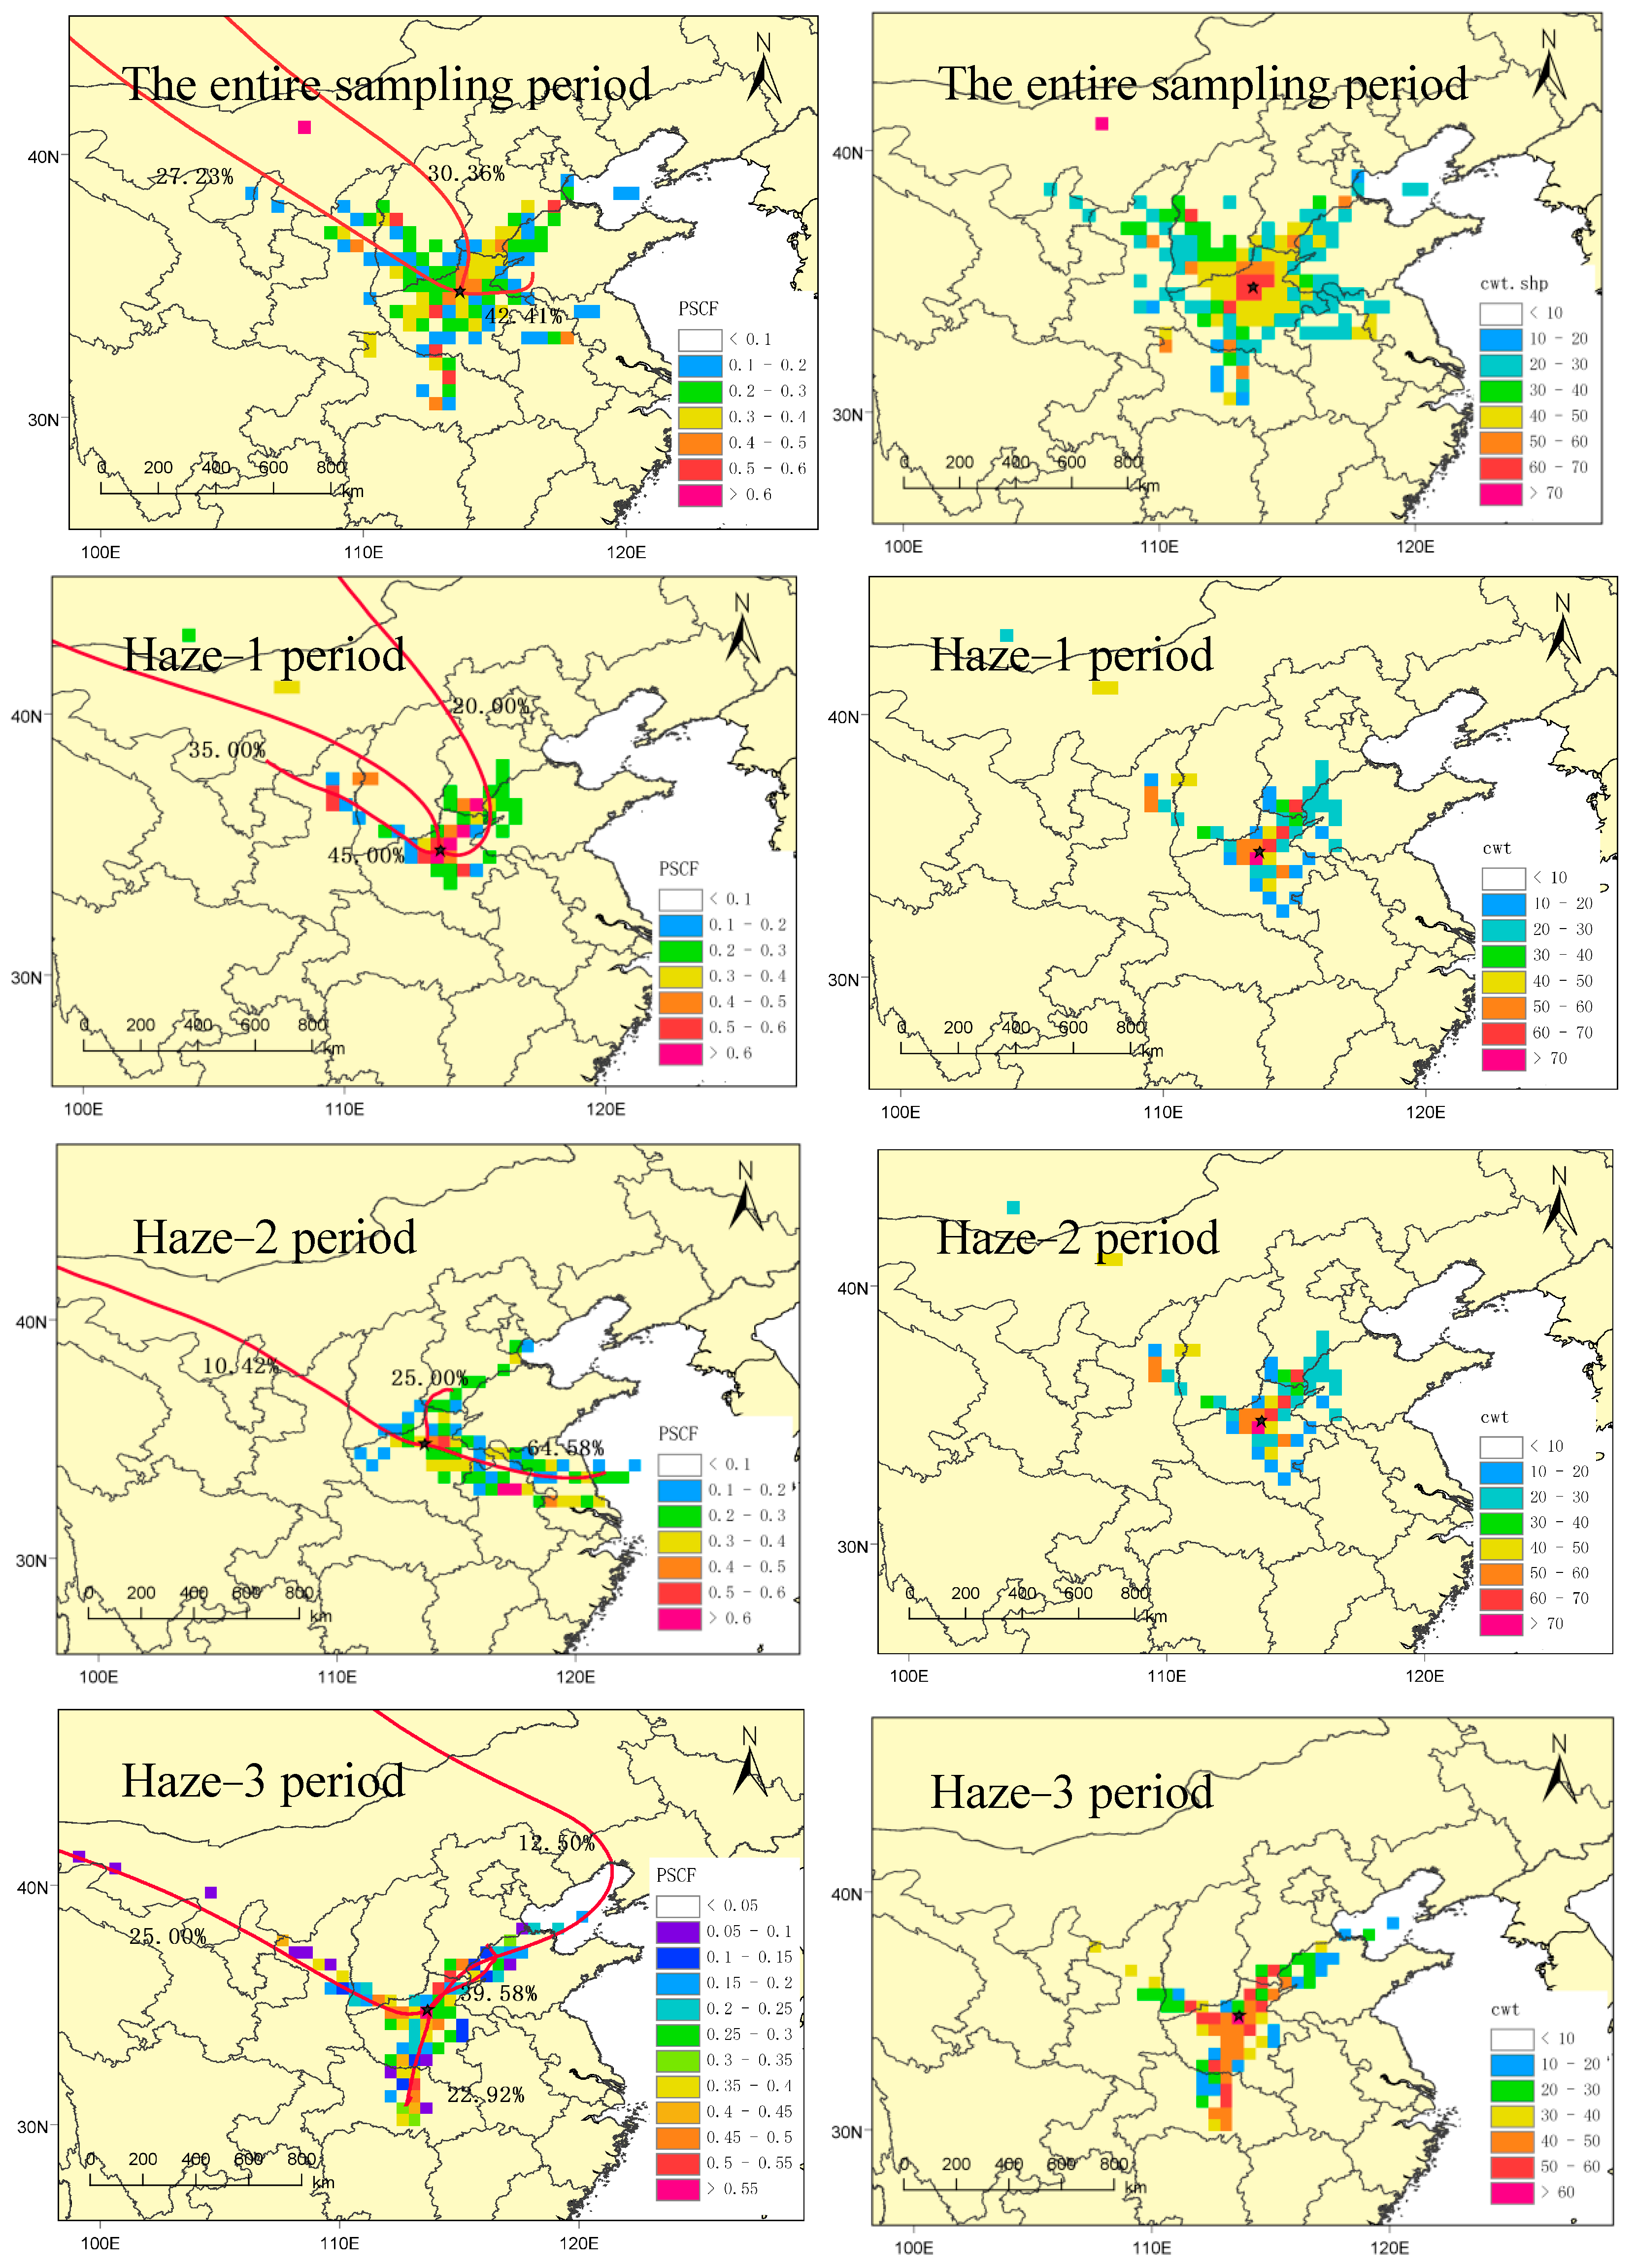
In addition to local emission sectors, regional transport was also an important source of the atmospheric VOCs. Figure 6 shows the backward trajectory results during the entire sampling period and three haze events. During the observation period, the local atmospheric VOCs species were greatly diluted by the long-distance transport from of massive clean air driven by northwest winds and the VOCs concentrations tended to disperse [34]. In addition, the short-distance air transport from the northeast direction, mainly originating from the local area of Henan province, was one major influencing factor of the air quality in Zhengzhou.
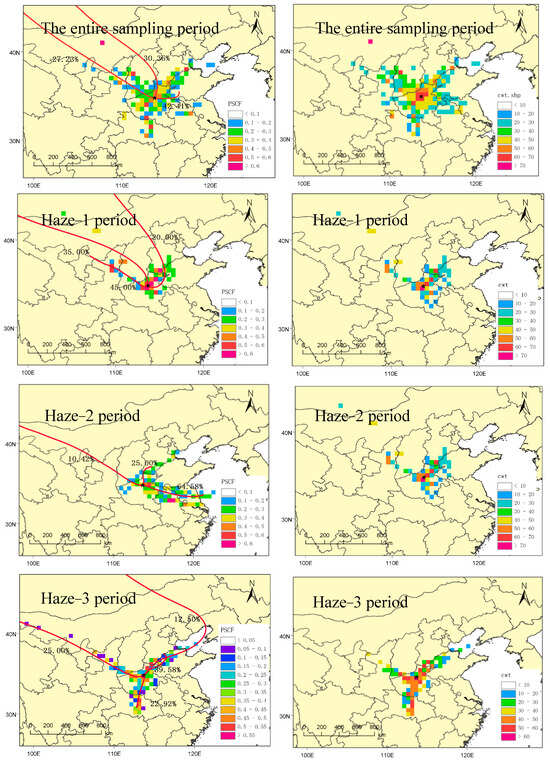
Figure 6.
The PSCF and CWT maps for VOCs during the entire sampling period and the three haze events (The red line in the picture represents the trajectory of the air mass and the black star indicate the locations of observation stations).
As for haze periods, the high values of PSCF and CWT of VOCs were distributed in the surrounding regions around the sampling site. Specially, the potential source region in this study, including the Beijing–Tianjin–Hebei (BTH) region and the northern part of Henan Province. These areas are apparently the most polluted areas in China; therefore, the polluted air masses were transported from such regions and led to the accumulation of VOCs concentrations. For the three different haze events, both PSCF and CWT algorithms indicated that the surrounding areas of Zhengzhou were the major potential source areas of contamination. Thus, strengthening the control over the local sources will be the most important measure to reduce VOCs concentrations and alleviate haze pollution. Meanwhile, regional cooperative is also essential, especially with northeast cities, for air quality improvement of the whole area.
3.4. Source Analysis
3.4.1. Identification of PMF Factors
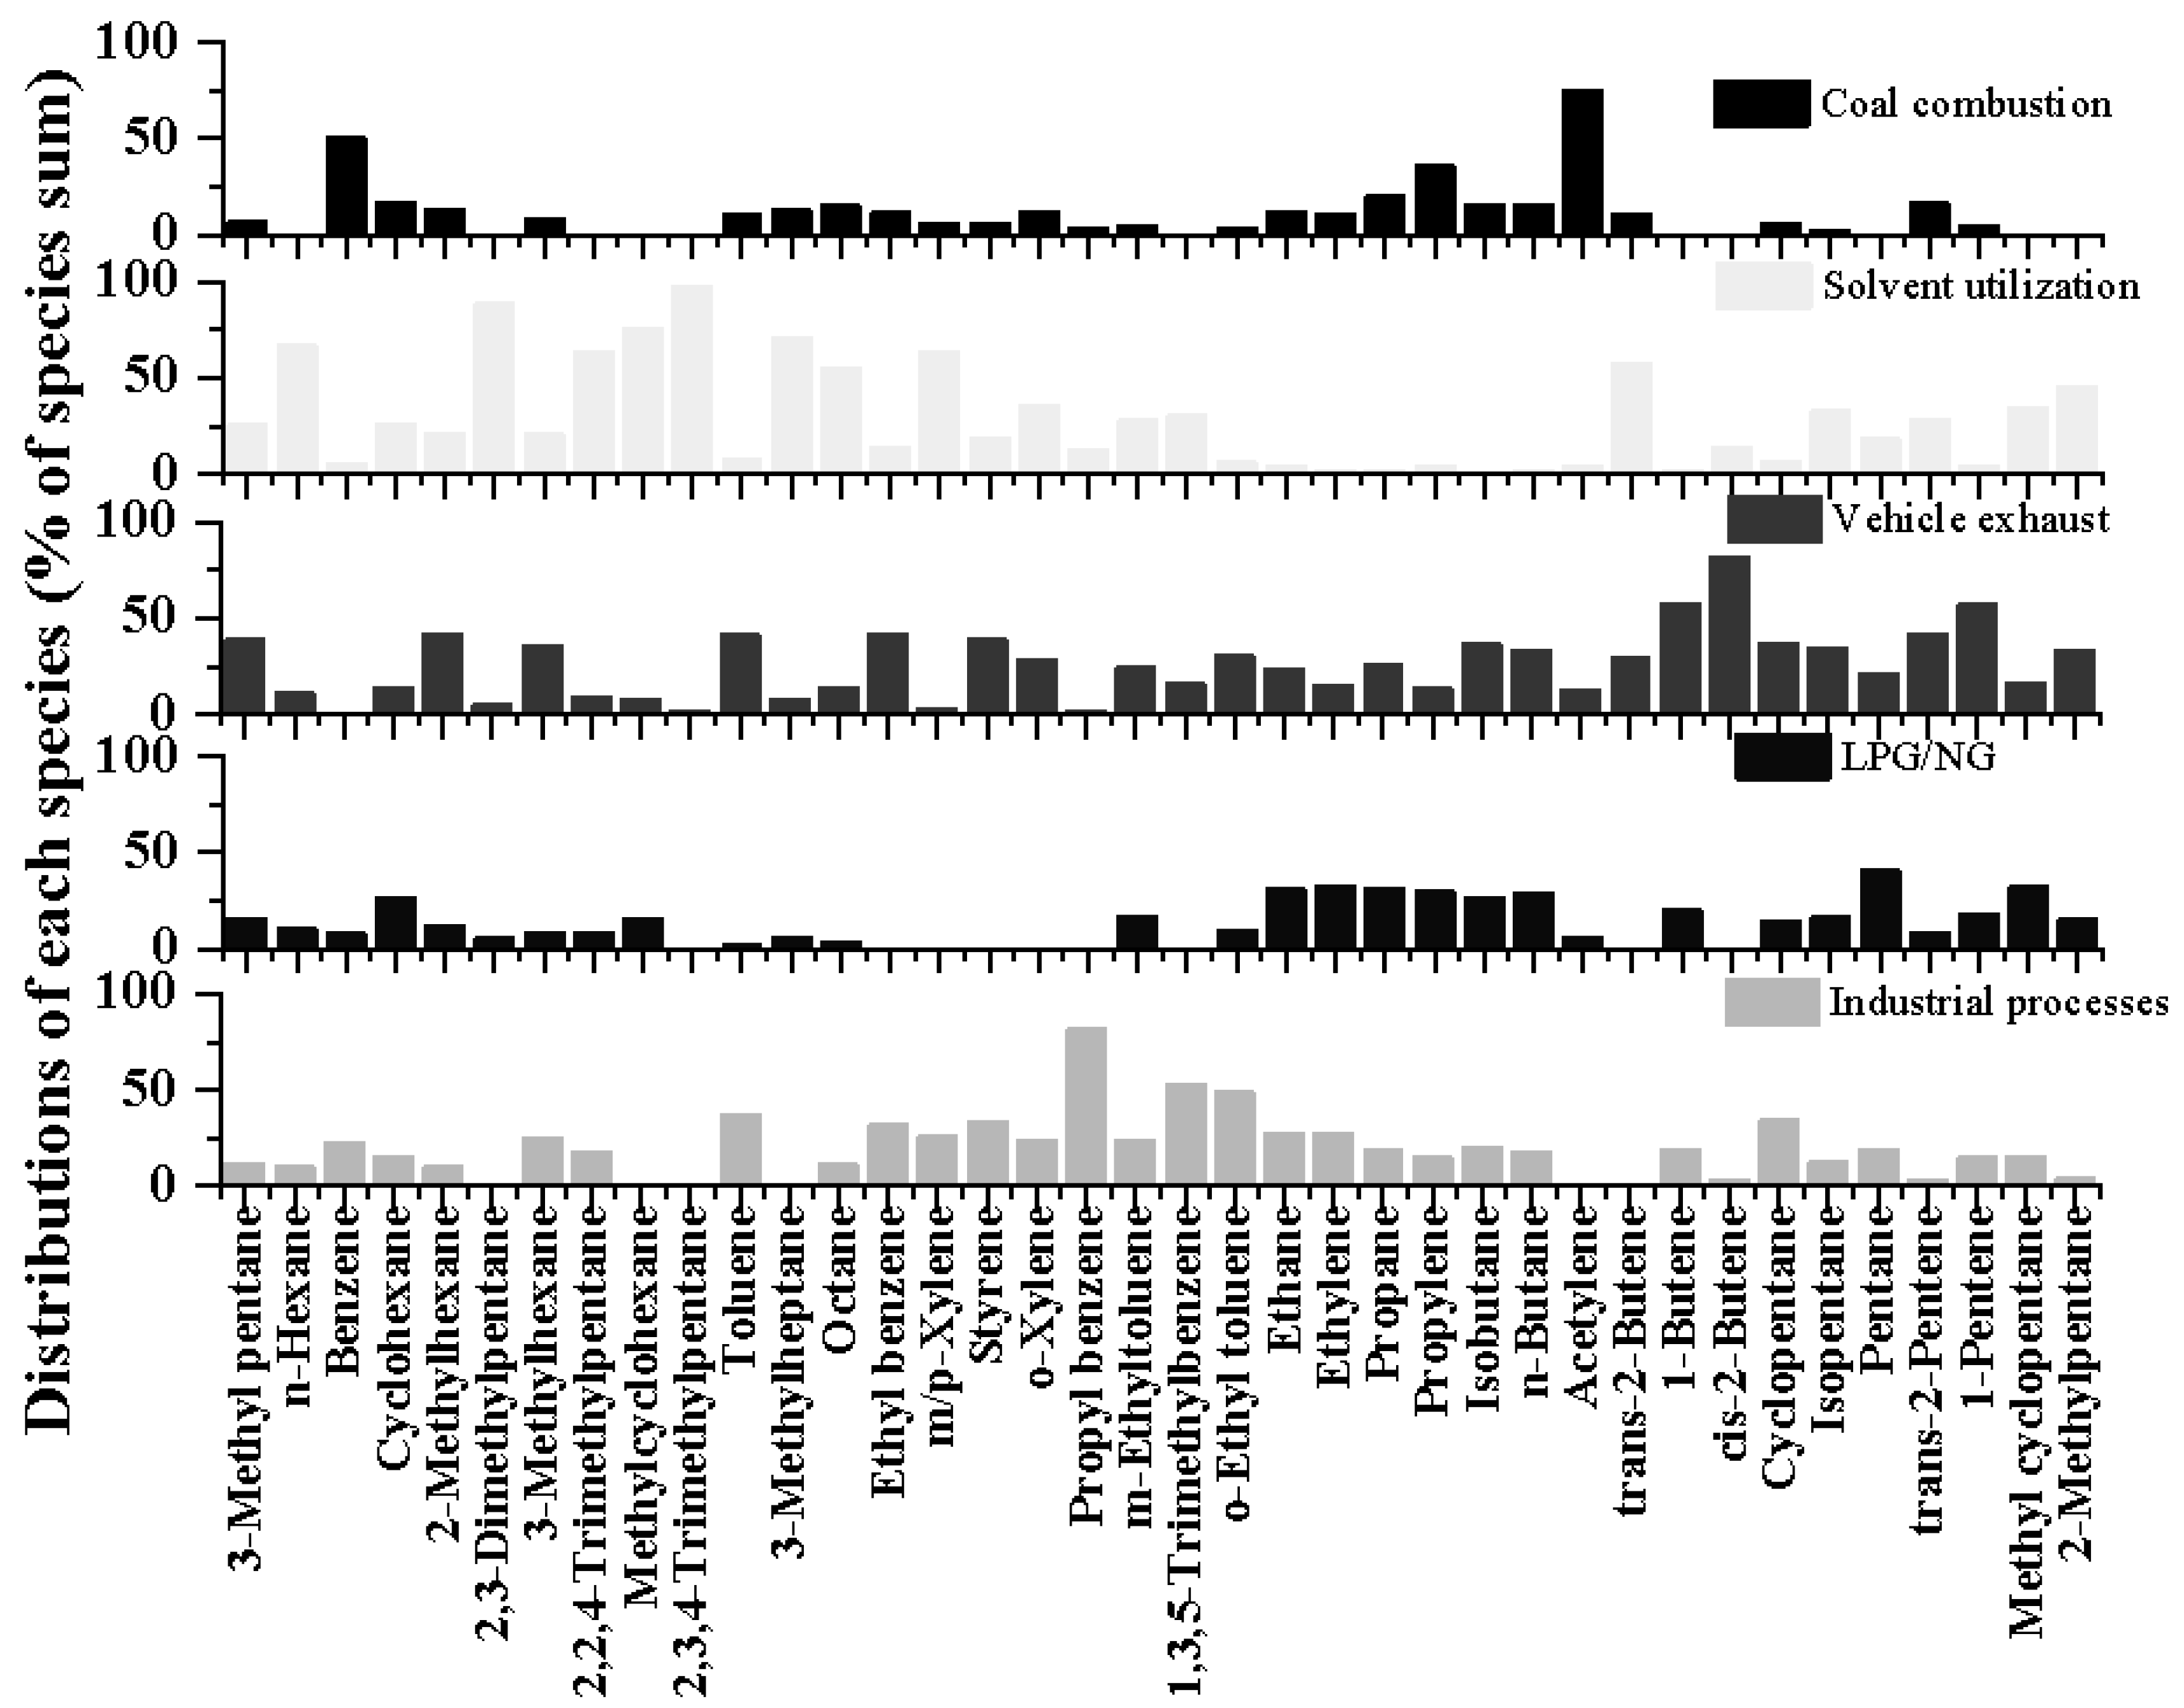
In the PMF calculation, five sources were identified, including (1) coal combustion, (2) solvent utilization, (3) vehicle exhaust, (4) LPG/NG and (5) industrial process. The percentage contributions of all factors to VOCs species are presented in Figure 7.

Figure 7.
Source profiles (percentage of species) resolved from PMF model.
The characteristic substances of factor 1 were high proportion of acetylene, benzene and propylene. Both benzene and propylene can be released during combustion. Acetylene is a characteristic product of incomplete combustion [44,45,46]. Therefore, this factor was identified as coal combustion.
In factor 2, C5–C8 alkanes (such as 2,3-dimethylpentane, 2,2,4-trimethylpentane, methylcyclohexane) accounted for a high proportion, and this factor was rich in n-hexane and m/p-xylene. N-hexane is a widely used solvent and adhesive [47], and m/p-xylene is also often used in paint and coatings [48,49]. 2,3-dimethylpentane, 2,2,4-trimethylpentane, methylcyclohexane and other substances are volatile tracers of gasoline and diesel fuel [39]. Because the contribution of C2-substances in factor 2 as the combustion source was very low, this source was identified as solvent utilization.
The third factor was determined by the high percentage of C4–C6 alkanes and olefins (3-methylpentane, 2-methylhexane, 3-methylhexane, 1-butene, cis 2-butene, trans 2-pentene, 1-pentene) and a certain amount of aromatic hydrocarbons (toluene, ethylbenzene, styrene), which are important indicators of vehicle exhaust. Low carbon olefin is the characteristic species of the petrochemical industry, and the high proportion of olefin species is the main feature of China’s oil products; 3-methylpentane, 2-methylhexane and 3-methylhexane mainly come from traffic emissions [50]; aromatics was the typical emissions of vehicular exhaust [51]. Therefore, factor 3 was defined as vehicle exhaust.
The fourth factor was related to LPG/NG, because it was rich in C2–C4 hydrocarbons (ethane, ethylene, propane, propylene), and the aromatic content of this source was very limited. Low carbon alkanes and alkenes are related to the use of LPG/NG; isopentane and n-pentane are typical tracers of gasoline evaporation [44,52].
The fifth factor was determined by the high proportion of aromatic hydrocarbons (toluene, propylbenzene, 1,3,5-trimethylbenzene, o-ethyltoluene) and a small amount of alkanes and alkenes [48]. The main sources of industrial aromatic hydrocarbons are coal and petroleum, and long-chain alkanes may also come from industrial production [53]. Factor 5 is thus defined as an industrial process.
3.4.2. Source Apportionment
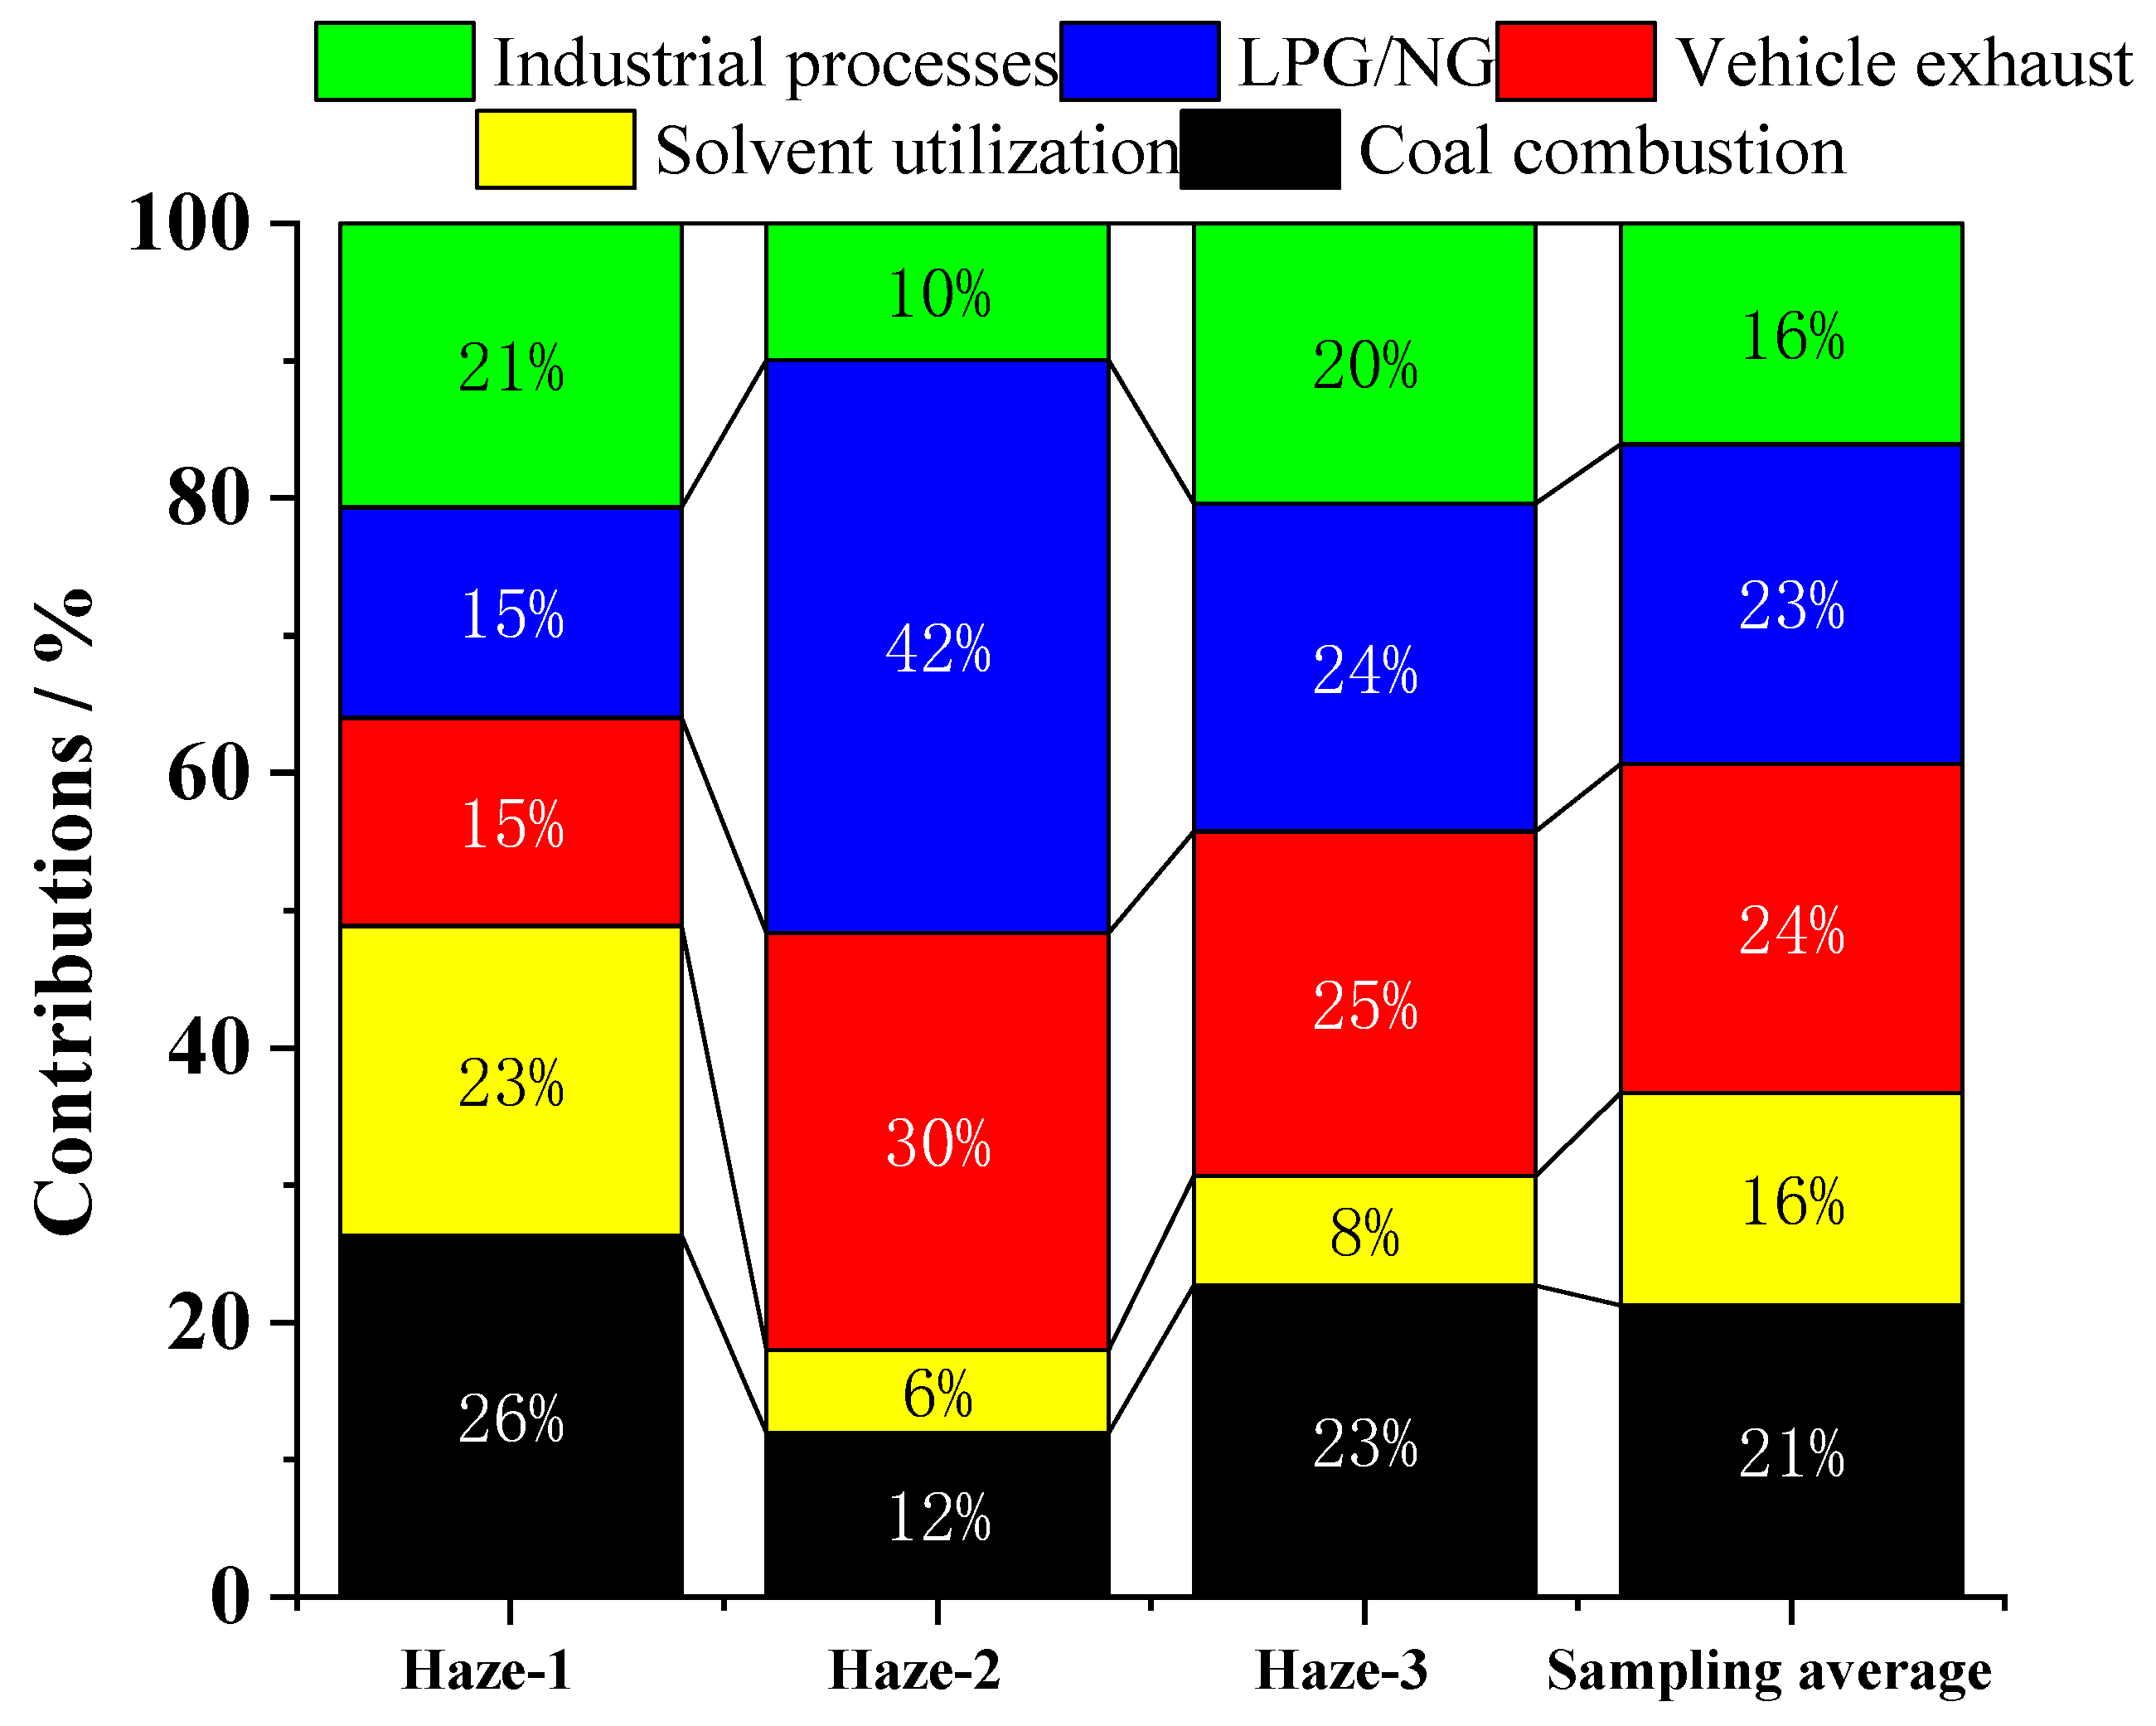
The source apportionment results of VOCs and their daily variation during the sampling period are presented in Figure 8 and Figure S7, respectively. Vehicle exhaust was found to have the largest contribution (24%) to atmospheric VOCs, and the emission rate peaked during traffic rush hours. As a transportation hub, the winter-time atmospheric VOCs contribution by numerous motor vehicles of Zhengzhou (approximately 4 million in 2018) was significant. The second and third largest source were LPG/NG and coal combustion, contributing to 23% and 21% of the total, respectively. It should be noted that these two sources had such high emission intensity that they almost offset the daytime valley [28]. There were a number of residence communities around the observation station, which might be the main reason for the high concentrations of VOCs from LPG/NG. In addition, its contribution in haze-2 was relatively high since usage of LPG/NG was steady in winter while the emission intensity of other sectors diminished due to the CNY festival. The contributions of industrial processes (16%) and solvent utilization (16%) were relatively low, probably due to the strict control of industry and small scattered enterprises in winter. In general, form diurnal variation exhibited higher levels during night-time than during daytime, which could mainly be attributed to the variations of boundary layer height and photochemical consumption during the daytime [28].
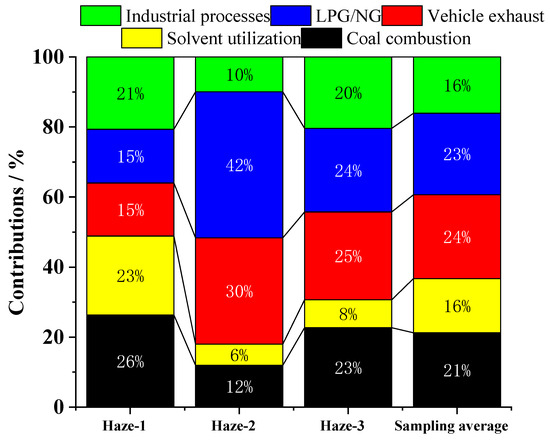
Figure 8.
Contributions (%) for the five sources identified by PMF model during the sampling period.
The results of VOCs source apportionment in three haze periods are shown in Figure 8. For the haze-1 period, the largest contributor of VOCs emission was combustion (23 ppbv), accounting for 26% of TVOC. Solvent utilization, industrial processes, vehicular exhaust and LPG/NG contributed 20, 18, 13 and 13 ppbv, accounting for 23%, 21%, 15% and 15% of TVOC, respectively. In haze-2, the largest contributor was LPG/NG, accounting for 42% of TVOC. The second and third contributor were vehicular exhaust and coal combustion, accounting for 30% and 12% of TVOCs, respectively. Industrial processes and solvent utilization were slightly reduced due to the effect of the CNY festival. With the return of traffic peak after the festival, the largest contributor changed to vehicular exhaust (25%) in haze-3, followed by LPG/NG (24%), combustion (23%), industrial processes (20%) and solvent utilization (8%).
3.4.3. Source Contributions to the SOAp
To assess the influence of SOA precursor emissions, the contributions of the SOAp of each source have been estimated based on the PMF results and shown in Table 2. The highest SOAp contributions were observed in the haze-1 period with a value of 3923 µg/cm3. During this period, the main contributors were industrial processes (1669 µg/cm3) and solvent utilization (1275 µg/cm3), accounting for 43% and 33% of total SOAp. Considering the meteorological conditions at this stage, the haze event was more likely to be caused by emissions, and the industrial and solvent sources had a greater impact on the haze. During the haze-3 period, the SOAp contribution was also relative higher. The SOAp of industrial processes was much higher than that of other sources, with the value of 1583 µg/cm3, accounting for 49% of total SOAp. Solvent utilization was the second largest source of anthropogenic SOA precursors in haze-3, with the SOAp-weighted mass contributions of 767 µg/cm3, accounting for 24% of the total SOAp. At the end of the CNY festival, the anthropogenic emissions began to aggravate, leading to the haze pollution in this period.
Table 2.
SOAp-weighted mass concentrations (µg/cm3) of each VOCs source during the three haze events.
In comparison to the haze days, the SOAp was lower during the clean day, which was even less than half of the haze-1 period. However, the haze-2 period had the lowest SOAp (1574 µg/cm3) during the whole sampling period, Due to CNY festival effects, the SOA contributions by industrial processes and solvent utilization were significantly reduced, contributing 464 µg/cm3 and 196 µg/cm3 to the SOAp, respectively. Vehicle emission was the largest source (575 µg/cm3) and accounted for 37% of the SOAp. Additionally, the emission of motor vehicles and other unidentified sources (such as fireworks) might also lead to the pollution aggravation under the adverse meteorological conditions [28].
The comparison of SOAP results with other reported findings indicates that the concentrations in this study are similar to those found in [54]. When considering SOAP from various sources, our study closely correlates with results from Ningbo [55], suggesting a predominant contribution from industrial sources and solvent usage. Regarding differences between winter pollution and non-pollution days, our findings mirror those observed in Beijing [21], where SOAP levels are notably higher on polluted days compared to non-polluted days. Overall, the SOAP of winter VOCs in Zhengzhou city is relatively high, highlighting the need to prioritize emission reduction efforts from industrial and solvent sources, particularly during the city’s haze periods.
4. Conclusions
In this study, the concentrations of 57 VOCs species were observed continuously in February 2018 at an urban site in Zhengzhou, China. Three haze periods were identified, and the corresponding concentrations of TVOC were 92 ppbv, 62 ppbv and 83 ppbv, respectively, which were higher than that in non-polluted days (57 ppbv). Alkanes were found to be the most abundant group during different haze events. The radical components derived from alkenes and aromatics in the haze-1 and haze-3 periods were higher than those in clean days, which might be one of the factors leading to the rise of SOA amount. There was a minor peak of VOCs at midnight during haze days which could not be observed during clean days. Moreover, the selected sampling site was also affected by the northeast long-distance airborne transport during the haze periods based on the result of the PSCF and CWT model.
During the CNY, some ordinary emissions (such as industrial production and traffic) were decreased, leading to a significant reduction in the concentration of particulate matter precursor. Meanwhile, firework displaying events were identified, by which the emission patterns were greatly changed. The events produced a large amount of pollutants including VOCs, particulate matter and tracer gases, which caused haze pollution in this period; this further indicated the importance of strict emission control of fireworks.
In the PMF study, VOCs species were divided into five sources categories as industrial processes, solvent usage, vehicle exhaust, LPG/NG and coal/biomass combustion. The results showed that vehicle exhaust (24%), LPG/NG (23%) and coal combustion (21%) were the major sources for ambient VOCs. Although industry and solvents contributed 16% and 16% to the total VOCs, respectively, their SOA contributions were relatively higher, especially in the haze-1 and haze-3 periods. Affected by CNY, the haze-2 period was found to have the lowest SOAp during the sampling period, mainly due to the reduction of industrial and solvent emission.
Supplementary Materials
The following supporting information can be downloaded at: https://www.mdpi.com/article/10.3390/atmos15081009/s1, Figure S1: Standard Gas Chromatogram of GC 5000; Figure S2: The ratios of Q/Qexp at factor size ranged from 2–8; Figure S3: Pearson correlation analysis (r) of VOCs, trace gases and meteorological parameters during daytime; Figure S4: A histogram for mean PM2.5 concentration vs days for the entire measurement period; Figure S5: Diurnal variations of VOCs meteorological conditions during the measurements; Figure S6: Diurnal variations of trace gases during clean days (a,c,e) and haze days (b,d,f); Figure S7: Diurnal patterns of five factors from the PMF results; Table S1: The trace gases and meteorological parameters during different periods; Table S2: Concentrations and proportions of VOCs species during different periods; Text S1: Introduction to VOCs analysis testing instrument.
Author Contributions
S.Y. and Q.X. planned and organized the study and were deeply involved in the writing of the manuscript. C.X. and F.D. assisted heavily with the atmospheric measurements and data analysis. C.X. and B.Z. conducted the model development and data analysis. All authors have read and agreed to the published version of the manuscript.
Funding
This work was supported by the National Key Research and Development Program of Henan (No. 241111320300) and National Key Research and Development Program of China (No. 2017YFC0212403).
Institutional Review Board Statement
Not applicable.
Data Availability Statement
The data set is available to the public and can be accessed upon request from Qixiang Xu (xuqixiang@zzu.edu.cn).
Conflicts of Interest
The authors declare no conflict of interest.
References
- Li, J.; Zhai, C.; Yu, J.; Liu, R.; Li, Y.; Zeng, L.; Xie, S. Spatiotemporal variations of ambient volatile organic compounds and their sources in Chongqing, a mountainous megacity in China. Sci. Total Environ. 2018, 627, 1442–1452. [Google Scholar] [PubMed]
- Sheng, J.; Zhao, D.; Ding, D.; Li, X.; Huang, M.; Gao, Y.; Quan, J.; Zhang, Q. Characterizing the level, photochemical reactivity, emission, and source contribution of the volatile organic compounds based on PTR-TOF-MS during winter haze period in Beijing, China. Atmos. Res. 2018, 212, 54–63. [Google Scholar]
- Hu, R.; Liu, G.; Zhang, H.; Xue, H.; Wang, X. Levels, characteristics and health risk assessment of VOCs in different functional zones of Hefei. Ecotox. Environ. Safe. 2018, 160, 301–307. [Google Scholar]
- Jaars, K.; Vestenius, M.; van Zyl, P.G.; Beukes, J.P.; Hellén, H.; Vakkari, V.; Venter, M.; Josipovic, M.; Hakola, H. Receptor modelling and risk assessment of volatile organic compounds measured at a regional background site in South Africa. Atmos. Environ. 2018, 172, 133–148. [Google Scholar]
- Cui, L.; Li, R.; Zhang, Y.; Meng, Y.; Zhao, Y.; Fu, H. A geographically and temporally weighted regression model for assessing intra-urban variability of volatile organic compounds (VOCs) in Yangpu district, Shanghai. Atmos. Environ. 2019, 213, 746–756. [Google Scholar]
- Song, C.; Liu, B.; Dai, Q.; Li, H.; Mao, H. Temperature dependence and source apportionment of volatile organic compounds (VOCs) at an urban site on the north China plain. Atmos. Environ. 2019, 207, 167–181. [Google Scholar]
- Mozaffar, A.; Zhang, Y.; Fan, M.; Fang, C.; Lin, Y. Characteristics of summertime ambient VOCs and their contributions to O3 and SOA formation in a suburban area of Nanjing, China. Atmos. Res. 2020, 240, 104923. [Google Scholar]
- Sun, J.; Gong, J.; Zhou, J.; Liu, J.; Liang, J. Analysis of PM2.5 pollution episodes in Beijing from 2014 to 2017: Classification, interannual variations and associations with meteorological features. Atmos. Environ. 2019, 213, 384–394. [Google Scholar]
- Tao, H.; Xing, J.; Zhou, H.; Pleim, J.; Ran, L.; Chang, X.; Wang, S.; Chen, F.; Zheng, H.; Li, J. Impacts of improved modeling resolution on the simulation of meteorology, air quality, and human exposure to PM2.5, O3 in Beijing, China. J. Clean. Prod. 2020, 243, 118574. [Google Scholar]
- Gao, J.; Zhang, J.; Li, H.; Li, L.; Xu, L.; Zhang, Y.; Wang, Z.; Wang, X.; Zhang, W.; Chen, Y.; et al. Comparative study of volatile organic compounds in ambient air using observed mixing ratios and initial mixing ratios taking chemical loss into account—A case study in a typical urban area in Beijing. Sci. Total Environ. 2018, 628–629, 791–804. [Google Scholar]
- Gu, Y.; Li, Q.; Wei, D.; Gao, L.; Tan, L.; Su, G.; Liu, G.; Liu, W.; Li, C.; Wang, Q. Emission characteristics of 99 NMVOCs in different seasonal days and the relationship with air quality parameters in Beijing, China. Ecotox. Environ. Safe. 2019, 169, 797–806. [Google Scholar]
- Yang, Y.; Ji, D.; Sun, J.; Wang, Y.; Yao, D.; Zhao, S.; Yu, X.; Zeng, L.; Zhang, R.; Zhang, H.; et al. Ambient volatile organic compounds in a suburban site between Beijing and Tianjin: Concentration levels, source apportionment and health risk assessment. Sci. Total Environ. 2019, 695, 133889. [Google Scholar] [PubMed]
- Lyu, X.; Wang, N.; Guo, H.; Xue, L.; Jiang, F.; Zeren, Y.; Cheng, H.; Cai, Z.; Han, L.; Zhou, Y. Causes of a continuous summertime O3 pollution event in Jinan, a central city in the North China Plain. Atmos. Chem. Phys. 2019, 19, 3025–3042. [Google Scholar]
- Tan, Z.; Lu, K.; Jiang, M.; Su, R.; Dong, H.; Zeng, L.; Xie, S.; Tan, Q.; Zhang, Y. Exploring ozone pollution in Chengdu, southwestern China: A case study from radical chemistry to O3-VOC-NOx sensitivity. Sci. Total Environ. 2018, 636, 775–786. [Google Scholar] [PubMed]
- Yang, Y.; Liu, X.; Zheng, J.; Tan, Q.; Feng, M.; Qu, Y.; An, J.; Cheng, N. Characteristics of one-year observation of VOCs, NOx, and O3 at an urban site in Wuhan, China. J. Environ. Sci. 2019, 79, 297–310. [Google Scholar]
- Sun, J.; Wu, F.; Hu, B.; Tang, G.; Zhang, J.; Wang, Y. VOC characteristics, emissions and contributions to SOA formation during hazy episodes. Atmos. Environ. 2016, 141, 560–570. [Google Scholar]
- Yang, W.; Zhang, Y.; Wang, X.; Li, S.; Zhu, M.; Yu, Q.; Li, G.; Huang, Z.; Zhang, H.; Wu, Z.; et al. Volatile organic compounds at a rural site in Beijing: Influence of temporary emission control and wintertime heating. Atmos. Chem. Phys. 2018, 18, 12663–12682. [Google Scholar]
- Zhou, X.; Li, Z.; Zhang, T.; Wang, F.; Wang, F.; Tao, Y.; Zhang, X.; Wang, F.; Huang, J. Volatile organic compounds in a typical petrochemical industrialized valley city of northwest China based on high-resolution PTR-MS measurements: Characterization, sources and chemical effects. Sci. Total Environ. 2019, 671, 883–896. [Google Scholar]
- Huang, R.; Zhang, Y.; Bozzetti, C.; Ho, K.; Cao, J.; Han, Y.; Daellenbach, K.R.; Slowik, J.G.; Platt, S.M.; Canonaco, F.; et al. High secondary aerosol contribution to particulate pollution during haze events in China. Nature 2014, 514, 218–222. [Google Scholar]
- Zhu, Y.; Yang, L.; Kawamura, K.; Chen, J.; Ono, K.; Wang, X.; Xue, L.; Wang, W. Contributions and source identification of biogenic and anthropogenic hydrocarbons to secondary organic aerosols at Mt. Tai in 2014. Environ. Pollut. 2017, 220, 863–872. [Google Scholar]
- Hui, L.; Liu, X.; Tan, Q.; Feng, M.; An, J.; Qu, Y.; Zhang, Y.; Cheng, N. VOC characteristics, sources and contributions to SOA formation during haze events in Wuhan, Central China. Sci. Total Environ. 2019, 650, 2624–2639. [Google Scholar]
- Jiang, N.; Duan, S.; Yu, X.; Zhang, R.; Wang, K. Comparative major components and health risks of toxic elements and polycyclic aromatic hydrocarbons of PM2.5 in winter and summer in Zhengzhou: Based on three-year data. Atmos. Res. 2018, 213, 173–184. [Google Scholar]
- Jiang, N.; Li, L.; Wang, S.; Li, Q.; Dong, Z.; Duan, S.; Zhang, R.; Li, S. Variation tendency of pollution characterization, sources, and health risks of PM2.5-bound polycyclic aromatic hydrocarbons in an emerging megacity in China: Based on three-year data. Atmos. Res. 2019, 217, 81–92. [Google Scholar]
- Wang, S.; Yin, S.; Zhang, R.; Yang, L.; Zhao, Q.; Zhang, L.; Yan, Q.; Jiang, N.; Tang, X. Insight into the formation of secondary inorganic aerosol based on high-time-resolution data during haze episodes and snowfall periods in Zhengzhou, China. Sci. Total Environ. 2019, 660, 47–56. [Google Scholar] [PubMed]
- Wang, S.; Yu, R.; Shen, H.; Wang, S.; Hu, Q.; Cui, J.; Yan, Y.; Huang, H.; Hu, G. Chemical characteristics, sources, and formation mechanisms of PM2.5 before and during the Spring Festival in a coastal city in Southeast China. Environ. Pollut. 2019, 251, 442–452. [Google Scholar] [PubMed]
- Zhang, J.; Wu, L. The influence of population movements on the urban relative humidity of Beijing during the Chinese Spring Festival holiday. J. Clean. Prod. 2018, 170, 1508–1513. [Google Scholar]
- Wen, J.; Shi, G.; Tian, Y.; Chen, G.; Liu, J.; Huang, F.Y.; Ivey, C.E.; Feng, Y. Source contributions to water-soluble organic carbon and water-insoluble organic carbon in PM2.5 during Spring Festival, heating and non-heating seasons. Ecotox. Environ. Safe. 2018, 164, 172–180. [Google Scholar]
- Li, B.W.; Ho, S.S.H.; Gong, S.L.; Ni, J.W.; Li, H.R.; Han, L.Y.; Yang, Y.; Qi, Y.J.; Zhao, D.X. Characterization of VOCs and their related atmospheric processes in a central Chinese city during severe ozone pollution periods. Atmos. Chem. Phys. 2019, 19, 617–638. [Google Scholar]
- Ren, Y.; Ma, S.; Wang, W.; Yu, S.; Li, Y.; Zhang, R.; Yin, S. Ambient VOCs characteristics, ozone formation potential, and source apportionment of air pollution in spring in Zhengzhou. Environ. Sci. 2020, 41, 2577–2585. [Google Scholar]
- Zou, Y.; Deng, X.J.; Zhu, D.; Gong, D.C.; Wang, H.; Li, F.; Tan, H.B.; Deng, T.; Mai, B.R.; Liu, X.T.; et al. Characteristics of 1 year of observational data of VOCs, NOx and O3 at a suburban site in Guangzhou, China. Atmos. Chem. Phys. 2015, 15, 6625–6636. [Google Scholar]
- Yadav, R.; Sahu, L.K.; Tripathi, N.; Pal, D.; Beig, G.; Jaaffrey, S.N.A. Investigation of emission characteristics of NMVOCs over urban site of western India. Environ. Pollut. 2019, 252, 245–255. [Google Scholar]
- Li, K.; Li, J.; Wang, W.; Tong, S.; Liggio, J.; Ge, M. Evaluating the effectiveness of joint emission control policies on the reduction of ambient VOCs: Implications from observation during the 2014 APEC summit in suburban Beijing. Atmos. Environ. 2017, 164, 117–127. [Google Scholar]
- Song, M.; Liu, X.; Zhang, Y.; Shao, M.; Lu, K.; Tan, Q.; Feng, M.; Qu, Y. Sources and abatement mechanisms of VOCs in southern China. Atmos. Environ. 2019, 201, 28–40. [Google Scholar]
- Liu, Y.; Song, M.; Liu, X.; Zhang, Y.; Hui, L.; Kong, L.; Zhang, Y.; Zhang, C.; Qu, Y.; An, J.; et al. Characterization and sources of volatile organic compounds (VOCs) and their related changes during ozone pollution days in 2016 in Beijing, China. Environ. Pollut. 2020, 257, 113599. [Google Scholar] [PubMed]
- Derwent, R.G.; Jenkin, M.E.; Utembe, S.R.; Shallcross, D.E.; Murrells, T.P.; Passant, N.R. Secondary organic aerosol formation from a large number of reactive man-made organic compounds. Sci. Total Environ. 2010, 408, 3374–3381. [Google Scholar]
- Draxler, R.R.; Hess, G.D. An overview of the hysplit-4 modeling system for trajectories. Aust. Meteorol. Mag. 1998, 47, 295–308. [Google Scholar]
- Wei, X.Y.; Liu, M.; Yang, J.; Du, W.N.; Sun, X.; Huang, Y.P.; Zhang, X.; Khalil, S.K.; Luo, D.M.; Zhou, Y.D. Characterization of PM2.5-bound PAHs and carbonaceous aerosols during three-month severe haze episode in Shanghai, China: Chemical composition, source apportionment and long-range transportation. Atmos. Environ. 2019, 203, 1–9. [Google Scholar]
- Wang, Y.Q.; Zhang, X.Y.; Draxler, R.R. TrajStat: GIS-based software that uses various trajectory statistical analysis methods to identify potential sources from longterm air pollution measurement data. Environ. Model. Softw. 2009, 24, 938–939. [Google Scholar]
- Wu, R.; Li, J.; Hao, Y.; Li, Y.; Zeng, L.; Xie, S. Evolution process and sources of ambient volatile organic compounds during a severe haze event in Beijing, China. Sci. Total Environ. 2016, 560–561, 62–72. [Google Scholar]
- Zhang, Q.; Wu, L.; Fang, X.; Liu, M.; Zhang, J.; Shao, M.; Lu, S.; Mao, H. Emission factors of volatile organic compounds (VOCs) based on the detailed vehicle classification in a tunnel study. Sci. Total Environ. 2018, 624, 878–886. [Google Scholar]
- Zheng, H.; Kong, S.; Yan, Y.; Chen, N.; Yao, L.; Liu, X.; Wu, F.; Cheng, Y.; Niu, Z.; Zheng, S.; et al. Compositions, sources and health risks of ambient volatile organic compounds (VOCs) at a petrochemical industrial park along the Yangtze River. Sci. Total Environ. 2020, 703, 135505. [Google Scholar]
- Yan, Y.; Peng, L.; Li, R.; Li, Y.; Li, L.; Bai, H. Concentration, ozone formation potential and source analysis of volatile organic compounds (VOCs) in a thermal power station centralized area: A study in Shuozhou, China. Environ. Pollut. 2017, 223, 295–304. [Google Scholar]
- Huang, Y.S.; Hsieh, C.C. Ambient volatile organic compound presence in the highly urbanized city: Source apportionment and emission position. Atmos. Environ. 2019, 206, 45–59. [Google Scholar]
- Liu, Y.; Lu, S.; Zeng, L.; Tang, D. Source profiles of volatile organic compounds (VOCs) measured in China: Part I. Atmos. Environ. 2008, 42, 6247–6260. [Google Scholar]
- Guo, H.; So, K.L.; Simpson, I.J.; Barletta, B.; Meinardi, S.; Blake, D.R. C1–C8 volatile organic compounds in the atmosphere of Hong Kong: Overview of atmospheric processing and source apportionment. Atmos. Environ. 2007, 41, 1456–1472. [Google Scholar]
- Lai, S.C.; Baker, A.K.; Schuck, T.J.; Brenninkmeijer, C.A.M.; Velthoven, P.V.; Oram, D.E.; Zahn, A.; Ziereis, H. Characterization and source regions of 51 high-CO events observed during Civil Aircraft for the Regular Investigation of the Atmosphere Based on an Instrument Container (CARIBIC) flights between south China and the Philippines, 2005–2008. J. Geophys. Res. 2011, 1169, 2001. [Google Scholar]
- Buzcu, B.; Fraser, M.P. Source identification and apportionment of volatile organic compounds in Houston, TX. Atmos. Environ. 2006, 40, 2385–2400. [Google Scholar]
- Guo, H.; Cheng, H.R.; Ling, Z.H.; Louie, P.K.K.; Ayoko, G.A. Which emission sources are responsible for the volatile organic compounds in the atmosphere of Pearl River Delta? J. Hazard. Mater. 2011, 188, 116–124. [Google Scholar]
- Kwon, K.D.; Jo, W.K.; Lim, H.J.; Jeong, W.S. Characterization of emissions composition for selected household products available in Korea. J. Hazard. Mater. 2007, 148, 192–198. [Google Scholar] [PubMed]
- Chan, L.Y.; Chu, K.W.; Zou, S.C.; Chan, C.-Y.; Wang, X.-M.; Barletta, B.; Blake, D.R.; Guo, H.; Tsai, W.-Y. Characteristics of nonmethane hydrocarbons (NMHCs) in industrial, industrial-urban, and industrial-surburban atmospheres of the Pearl River Delta (PRD) region of south China. NYSE JWA 2006, 111, D11304. [Google Scholar]
- Scheff, P.A.; Wadden, R.A.; Bates, B.A.; Aronian, P.F. Source fingerprints for receptor modeling of volatile organics. JAPCA 1989, 39, 469–478. [Google Scholar]
- Cai, C.J.; Geng, F.; Tie, X.; Yu, Q.; An, J. Characteristics and source apportionment of VOCs measured in Shanghai, China. Atmos. Environ. 2010, 44, 5005–5014. [Google Scholar]
- Srivastava, A.; Sengupta, B.; Dutta, S.A. Source apportionment of ambient VOCs in Delhi City. Sci. Total Environ. 2005, 343, 207–220. [Google Scholar] [PubMed]
- Li, J.; Xie, S.D.; Zeng, L.M.; Li, L.Y.; Li, Y.Q.; Wu, R.R. Characterization of ambient volatile organic compounds and their sources in Beijing, before, during, and after Asia-Pacific Economic Cooperation China 2014. Atmos. Chem. Phys. 2015, 15, 7945–7959. [Google Scholar]
- Mo, Z.; Shao, M.; Lu, S.; Niu, H.; Zhou, M.; Sun, J. Characterization of non-methane hydrocarbons and their sources in an industrialized coastal city, Yangtze River Delta, China. Sci. Total. Environ. 2017, 593–594, 641–653. [Google Scholar]
Disclaimer/Publisher’s Note: The statements, opinions and data contained in all publications are solely those of the individual author(s) and contributor(s) and not of MDPI and/or the editor(s). MDPI and/or the editor(s) disclaim responsibility for any injury to people or property resulting from any ideas, methods, instructions or products referred to in the content. |
© 2024 by the authors. Licensee MDPI, Basel, Switzerland. This article is an open access article distributed under the terms and conditions of the Creative Commons Attribution (CC BY) license (https://creativecommons.org/licenses/by/4.0/).