Abstract
The U.S. dairy sector is a significant emitter of methane and nitrous oxide, with the US EPA estimating it produced around 90 Tg CO2 eq. in 2021. This paper reviews the literature on and evaluates various mitigation actions for reducing GHG emissions in the U.S. dairy sector, focusing on both direct and indirect emission sources. We conducted a narrative literature review based on the cradle to gate life-cycle assessment method, covering the entire dairy supply chain up until milk enters retail establishments, including dairy and feed producing farm practices, processing, transportation, and their associated emissions/costs. The papers included were selected over a three year process depending on discussions with experts and issues mentioned in the emerging literature. We review significant opportunities for the U.S. dairy sector to reduce emissions, particularly through improved enteric fermentation and manure management practices. Additionally, we cover the potential for mitigating indirect emissions from feed production, processing, and transportation, areas less frequently covered in existing studies. This review also covers a gap in the literature by integrating economic findings including cost analysis and incentives to mitigate based on the social value of emissions reductions.
1. Introduction
The dairy sector is a significant source of global greenhouse gas emissions (GHGs), both from direct emissions through manure and enteric fermentation and indirect emissions though production of feeds, processing, and transportation [1,2]. Mitigation of GHG emissions, especially methane and nitrous oxide, is desirable, but simultaneously the sector needs to meet society’s dairy product and animal-sourced protein needs [3]. According to a 2019 report by FAO and the Global Dairy Platform, while global milk production grew by 30% from 2005 to 2015, the dairy sector’s GHG emissions increased by 18 percent over the same period. In the U.S., it is estimated that dairy production accounts for approximately 2% of total GHG emissions [4]. The dairy sector has the potential to reduce GHG emissions via many currently available mitigation options and new ones in development.
This article reviews and examines dairy GHG mitigation options based on the existing literature. This article is not the first literature review on dairy GHG mitigation options. A brief summary of existing literature review papers appears in the Supplemental Materials. We try to extend the reviews in two fundamental ways—complete coverage of the supply chain and introduction of economic findings. Several reviews discuss the impact of livestock on climate and potential GHG mitigation strategies [3,5,6,7,8]. These cover general mitigation strategies for livestock, particularly ruminants such as beef cattle, dairy cattle, sheep, and goats. They indicate that due to the distinct digestive physiology of ruminants, the effectiveness of potential strategies can vary across different ruminant types. For example, forage-related methane mitigation strategies are found to be more effective for cattle than for other ruminants [9] highlighting the need for species-specific research. In the case of dairy cattle, several reviews focus on strategies to reduce enteric fermentation-related methane emissions [10,11,12], while others concentrate on managing manure emissions [13,14,15,16]. However, only a few studies and none of the reviews address indirect dairy-related emissions, such as those arising from feed production, product processing, and transportation [4,17,18]. Integrating these aspects is crucial when considering total dairy sector emissions and we will review the literature across the complete supply chain.
Another significant omission from the reviews is economic concerns involving mitigation costs and effects on dairy product prices, as economics can hinder widespread adoption of emission-reducing mitigation measures [19]. Dairy farmers require information regarding the costs associated with mitigation, as well as opportunities to diversify their income through the production of branded products or participation in carbon offset markets. This study comprehensively reviews the situation covering both direct and indirect sources of dairy GHG emissions, and evidence on mitigation costs and the social cost of GHG emissions. Therefore, the objectives of this review are to assemble evidence on direct and indirect emission sources from the dairy sector across the total supply chain starting from feed production through until milk processing; summarize relevant mitigation strategies; review estimates of mitigation costs and their components; and identify research gaps, particularly regarding economics and incentive policy design.
In carrying out this review, we worked for over three years in assembling it and in the process consulted many experts to identify topics then used references and topics mentioned in papers along with Google Scholar to identify related pieces. We thus pursued the topic in greater depth as our review revealed dairy emissions aspects. We also note that the review is mainly based on research in major developed countries as that is where the bulk of the literature has arisen.
2. Direct and Indirect Emissions
The EPA estimates that total U.S. GHG emissions from livestock and related supply chains for 2021 were 278 Teragrams (Tg) CO2 eq., accounting for 43.8% of U.S. agricultural emissions [20]. Of this, the dairy sector directly contributes an estimated 90 Tg CO2 eq. from enteric fermentation and manure management. Indirect emissions related to the dairy sector come from feed production, product processing, and movements of raw milk and dairy products. In terms of GHGs, the dairy sector mainly produces methane (CH4), nitrous oxide (N2O), and carbon dioxide (CO2). A brief summary of the emission sources from the dairy sector appears in Table 1.

Table 1.
Direct and indirect emission sources from the dairy sector.
2.1. Direct Sources: Enteric Fermentation and Manure Management
2.1.1. Methane Emissions from Enteric Fermentation
Enteric fermentation is the largest source of direct emissions from dairy cattle, creating an estimated 49 Tg CO2 eq., or 54% of all direct dairy-related emissions [20]. Enteric fermentation results from the digestive process in ruminant animals such as cattle, sheep, goats, and buffalo. Plant biomass in the rumen is converted into volatile fatty acids, which pass through the rumen wall and the circulatory system to the liver. During that conversion, carbon dioxide and methane are produced and are expelled. The quantity of methane emissions depends upon the animal’s digestion system, feed intake, and management practices [6].
2.1.2. Methane and Nitrous Oxide Emissions from Manure Management
Manure management is the other large direct emission source, involving both methane and nitrous oxide. Manure-related emissions are estimated at 41 Tg CO2 eq., which accounts for 46% of direct dairy cattle emissions [20]. Under anaerobic conditions, the decomposition of organic matter in manure releases methane. The emission rate is determined by the composition of the manure, the method of manure handling, the type of storage facility, and environmental conditions. Water is often used to wash manure out of facilities, placing the manure in a semi-liquid form. Storing or disposing of liquefied manure slurry in lagoons or tanks creates an anaerobic environment that results in methane emissions. Warm and wet conditions and long-time storage can further increase methane emissions [5].
At the same time, nitrous oxide is emitted through both nitrification and denitrification processes that act on the nitrogen contained in manure. These nitrous oxide emissions are affected by handling systems, environmental conditions, and waste management duration. Nitrous oxide is also emitted when manure is deposited on pastures or stored in solid form, and in those cases a small amount of methane is also emitted [6].
Methane and nitrous oxide trap substantial heat. Methane has a global warming impact that is 27–30 times greater than carbon dioxide over 100 years while nitrous oxide has a global warming potential 273 times higher than carbon dioxide [21]. Figure 1 portrays EPA estimates of U.S. dairy emissions trends from manure management and enteric fermentation between 1990 and 2022. Emissions from manure management (represented by the blue line) were approximately 24 Tg CO2 eq. in 1990 and generally increased, peaking at around 38 Tg CO2 eq. in the early 2020s, before slightly declining thereafter. Emissions from enteric fermentation (depicted by the green line) began at about 45 Tg CO2 eq. in 1990, showed a slight initial decline, but generally rose over the years, reaching a peak of around 50 Tg CO2 eq. in the early 2020s, followed by a slight decrease. Despite this, the emissions per unit milk production from enteric fermentation and manure decreased across U.S. regions from 1990 to 2019. This decline was due to milk production increasing faster than enteric and manure emissions in all regions [22]. This evidence does show substantial potential for emissions mitigation in the U.S. dairy sector despite the level of adoption in select regions like California.
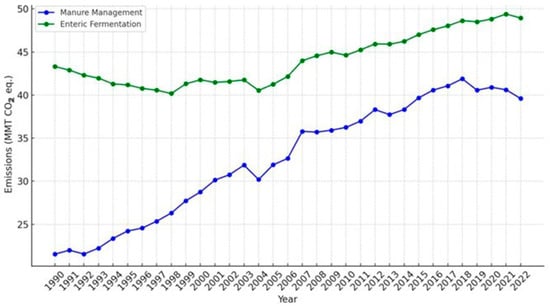
Figure 1.
The trends in U.S. dairy emissions from enteric fermentation and manure management between 1990 and 2022. Data source: US EPA https://cfpub.epa.gov/ghgdata/inventoryexplorer (assessed on 10 June 2024).
2.2. Indirect Sources: Feed Production; Processing, Packaging, and Distribution; Energy Consumption
2.2.1. Carbon Dioxide and Nitrous Oxide Emissions from Feed Production
GHG emissions from feed production and processing contribute an estimated 45% of global livestock-related emissions, which includes feed production, enteric fermentation, manure management, and transportation of animal products [3]. Almost 60% of the global biomass is used for animal feed or bedding [23]. The feed supply chain begins with growing crops and forages, such as soybeans, corn, and alfalfa hay. Carbon dioxide emissions arise from agricultural operations, processing and transportation of feed, as well as fossil fuels used in the production of fertilizer [7]. Nitrous oxide emissions result from the application of fertilizers (whether organic or synthetic) in crop production and from the direct deposition of manure on pastures, or during the handling and application of manure onto agricultural fields. The amount of nitrous oxide emissions can vary significantly based on factors such as temperature and humidity, leading to considerable uncertainty in measurement [3]. The specific contribution of feed production to total dairy-related GHG emissions requires further quantification.
2.2.2. Carbon Dioxide Emissions from Milk Assembly, Product Processing, Packaging, and Distribution
In the U.S., raw milk is generally moved from farms to processing locations using insulated tanker trucks. On average, each truck holds 5800 gallons of milk and completes a round trip covering approximately 500 miles [24]. In the United States, there are over 1000 processing facilities that transform milk into products such as cheese, yogurt, ice cream, powdered milk, and other related items [24].
The resultant products are then packaged in plastic, aluminum, grease-proof paper, or high-density polyethylene (HDPE) containers that keep dairy products clean and fresh. Dairy products are distributed from the processing facilities to retailers, schools, and other outlets. The carbon dioxide equivalent emissions associated with the processing, packaging, and distribution of packaged fluid milk were estimated to be 0.077, 0.054, and 0.072 kg of packaged milk, respectively [4]. GHG emissions come from energy use and leakage of refrigerants. Transport emissions depend on the total distance, transportation mode, emissions per unit of distance, and emissions of the cooling system [4]. More research is needed to develop emissions estimates for the processing and transport of dairy and more generally livestock products.
2.2.3. Carbon Dioxide Emissions from Energy Consumption
Energy consumption and associated emissions occur throughout the entirety of the dairy sector. The main emission from energy consumption is carbon dioxide. On the farm, about 43% of energy consumption comes from feed production, while electricity and diesel each account for 14% of the total energy usage [18]. There is also substantial energy used in producing fertilizer (13%), and in producing/operating machinery and equipment (11%). Buildings and facilities contribute 4% to overall energy use [18]. Off the farm, the energy used in the processing and transportation of dairy products contributes to additional emissions [3].
3. Mitigation Strategies
Opportunities for dairy sector GHG emission mitigation exist at all stages in the supply chain (on the farm, in processing plants, and in transport). Mitigation options include improving diets or using additives/pharmaceuticals to reduce enteric fermentation, improving manure management, reducing/replacing energy fuel use at the farm, and making more efficient use of fertilizers [1]. Emission reductions can be achieved in different climates, regions, and production systems [3]. No strategy in isolation can achieve the full emission reduction potential; a portfolio selected from mitigation options is needed to reach the best result [25]. To improve the effectiveness of mitigation strategies and avoid environmental impacts, complex interactions among the existing strategies should be taken into account [6,13]. We summarize potential mitigation options at all stages in the dairy supply chain in Table 2 and will discuss them below.
Table 2.
Summary of potential mitigation strategies in the dairy supply chain.
3.1. On the Farm
3.1.1. Cattle Management
Improvements in dairy cattle productivity reduce the amount of GHG emissions per unit of milk. As milk yields per cow increase, fewer milk cows and resources are needed to produce a given quantity of milk, reducing enteric and manure emissions per unit of milk. Efficient cattle management is crucial for enhancing long-term productivity per cow. Strategies vary by phase of a cow’s life, spanning from the newborn stage to the heifer, lactating, dry and transition period stages [26]. Aspects covered include feeding, health, genetics, reproduction, and operational management of the cattle. The adoption of optimal techniques might involve extra financial resources; yet, under optimal conditions, the benefits in productivity can offset these costs [27].
Calves and heifers consume feed and emit GHGs as they grow. In a well-managed operation, the economic costs, and to some extent the environmental costs, associated with raising them can only be offset once the heifer successfully gives birth and begins lactating. Therefore, creating clean and stress-free environments, along with proper vaccinations for calves, heifers, and breeding cows helps prevent diseases and raise productivity [28].
Enhancing milk production efficiency on the farm boosts profits and decreases enteric methane emissions. Achieving this involves optimizing milk yields [29]. Improvement opportunities start in the milking parlor through consistent procedures and routines, equipment upkeep, and ensuring cleanliness for milk harvesting. Preventing, identifying, and treating mastitis minimizes milk wastage and potential yield loss, enhancing a cow’s productive lifespan [30].
During the three weeks before and after calving cows experience increased stress [31]. Effective cow management at this stage reduces involuntary culling, replacement costs, and unproductive days. Management can also enhance milk yield in subsequent lactations, ensuring prolonged productivity and decreased enteric fermentation emissions [32]. Proper nutrition and handling are vital for helping cows adjust to the stresses that involve rapid physiological and metabolic changes. Key management objectives involve promoting cow comfort and intake for successful calving and lactation, meeting nutritional needs without overfeeding, and reducing postpartum metabolic diseases [33].
Enhancing herd structure to minimize the presence of non-productive animals via improved fertility and reproduction is a valuable method for lowering emissions per unit of milk and increasing dairy profitability. Lowering disease and parasite incidences typically decreases emission intensity since healthier animals are more productive. Improving animal genetic potential through strategic crossbreeding or sexed semen, coupled with appropriate nutrition, further contributes to productivity [21,34].
3.1.2. Feeding and Inhibiter Management
Enteric fermentation-generated methane emissions can be reduced through modification of diet composition and level of intake plus application of inhibitors. Options for mitigating enteric methane include providing higher quality forage, increasing feed fat and protein content, decreasing the forage-to-concentrate ratio, adding supplemental concentrates, processing feed into pellets, use of feed additives, and application of inhibitors [8,35,36,37]. Nutrition and feeding strategies have the potential to reduce enteric methane by 2.5–15% per unit of milk produced, and a greater reduction potential of 15–30% can be achieved by adding a portfolio of genetic and management approaches [11].
Forage quality affects enteric fermentation methane emissions. Feeds with lesser nutritional content or lower quality require the animal to eat more, resulting in greater enteric methane emissions [35]. Increasing forage quality can reduce enteric methane emission by 5% per unit of milk produced [11] as it increases digestibility [8].
A one-percent increase in fat content (by using oils, fatty acid, and other lipid sources) has the potential to reduce enteric fermentation methane emissions by between 4 and 5% [36]. However, the total fat content of the diet needs to be less than 8% of dry matter because a high-fat diet negatively affects livestock performance [38]. Also, enhancing the forage protein content will improve digestibility and thereby reduce enteric methane emissions [35].
The ratio of forage-to-concentrate in the diet affects enteric and manure emissions. Experiments on lactating dairy cows and beef cattle have demonstrated a reduction in methane emissions as the proportion of concentrate in their diet is increased [39]. One study found decreasing the forage-to-concentrate ratio from 68:32 to 47:53 lowered methane emissions from 648 to 538 g/cow per day [39]. A significant reduction in enteric methane can be expected when the concentrate share rises to above 35 to 40% of dry matter intake [3]. However, the added emissions resulting from the additional concentrate feed production would offset the reduction and may even lead to an overall increase in absolute GHG emissions [40].
Processing feed into pellets is a strategy that improves forage digestibility and in turn reduces enteric methane emissions [8]. However, the decreased fiber content may increase the risk of rumen disorder acidosis if cattle feed is processed too finely [35].
Methane inhibitor feed additives such as tanniferous forages, electronsinks, oils and fats, and oilseeds have been found to decrease daily methane by on average 21%. A meta-analysis of studies involving lactating dairy cows fed with the methane inhibitor 3-NOP revealed a consistent reduction of 28% to 32% in daily methane emissions, along with reduced emissions yield and intensity [12]. Laboratory trials have found that using Asparagopsis, a type of red seaweed, at a rate of 0.5% of dry matter, in the diets of lactating cows has the potential to reduce daily methane emissions, along with the overall emission yield and intensity [41,42]. Nonetheless, at this inclusion level, Asparagopsis might reduce dry matter intake (DMI), potentially leading to lower milk production [43]. Further research about the benefits and risks associated with methane inhibitors is needed.
3.1.3. Manure Management
Approximately 26% of all GHG emissions from animal production in the United States are attributed to manure. Of these, 72% are in the form of methane and 28% are nitrous oxide [35]. They generally arise from manure stored under anaerobic conditions. Conceptually, manure management may be improved to reduce GHG emissions through alterations in collection, storage, and utilization. By using manure in biogas systems where the manure-related methane emissions are captured, one can reduce GHG emissions from the storage of manure and in turn generate electricity using the captured methane to replace fossil energy and its emissions. One can also use management to improve the quality of manure when it is utilized as a fertilizer. Most of the storage-related strategies involve treatment in biogas digesters, improving manure storage covering, shortening storage duration, using solid–liquid separation, and changing the animal diet [35]. As of January 2023, the United States has 343 manure-based anaerobic digestion systems that mitigate methane emissions by capturing biogas from the breakdown of animal manure. This includes 290 systems for dairy, 46 for hogs, 8 for poultry, and 9 for beef. A summary of the cumulative number of operating digester systems in the U.S. that process livestock manure is shown in Figure 2.
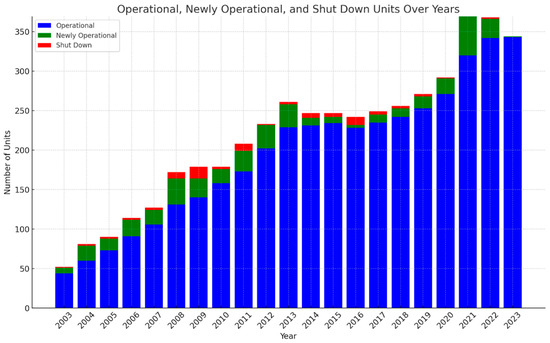
Figure 2.
The cumulative number of operating digester systems in the U.S. that process livestock manure. Data source: US EPA https://www.epa.gov/agstar (assessed on 11 June 2024).
Anaerobic digestion can produce biogas (mainly composed of methane and carbon dioxide) through a biological degradation process that is carried out in the absence of oxygen. Collected biogas can be used to replace fossil fuels to generate electricity. Anaerobic digestion has been reported to reduce GHG emissions by more than 30% compared with traditional manure management [15]. However, mineralization of the organic nitrogen during biological degradation increases the inorganic nitrogen content and pH of the effluent, which in turn may increase ammonia volatilization [44].
Combining anaerobic digestion and solid–liquid separation can reduce the losses of ammonia [45]. However, the implementation of anaerobic digesters is costly for producers and generally requires some form of a policy or carbon market trading incentive [35].
Covering a manure lagoon and capturing the methane emissions is another possibility that reduces emissions and can supply methane for electrical power generation. Another approach involves shortening the storage duration. Such an approach has been estimated to reduce methane and nitrous oxide emissions by 55% and 41%, respectively [46]. Solid–liquid separation, a process of separating the solids from liquid manure by gravity, is another effective practice. The mitigation potential of this approach is estimated to be higher than 30% compared with untreated manure [47]. The distribution of the most common types of manure-based anaerobic digesters in the U.S. is shown in Figure 3.
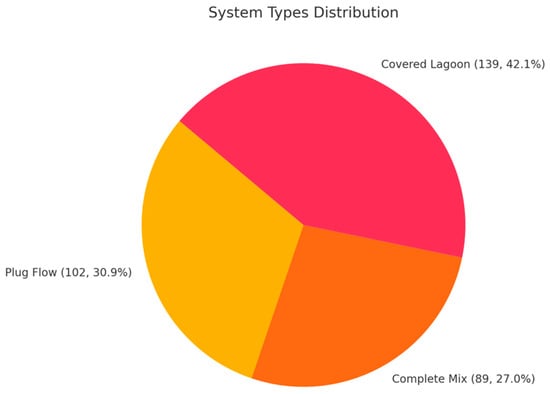
Figure 3.
The distribution of the most common types of manure-based anaerobic digesters in the US. Data source: US EPA https://www.epa.gov/agstar (accessed on 11 June 2024).
Balancing dietary proteins and feed supplements can also reduce nitrous oxide emissions from manure [47]. The nitrous oxide emissions can be reduced if the protein content is reduced. However, decreasing protein will likely increase methane emissions because fermentable carbohydrates increase [47].
3.1.4. Energy Management
Energy plays a pivotal role in many dairy operations, from powering tractors to illuminating barns and cooling milk. While energy consumption constitutes a minor portion of dairy-related GHG emissions, implementing energy management practices on farms can lead to substantial cost savings and a diminished carbon footprint [48]. Mohsenimanesh et al. [17] estimate that electricity consumption averaged 7.7 kWh per 100 kg of milk and 612 kWh per cow annually. Pasture-based dairy operations exhibited lower electricity usage compared to barn-based systems (475 kWh vs. 769 kWh per cow annually). Employing multiple conservation technologies offers the potential to cut electricity demand by around one-third [17]. Variable speed drives (VSDs) for milk vacuum pumps generally lower vacuum pump electricity consumption by approximately 50% to 60%, offering straightforward payback periods spanning three to seven years [48]. Dairy farms can achieve net-zero electricity by integrating renewable energy generation with conservation efforts [17].
3.2. In Processing Plants and Transport
There are several approaches to mitigate GHG emissions in dairy processing plants including reducing milk processing electricity usage, locating plants to shorten milk and milk product distribution networks, and using alternative packaging materials. One can also replace electricity sources with wind energy and plant heat sources with heat from biofuels or bioenergy sources to reduce carbon dioxide emissions [2].
There are potential ways to reduce GHG emissions related to feed and milk product transportation. Approaches include improved truck maintenance, better route design, and reduced long-distance feed, raw and processed milk hauling. Utilizing software to efficiently route trucks can reduce miles and time. Reducing the speed of the trucks from 68 mph to 65 mph could save approximately 52,000 gallons of fuel per year, lowering GHG emissions by 528,800 kg e/year [2]. There is a vast amount of literature in the field of transportation engineering and logistics on routing and transport efficiency for interested readers. Research specific to the dairy sector is a potential new arena for future work.
4. Mitigation Costs
As previously explored, the potential for mitigating emissions through reductions in the dairy sector is substantial. By fully embracing both the most efficacious product-based (PB) and absolute (ABS) strategies, Arndt et al. [42] estimate that a reduction of over 20% in daily methane emissions from ruminants can be achieved globally. However, while the potential for these strategies’ impact is evident, cost is an important consideration. In a broader perspective, a global assessment estimated that a reduction of 58 MtCO2e in livestock emissions would be cost-effectively achievable by 2030, and 162 MtCO2e would be possible at an abatement cost of $30 per megagram (Mg) of equivalent (tCO2e) [49]. It is worth noting that more granular estimates of mitigation costs across different strategies differ significantly due to the variability of factors such as regional contexts, income levels, and technological advancements [50].
Thus, the mitigation cost for the same strategy could be different under divergent circumstances. The following discussion will cover the cost of mitigation in the dairy sector from four perspectives: cattle management, enteric fermentation, manure management, and energy cost management. Note while below we overview costs, we do not provide exhaustive coverage due to a lack of such material in the literature and a lack of space in this article.
4.1. Cattle Management Costs
Improved animal health and decreased mortality/illness lead to higher animal productivity, thereby reducing GHG emissions per unit of milk [51]. Preventing diseases not only enhances herd health but also proves to be a cost-effective measure for farmers. Bovine respiratory disease (BRD) is a complex disease estimated to impact approximately 22% of preweaned U.S. dairy calves and accounts for 19% of all deaths among preweaned calves [52]. A recent study in California shows the average short-term cost of BRD treatment per affected calf was $42.15. However, implementing preventive measures, such as augmenting the amount of milk fed from birth to 21 days (from 3.79 L/d to 4.26 L/d), resulted in a 92% reduction in BRD incidence, incurring a cost spread over the entire herd of $0.06 per calf per day [52].
Likewise, roughly 20–40% of lactating cows experience one or multiple cases of clinical mastitis, another costly dairy disease. A meta analysis using data from 1992 through 2018 found that, on average, the U.S. financial impact of mastitis-related losses amounted to $131 per cow annually [53]. Research conducted in the Netherlands by Hogeveen et al. [54] indicated that practices such as culling and antibiotic use could reduce losses by $9 to $40 per cow while incurring minimal extra costs of between $1 and $7. However, a different study highlights that certain management approaches, despite their high effectiveness, might not be cost-efficient due to the considerable associated expenses [55].
Improvements in genetic potential can lead to a significant reduction in GHG emissions per unit of livestock product [51]. In recent years, the utilization of sexed semen has seen significant growth within the dairy industry [56]. This technology enables the predetermination of a calf’s sex with an accuracy of approximately 90% [57]. Alongside sexed semen, farmers might opt for beef semen to generate crossbred dairy–beef calves. These crossbred calves exhibit superior performance within fattening systems, resulting in increased sales value. Within the dairy system, breeding costs include the price of semen and labor. Specifically, the price per insemination dose was $19 for Holstein bulls and $7.8 for Charolais bulls [58]. Research conducted in Germany indicates that the integration of sexed semen and crossbreeding led to a boost in profits of up to $620 per cow annually, averaging $87 per cow each year [59]. Most of the research in this area is conducted in Europe, with limited input or studies originating from the United States.
Generally reducing these cost items lowers the cost of producing milk and increases productivity, in turn lowering emissions per unit milk produced and the emissions associated with current milk production volumes.
4.2. Feeding Management Costs
Multiple strategies can be applied to reduce animal GHG emissions by optimizing feed composition. For example, feeding dairy cows silage produced from grass harvested at an earlier stage of maturity has been found to notably diminish enteric fermentation methane emissions [60,61]. While the existing literature primarily focuses on the extent of reduction achievable, only a limited number of studies venture to estimate the associated costs of such feed modifications.
In a study conducted by Van Middelaar [62], a linear programming approach was adopted to assess the mitigation costs of three distinct feeding strategies: diminishing grass maturity stage, incorporating extruded linseed products, and introducing supplementary nitrate. Their results show that the first option is the most cost-effective, estimating emissions at a cost of approximately $62 per Mg of equivalent (tCO2e). As a comparison, the costs for linseed and nitrate supplementation are $2801/tCO2e and $260/tCO2e, respectively.
As discussed earlier, Asparagopsis seaweed feeding brings about a substantial reduction in enteric methane emissions. At a feeding rate of about 0.5% of the dietary dry matter [43], incorporating this into a dairy cow’s diet would amount to approximately $24 per day for the producer, which is clearly impractical [41]. However, the price is expected to decline rapidly with the development of technologies for aquaculture production of Asparagopsis and an increase in global supply. Hence, it is reasonable to assume that, without significant technological advancements, interventions from government, or market incentives (such as carbon credits or taxes), the effectiveness of that mitigation strategy alone might not suffice to ensure its adoption by livestock industries [12].
4.3. Manure Management Costs
The EPA [20] estimates dairy cattle manure management contributed 41 Tg of equivalent emissions in 2021, comprising 49.6% of the total U.S. GHG emissions stemming from manure. Anaerobic digesters have emerged as the most effective strategy for reducing GHG emissions, both from energy and manure [63]. Processing dairy manure using anaerobic digestion (AD) produces methane-rich biogas, suitable for power generation or heating, alongside a nutrient-rich digestate that can be applied to land as fertilizer [64].
According to a database from the EPA AgSTAR program [65], there are 290 anaerobic digestion systems utilized on U.S. dairy farms as of January 2023. These manure-based anaerobic digesters reduced GHG emission by 10 Tg equivalent. During 2022, these systems generated around 2.42 million megawatt-hours (MWh) of electricity from the processed manure. There is a considerably larger potential for mitigation, as the EPA estimates that approximately 2740 dairy operations across the U.S. could accommodate biogas recovery systems [66]. However, the capital cost of AD systems is generally perceived to outweigh the benefit for dairy farmers. The average capital investment for digesters is nearly $2 million. Additionally, the yearly average costs linked to operating, labor, maintenance, and repairs for the anaerobic digestion system are estimated at $50,400 [67]. Therefore, it is crucial to document and, in some cases, incentivize aspects of the AD system. This could include biogas sales, carbon offset credits, co-product (fertilizer), and co-digestion with other food waste or organics [68]. In fact, most of the digesters are present in states where incentives exist like California [68,69].
Farm size plays another crucial role in making digestion-derived methane economically competitive. For smaller herds (<400 animals), depending solely on carbon credits and other incentives may not adequately offset the lower commercial energy rates in the U.S., unless there are moderate reductions in digester costs [64].
4.4. Energy Costs
Energy consumption occurs throughout the entire dairy cattle supply chain, and this makes it difficult to both estimate and allocate the emission amount within each segment. Herein we will mainly focus on the studies investigating the mitigation potential of dairy farm energy use. We direct those interested in mitigation within processing plants and transportation to other treatments [70,71].
Electricity accounts for 60% of the direct energy use on the dairy farm [72]. The quantity of electricity used varies widely by animal management system, barn design, available technology, region, herd size, and use of irrigation [17]. Several studies have investigated the cost of mitigation strategies to improve dairy farm energy efficiency and they found that such strategies require high initial costs but have high mitigation potential [73,74,75]. For example, ref. [74] found that with an initial cost of $45,500, the utilization of renewable energy (mainly wind) in Algeria would lead to decreased emissions of 9290 tons over the project lifetime. They further estimated that, with full implementation in the studied region, the cumulative mitigation potential could reach 80 million tons.
While previous studies have attempted to estimate costs, the variations in their coverage poses challenges for direct comparisons. Some studies omit consideration of GHG emissions associated with secondary products, others fail to specify the inclusion of carbon credits in the overall cost, and certain studies do not report the GHG reduction potential associated with their proposed strategies. This highlights the imperative for the development of performance metrics in the assessment of mitigation costs within dairy production studies. We summarize all the aspects we think merit consideration in Figure 4.
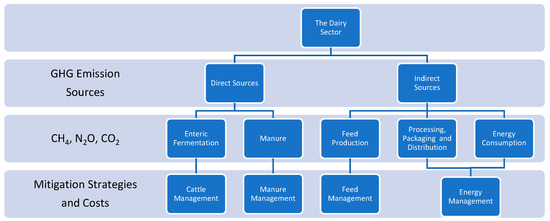
Figure 4.
An overview of all the aspects presented in the literature review.
5. Discussion
The U.S. dairy sector is estimated to have made a direct contribution of 90 Tg CO2 equivalent GHG emissions through enteric fermentation and manure management in 2021, constituting 32.5% of total farm-level livestock emissions [20]. There are also indirect emissions associated that arise from feed production, milk processing use of energy, and transportation of dairy-related products spanning from feed movement through raw milk movement to movement of final products to retail markets [3,4,7,18,24]. A comprehensive quantification of these indirect emissions remains necessary for a more holistic understanding of total dairy GHG emissions. Methane (CH4), nitrous oxide (N2O), and carbon dioxide (CO2) are the primary GHGs emitted by the dairy sector, emanating from both direct and indirect sources.
Opportunities for mitigating GHG emissions exist across the entirety of the dairy supply chain [1,6,13,25]. Dairy cattle productivity can be enhanced by preventing diseases, adjusting diets to reduce enteric fermentation, improving manure management through the implementation of anaerobic digestion, substituting energy fuel use at the farm, and optimizing fertilizer utilization. Certainly, a portfolio of strategies is needed as singular strategies are generally inadequate to fully realize emission reduction potential plus must be considered in interaction; a portfolio of mitigation options must be tailored to achieve optimal outcomes [76]. Generally, there is a need to integrate mitigation strategies involving feed production, feed movement, feeding, manure, and cropping practices as a unified management entity. Also establishing a standardized system to evaluate and ultimately track possibilities and their effectiveness is a potential area for future research.
The returns to farmer adoption of mitigation strategies are not only private ones accruing to the farmer. Rather, there are benefits to society from avoiding climate change [65,68,69]. One estimate of such benefits is embodied in the U.S. EPA estimated Social Cost of Greenhouse Gases (SC-GHG) that gives a monetary estimate of the value of reducing emissions by one megagram of GHG into the atmosphere at a given point in time. It also reflects the societal gain achieved by reducing emissions of GHG by a megagram. A November 2023 U.S. Environmental Protection Agency report on SC-GHG [77] presents estimates that the social costs of additional carbon dioxide emissions emitted in 2020 are $120 per ton at a 2.5% discount rate or $190 per ton at 2.0%. Also, therein, the social cost of methane emissions estimates for 2020 releases are $1300 and $1600 per ton at 2.5% and 2.0% discount rates, respectively. These estimates provide a measure of how much it might be worth per ton of avoided emissions and thus what the broader social value of dairy mitigation activities that reduce emissions might be.
Furthermore, the adoption rate for many dairy mitigation measures is low. In the U.S., low adoption is particularly true outside of California in terms of manure management due to an absence of incentives [68,69]. The primary reason for this is that many mitigation activities, while possible, are costly to the farmer based on pure milk sales revenues and production costs. However, such strategies reduce the future extent of climate change and as such are beneficial to society but not directly to the farmer. Most practices are not eligible for any economic incentives that reward adopting farmers for the benefits that result from the altered climate change extent [67]. This results in farmers only undertaking costly alterations if they are privately profitable or otherwise desirable. But the above SC-GHG discussion shows that the benefits are broader than those that accrue to the farmer and may justify programs that provide the farmer with payments reflective of those benefits, for example, perhaps $1300 per ton of methane emissions avoided. Such incentives have long been used in providing incentives under U.S. conservation programs to encourage cleaner water and air. More research and investment plus incentive policy design is needed to increase the affordability and adoption of mitigation practices, moderate consumption of dairy products where appropriate, and avoid negative impacts on livestock productivity, economic activities, and the environment. It would be useful to study how the potential carbon market and other incentive program designs might both stimulate adoption and impact the U.S. dairy sector.
6. Conclusions
This review covers numerous opportunities to mitigate GHG emissions across the dairy supply chain, emphasizing the integration of various practices, such as improved feeding, manure management, processing, and transportation. It also emphasizes the need for a unified approach rather than the pursuit of isolated strategies. Despite the availability of effective mitigation strategies, their adoption remains low due to the lack of economic incentives for farmers. To address this challenge, a comprehensive understanding of both direct and indirect emissions, strategy costs, and broader social benefits of actions is necessary along with the provision of financial incentives. The Social Cost of Greenhouse Gases (SC-GHG) provides a possible justification for rewarding added incentives to farmers and industry participants based on the societal benefits of emission reductions. Future research should focus on enhancing the affordability and adoption of mitigation practices, evaluating the impact of carbon markets, and exploring incentive programs and carbon market designs to drive significant reductions in GHG emissions within the U.S. dairy sector. Additionally, this paper did not attempt to carry out a comprehensive bibliometric review and such an exercise would give additional information on omitted issues and possible research directions plus the need for more understanding in a global context.
Supplementary Materials
The following supporting information can be downloaded at: https://www.mdpi.com/article/10.3390/atmos15080926/s1, Figure S1: Summary of coverage in major literature reviews addressing aspects of dairy emissions reductions.
Author Contributions
Conceptualization, B.M. and Y.L.; methodology, Y.L. and M.C.; writing—original draft preparation, Y.L. and M.C.; writing—review and editing, B.M. and J.C.; visualization, Y.L.; supervision, B.M.; project administration, B.M.; funding acquisition, B.M. All authors have read and agreed to the published version of the manuscript.
Funding
This research was funded in part by the U.S. Department of Agriculture, Economic Research Service, Cooperative Agreement 58-3000-1-0105.
Data Availability Statement
The data presented in this study are available on request from the corresponding author. The data are not publicly available due to privacy.
Acknowledgments
The findings and conclusions in this article are those of the authors and should not be construed to represent any official USDA or U.S. Government determination or policy. This research was supported in part by the U.S. Department of Agriculture, Economic Research Service.
Conflicts of Interest
The authors declare no conflict of interest.
References
- Steinfeld, H.; Gerber, P.J.; Wassenaar, T.D.; Castel, V.; Rosales, M.; de Haan, C. Livestock’s Long Shadow: Environmental Issues and Options; United Nations Food and Agriculture Organization: Rome, Italy, 2006; ISBN 978-92-5-105571-7. [Google Scholar]
- Food and Agricultural Organization of the United Nations and Global Dairy Platform. Climate Change and the Global Dairy Cattle Sector: The Role of the Dairy Sector in a Low-Carbon Future; FAO: Rome, Italy, 2019; ISBN 978-92-5-131232-2. [Google Scholar]
- Gerber, P.J.; Hristov, A.N.; Henderson, B.; Makkar, H.; Oh, J.; Lee, C.; Meinen, R.; Montes, F.; Ott, T.; Firkins, J.; et al. Technical options for the mitigation of direct methane and nitrous oxide emissions from livestock: A review. Animal 2013, 7, 220–234. [Google Scholar] [CrossRef] [PubMed]
- Nutter, D.W.; Kim, D.; Ulrich, R.; Thoma, G. Greenhouse gas emission analysis for USA fluid milk processing plants: Processing, packaging, and distribution. Int. Dairy J. 2013, 31, S57–S64. [Google Scholar] [CrossRef]
- Rojas-Downing, M.M.; Nejadhashemi, A.P.; Harrigan, T.; Woznicki, S.A. Climate change and livestock: Impacts, adaptation, and mitigation. Clim. Risk Manag. 2017, 16, 145–163. [Google Scholar] [CrossRef]
- Grossi, G.; Goglio, P.; Vitali, A.; Williams, A.G. Livestock and climate change: Impact of livestock on climate and mitigation strategies. Anim. Front. 2019, 9, 69–76. [Google Scholar] [CrossRef]
- Cheng, M.C.; McCarl, B.A.; Fei, C.J. Climate Change and Livestock Production: A Literature Review. Atmosphere 2022, 13, 140. [Google Scholar] [CrossRef]
- Hristov, A.N.; Oh, J.; Firkins, J.L.; Dijkstra, J.; Kebreab, E. Mitigation of methane and nitrous oxide emissions from animal operations: I. A review of enteric methane mitigation options. J. Anim. Sci. 2013, 91, 5045–5069. [Google Scholar] [CrossRef] [PubMed]
- Gastelen, S.; Dijkstra, J.; Bannink, A. Are dietary strategies to mitigate enteric methane emission equally effective across dairy cattle, beef cattle, and sheep? J. Dairy Sci. 2019, 102, 6109–6130. [Google Scholar] [CrossRef] [PubMed]
- Boadi, D.; Benchaar, C.; Chiquette, J.; Massé, D. Mitigation strategies to reduce enteric methane emissions from dairy cows: Update review. Can. J. Anim. Sci. 2004, 84, 319–335. [Google Scholar] [CrossRef]
- Knapp, J.R.; Laur, G.L.; Vadas, P.A.; Weiss, W.P.; Tricarico, J.M. Enteric methane in dairy cattle production: Quantifying the opportunities and impact of reducing emissions. J. Dairy Sci. 2014, 97, 3231–3261. [Google Scholar] [CrossRef] [PubMed]
- Hristov, A.N.; Melgar, A.; Wasson, D.; Arndt, C. Effective nutritional strategies to mitigate enteric methane in dairy cattle. J. Dairy Sci. 2022, 105, 8543–8557. [Google Scholar] [CrossRef] [PubMed]
- Wattiaux, M.A.; Abd El-Hack, M.E.; Letelier, P.; Jackson, R.D.; Larson, R.A. Emission and mitigation of greenhouse gases from dairy farms: The cow, the manure, and the field. Appl. Anim. Sci. 2019, 35, 238–254. [Google Scholar] [CrossRef]
- Petersen, S.O. Greenhouse gas emissions from liquid dairy manure: Prediction and mitigation. J. Dairy Sci. 2018, 101, 6642–6654. [Google Scholar] [CrossRef]
- Battini, F.; Agostini, A.; Boulamanti, A.K.; Giuntoli, J.; Amaducci, S. Mitigating the environmental impacts of milk production via anaerobic digestion of manure: Case study of a dairy farm in the Po Valley. Sci. Total Environ. 2014, 481, 196–208. [Google Scholar] [CrossRef] [PubMed]
- Jayasundara, S.; Ranga Niroshan Appuhamy, J.A.D.; Kebreab, E.; Wagner-Riddle, C. Methane and nitrous oxide emissions from Canadian dairy farms and mitigation options: An updated review. Can. J. Anim. Sci. 2016, 96, 306–331. [Google Scholar] [CrossRef]
- Mohsenimanesh, A.; LeRiche, E.L.; Gordon, R.; Clarke, S.; MacDonald, R.D.; MacKinnon, I.; Van der Zaag, A.C. Dairy Farm Electricity Use, Conservation, and Renewable Production—A Global Perspective. Appl. Eng. Agric. 2021, 37, 977–990. [Google Scholar] [CrossRef]
- Shine, P.; Upton, J.; Sefeedpari, P.; Murphy, M.D. Energy Consumption on Dairy Farms: A Review of Monitoring, Prediction Modelling, and Analyses. Energies 2020, 13, 1288. [Google Scholar] [CrossRef]
- Beauchemin, K.A.; Ungerfeld, E.M.; Abdalla, A.L.; Alvarez, C.; Arndt, C. Current enteric methane mitigation options. J. Dairy Sci. 2022, 105, 9297–9326. [Google Scholar] [CrossRef] [PubMed]
- US Environmental Protection Agency. Inventory of U.S. Greenhouse Gas Emissions and Sinks: 1990–2022; US Environmental Protection Agency: Washington, DC, USA, 2024.
- Intergovernmental Panel on Climate Change. Climate Change 2021: The Physical Science Basis. Contribution of Working Group I to the Sixth Assessment Report of the Intergovernmental Panel on Climate Change; Masson-Delmotte, V., Zhai, P., Pirani, P., Connors, S.L., Péan, C., Berger, S., Caud, N., Chen, Y., Goldfarb, L., Gomis, M.I., Eds.; Cambridge University Press: Cambridge, UK, 2021; in press. [Google Scholar]
- O’Hara, J.K. State-level trends in the greenhouse gas emission intensity of US milk production. J. Dairy Sci. 2023, 106, 5474–5484. [Google Scholar] [CrossRef] [PubMed]
- Krausmann, F.; Erb, K.H.; Gingrich, S.; Lauk, C.; Haberl, H. Global patterns of socioeconomic biomass flows in the year 2000: A comprehensive assessment of supply, consumption and constraints. Ecol. Econ. 2008, 65, 471–487. [Google Scholar] [CrossRef]
- Innovation Center for U.S. Dairy. U.S. Dairy’s Environmental Footprint a Summary of Findings, 2008–2012; Innovation Center for U.S.: Rosemont, IL, USA, 2012. [Google Scholar]
- Llonch, P.; Haskell, M.J.; Dewhurst, R.J.; Turner, S.P. Current available strategies to mitigate greenhouse gas emissions in livestock systems: An animal welfare perspective. Animal 2017, 11, 274–284. [Google Scholar] [CrossRef] [PubMed]
- Enevoldsen, C.; Hindhede, J.; Kristensen, T. Dairy Herd Management Types Assessed from Indicators of Health, Reproduction, Replacement, and Milk Production. J. Dairy Sci. 1996, 79, 1221–1236. [Google Scholar] [CrossRef] [PubMed]
- Bekara, M.A.; Bareille, N. Quantification by simulation of the effect of herd management practices and cow fertility on the reproductive and economic performance of Holstein dairy herds. J. Dairy Sci. 2019, 102, 9435–9457. [Google Scholar] [CrossRef] [PubMed]
- Place, N.T.; Heinrichs, A.J.; Erb, H.N. The Effects of Disease, Management, and Nutrition on Average Daily Gain of Dairy Heifers from Birth to Four Months. J. Dairy Sci. 1998, 81, 1004–1009. [Google Scholar] [CrossRef] [PubMed]
- Bewley, J.M.; Robertson, L.M.; Eckelkamp, E.A. A 100-Year Review: Lactating dairy cattle housing management. J. Dairy Sci. 2017, 100, 10418–10431. [Google Scholar] [CrossRef] [PubMed]
- Halasa, T.; Huijps, K.; Østerås, O.; Hogeveen, H. Economic effects of bovine mastitis and mastitis management: A review. Vet. Q. 2007, 29, 18–31. [Google Scholar] [CrossRef] [PubMed]
- Mulligan, F.J.; O’Grady, L.; Rice, D.A.; Doherty, M.L. A herd health approach to dairy cow nutrition and production diseases of the transition cow. Anim. Reprod. Sci. 2006, 96, 331–353. [Google Scholar] [CrossRef] [PubMed]
- Grummer, R.R.; Badjeck, M.C.; Fricke, P.M.; Watters, R.D.; Silva-Del-Rio, N. Management of Dry and Transition Cows to Improve Energy Balance and Reproduction. J. Reprod. Dev. 2010, 56, S22–S28. [Google Scholar] [CrossRef] [PubMed]
- Roche, J.R.; Bell, A.W.; Overton, T.R.; Loor, J.J.; Roche, J.R. Nutritional management of the transition cow in the 21st century—A paradigm shift in thinking. Anim. Prod. Sci. 2013, 53, 1000–1023. [Google Scholar] [CrossRef]
- Lassen, J.; Difford, G.F. Review: Genetic and genomic selection as a methane mitigation strategy in dairy cattle. Animal 2020, 14, s473–s483. [Google Scholar] [CrossRef] [PubMed]
- ICF International. Greenhouse Gas Mitigation Options and Costs for Agricultural Land and Animal Production within the United States; Report to UDSA; ICF: Reston, VA, USA, 2013; p. 270. [Google Scholar]
- Beauchemin, K.A.; Kreuzer, M.; O’Mara, F.; McAllister, T.A. Nutritional management for enteric methane abatement: A review. Aust. J. Exp. Agric. 2008, 48, 21–27. [Google Scholar] [CrossRef]
- Hodge, L.; Quille, P.; O’Connell, S. A Review of Potential Feed Additives Intended for Carbon Footprint Reduction through Methane Abatement in Dairy Cattle. Animals 2024, 14, 568. [Google Scholar] [CrossRef] [PubMed]
- Hales, K.E.; Parker, D.B.; Cole, N.A. Potential odorous volatile organic compound emissions from feces and urine from cattle fed corn-based diets with wet distillers grains and solubles. Atmos. Environ. 2012, 60, 292–297. [Google Scholar] [CrossRef]
- Aguerre, M.J.; Wattiaux, M.A.; Broderick, G.A.; Arndt, C. Effect of forage-to-concentrate ratio in dairy cow diets on emission of methane, carbon dioxide, and ammonia, lactation performance, and manure excretion. J. Dairy Sci. 2011, 94, 3081–3093. [Google Scholar] [CrossRef] [PubMed]
- Opio, C.; Gerber, P.J.; Mottet, A.; Falcucci, A.; Tempio, G.; MacLeod, M.; Vellinga, T.; Henderson, B.; Steinfeld, H. Greenhouse Gas Emissions from Ruminant Supply Chains—A Global Life Cycle Assessment; Food and Agriculture Organization of the United Nations: Rome, Italy, 2013. [Google Scholar]
- Kinley, R.D.; Martinez-Fernandez, G.; Matthews, M.K.; de Nys, R.; Magnusson, M.; Tomkins, N.W. Mitigating the carbon footprint and improving productivity of ruminant livestock agriculture using a red seaweed. J. Clean. Prod. 2020, 259, 120836. [Google Scholar] [CrossRef]
- Arndt, C.; Hristov, A.N.; Price, W.J.; McClelland, S.C.; Pelaez, A.M.; Cueva, S.F.; Oh, J.; Dijkstra, J.; Bannink, A.; Bayat, A.R. Full adoption of the most effective strategies to mitigate methane emissions by ruminants can help meet the 1.5 °C target by 2030 but not 2050. Proc. Natl. Acad. Sci. USA 2022, 119, e2111294119. [Google Scholar] [CrossRef] [PubMed]
- Stefenoni, H.A.; Räisänen, S.E.; Cueva, S.F.; Wasson, D.E.; Lage, C.F.A. Effects of the macroalga Asparagopsis taxiformis and oregano leaves on methane emission, rumen fermentation, and lactational performance of dairy cows. J. Dairy Sci. 2021, 104, 4157–4173. [Google Scholar] [CrossRef] [PubMed]
- Petersen, S.O.; Sommer, S.G. Ammonia and nitrous oxide interactions: Roles of manure organic matter management. Anim. Feed Sci. Technol. 2011, 166–167, 503–513. [Google Scholar] [CrossRef]
- Holly, M.A.; Larson, R.A.; Powell, J.M.; Ruark, M.D.; Aguirre-Villegas, H. Greenhouse gas and ammonia emissions from digested and separated dairy manure during storage and after land application. Agric. Ecosyst. Environ. 2017, 239, 410–419. [Google Scholar] [CrossRef]
- Sajeev, M.; Winiwarter, W.; Amon, B. Greenhouse Gas and Ammonia Emissions from Different Stages of Liquid Manure Management Chains: Abatement Options and Emission Interactions. J. Environ. Qual. 2018, 47, 30–41. [Google Scholar] [CrossRef] [PubMed]
- Hristov, A.N.; Oh, J.; Lee, C.; Meinen, R.; Montes, F.; Ott, T.; Firkins, J.; Rotz, A.; Dell, C.; Adesogan, C.; et al. Mitigation of Greenhouse Gas Emissions in Livestock Production—A Review of Technical Options for Non-CO2 Emissions; FAO: Rome, Italy, 2013; ISBN 978-92-5-107658-3. [Google Scholar]
- Sanford, S.; Go, A. Energy for Dairy Farms. In Regional Perspectives on Farm Energy; Ciolkosz, D., Ed.; Springer International Publishing: Cham, Switzerland, 2022; pp. 37–44. ISBN 978-3-030-90831-7. [Google Scholar]
- US Environmental Protection Agency. Technical Development Document for the Effluent Limitations Guidelines and Standards for the Oil and Gas Extraction Point Source Category [EPA Report]; US Environmental Protection Agency: Washington, DC, USA, 2016.
- Cantillon, M.; Hennessy, T.; Amon, B.; Dragoni, F.; O’Brien, D. Mitigation of gaseous emissions from dairy livestock: A farm-level method to examine the financial implications. J. Environ. Manag. 2024, 352, 119904. [Google Scholar] [CrossRef] [PubMed]
- Hristov, A.N.; Ott, T.; Tricarico, J.; Rotz, A.; Waghorn, G.; Adesogan, A.; Dijkstra, J.; Montes, F.; Oh, J.; Kebreab, E.; et al. Mitigation of methane and nitrous oxide emissions from animal operations: III. A review of animal management mitigation options. J. Anim. Sci. 2013, 91, 5095–5113. [Google Scholar] [CrossRef] [PubMed]
- Dubrovsky, S.A.; Van Eenennaam, A.L.; Karle, B.M.; Rossitto, P.V. Bovine respiratory disease (BRD) cause-specific and overall mortality in preweaned calves on California dairies: The BRD 10K study. J. Dairy Sci. 2019, 102, 7320–7328. [Google Scholar] [CrossRef] [PubMed]
- Hogeveen, H.; Steeneveld, W.; Wolf, C.A. Production Diseases Reduce the Efficiency of Dairy Production: A Review of the Results, Methods, and Approaches Regarding the Economics of Mastitis. Annu. Rev. Resour. Econ. 2019, 11, 289–312. [Google Scholar] [CrossRef]
- Hogeveen, H.; Huijps, K.; Lam, T. Economic aspects of mastitis: New developments. N. Z. Vet. J. 2011, 59, 16–23. [Google Scholar] [CrossRef] [PubMed]
- Huijps, K.; Hogeveen, H. Costs and efficacy of management measures to improve udder health on Dutch dairy farms. J. Dairy Sci. 2010, 93, 115–124. [Google Scholar] [CrossRef] [PubMed]
- Holden, S.A.; Butler, S.T. Review: Applications and benefits of sexed semen in dairy and beef herds. Animal 2018, 12, s97–s103. [Google Scholar] [CrossRef] [PubMed]
- Seidel, G.E. Update on sexed semen technology in cattle. Animal 2014, 8, 160–164. [Google Scholar] [CrossRef] [PubMed]
- Wolfová, M.; Wolf, J.; Kvapilík, J.; Kica, J. Selection for Profit in Cattle: II. Economic Weights for Dairy and Beef Sires in Crossbreeding Systems. J. Dairy Sci. 2007, 90, 2456–2467. [Google Scholar] [CrossRef] [PubMed]
- Pahmeyer, C.; Britz, W. Economic opportunities of using crossbreeding and sexing in Holstein dairy herds. J. Dairy Sci. 2020, 103, 8218–8230. [Google Scholar] [CrossRef] [PubMed]
- Bannink, A.; Smits, M.C.J.; Kebreab, E.; Mills, J.N.; Ellis, J.L.; Klop, A.; France, J.; Dijkstra, J. Simulating the effects of grassland management and grass ensiling on methane emission from lactating cows. J. Agric. Sc. 2010, 148, 55–72. [Google Scholar] [CrossRef]
- Warner, D.; Hatew, B.; Podesta, S.C.; Klop, G.; Gastelen, S.V.; Laar, H.V.; Dijkstra, J.; Bannink, A. Effects of nitrogen fertilisation rate and maturity of grass silage on methane emission by lactating dairy cows. Animal 2016, 10, 34–43. [Google Scholar] [CrossRef] [PubMed]
- Van Middelaar, C.E.; Dijkstra, J.; Berentsen, P.B.M.; De Boer, I.J.M. Cost-effectiveness of feeding strategies to reduce greenhouse gas emissions from dairy farming. J. Dairy Sci. 2014, 97, 2427–2439. [Google Scholar] [CrossRef] [PubMed]
- Aguirre-Villegas, H.; Larson, R.A. Evaluating greenhouse gas emissions from dairy manure management practices using survey data and lifecycle tools. J. Clean. Prod. 2017, 143, 169–179. [Google Scholar] [CrossRef]
- Faulhaber, C.R.; Raman, D.R.; Burns, R.T. An engineering-economic model for analyzing dairy plug-flow anaerobic digesters: Cost structures and policy implications. Trans. ASABE 2012, 55, 201–209. [Google Scholar] [CrossRef][Green Version]
- US Environmental Protection Agency AgSTAR: Biogas Recovery in the Agriculture Sector. Available online: https://www.epa.gov/agstar (accessed on 29 November 2023).
- US Environmental Protection Agency. Market Opportunities for Biogas Recovery Systems at US Livestock Facilities; US Environmental Protection Agency: Washington, DC, USA, 2018.
- Cowley, C.; Brorsen, B.W. Anaerobic Digester Production and Cost Functions. Ecol. Econ. 2018, 152, 347–357. [Google Scholar] [CrossRef]
- US Environmental Protection Agency Anaerobic Digestion on Dairy Farms. Available online: https://www.epa.gov/system/files/documents/2021-09/anaerobic_digestion_on_dairy_farms.pdf (accessed on 13 May 2022).
- El Mashad, H.M.; Barzee, T.J.; Franco, R.B.; Zhang, R.; Kaffka, S.; Mitloehner, F. Anaerobic digestion and alternative manure management technologies for methane emissions mitigation on californian dairies. Atmosphere 2023, 14, 120. [Google Scholar] [CrossRef]
- Kok, R.; Annema, J.A.; van Wee, B. Cost-effectiveness of greenhouse gas mitigation in transport: A review of methodological approaches and their impact. Energy Policy 2011, 39, 7776–7793. [Google Scholar] [CrossRef]
- Nepomuceno de Oliveira, M.A.; Szklo, A.; Castelo Branco, D.A. Implementation of Maritime Transport Mitigation Measures according to their marginal abatement costs and their mitigation potentials. Energy Policy 2022, 160, 112699. [Google Scholar] [CrossRef]
- Upton, J.; Humphreys, J.; Groot Koerkamp, P.W.G.; French, P.; Dillon, P.; De Boer, I.J.M. Energy demand on dairy farms in Ireland. J. Dairy Sci. 2013, 96, 6489–6498. [Google Scholar] [CrossRef] [PubMed]
- Houston, C.; Gyamfi, S.; Whale, J. Evaluation of energy efficiency and renewable energy generation opportunities for small scale dairy farms: A case study in Prince Edward Island, Canada. Renew. Energy 2014, 67, 20–29. [Google Scholar] [CrossRef]
- Nacer, T.; Hamidat, A.; Nadjemi, O. A comprehensive method to assess the feasibility of renewable energy on Algerian dairy farms. J. Clean. Prod. 2016, 112, 3631–3642. [Google Scholar] [CrossRef]
- Kirilova, E.G.; Vaklieva-Bancheva, N.G. Environmentally friendly management of dairy supply chain for designing a green products’ portfolio. J. Clean. Prod. 2017, 167, 493–504. [Google Scholar] [CrossRef]
- Peterson, C.B.; Mitloehner, F.M. Sustainability of the Dairy Industry: Emissions and Mitigation Opportunities. Front. Anim. Sci. 2021, 2, 760310. [Google Scholar] [CrossRef]
- US Environmental Protection Agency. Report on the Social Cost of Greenhouse Gases; US Environmental Protection Agency: Washington, DC, USA, 2023.
Disclaimer/Publisher’s Note: The statements, opinions and data contained in all publications are solely those of the individual author(s) and contributor(s) and not of MDPI and/or the editor(s). MDPI and/or the editor(s) disclaim responsibility for any injury to people or property resulting from any ideas, methods, instructions or products referred to in the content. |
© 2024 by the authors. Licensee MDPI, Basel, Switzerland. This article is an open access article distributed under the terms and conditions of the Creative Commons Attribution (CC BY) license (https://creativecommons.org/licenses/by/4.0/).