Article

Seasonal Contributions and Influencing Factors of Urban Carbon Emission Intensity: A Case Study of Tianjin, China

1
State Grid Tianjin Electric Power Company, Tianjin 300010, China
2
State Grid Tianjin Electric Power Research Institute, Tianjin 300384, China
3
College of Environmental Science and Engineering, Nankai University, Tianjin 300350, China
*
Author to whom correspondence should be addressed.
Atmosphere 2024, 15(8), 947; https://doi.org/10.3390/atmos15080947
Submission received: 14 June 2024 / Revised: 1 August 2024 / Accepted: 6 August 2024 / Published: 8 August 2024
(This article belongs to the Special Issue Urban Carbon Emissions)

Abstract

:
The escalating concern over global warming has garnered significant international attention, with carbon emission intensity emerging as a crucial barrier to sustainable economic development across various regions. While previous studies have largely focused on annual scales, this study introduces a novel examination of Tianjin’s quarterly carbon emission intensity and its influencing factors from 2012 to 2022 using quarterly data and the Logarithmic Mean Divisia Index (LMDI) model. The analysis considers the carbon emission effects of thermal power generation, the power supply structure, power intensity effects, and economic activity intensity. The results indicate a general decline in Tianjin’s carbon emission intensity from 2012 to 2020, followed by an increase in 2021 and 2022. This trend, exhibiting significant seasonal fluctuations, revealed the highest carbon emission intensity in the first quarter (an average of 1.4093) and the lowest in the second quarter (an average of 1.0019). Economic activity intensity emerged as the predominant factor influencing carbon emission intensity changes, particularly notable in the second quarter (an average of −0.0374). Thermal power generation and electricity intensity effects were significant in specific seasons, while the power supply structure’s impact remained relatively minor yet stable. These findings provide essential insights for formulating targeted carbon reduction strategies, underscoring the need to optimize energy structures, enhance energy efficiency, and account for the seasonal impacts of economic activity patterns on carbon emissions.

1. Introduction

As the impacts of global climate change on human societal development become increasingly significant, reducing greenhouse gas emissions has emerged as an urgent global mandate. China, as one of the world’s largest carbon emitters, plays a crucial role in addressing global climate change. In particular, since 2015, the Chinese government has implemented the dual control policy on energy consumption, regulating both the total amount and intensity of energy consumption, marking a significant step in China’s efforts toward energy conservation and emission reduction. Moreover, at the 2015 Paris Climate Conference, China committed to reducing its carbon emission intensity by 60% to 65% by 2030 compared to 2005 levels, further elevating China’s carbon reduction targets [1]. On 11 July 2023, Xi Jinping, General Secretary of the CPC Central Committee, President, Chairman of the Central Military Commission, and Director of the Central Commission for Comprehensive Deepening Reforms, chaired the second session of the commission, where the “Opinions on Promoting the Gradual Transition from Dual Control of Energy Consumption to Dual Control of Carbon Emissions” and other documents were reviewed and adopted. During the meeting, Xi emphasized the importance of improving the regulation of total energy consumption and intensity, transitioning towards a dual control system for both total carbon emissions and their intensity [2].
In this context, Tianjin, as a significant industrial base and economic center in northern China, plays a vital role in exploring and leading the achievement of carbon reduction targets. Tianjin has responded to national policies by initiating a strategic shift in carbon emission intensity control, transitioning from dual control of energy consumption to a dual control system for carbon emissions. This shift involves not only controlling the total amount of carbon emissions but also focusing on reducing carbon emission intensity, i.e., the amount of carbon emissions per unit of Gross Domestic Product (GDP).
Seasonal factors play a significant role in achieving carbon emission intensity control targets. Seasonal climate variations directly affect energy consumption patterns and scales, thereby influencing carbon emissions. For example, increased heating demands in winter and higher cooling loads in summer lead to seasonal fluctuations in energy consumption and carbon emissions. Therefore, studying the seasonal contributions of carbon emission intensity is crucial for developing more precise carbon reduction policies and measures. Additionally, with the Chinese government’s 2020 announcement of achieving carbon neutrality by 2060, fine management of carbon emission intensity becomes key to meeting the long-term reduction targets.
This study distinguishes itself from the previous research focused on annual scales by conducting an in-depth analysis of the seasonal variations in the carbon emission intensity in Tianjin from 2012 to 2022. It explores the patterns of carbon emission intensity changes and their driving factors under different seasonal contexts for the first time. This research intends to provide a scientific basis and policy recommendations for Tianjin and China in achieving carbon reduction targets, optimizing energy structures, and enhancing energy efficiency. Through an in-depth analysis of seasonal factors, this study seeks to support the construction of a more refined and systematic carbon management system, contributing to China’s long-term goals of sustainable environmental development.

2. The Literature Review

In recent years, as the impacts of global climate change on the environment and socio-economic systems have become increasingly prominent, research into carbon emissions and their influencing factors has attracted widespread attention. Against this backdrop, numerous scholars have conducted in-depth studies on carbon emission intensity and its determinants using various models and methodologies.
The STIRPAT model has been applied in studies of carbon emissions. Wu Yaqiong et al. [3] used this model alongside panel quantile regression to explore the factors affecting urban carbon emission intensity in the Yangtze River Delta, finding varying impacts of the industrial structure and economic development levels across different cities. Peng Cong [4] also utilized the STIRPAT model to examine the factors influencing industrial carbon emissions in Guiyang, highlighting specific industrial activity factors.
Yin-Shuang Xia et al. [5] analyzed the factors influencing transportation carbon intensity using the DEA method, while Jincai Zhao et al. [6] explored spatio-temporal changes in residential carbon intensity. Wang Mengkai et al. [7] found that optimizing the energy structure was key to the annual decrease in carbon emission intensity in Jiangsu Province. Wang Kai et al. [8] used spatial autocorrelation analysis and geographically weighted regression models to examine the spatial correlation characteristics and influencing factors of carbon emission intensity in China’s service industry, revealing positive impacts of industrial and energy structures, as well as the roles of population density and technological levels. Yingdong Wang et al. [9] and Hongze Li et al. [10] used spatial analysis methods to investigate the geographic distribution and influencing factors of carbon emission intensity.
Economic growth and technological advancement are also significant factors in analyzing carbon emission intensity. Hou Xiaona et al. [11] employed the VAR model to analyze the significant impact of economic development level on carbon emission intensity, highlighting the contribution of economic growth to rising carbon intensity. Furthermore, Rida Waheed [12] explored the relationship between energy factors and carbon intensity using the nonlinear ARDL technique, providing a long-term analysis of the impacts of economic factors and energy efficiency on carbon intensity from an international perspective. Cheng Zhang et al. [13] assessed the impact of China’s western development strategy on carbon intensity, highlighting the importance of policy and economic factors in adjusting carbon emissions.
Interdisciplinary studies have revealed that carbon emission intensity is influenced by multiple factors. Wei Sun et al. [14] predicted the impact of economic, industrial, urbanization, and governmental interventions on carbon intensity using stochastic frontier analysis and extreme learning machine models. Yimin Mao [15] developed a new analytical framework to examine how population, affluence, and industrial structure affect national carbon intensity, emphasizing the importance of a multifactorial approach. Xiao Zheng [16] showed the impact of industrial transfer on carbon emission intensity, revealing enhancements in China’s carbon reduction capabilities.
The LMDI decomposition method, an efficient tool, has been widely used to analyze energy consumption, carbon emissions, and their influencing factors. Chen Tao et al. [17] used the LMDI model to decompose the factors affecting per capita carbon emissions in China from 2011 to 2019, finding that economic development played a major promotional role. Li Wei et al. [18] constructed a carbon emission index system using the LMDI model for the carbon emissions and influencing factors in Gansu’s agriculture, showing a trend of an initial increase followed by a decrease in total carbon emissions from 2009 to 2019, while the emission intensity steadily declined. Fu Yunpeng et al. [19] combined the Kaya identity with the LMDI decomposition method to analyze the factors affecting carbon emissions across different industrial sectors and energy types in China from 2000 to 2012, concluding that economic output, energy structure, and population size have positive impacts on emissions, whereas energy intensity and industrial structure have negative effects. Li Xiangmei et al. [20] applied the LMDI method to analyze the factors influencing sector-specific industrial energy consumption carbon emissions in China, finding that economic growth and increasing energy intensity were the dominant reasons for the continuous growth in China’s energy-related carbon emissions, with energy structure making a smaller contribution and industrial structure contributing significantly to the reduction in industrial energy carbon emissions. Lv Zhichao et al. [21] analyzed the changes in the total and industrial carbon emissions in Hebei Province using the LMDI decomposition method, revealing that economic development was the main driver of carbon emission growth, while a decrease in energy intensity played a restraining role. Li Wenhui et al. [22] studied the contributions of energy intensity, industrial structure, and energy structure to carbon emission intensity using the same method, finding that a reduction in energy intensity made the greatest contribution to decreasing carbon emission intensity. Wang Zilong et al. [23] also employed the LMDI method to further analyze the impacts of energy structure factors and energy consumption intensity on industrial carbon emission intensity, emphasizing the importance of improving energy efficiency. These studies collectively highlight the complex interplay of economic growth and energy efficiency improvements in regulating carbon emission intensity. Chen Liang et al. [24] and Liu Jing et al. [25] emphasized the key roles of reducing energy intensity, adjusting the industrial structure, and policy interventions in carbon reduction through LMDI decomposition analysis of the carbon emission intensity in the Jing–Jin–Ji region and nationwide. Beyond LMDI decomposition, Sun Jingshui [26] delved into the drivers of carbon emission intensity, with the empirical results showing significant positive impacts of per capita GDP, energy intensity, carbon emissions per unit of energy consumption, industrial structure, and changes in energy consumption structure on carbon intensity, while population, urbanization rate, and international trade division had insignificant effects. Liang Jie et al. [27] used factor analysis to decompose the efficiency and structural shares affecting the carbon emission intensity in Jiangsu Province, finding that the efficiency share played a major role in reducing the carbon intensity. There are also a few studies on the analysis of power carbon emissions; Wang Yingxiang et al. [28] based their analysis of the drivers of carbon emissions from electricity consumption in China on the LMDI decomposition model, finding that economic development factors played the most significant role in increasing electricity consumption carbon emissions, while energy intensity factors mainly played a restraining role. Ma, Jia-Jun [29], based on quarterly data, constructed an inter-provincial transmission framework to measure the seasonal carbon emissions reflected in the regional electricity consumption from 2008 to 2015. He then proposed a structural decomposition approach to identifying the influencing factors of carbon emissions in provincial electricity use from a seasonal perspective.
An analytical summary based on the existing literature reveals that although existing studies have performed some decomposition analyses of carbon emission intensity, most of the research has focused on annual scales. There has been little exploration of the seasonal impacts on carbon emission changes. In contrast, this study is somewhat innovative, using a more refined timescale and employing the widely applied and recognized Logarithmic Mean Divisia Index (LMDI) method to study the seasonal contributions and influencing factors of changes in carbon emission intensity. This allows for a deeper understanding of seasonal effects on carbon emission intensity and provides more specific policy recommendations. Therefore, this study holds significant theoretical and practical importance.

3. Methods and Data

3.1. The Research Methodology

3.1.1. Calculation of Carbon Emission Intensity

Carbon emission intensity refers to the amount of carbon dioxide emissions produced per unit of gross regional product:
D = C G ,
D is the carbon emission intensity, measured in ten thousand tons of CO2 per billion yuan.
C represents the total carbon emissions, measured in ten thousand tons. In this paper, “wt” is used to represent the unit “ten thousand tons”.
G is the gross regional product, measured in billion yuan.

3.1.2. The Decomposition of Influencing Factors

This study aims to assess the seasonal contributions and influencing factors of Tianjin’s carbon emission intensity using the Logarithmic Mean Divisia Index (LMDI) method, a part of index decomposition analysis techniques. The novelty of this research lies in its innovative approach to the data’s temporal scale, utilizing the LMDI method to decompose higher-frequency quarterly data. This allows for a more precise analysis of the driving factors of the quarterly carbon emission intensity, providing a better understanding of the seasonal patterns compared to previous studies that focused on annual scales. By addressing this gap, this study offers valuable insights into the seasonal variations in carbon emissions. The LMDI, proposed by Ang et al. in 2015, is widely regarded as an accurate method for decomposing energy and environmental indices, suitable for exploring the factors driving changes in energy consumption and carbon emissions. Additionally, a detailed comparison and analysis of the LMDI method with traditional methods is provided in the Supplementary Files, further clarifying the advantages of using the LMDI for this type of analysis.
The LMDI model used in the study is structured as follows to address quarterly issues with higher accuracy (Table 1):
D = C G = C E P · E P E T · E T E U · E U G ,
where C represents CO2 emissions in ten thousand tons.
G is the gross regional product in billions of dollars.
EP is the amount of electricity generated by thermal power in ten thousand kilowatt-hours.
ET is the total electricity generation in ten thousand kilowatt-hours.
EU is the electricity consumption in ten thousand kilowatt-hours.

3.2. The Data Sources

This paper focuses on Tianjin as the subject of study. High-frequency CO2 emission data are sourced from the State Grid (Tianjin, China) [30]; data on thermal power generation, total electricity generation, and the GDP are obtained from international statistical bureaus; and electricity consumption data are sourced from Wind Information (Shanghai, China).

4. Results and Discussion

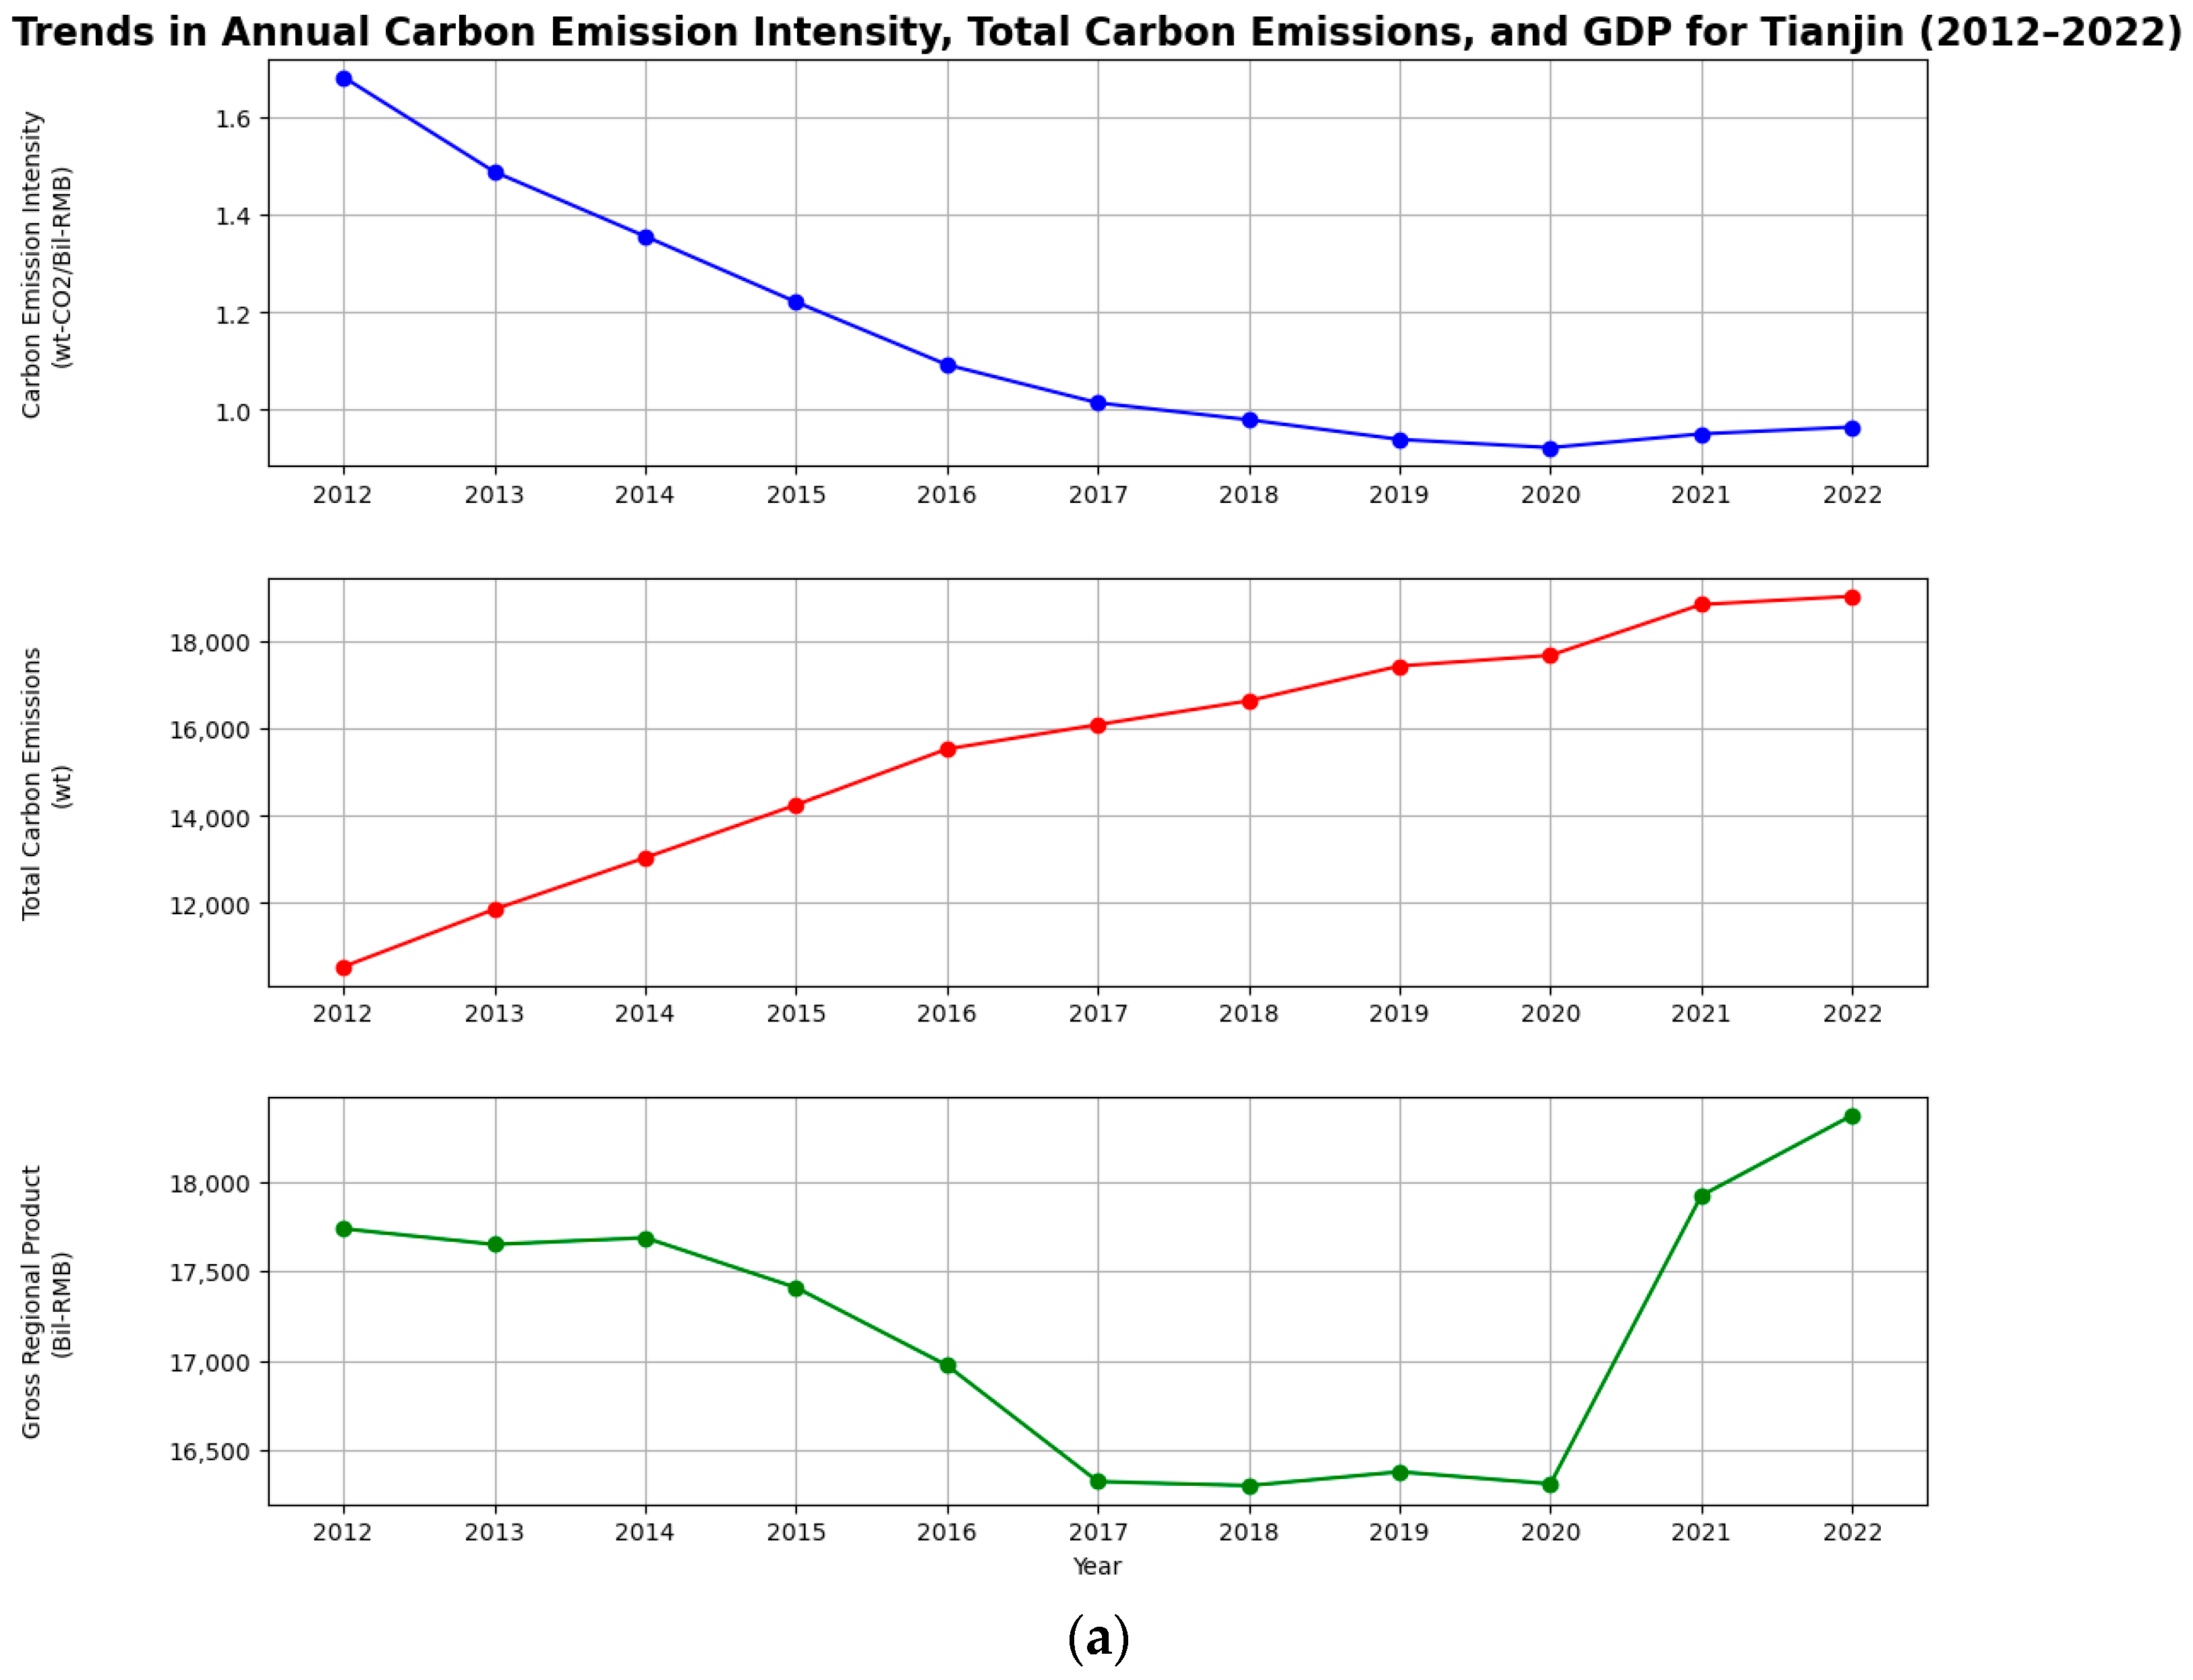
4.1. An Annual Analysis of Carbon Emission Intensity

Over the past 11 years, the carbon emission intensity in Tianjin has generally shown a declining trend. This trend can largely be attributed to two factors:
(1)
Economic Development
In 2022, Tianjin’s GDP reached 19,041.58 billion yuan, an increase of 80.70% compared to 2012. The added values of the primary, secondary, and tertiary industries in 2022 were 273.2 billion yuan, 5982.3 billion yuan, and 9876.7 billion yuan, respectively, representing increases of 84.72%, 44.71%, and 107.45% compared to 2012.
(2)
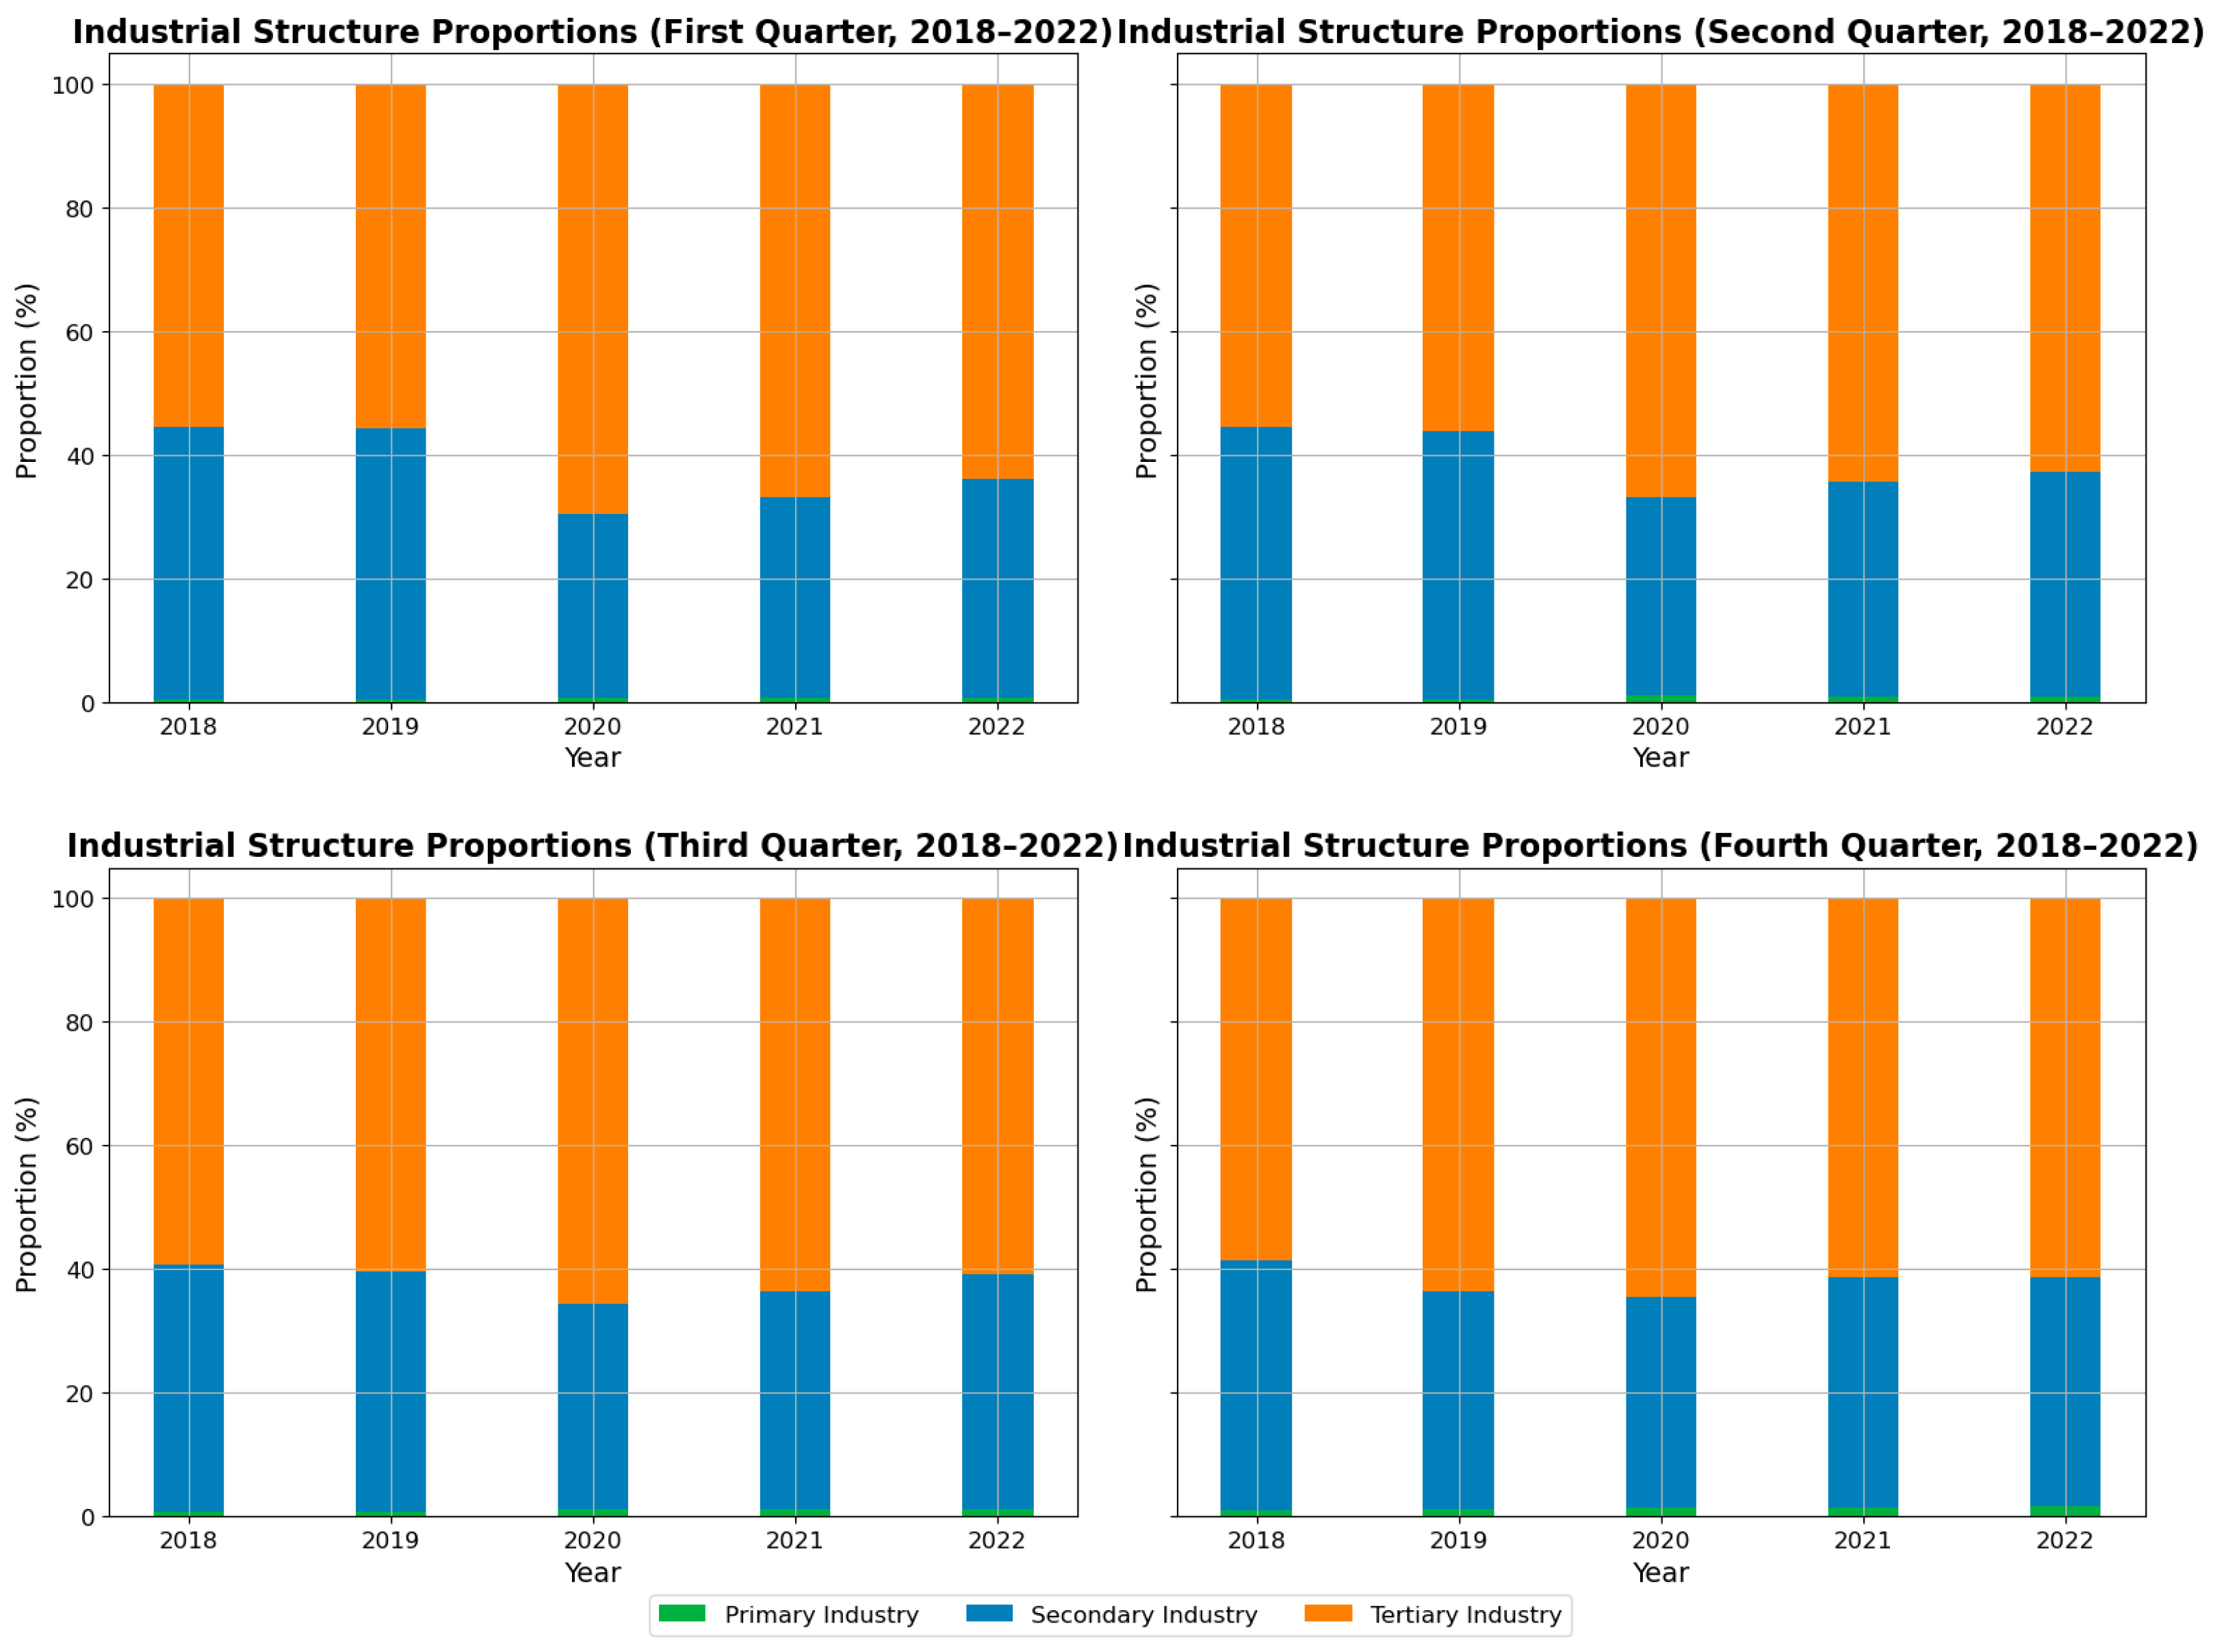
Industrial Structure
As can be seen from Figure 1b, from 2012 to 2022, the share of the primary industry in Tianjin fluctuated around 1.03%; the proportion of the secondary industry decreased annually, while the tertiary industry’s share increased. By 2022, the former had decreased by 8.63%, and the latter had increased by 8.57%. The industrial structure of Tianjin steadily adjusted and was continuously optimized over this period.
While Tianjin achieved a notable reduction in carbon emission intensity from 2012 to 2020, the years 2020 to 2022 saw a trend of increasing carbon emission intensity. This period globally and nationally involved an economic downturn triggered by the COVID-19 pandemic. An analysis of carbon emissions and GDP data revealed that in 2021 and 2022, the growth rate of carbon emissions exceeded that of the GDP. During these years, the share of added value in the secondary industry, contrary to its previous downward trend, increased slightly, possibly due to a series of economic recovery measures taken by Tianjin that led to the reactivation of some high-carbon industries, thus affecting the downward trend in carbon emission intensity in the short term. Additionally, during this period, there was a significant decrease in the total retail sales of consumer goods, even showing negative growth, indicating that the pandemic led to a decrease in social consumption levels, thereby impacting the GDP.

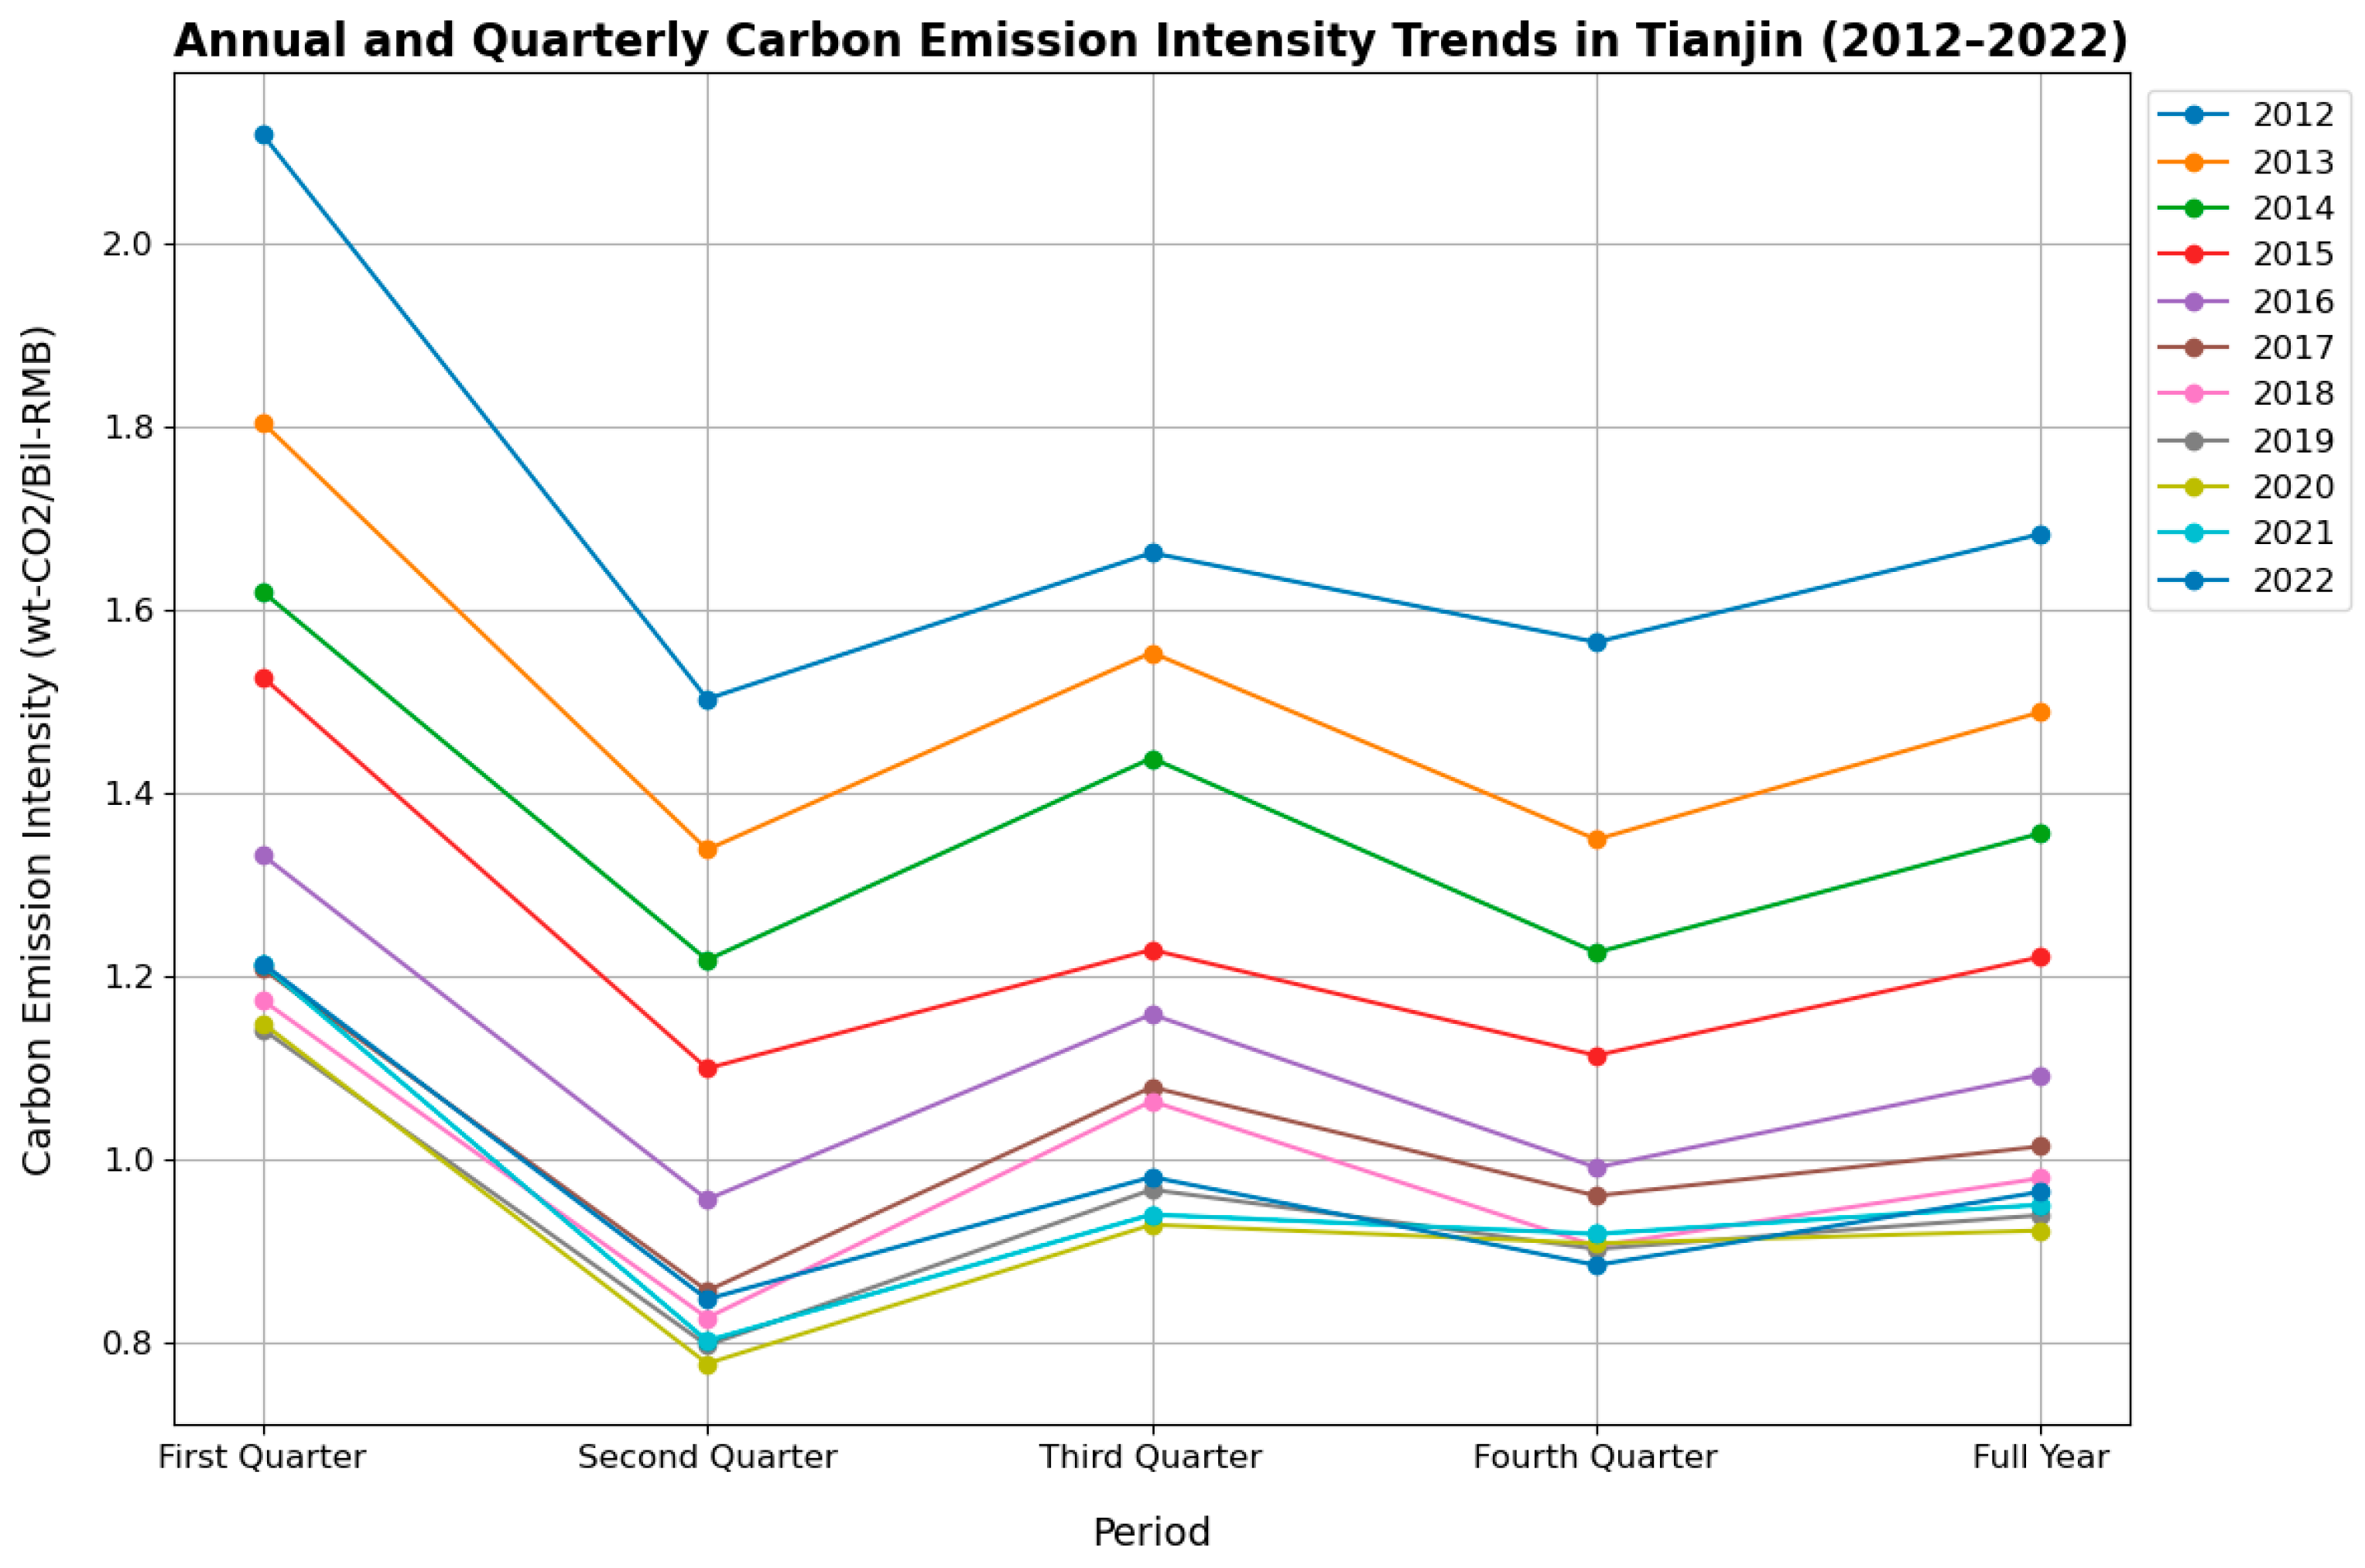
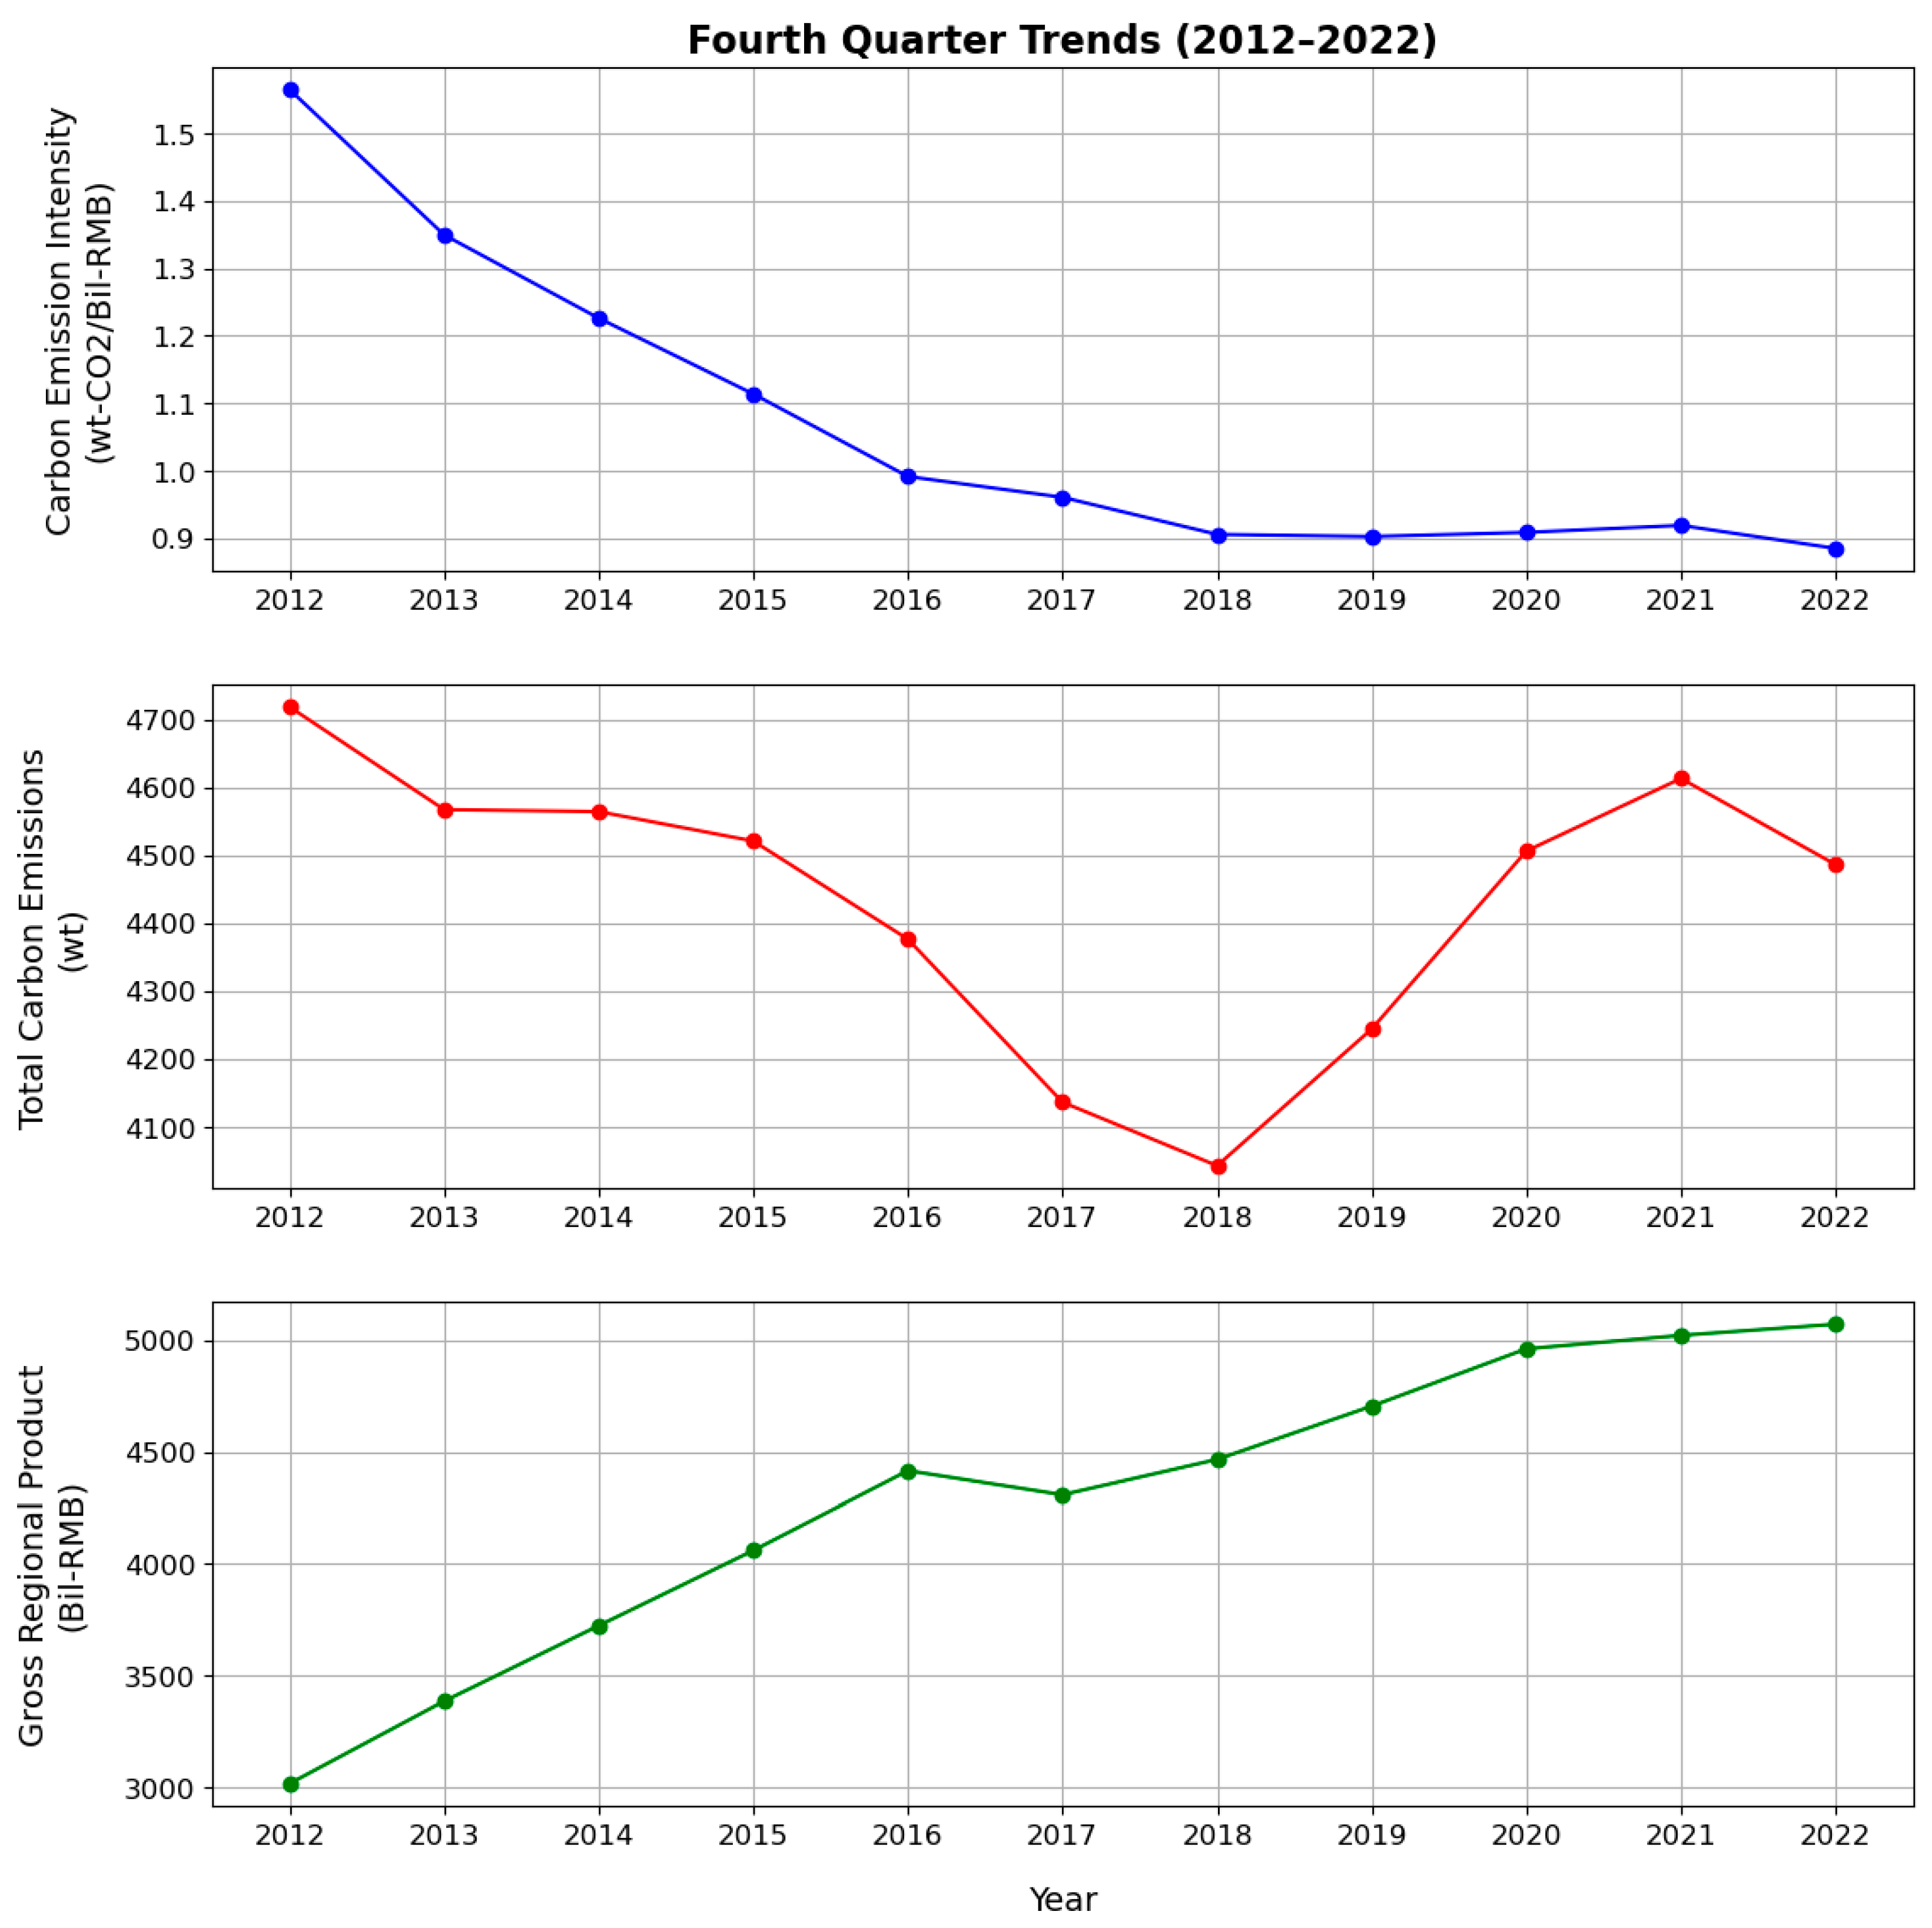
4.2. A Quarterly Analysis of Carbon Emission Intensity

As shown in Figure 2, between 2012 and 2022, the carbon emission intensity for all four quarters, like the annual trend, generally showed a decline but experienced a rebound in 2021 and 2022. Based on Figure 3, the first quarter and second quarter of 2020 saw a reduction in both total carbon emissions and the GDP compared to the previous year, with a more substantial decrease in the first quarter.
According to Figure 4, significant seasonal fluctuations are observed in the quarterly changes. Notably, the first quarter has the highest average carbon emission intensity. The average GDP in the first quarter is significantly lower than in the other quarters, constituting only 19.78% of the annual average GDP, while the average carbon emissions for the first quarter account for about 24.33% of the annual total. This higher intensity during the first quarter can be attributed to increased heating due to cold weather and reduced industrial activity over the Spring Festival period, leading to a lower GDP. Additionally, as analyzed from Figure 5, the industrial structure might influence the carbon emission intensity. For instance, in the pre-pandemic years of 2018 and 2019, the secondary industry, which includes high-carbon enterprises, had a greater share in the first quarter than in the other quarters, contributing to higher carbon emissions.
Conversely, the second quarter consistently shows a relatively lower carbon emission intensity. The average carbon emissions in the second quarter account for only 23.11% of the annual total, while the GDP proportion is as high as 26.63%. The analysis indicates that during the second quarter, Tianjin experienced its highest wind and solar power generation of the year, which displaced traditional thermal power generation and reduced carbon emissions. Additionally, the second quarter generally features more vigorous economic activity.
The third quarter’s carbon emission intensity most closely mirrors the annual intensity. The carbon emissions in the third quarter average 26.77% of the year’s total, with a GDP share of 26.03%. Moreover, from 2012 to 2022, both the carbon emissions and GDP trends in the third quarter follow the annual trends closely.

4.3. A Decomposition Analysis of the Factors Affecting Quarterly Carbon Emission Intensity Changes

From 2012 to 2022, Tianjin’s carbon emission intensity decreased from 1.68 thousand tons per billion yuan to 0.96 thousand tons per billion yuan, a reduction of 42.86%. To quantify the contribution of various factors, this study utilized the Logarithmic Mean Divisia Index (LMDI) method to decompose Tianjin’s carbon emission intensity into the effects of thermal power carbon emissions, the power source structure, electricity intensity, and economic intensity over these years.
In this study, a positive contribution value of a factor indicates that it inhibited the reduction in carbon emission intensity, while a negative value indicates it actively contributed to reducing carbon emission intensity.

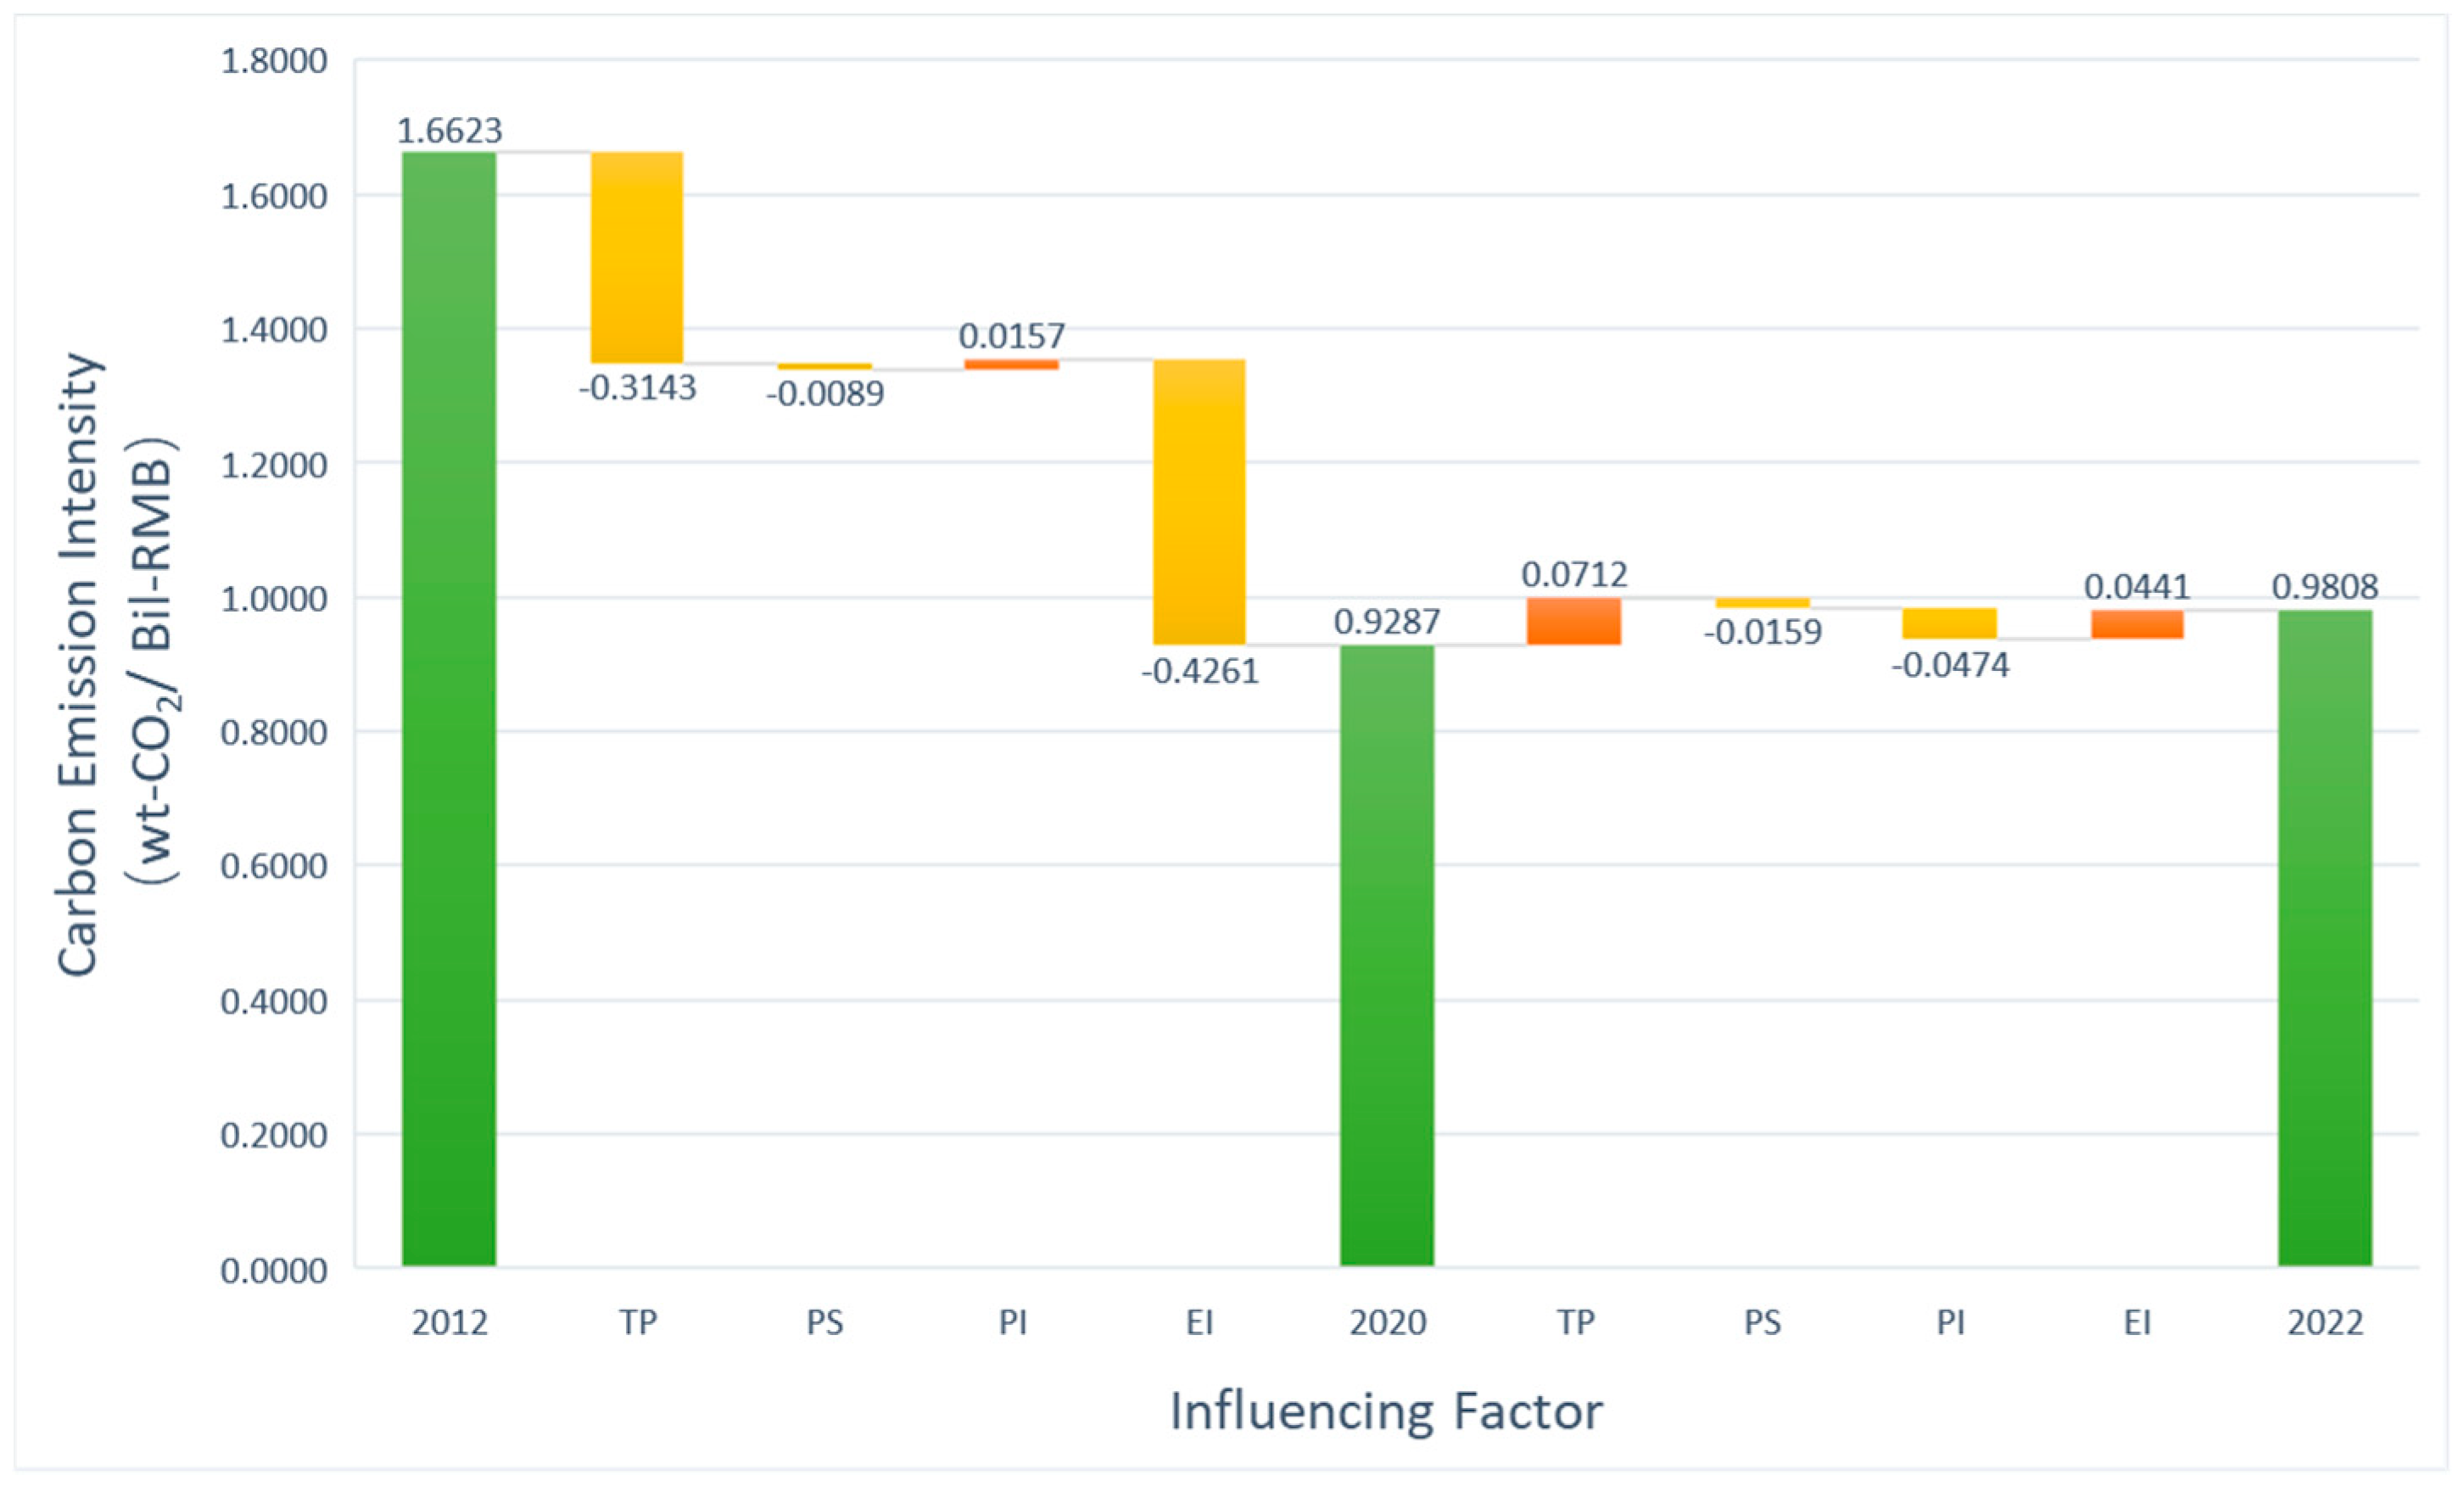
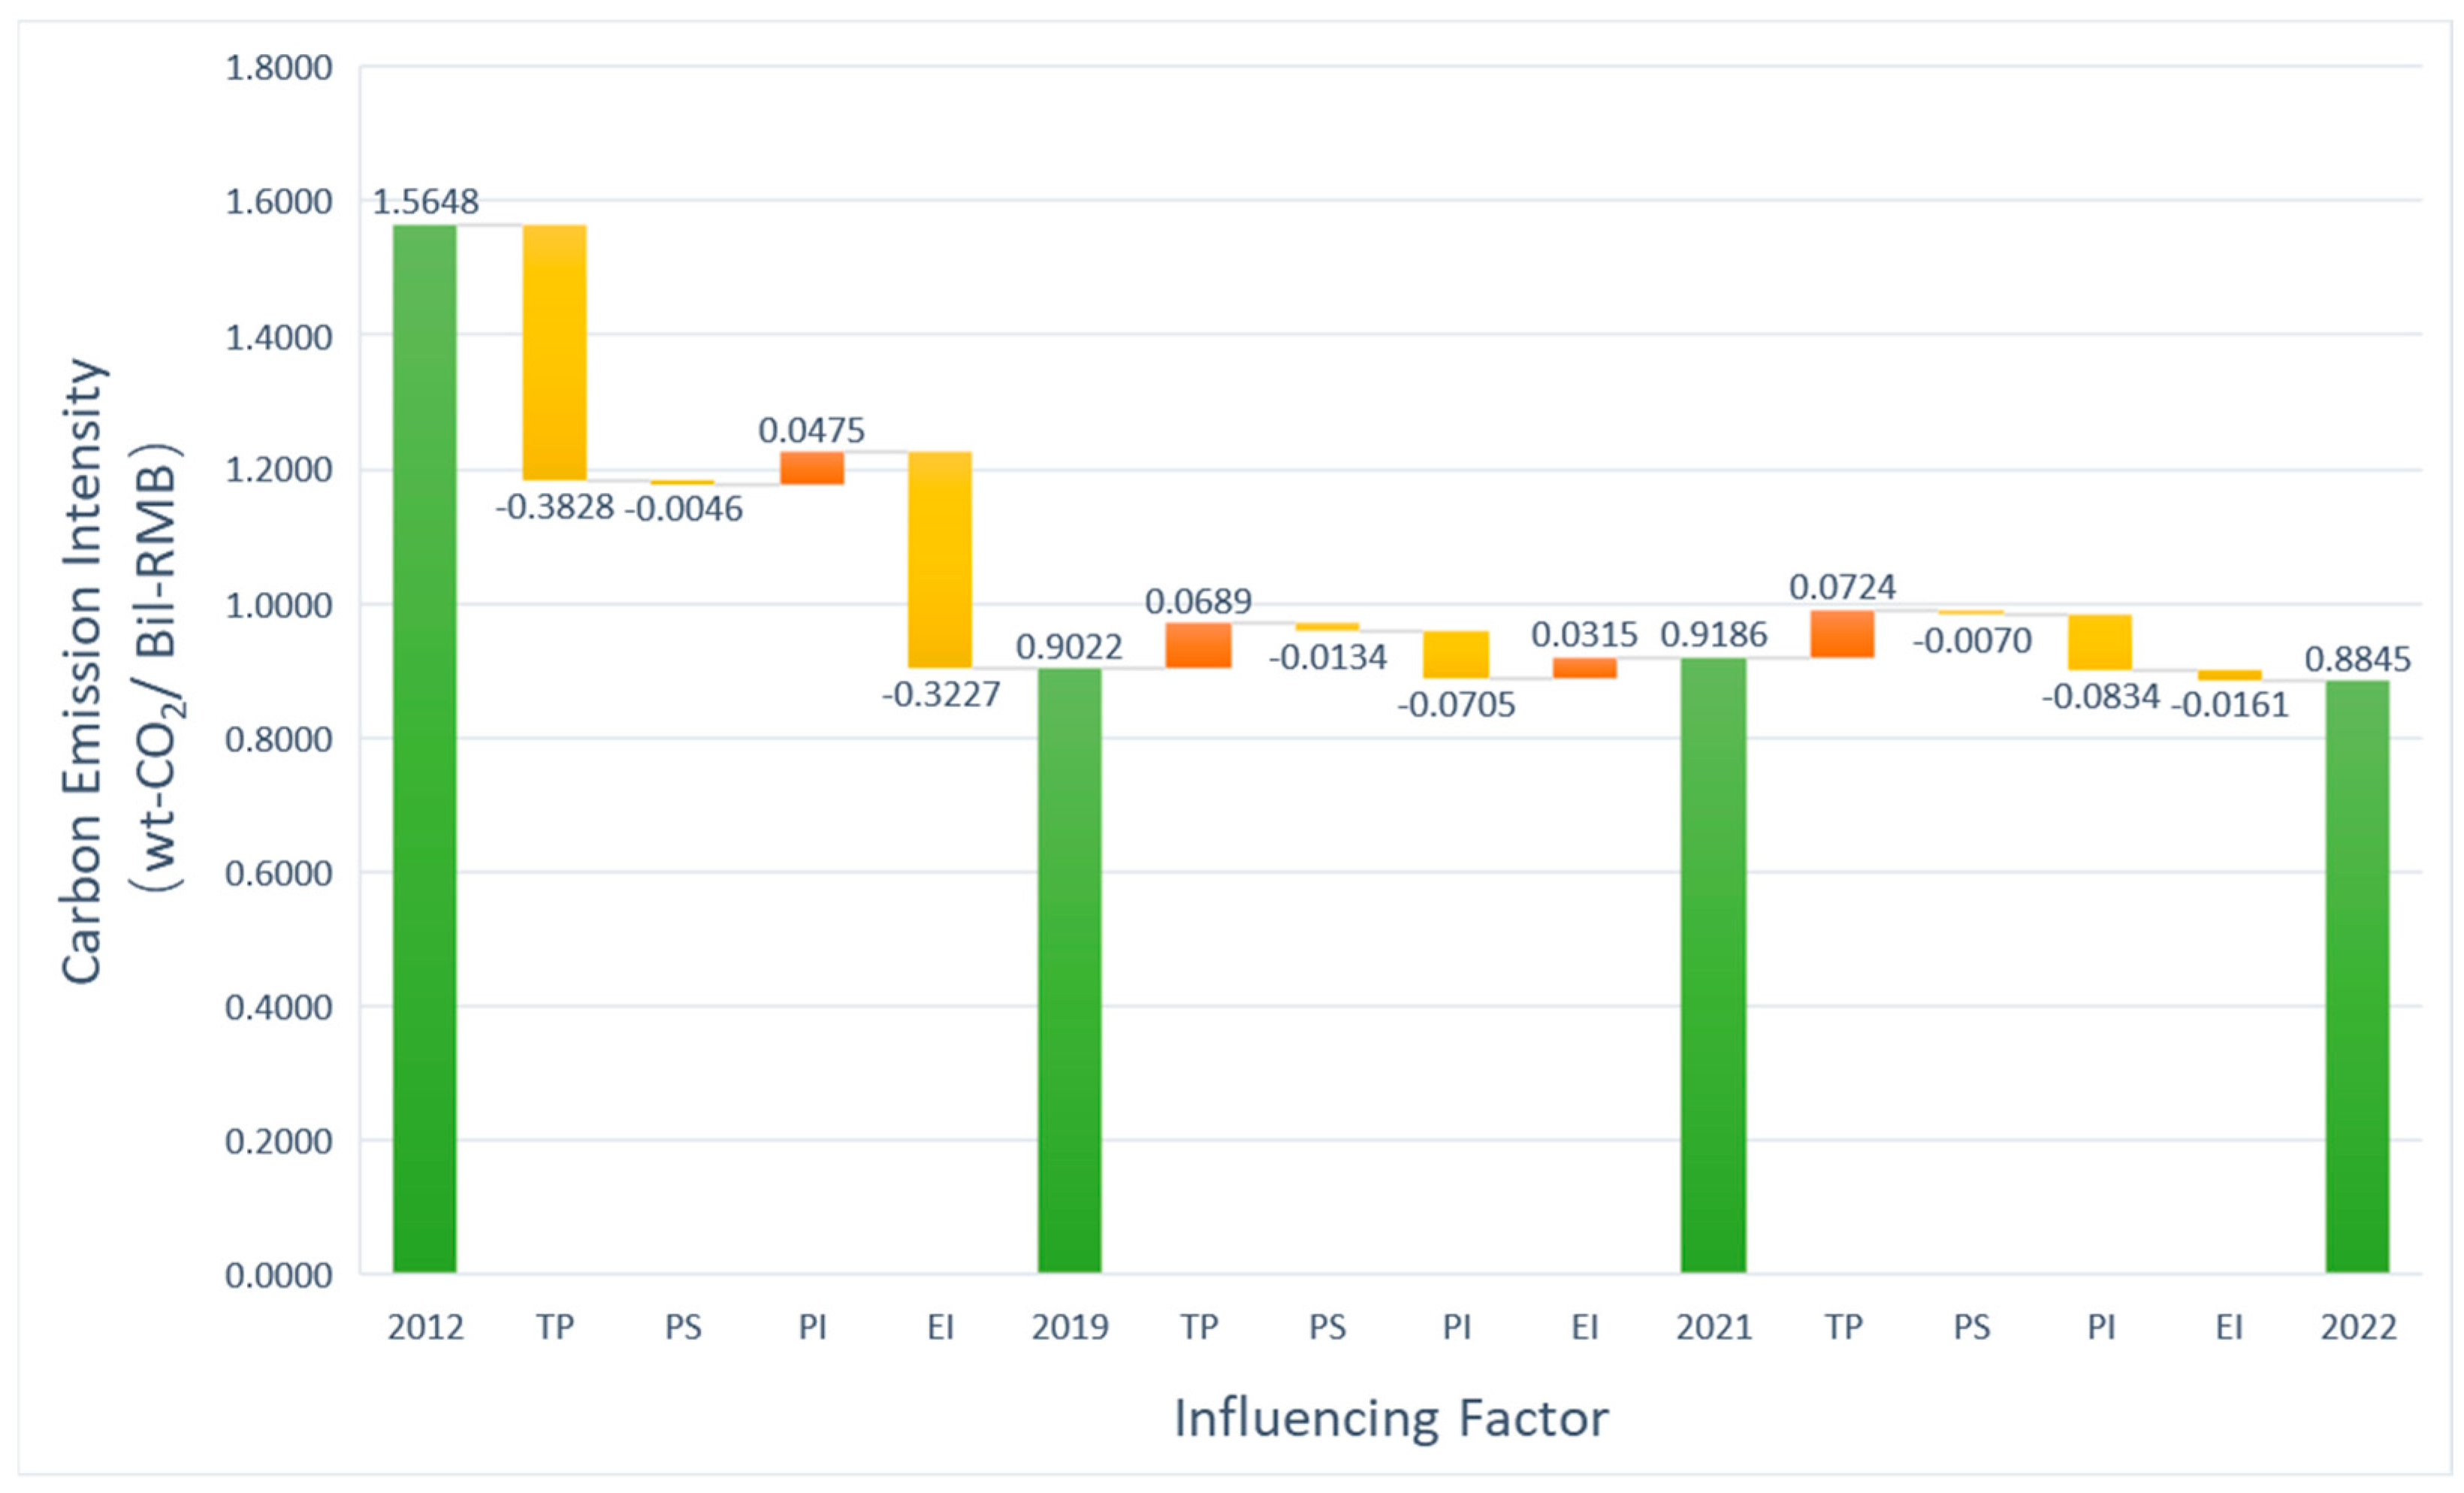
4.3.1. A Decomposition Analysis of the Factors Influencing Quarterly Carbon Emission Intensity Changes over the Years 2012–2022
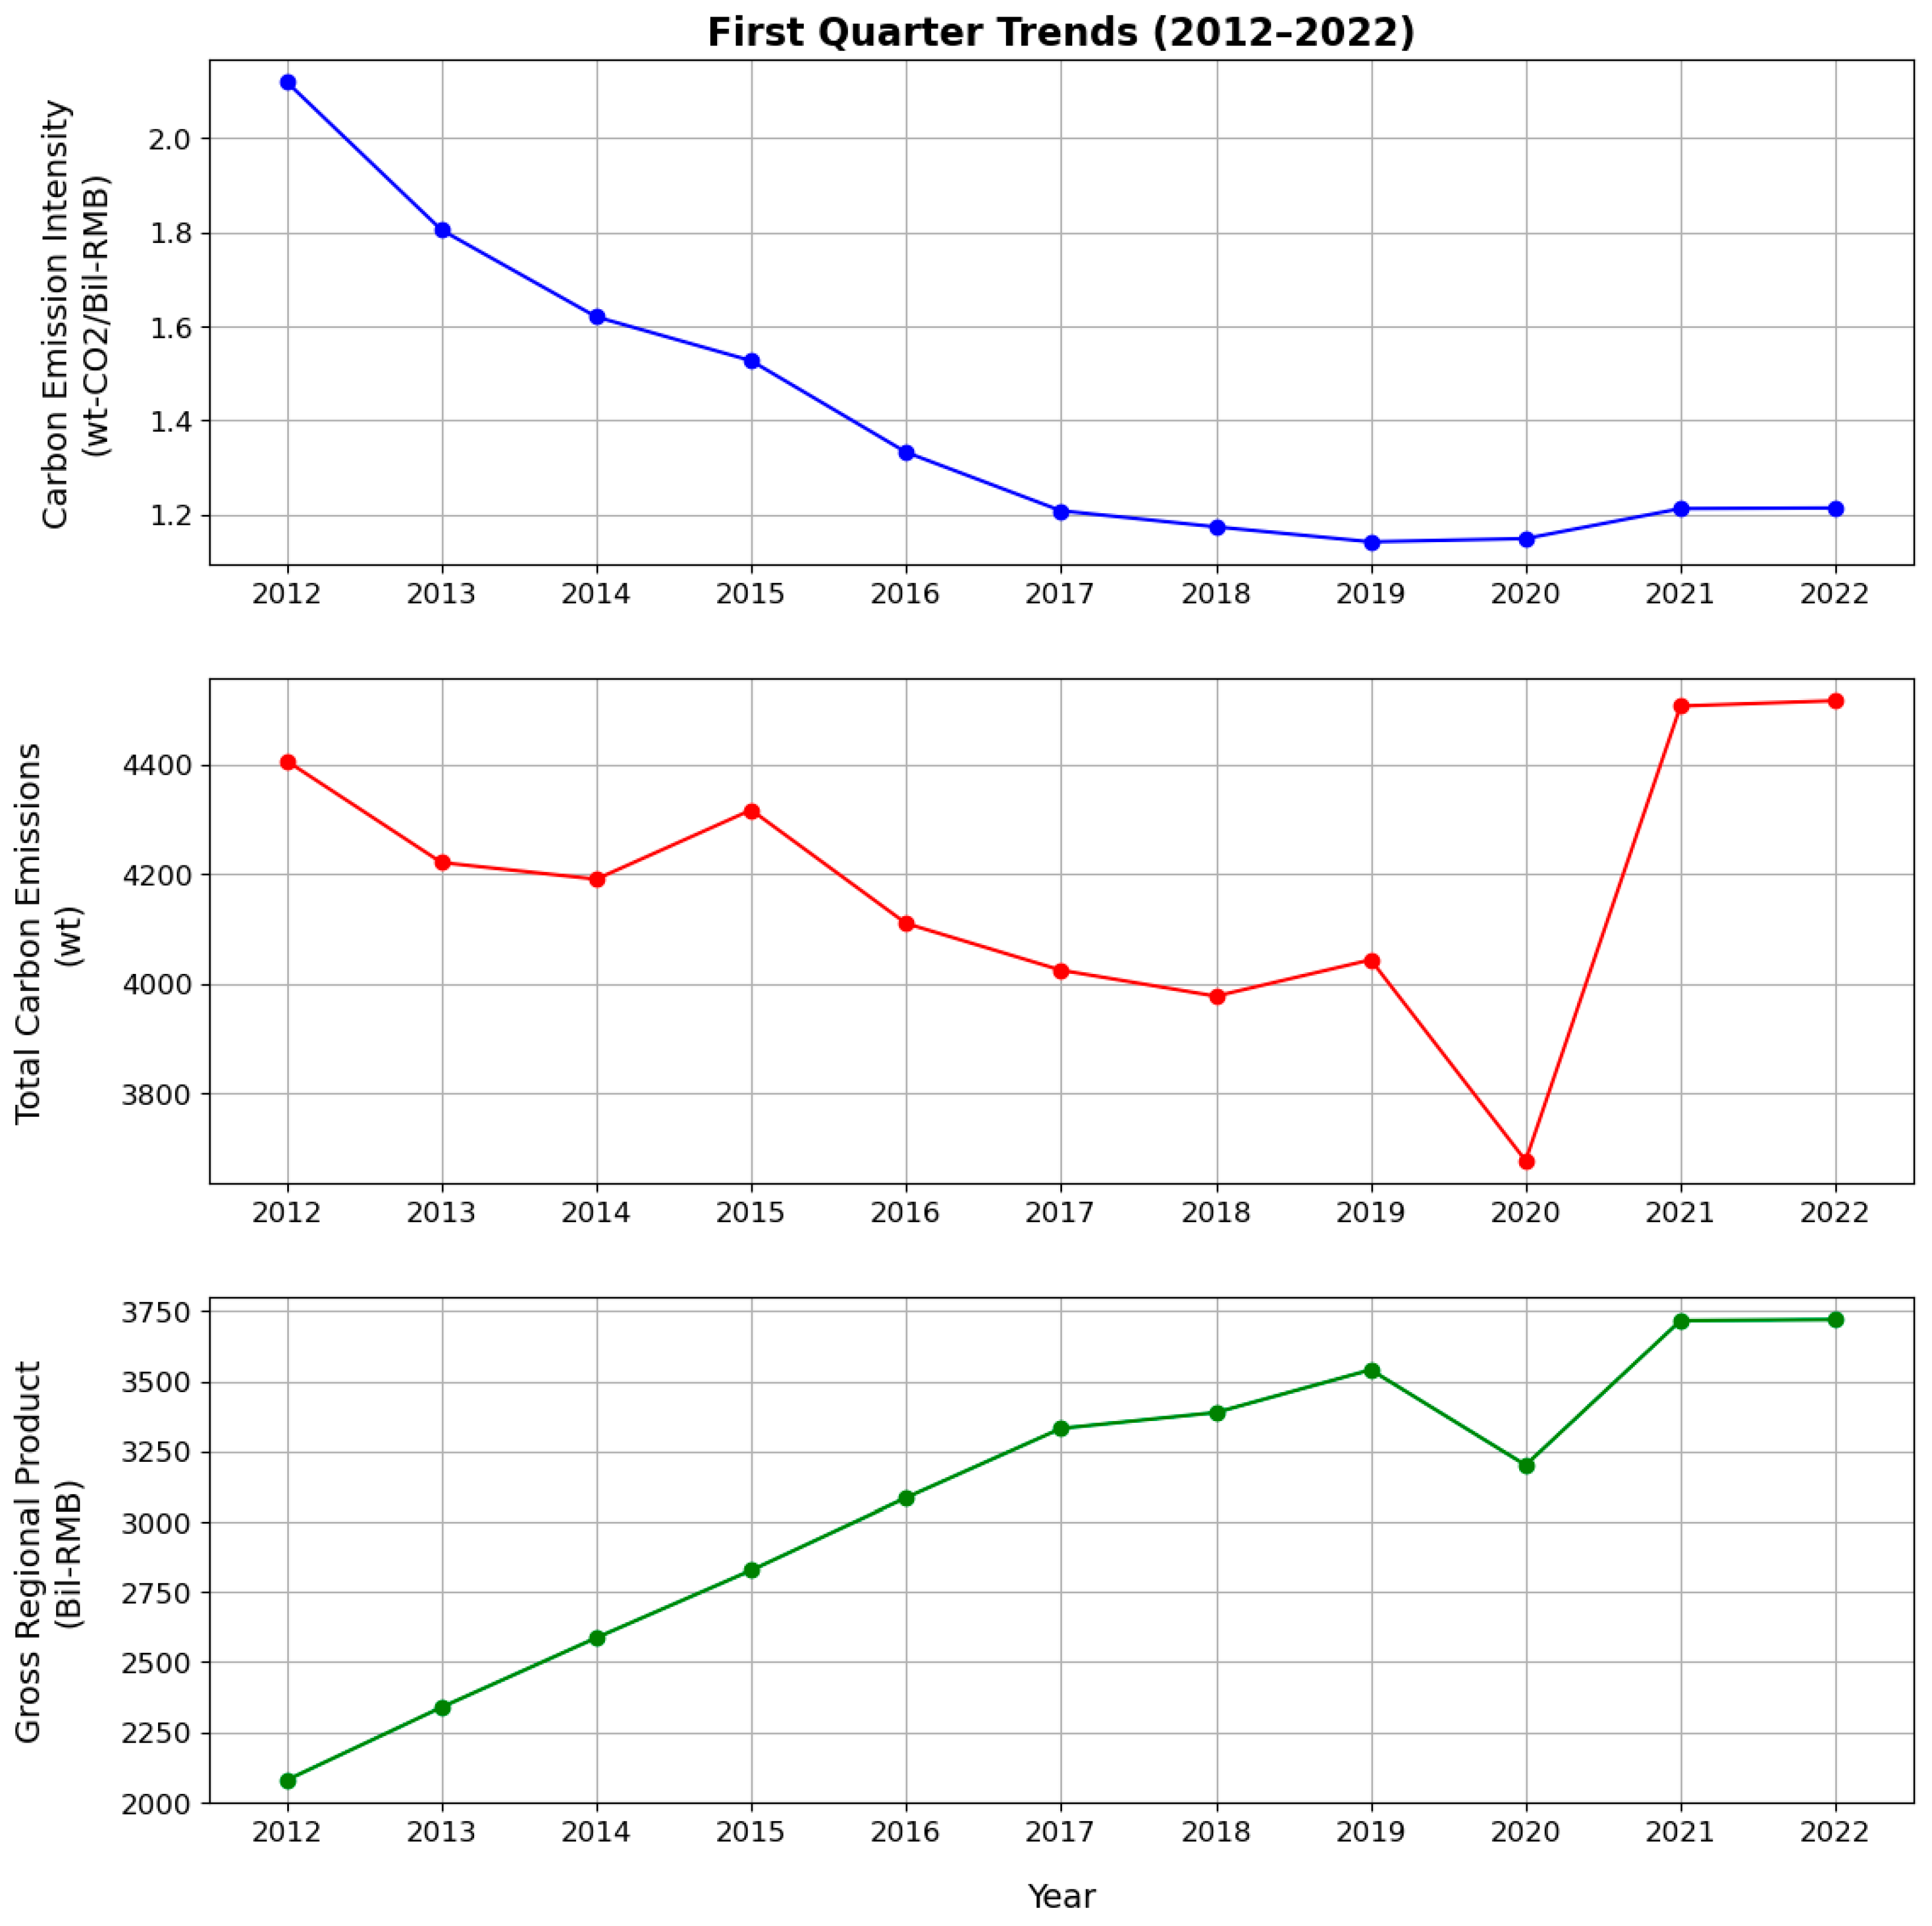
(1)
A Decomposition Analysis of Factors Influencing First Quarter Carbon Emission Intensity Changes, 2012–2022
During the entire period from 2012 to 2022, Tianjin’s first quarter carbon emission intensity experienced an initial decrease (Figure 6), followed by an increase. This trend indicates significant progress in reducing carbon emissions per unit of GDP in the initial years, but a reversal occurred starting in 2019.
From 2012 to 2019, the first quarter carbon emission intensity in Tianjin generally showed a declining trend. As shown in the figure above, the primary drivers of this trend were the positive contributions from the thermal power emission effect and the economic intensity effect, with the thermal power emission effect often showing negative values, especially during the periods 2016–2017 and 2018–2019, indicating significant improvements in the carbon emission efficiency of thermal power generation during these times. The power intensity effect was significantly negative in 2012–2013 and 2018–2019, reflecting improvements in electricity use efficiency and the supply–demand relationship of power. The economic intensity effect was also negative for most of the period, suggesting an improvement in the energy efficiency of economic activities, although a positive value occurred in 2017–2018, possibly due to the increased energy demand driven by economic growth that year. The power source structure effect, though showing minor fluctuations, also indicates a gradual increase in the use of renewable energy sources.
However, during the period from 2019 to 2022, the first quarter’s carbon emission intensity showed a slight increase. This change is linked to the positive values of the thermal power emission effect in 2020–2021 and 2021–2022, suggesting a decrease in the carbon emission efficiency during this time. The power intensity effect was negative in 2020–2022, indicating further improvements in electricity use efficiency, but positive in other years, reflecting changes in the power supply–demand relationship. The economic intensity effect was positive in 2019–2021, indicating an increase in energy demand due to economic activities. The variations in the power intensity effect and the economic intensity effect suggest that improvements in the energy efficiency of electricity use and economic activities may not have fully offset the impact of increased energy demand. The continued negative value of the power source structure effect suggests a gradual increase in the share of renewable energy, although this increase may not have fully met the needs of low-carbon development.
(2)
A Decomposition Analysis of the Factors Influencing Second Quarter Carbon Emission Intensity Changes, 2012–2022
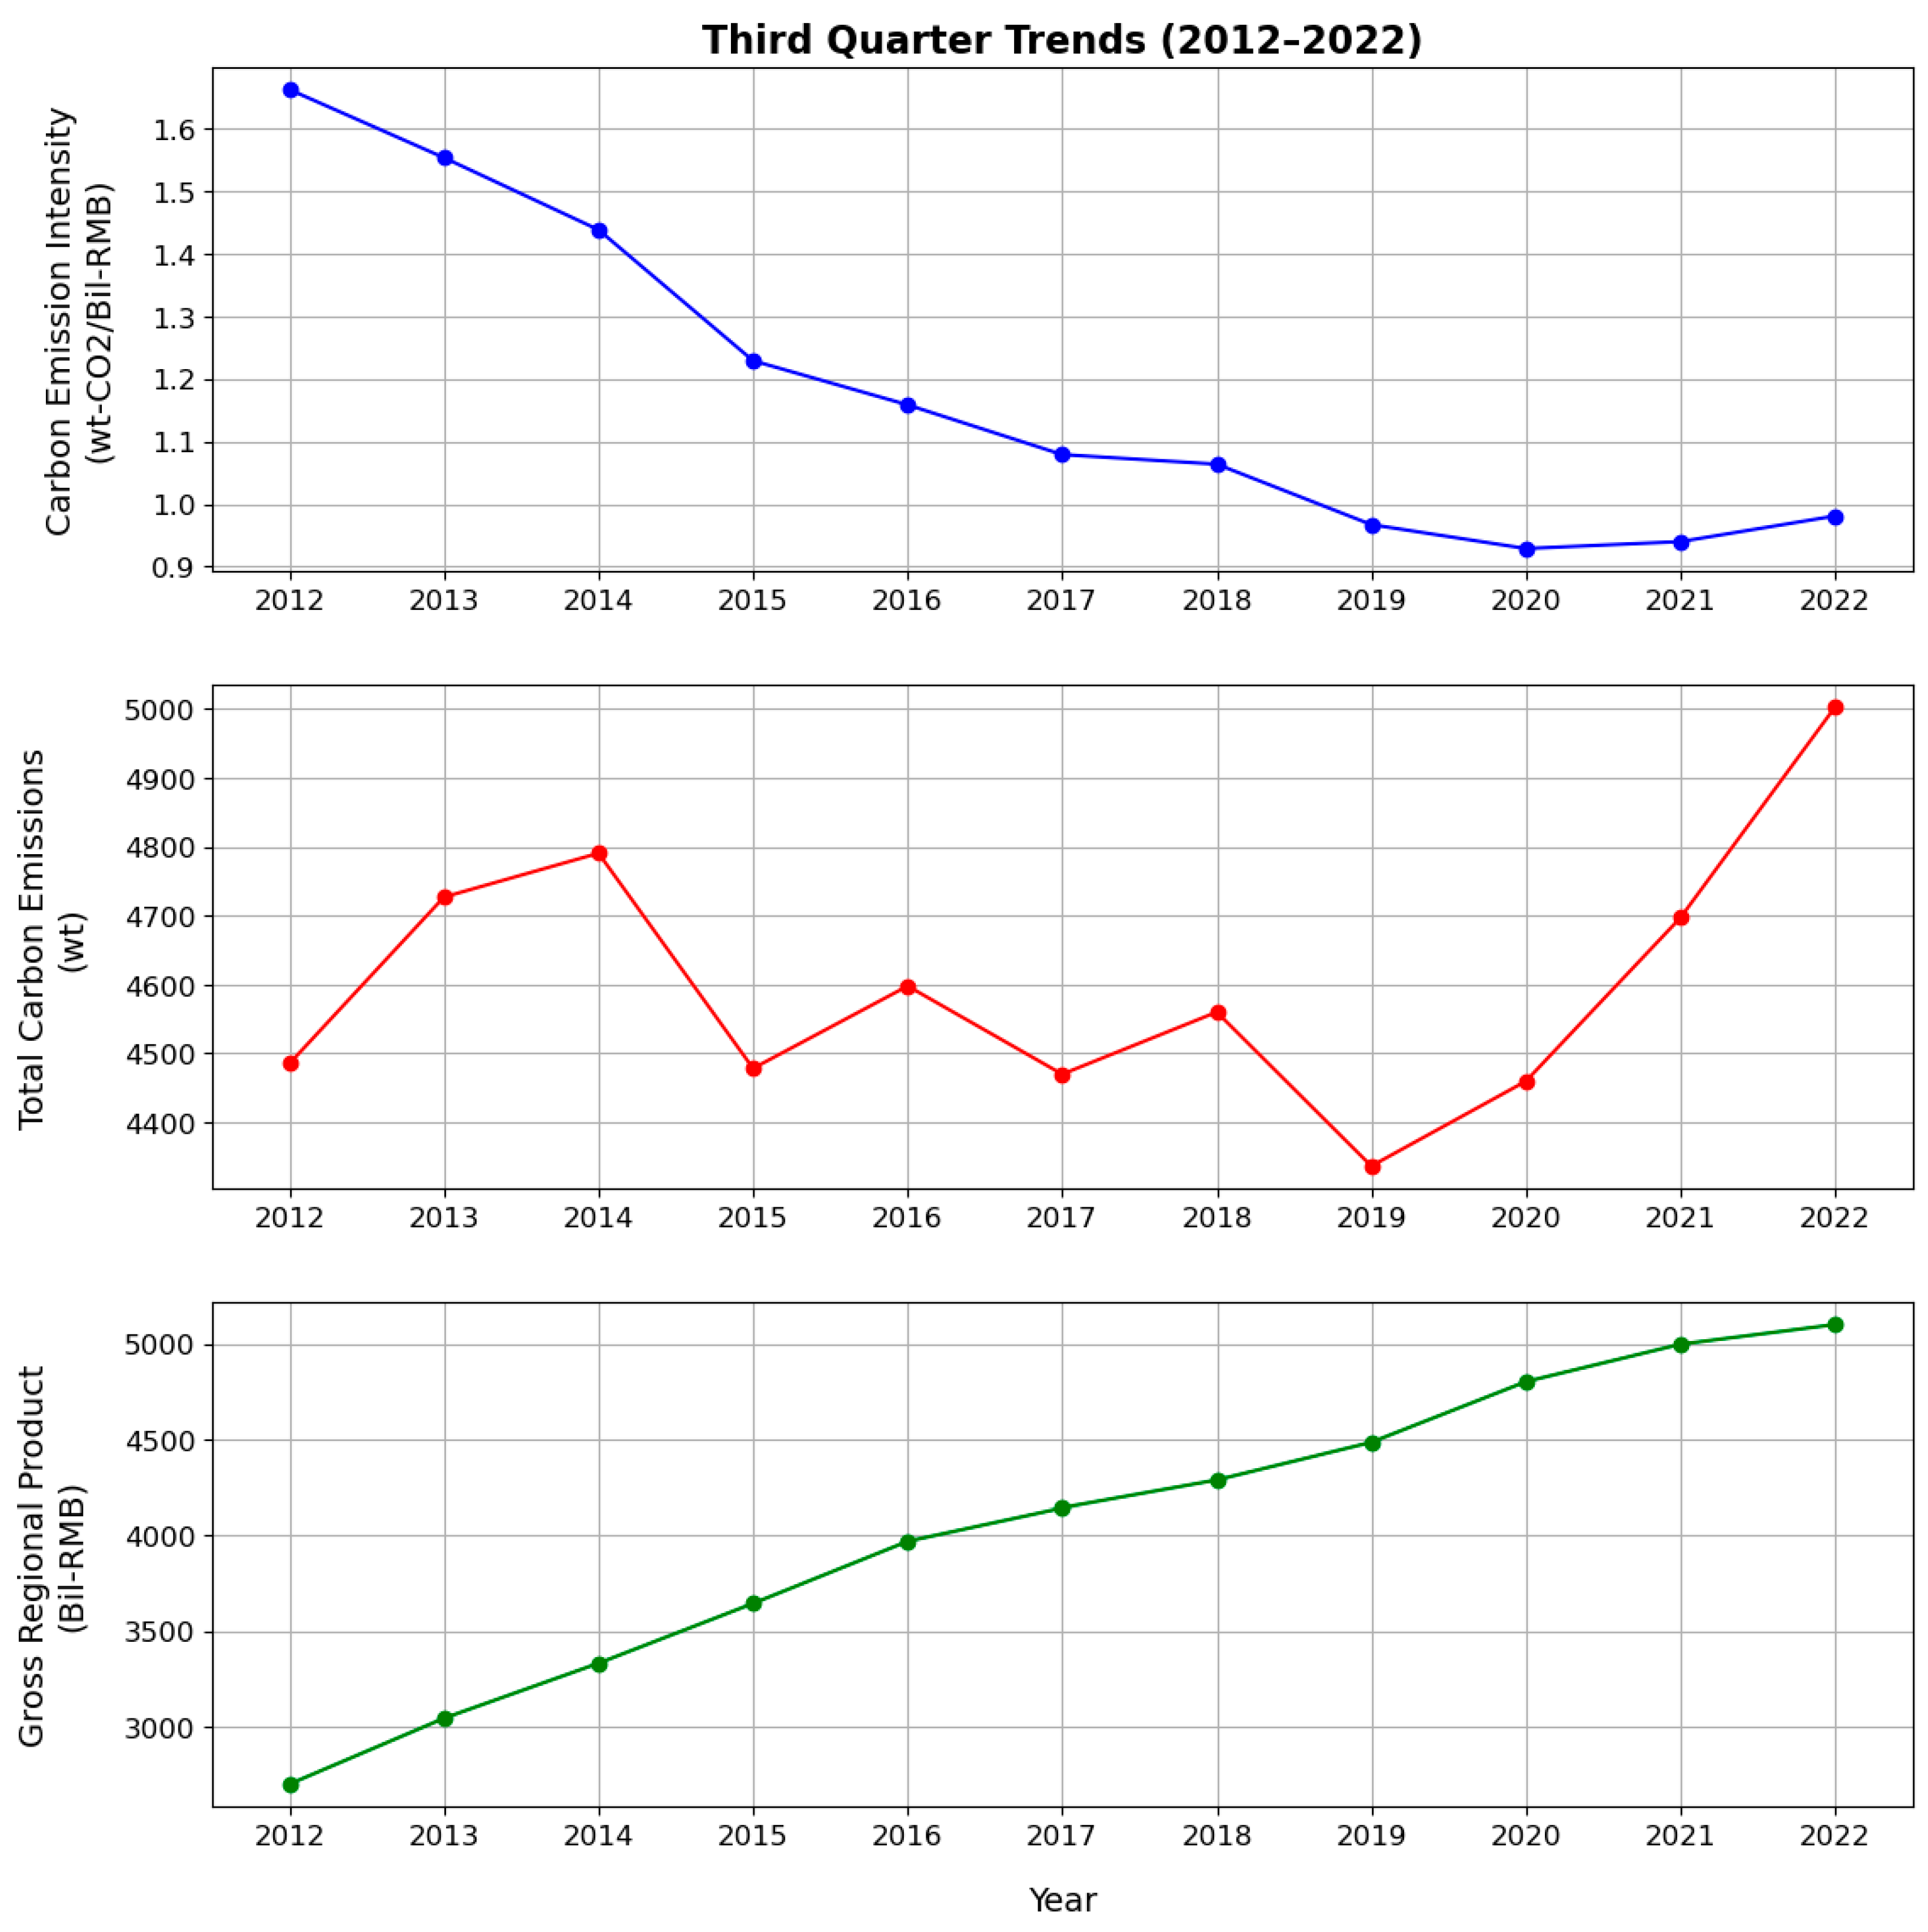
During the decade from 2012 to 2022, Tianjin’s second quarter carbon emission intensity initially decreased and then increased (Figure 7), reflecting the city’s efforts and challenges in carbon reduction. Initially, from 2012 to 2020, Tianjin made significant progress in reducing carbon emissions per unit of Gross Domestic Product (GDP), with the carbon emission intensity decreasing from 1.50 thousand tons per billion yuan to 0.78 thousand tons per billion yuan. As shown in the Figure 7, this achievement was primarily due to several factors:
Thermal Power Emission Efficiency: The thermal power emission effect was negative for many years, especially in key periods like 2016–2017, indicating significant improvements in carbon emission efficiency from thermal power generation.
The Positive Contribution of the Economic Intensity Effect: The economic intensity effect also showed negative values for most of the period, suggesting that energy use efficiency in economic activities in Tianjin improved.
Gradual Optimization of Electricity Use Efficiency and Renewable Energy Shares: Although their impact was relatively small, they played a role in reducing carbon emission intensity.
However, the situation began to change after 2020. In the following two years, carbon emission intensity slightly rose to 0.85 thousand tons per billion yuan, reflecting new challenges Tianjin faced in advancing carbon reduction. The reasons for the increase in carbon emission intensity during this period are multifaceted:
A Decline in Thermal Power Emission Efficiency: Especially from 2020 to 2022, a reversal in carbon emission efficiency became a significant factor driving up carbon emission intensity.
The Impact of Economic Growth on Energy Demand: The fluctuations in the economic intensity effect during this period highlighted the direct impact of economic growth on increasing energy demand.
The Continued Role of the Power Intensity Effect: While it continued to contribute to reducing carbon emission intensity, its positive effects may have been offset by adverse impacts from other factors.
Continued Improvement pf the Power Source Structure Effect: Despite the rise in carbon emission intensity, the ongoing improvement in the power source structure effect, indicating an increase in the share of renewable energy, lays the foundation for Tianjin to achieve its long-term carbon reduction goals.
(3)
A Decomposition Analysis of the Factors Influencing Third Quarter Carbon Emission Intensity Changes, 2012–2022
During the period from 2012 to 2020, Tianjin’s third quarter carbon emission intensity saw a significant average annual decline of approximately 5.52%. Specifically, as analyzed in the Figure 8, we see the following:
The Thermal Power Emission Effect: The negative contribution (an average of −0.0393) signifies substantial progress in enhancing the efficiency of thermal power generation in Tianjin, reducing its contribution to carbon emissions. This likely relates to the optimization of the energy structure and improvements in the technological equipment and operational efficiency of thermal power plants.
The Economic Intensity Effect: The negative contribution (an average of −0.0533) underscores positive changes in the energy use efficiency of economic activities in Tianjin, particularly in terms of industrial upgrading and reducing energy consumption.
It is noteworthy that while the effects of electricity intensity and power source structure had a smaller impact on carbon emission intensity, their presence still revealed gradual improvements in the electricity supply and consumption efficiency and the use of renewable energy in Tianjin. A slight positive contribution from the power intensity effect (an average of 0.0019) might reflect increased efficiency in electricity usage and suggests improvements in electricity system management and demand-side response strategies. A minor negative contribution from the power source structure effect (an average of −0.0011) likely indicates an increase in the share of renewable energy within the energy structure.
However, during the period from 2020 to 2022, the third quarter carbon emission intensity in Tianjin exhibited an upward trend, with an average annual increase of about 5.61%. Notably, we see the following:
The Thermal Power Emission Effect: The positive contributions during this period (average of 0.0356) reveal a reduction in carbon emission efficiency from thermal power generation, potentially reflecting increased thermal power output or insufficient application of carbon reduction technologies, which negatively impacted the overall carbon emission intensity.
The Power Source Structure Effect: Although still negative (−0.0079), indicating continued efforts to increase the share of renewable energy in the energy structure, this effort seemed insufficient to fully offset the increase in emissions from other factors.
The Power Intensity Effect: The negative contributions (−0.0237) reflect progress in enhancing electricity use efficiency in Tianjin, a positive sign for carbon emission intensity control efforts.
The Economic Intensity Effect: A positive value (0.0221) suggests that economic activity growth may have led to increased energy demands, exerting upward pressure on carbon emission intensity.
(4)
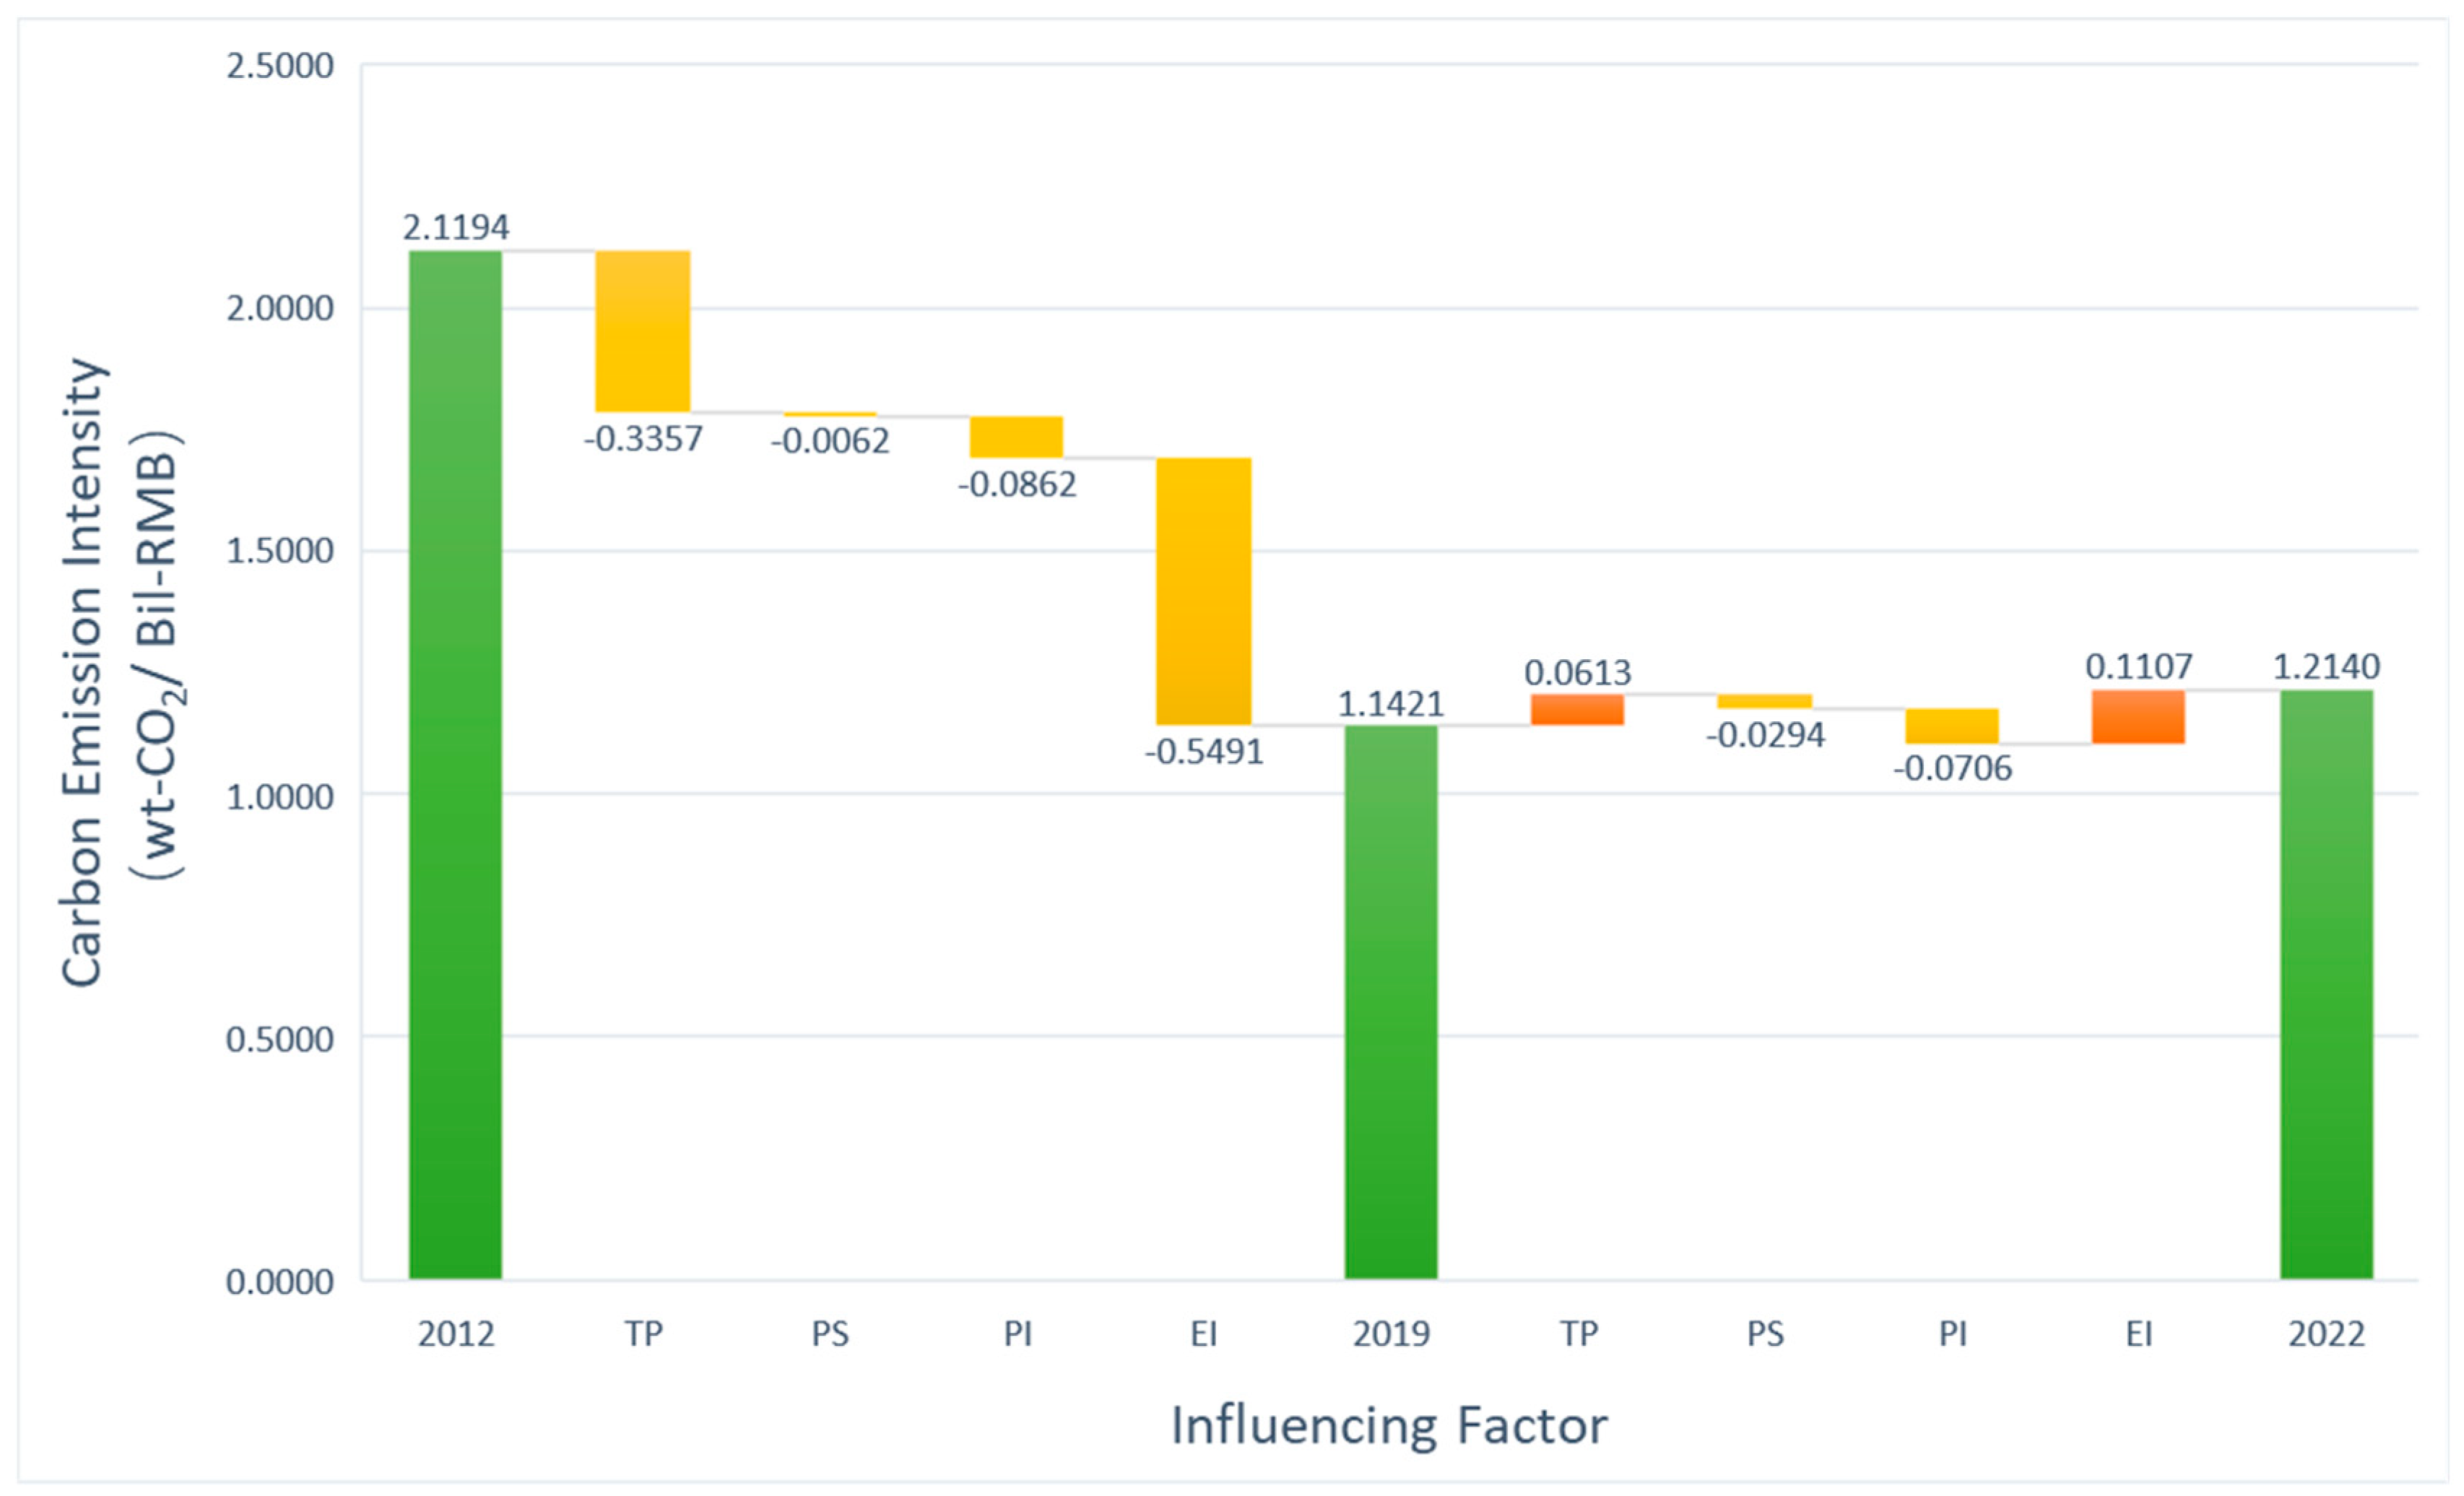
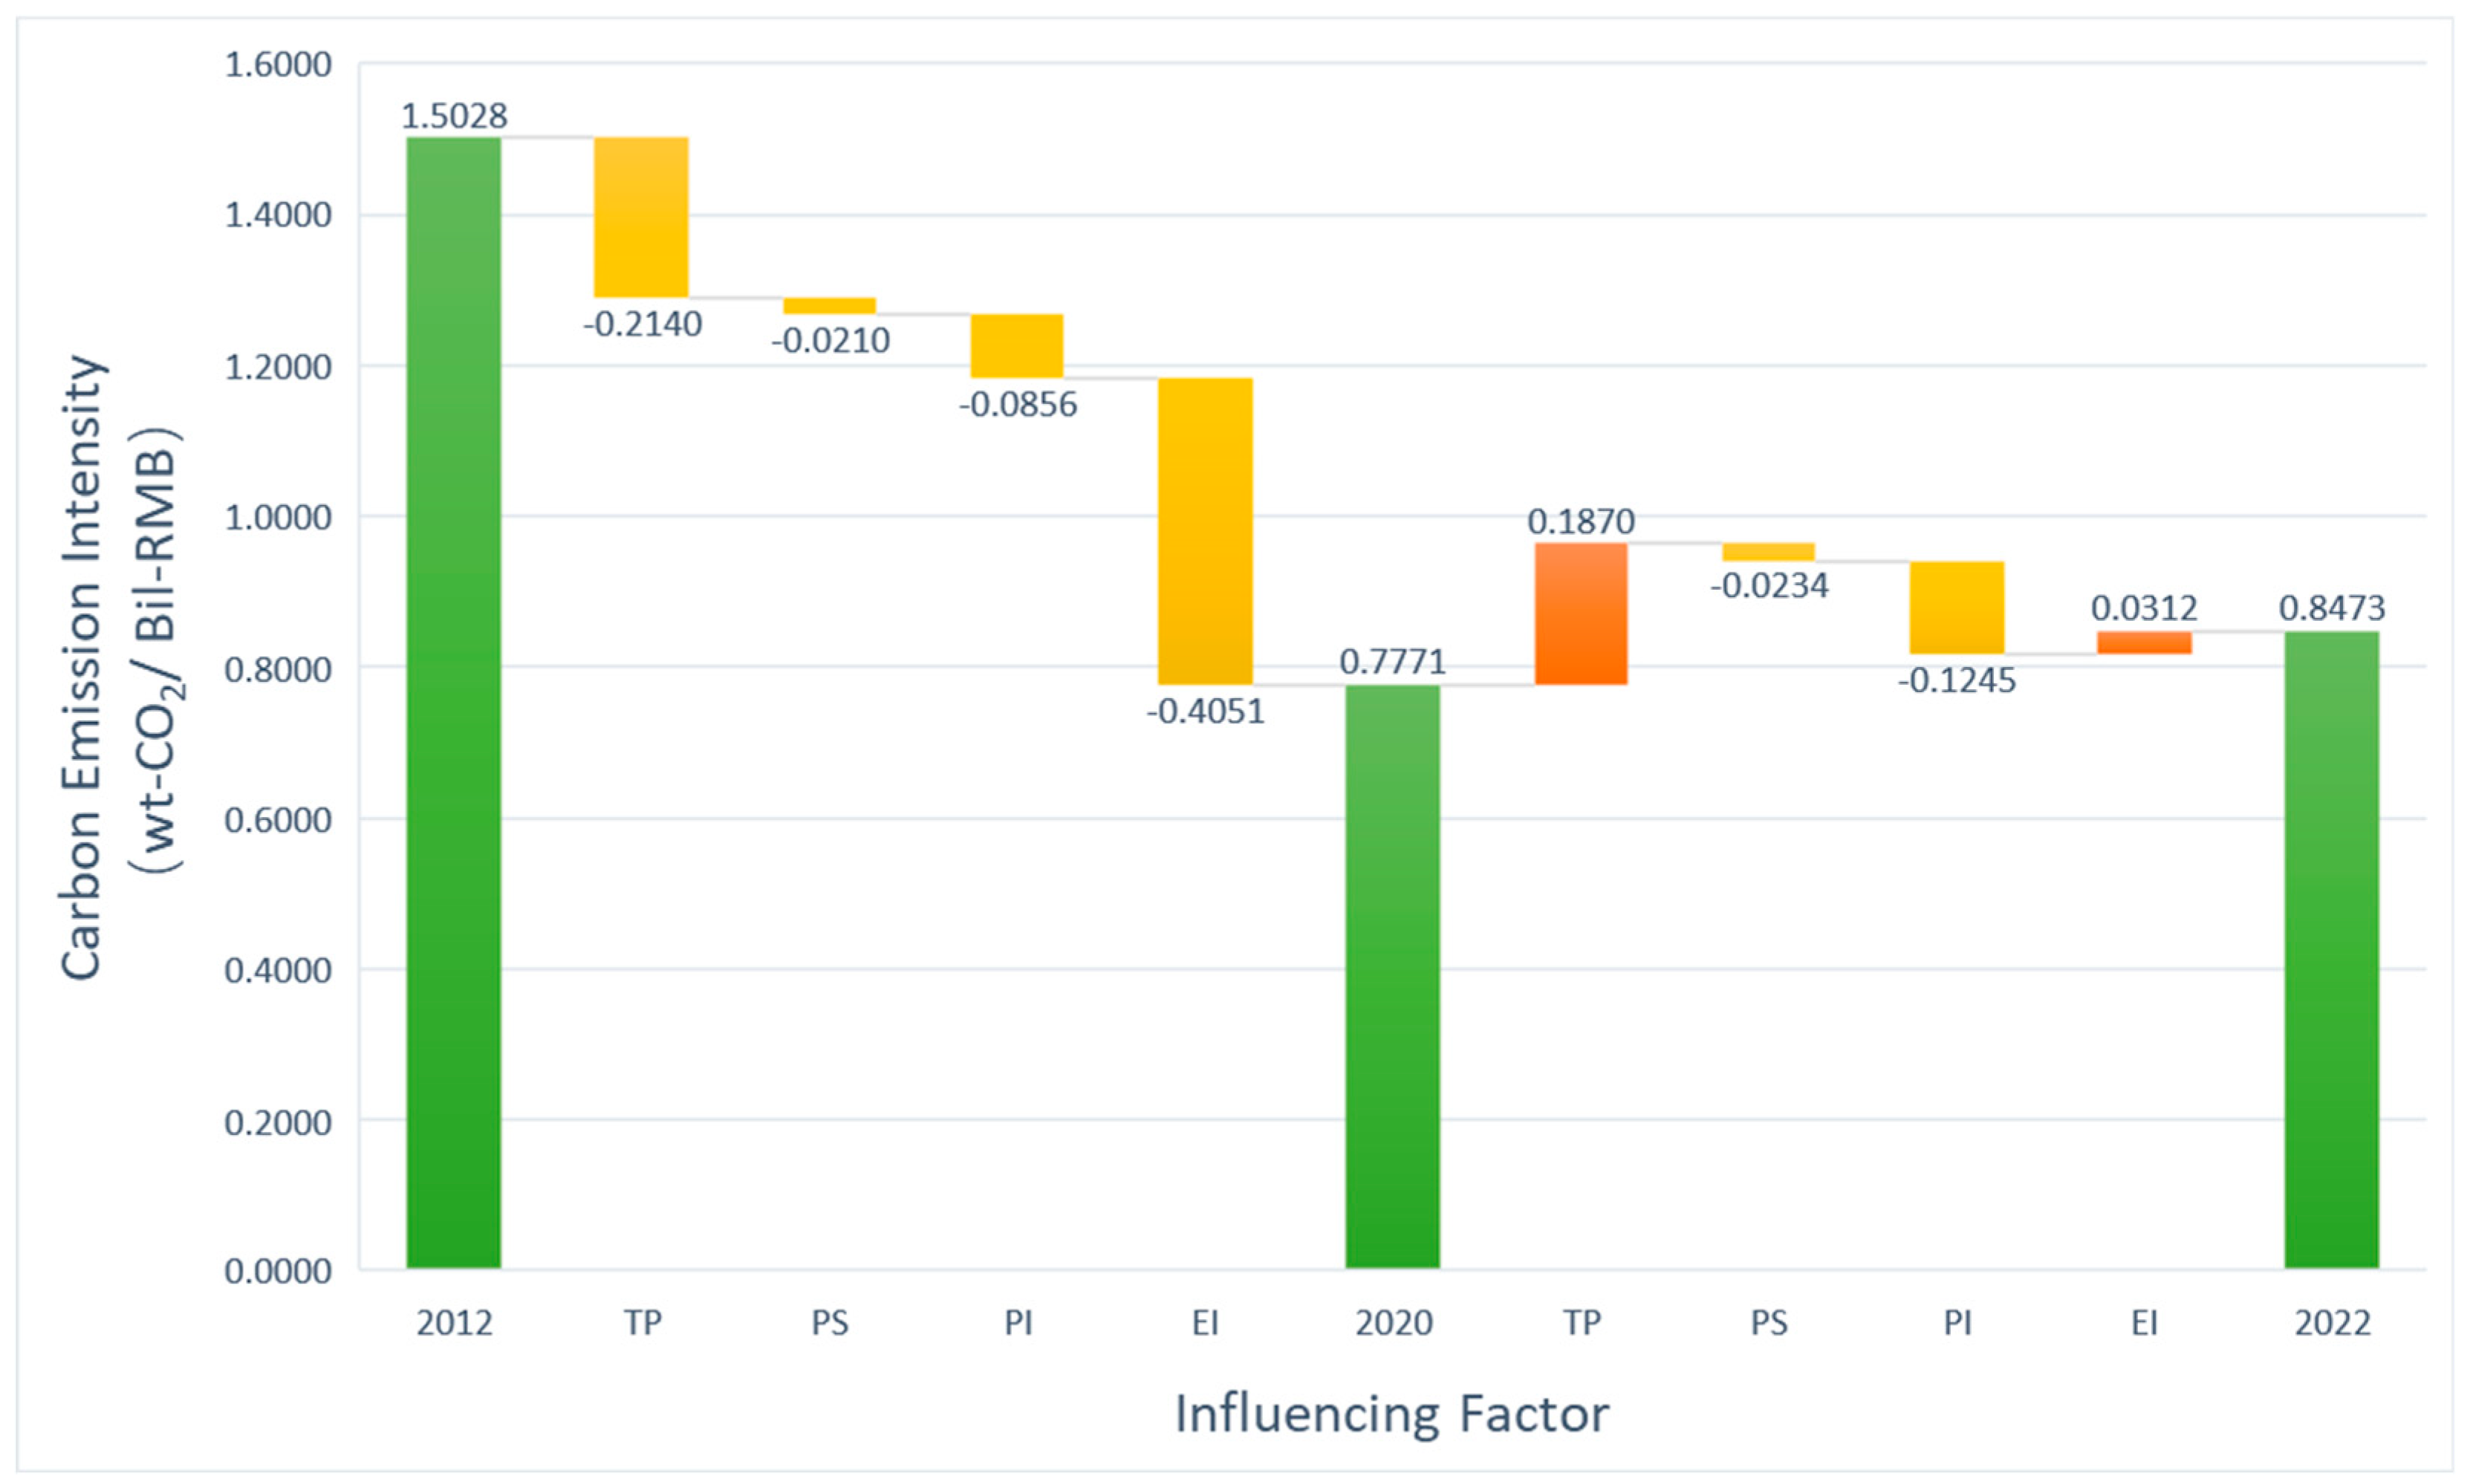
A Decomposition Analysis of the Factors Influencing Fourth Quarter Carbon Emission Intensity Changes, 2012–2022
During the period from 2012 to 2022, Tianjin’s fourth quarter carbon emission intensity showed significant fluctuations. From 2012 to 2019, there was a notable decline in the fourth quarter carbon emission intensity. As analyzed in Figure 9, the negative contributions from the thermal power emission effect underscored significant improvements in thermal power generation efficiency. Simultaneously, the positive changes in the economic intensity effect reflected Tianjin’s progress in enhancing energy use efficiency in economic activities. Although the power source structure effect had a relatively small impact on carbon emission intensity, it still indicated progress in increasing the use of renewable energy sources, while the power intensity effect contributed negatively to the carbon emission intensity during this phase.
From 2019 to 2021, as economic activities accelerated and energy demands grew, there was a slight increase in Tianjin’s carbon emission intensity. This change highlighted new challenges, particularly the decrease in thermal power emission efficiency and the increased energy consumption driven by economic growth. Although the power source structure effect continued to show a negative value, indicating ongoing focus on renewable energy, the positive contributions from the thermal power emission effect and the increase in the economic intensity effect had a greater impact on carbon emission intensity than the positive effects of the power source structure and power intensity effects.
In the period from 2021 to 2022, Tianjin’s carbon emission intensity began to decline again. This change was due to optimizations in the power source structure, improvements in electricity use efficiency, and ongoing enhancements in the energy efficiency of economic activities, where the positive effects of these factors outweighed the negative impacts brought by the thermal power emission effect.
In summary, the decomposition analysis of the factors affecting quarterly carbon emission intensity changes from 2012 to 2022 reveals the following:
From a carbon emission intensity perspective, the first quarter shows the highest average carbon emission intensity, while the second quarter has the lowest, with the third and fourth quarters in between. This indicates significant seasonal variations in Tianjin’s carbon emission intensity, potentially influenced by seasonal factors such as increased energy consumption due to winter heating and summer cooling.
Regarding the contributions of various effects, the thermal power emission effect makes a substantial negative contribution in the first and third quarters, with the second quarter showing the smallest contribution. This may relate to seasonal variations in electricity demand, with higher consumption in winter and summer leading to increased carbon emissions from thermal power generation, while spring has relatively lower electricity consumption. The power source structure effect shows small and consistent negative contributions across all quarters, indicating a relatively stable power source structure in Tianjin over these years, with a minimal impact on carbon emission intensity. The power intensity effect shows its largest negative contribution in the second quarter, potentially due to reduced economic activity or improved electricity use efficiency during this period. The economic intensity effect is most negative in the first quarter, reflecting the impact of seasonal fluctuations in economic activity on carbon emissions.
Overall, there are distinct seasonal variations in Tianjin’s quarterly carbon emission intensity and influencing factors, likely related to seasonal economic activities, energy consumption patterns, and climatic conditions. Among these, the first quarter exhibits the largest negative contributions across all effects, while the second quarter is relatively lower, with the third and fourth quarters at intermediate levels.

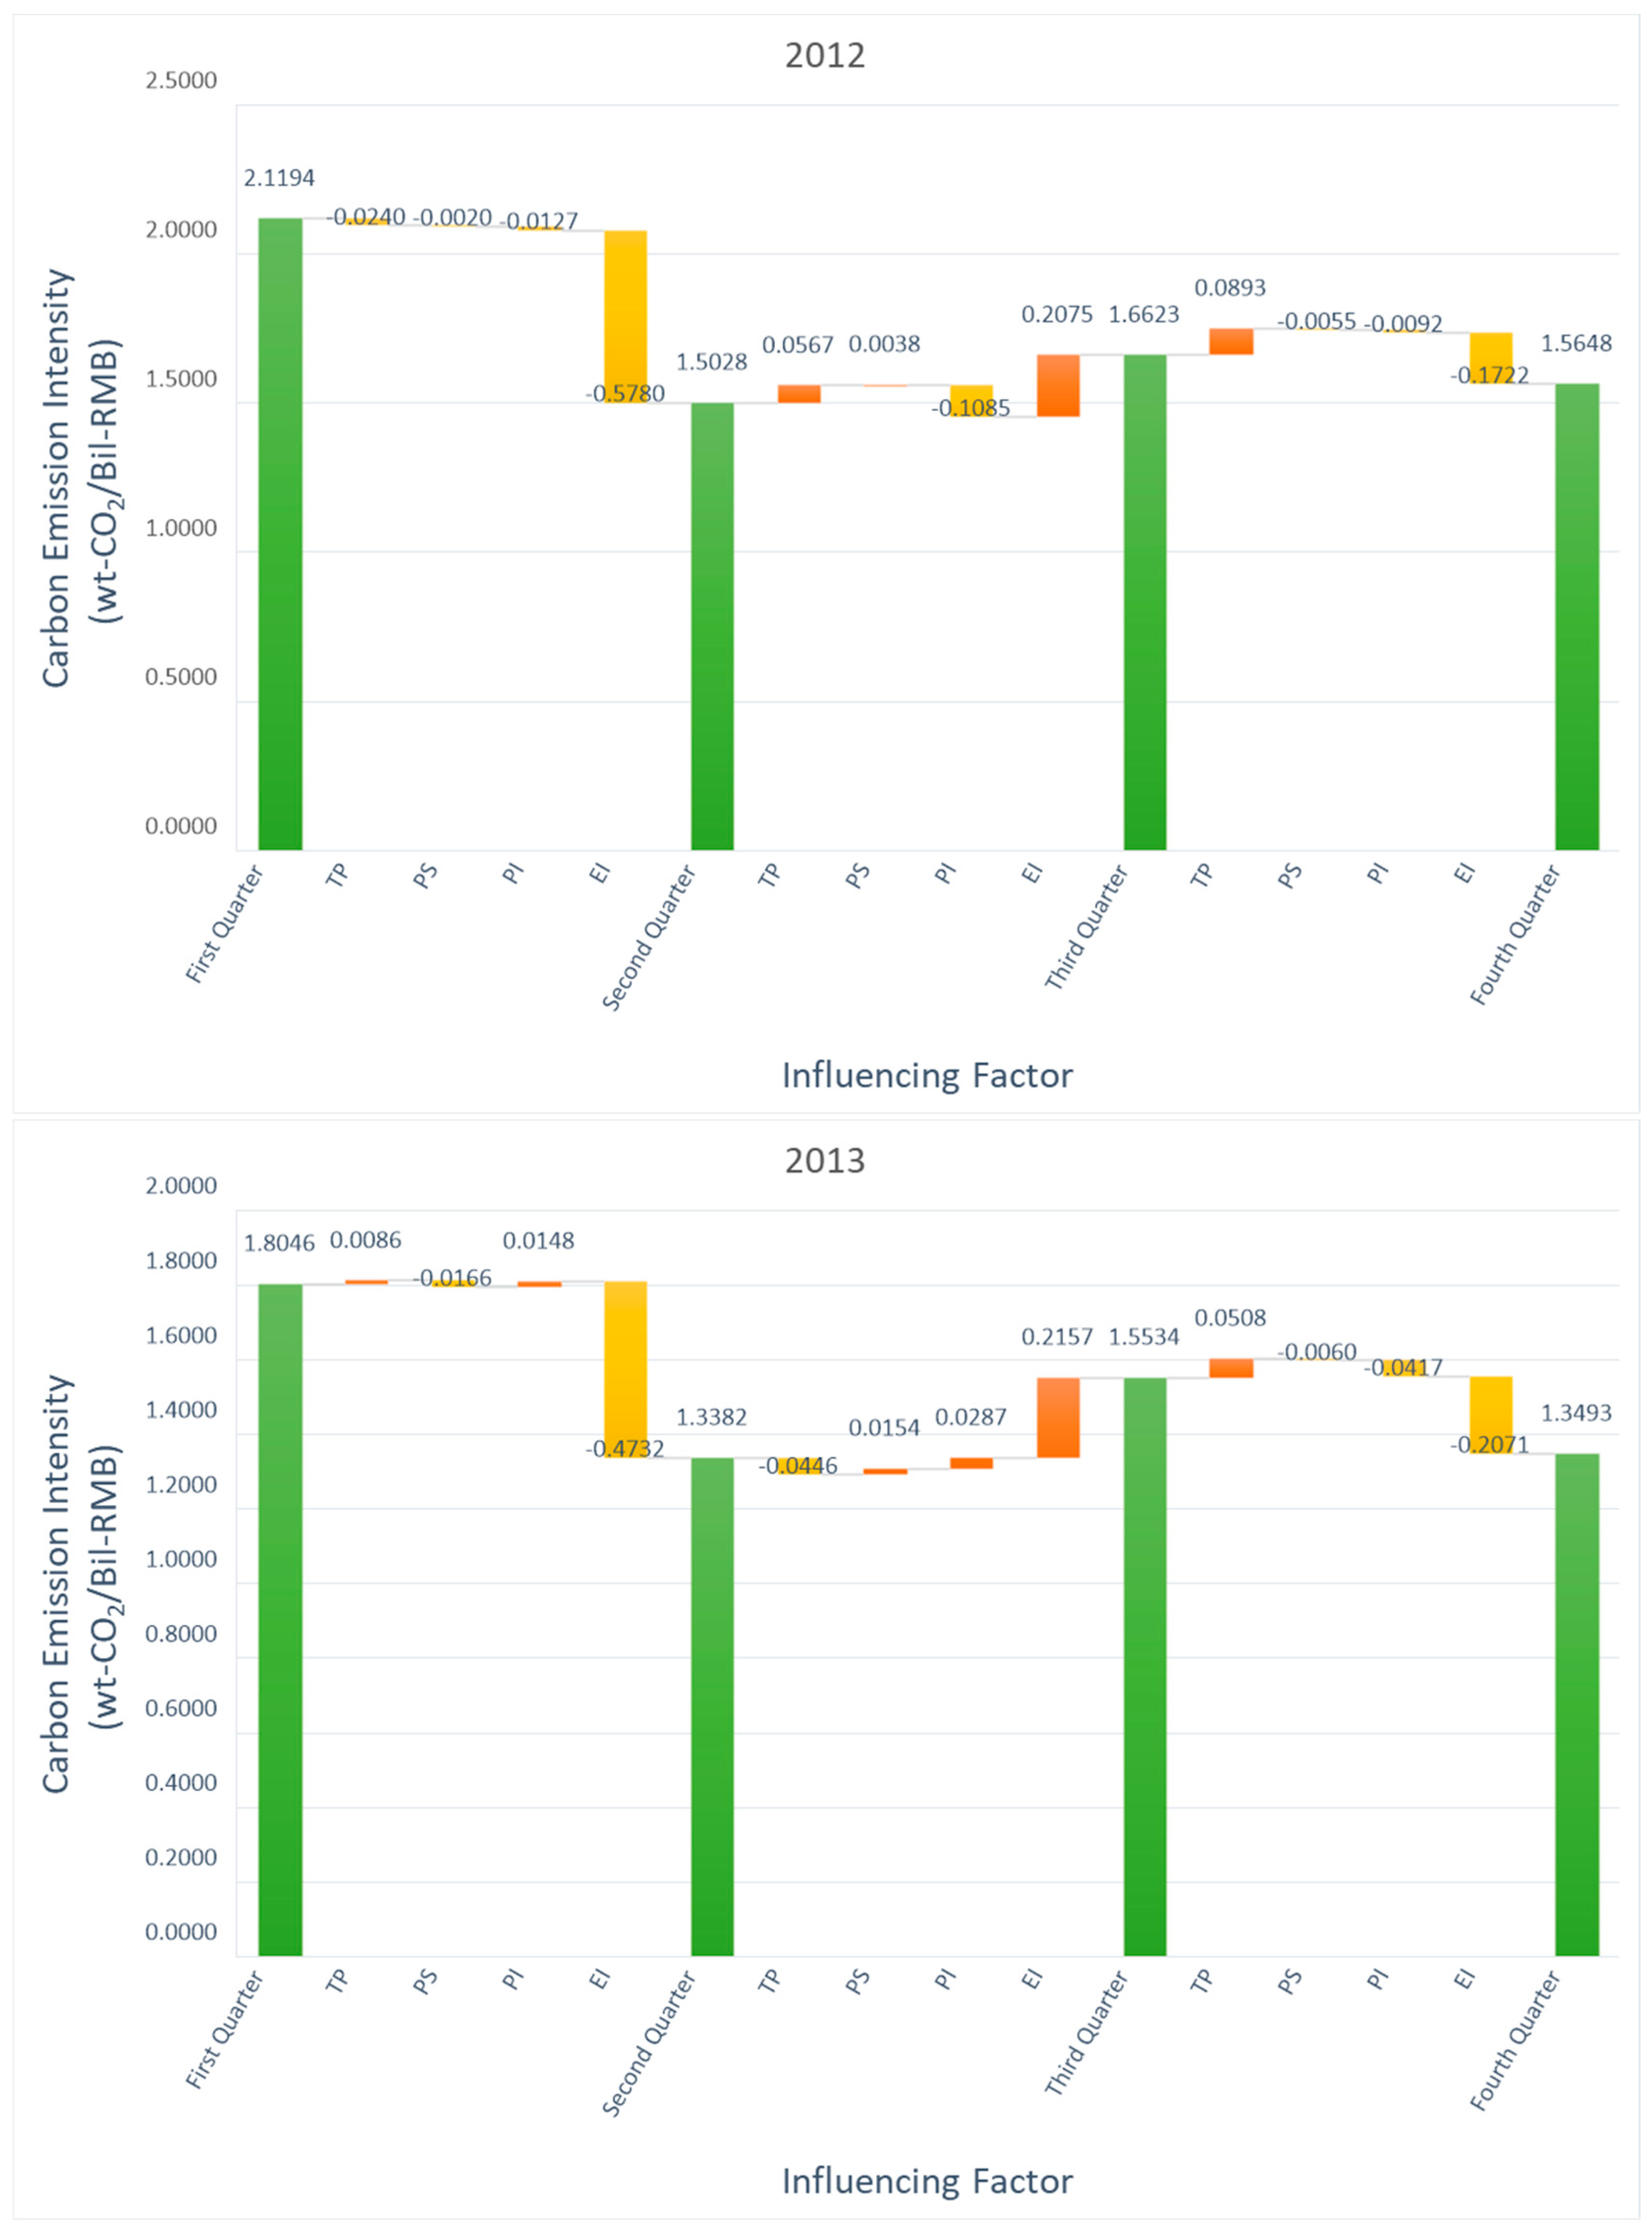
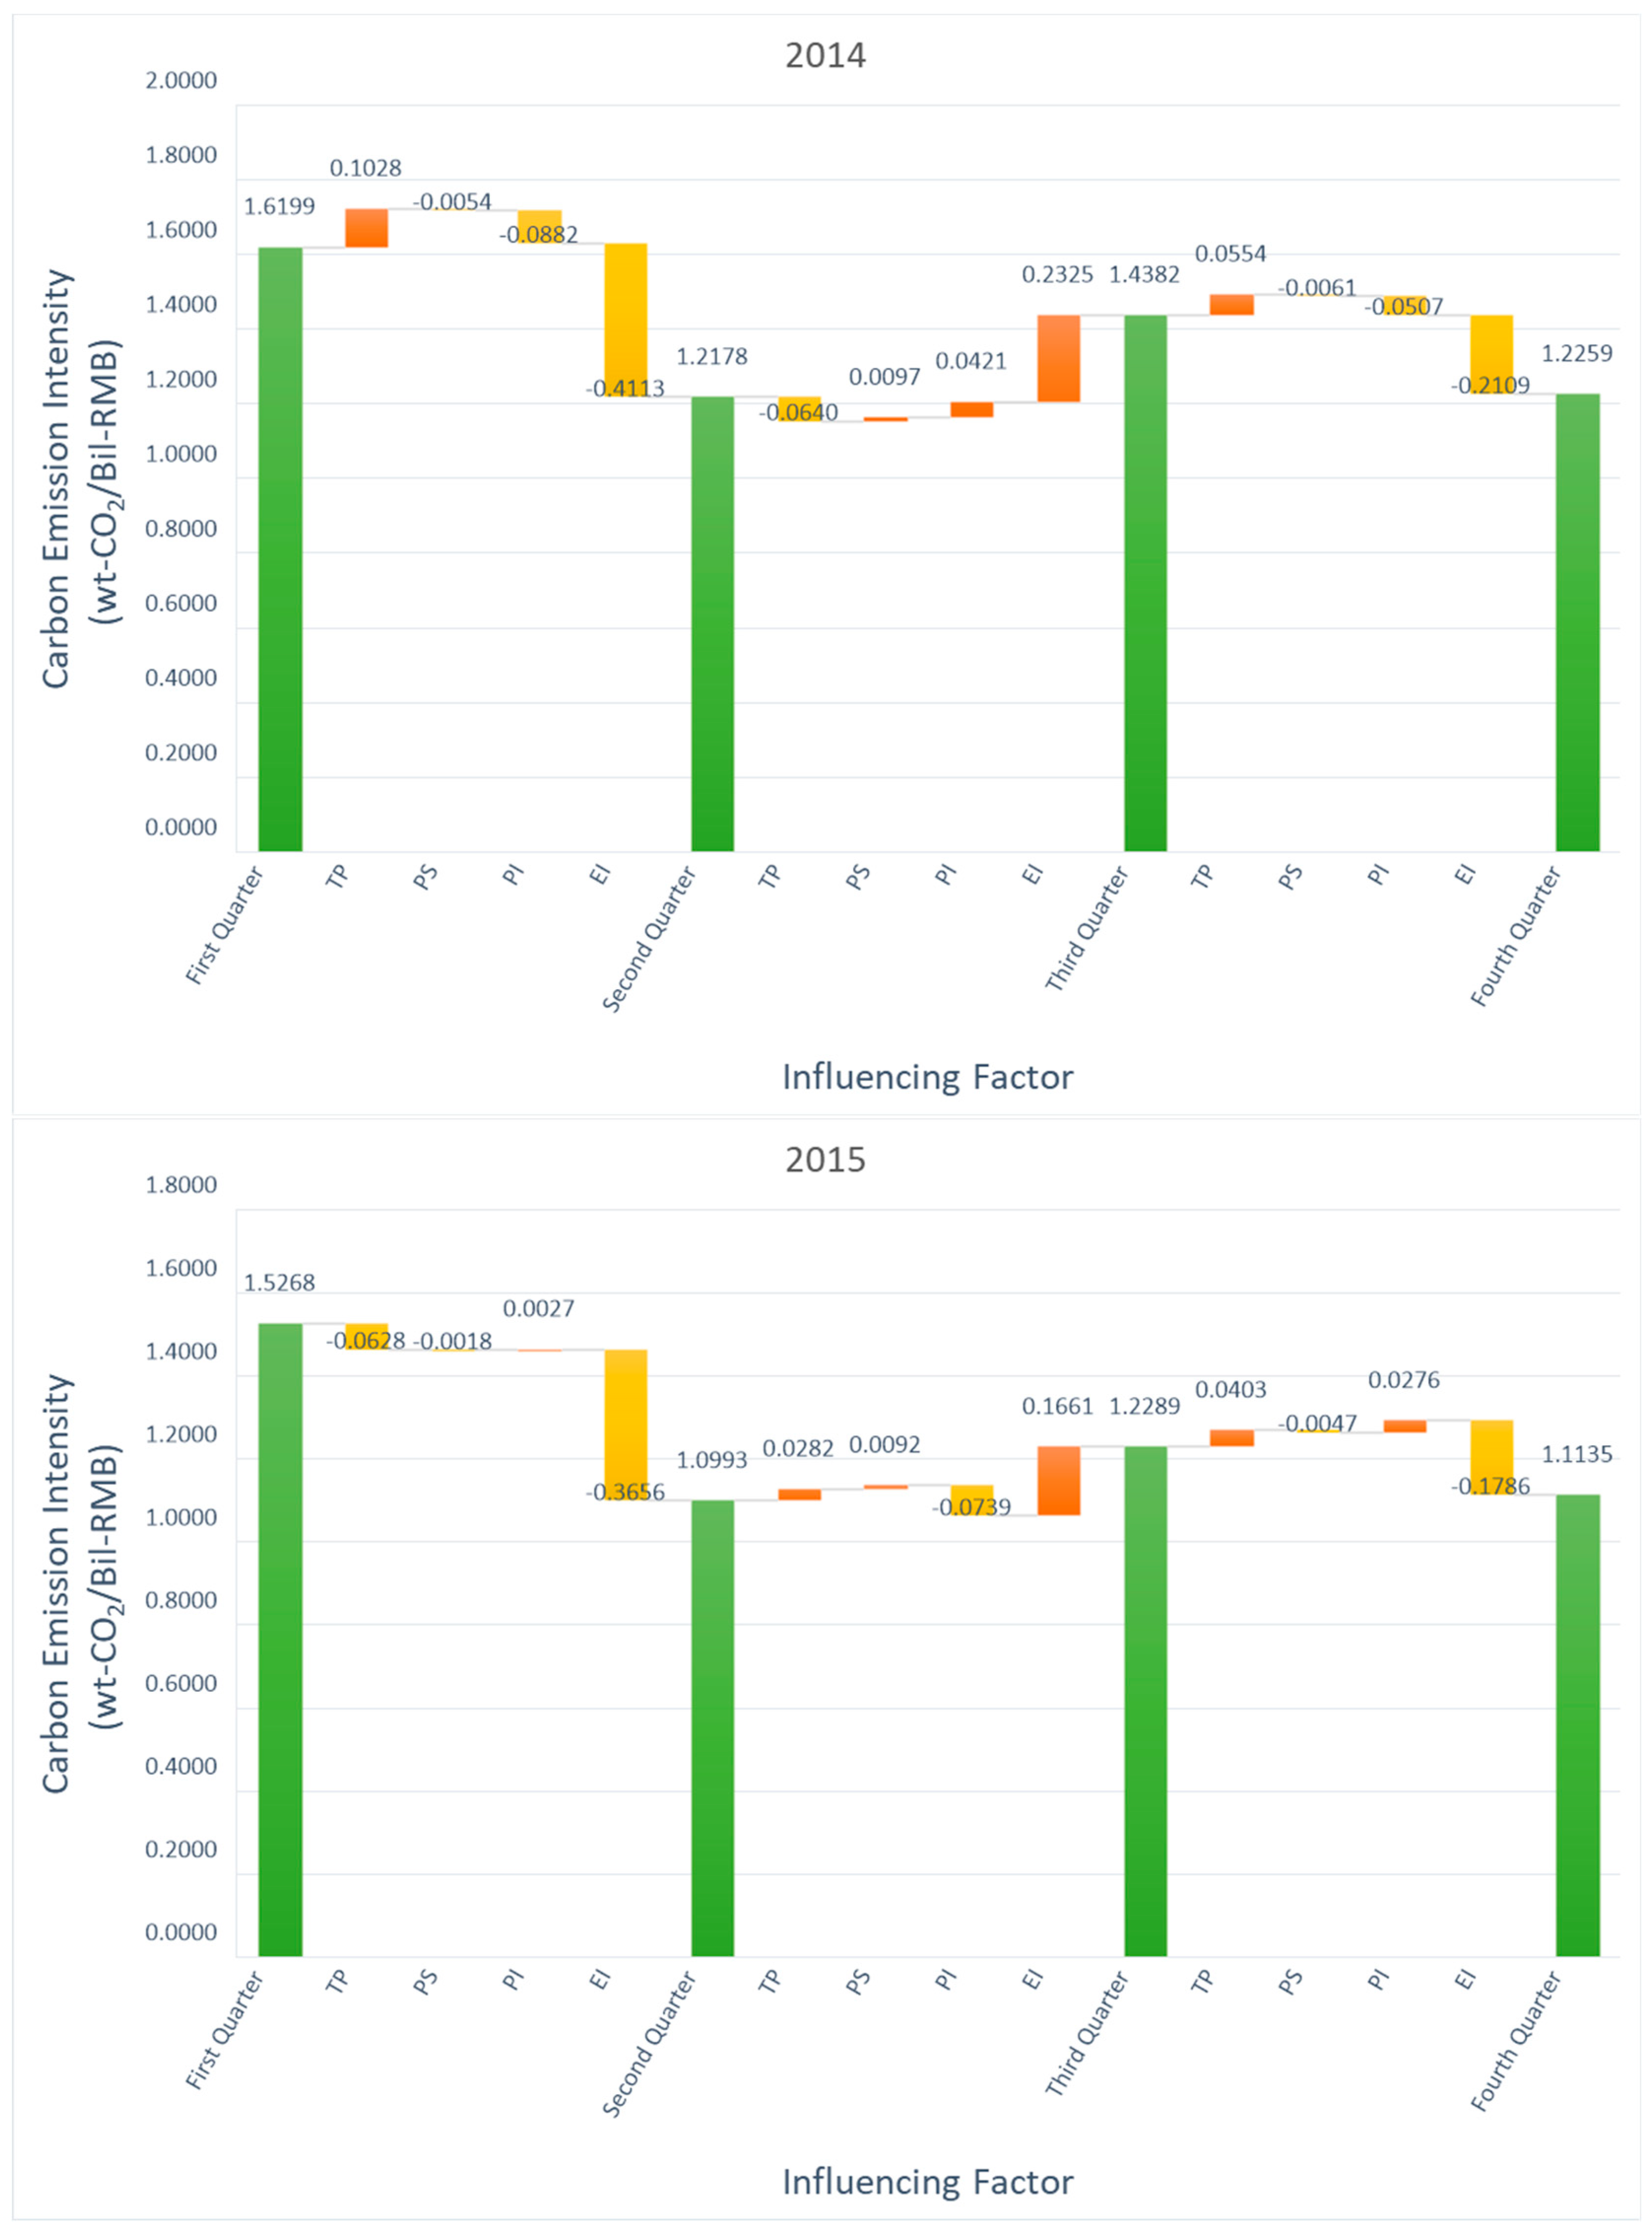
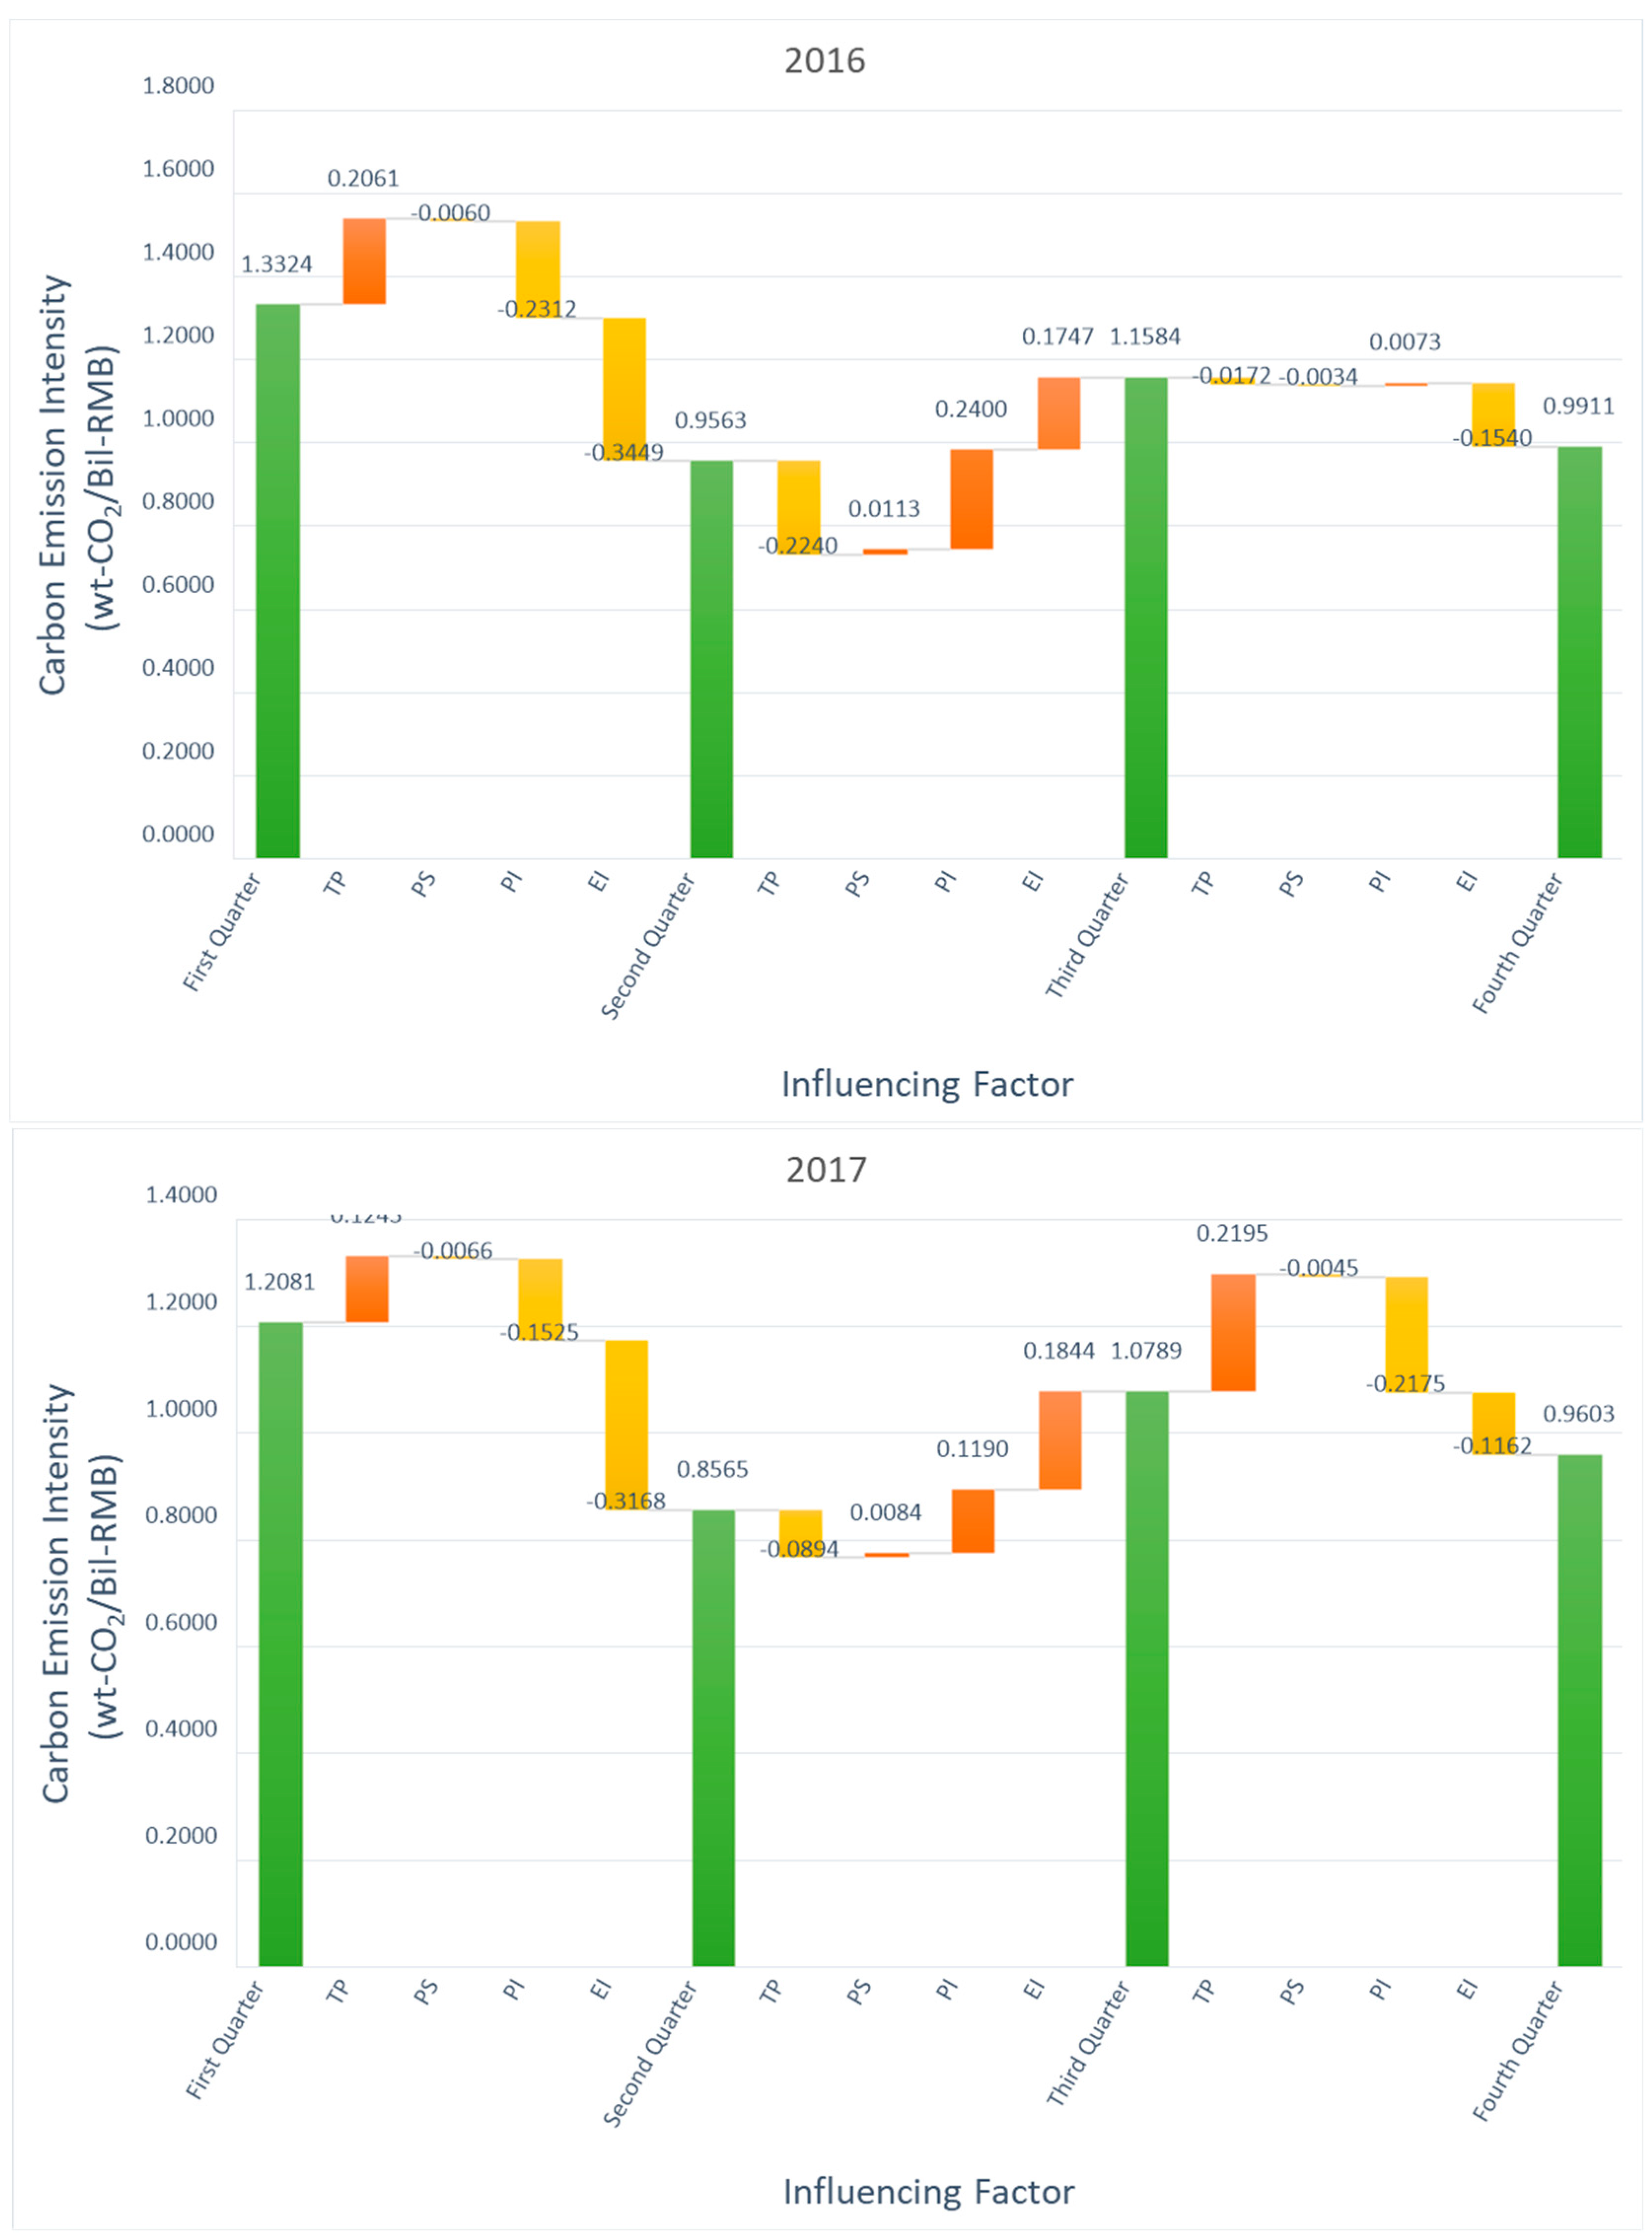
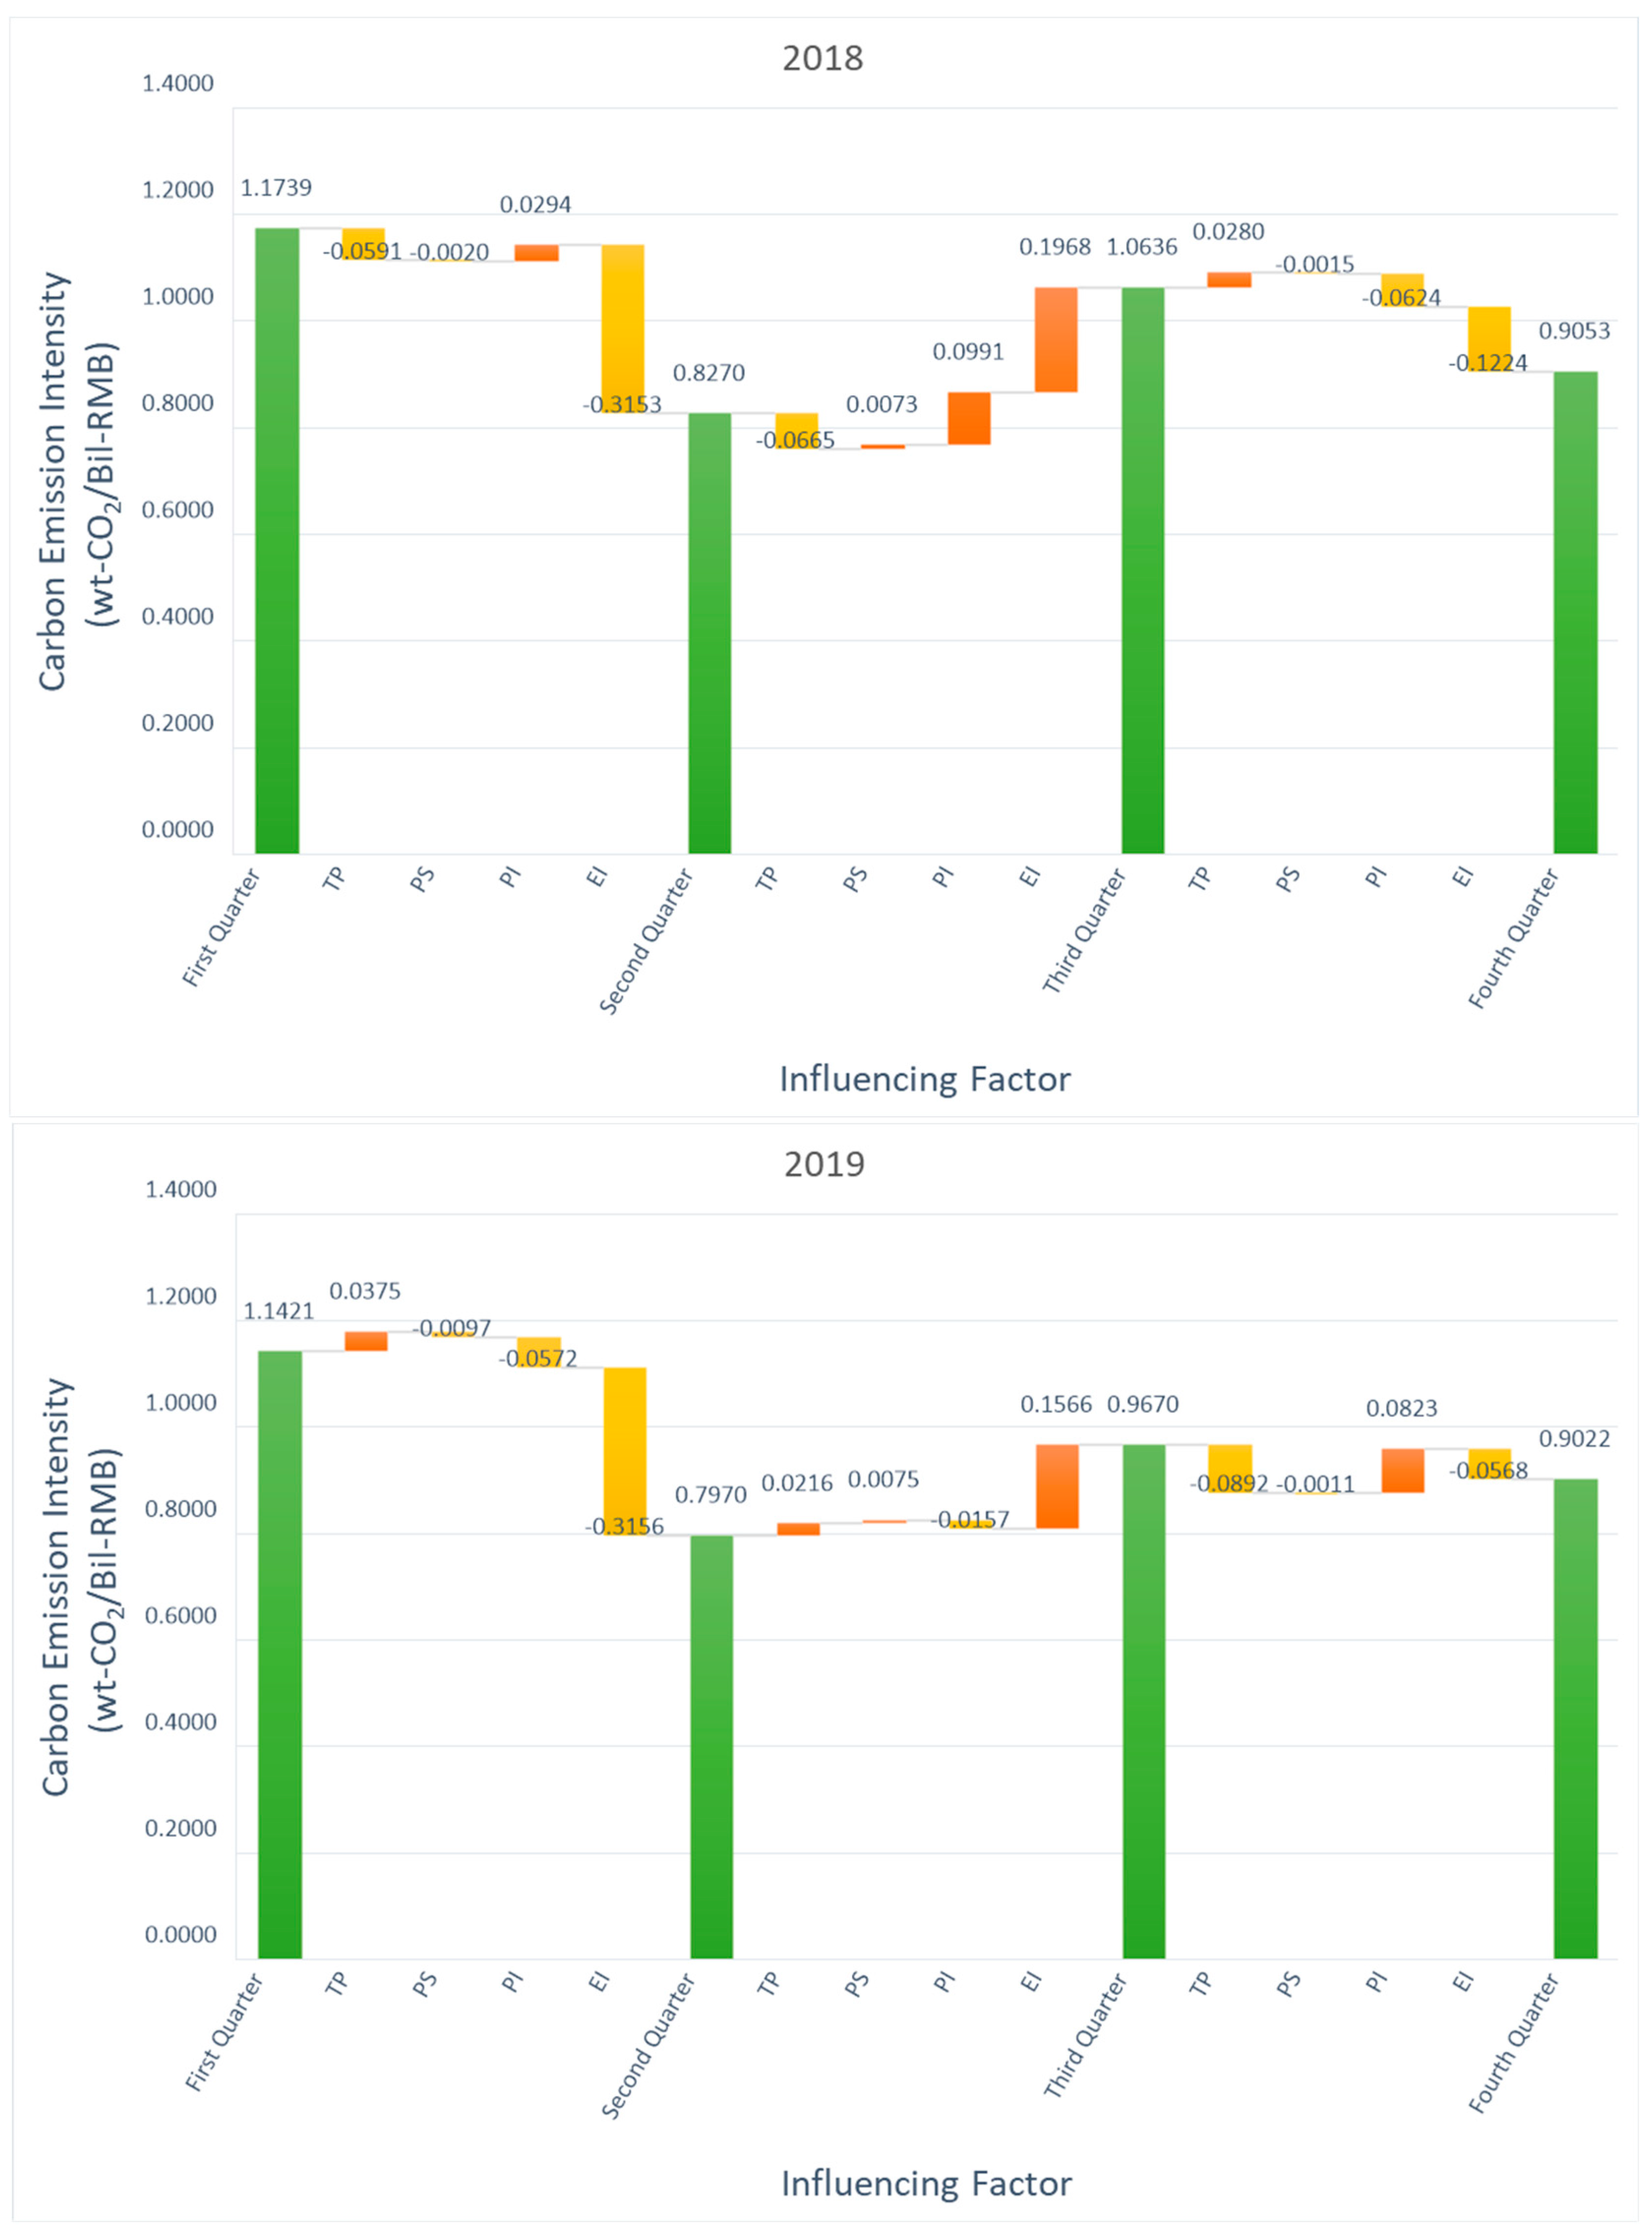
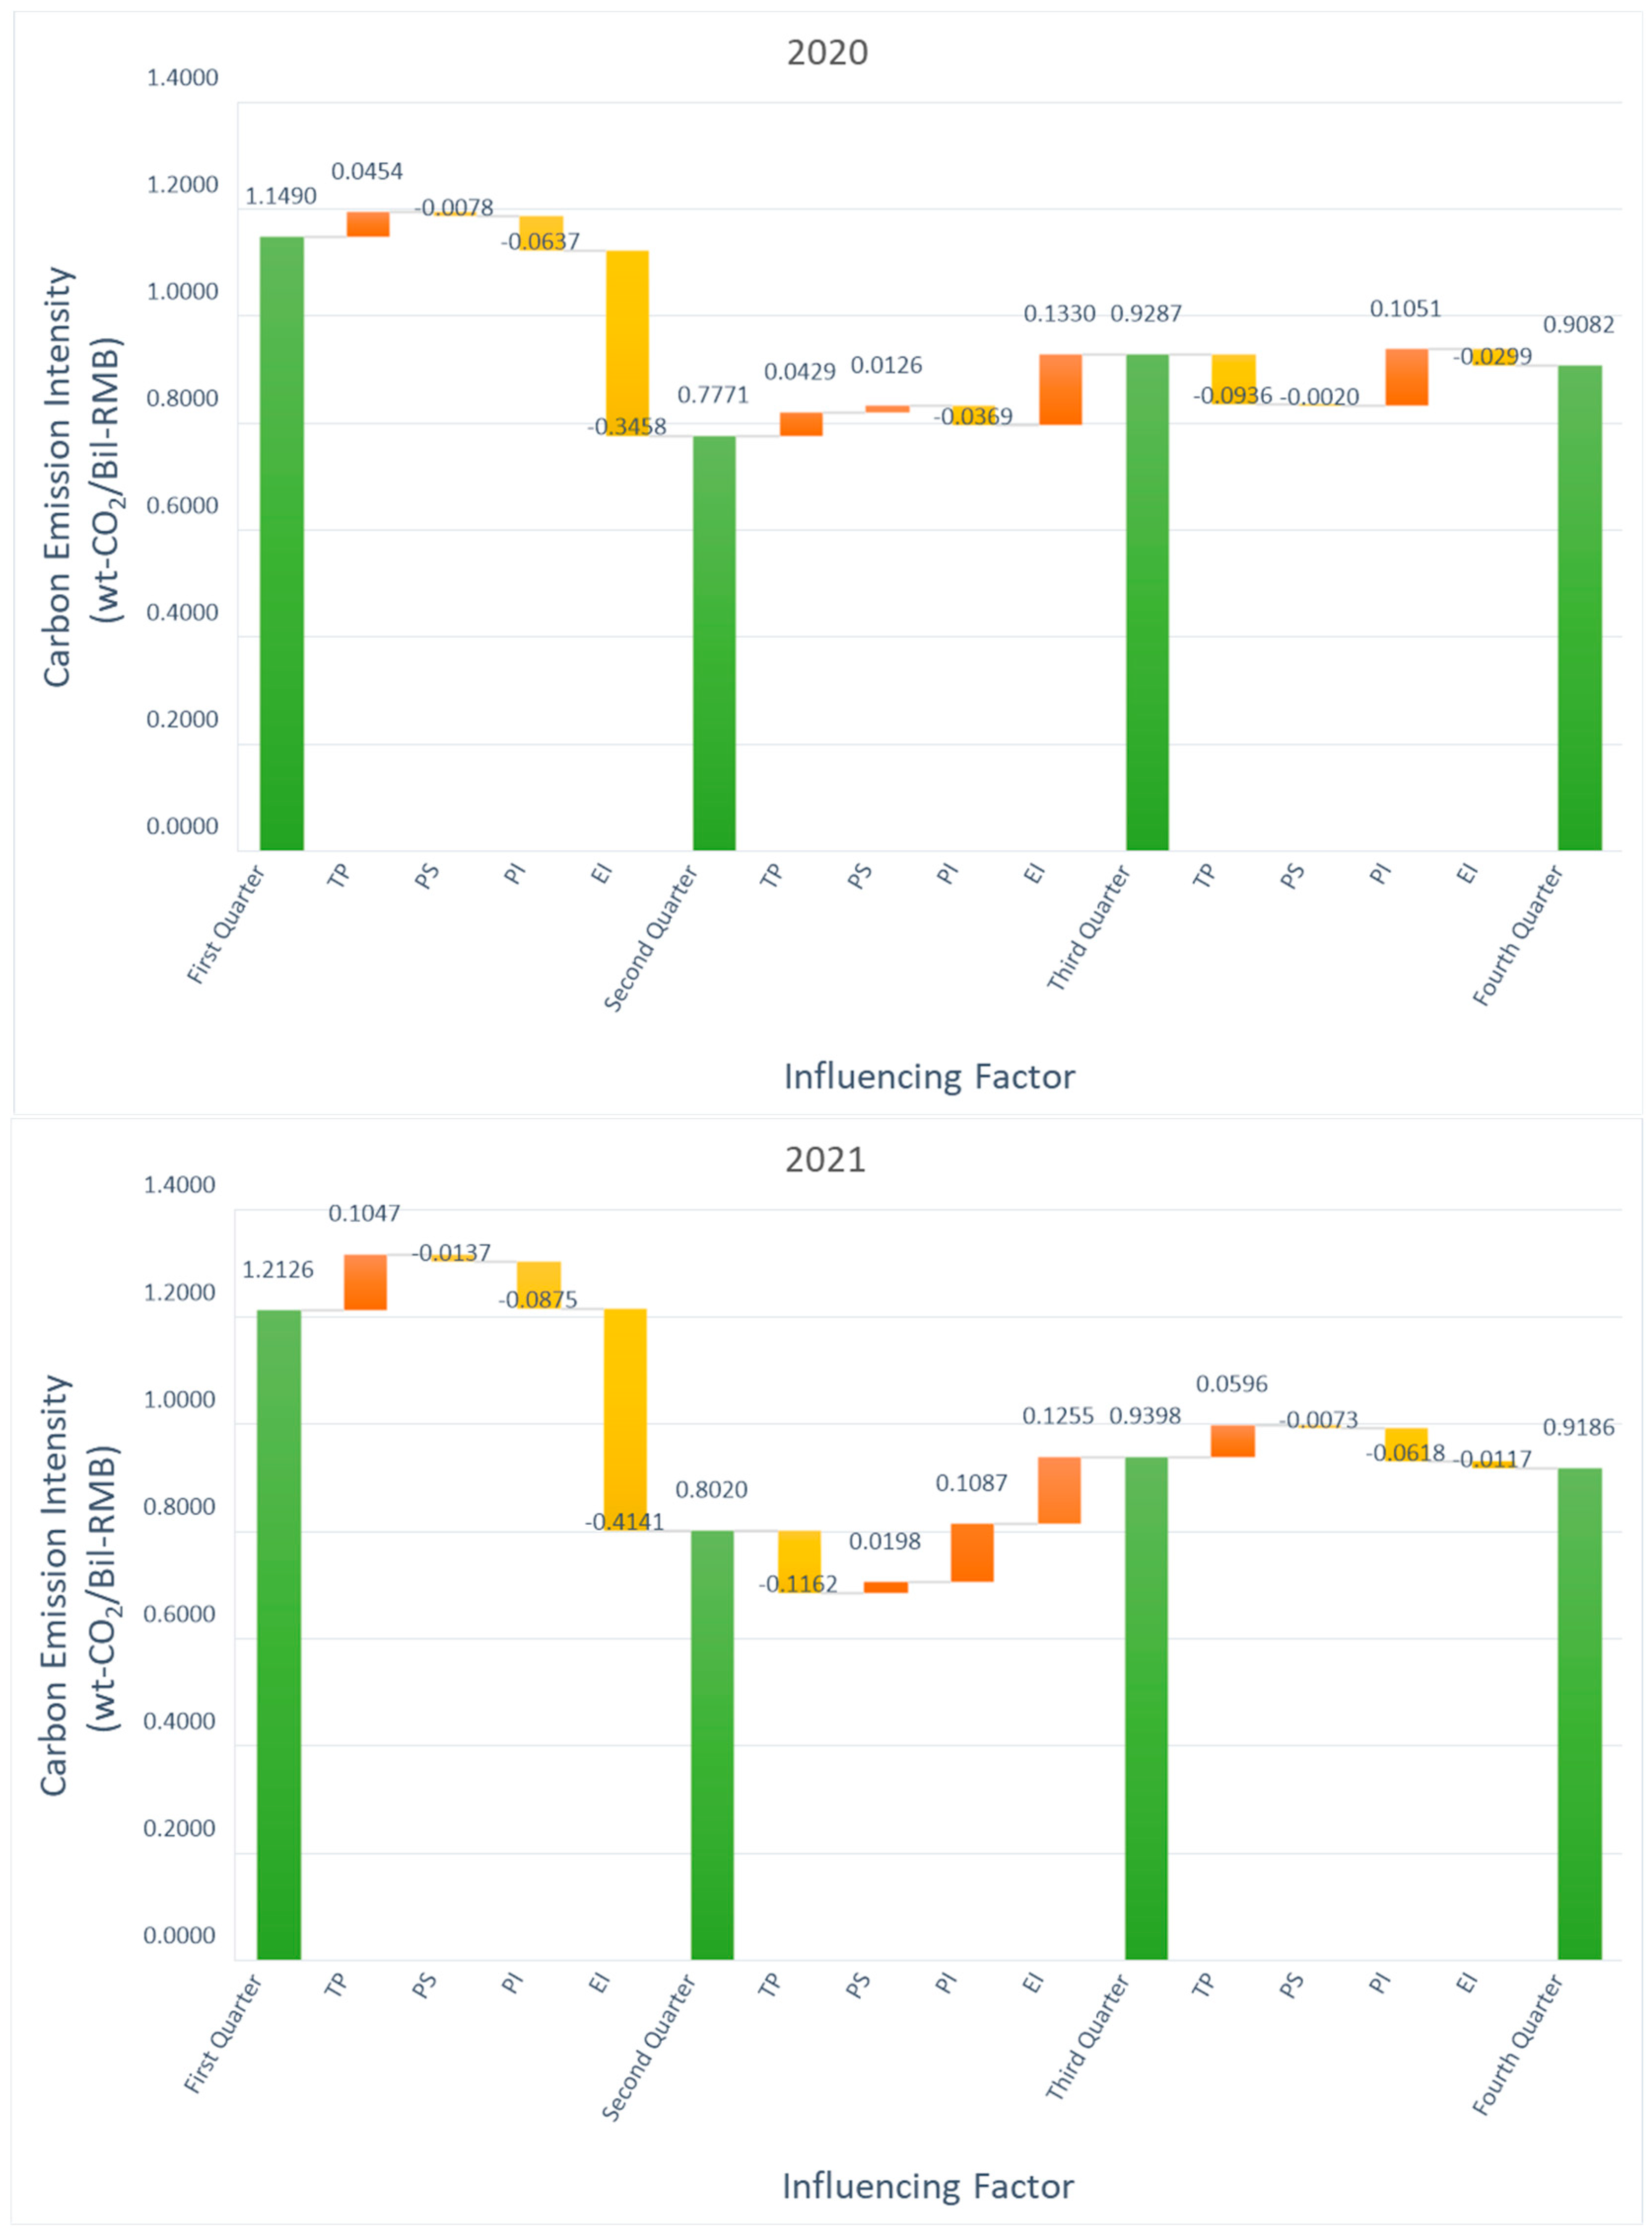
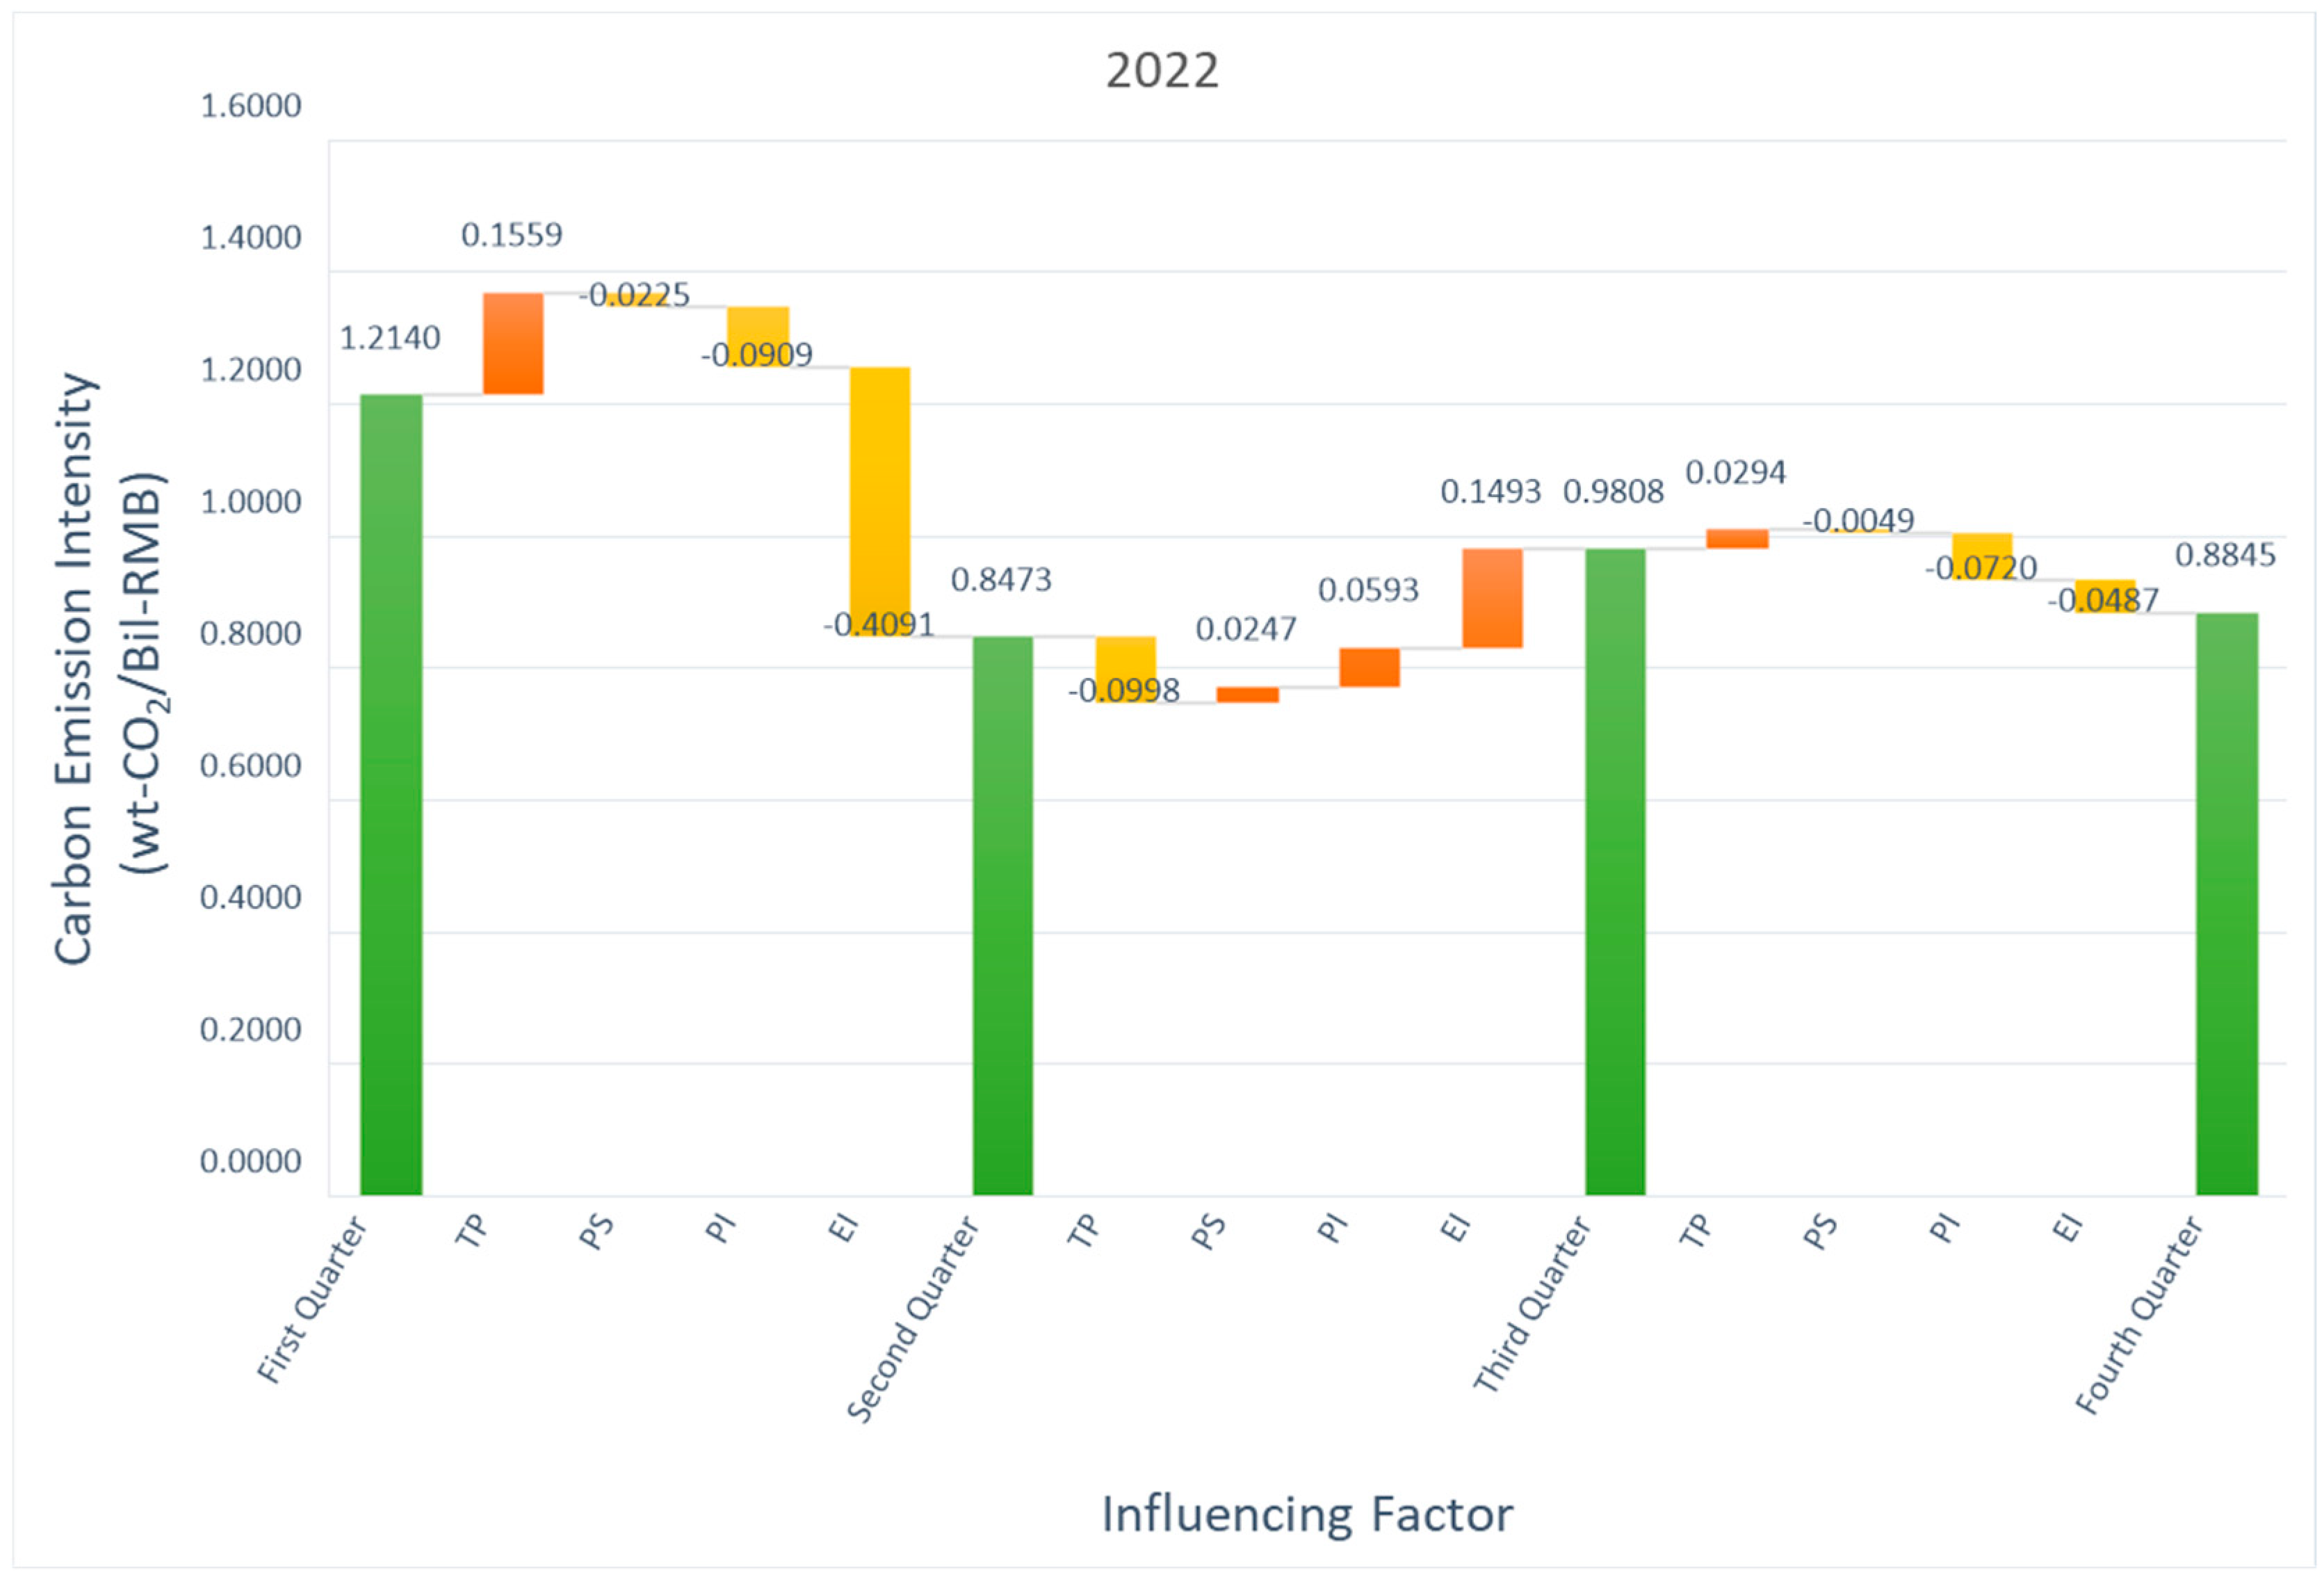
4.3.2. Intra-Annual Quarterly Changes and a Decomposition Analysis of the Carbon Emission Intensity Factors, 2012–2022

The decomposition analysis for the years 2012–2022 reveals significant insights into the quarterly changes in carbon emission intensity:
Seasonal Variations in Carbon Emission Intensity: As illustrated in Figure 2 above, the first quarter typically shows higher carbon emission intensities; for example, in 2012 the first quarter carbon emission intensity was 2.12 thousand tons per billion yuan, whereas the second quarter usually records the lowest annual values, with 1.50 thousand tons per billion yuan in 2012. These changes correlate with increased heating demands in winter and moderate spring temperatures, leading to relatively lower heating and cooling needs. Moving into the third quarter, there is an uptick in the carbon emission intensity, such as 1.66 thousand tons per billion yuan in 2012, associated with increased cooling demands during summer. The fourth quarter carbon emission intensity, for instance, 1.56 thousand tons per billion yuan in 2012, typically falls between the first and third quarters as autumn temperatures decrease and heating demands start to rise. Based on the analysis of Tianjin’s quarterly electricity consumption data from 2012 to 2022, it was found that during the study period, the average electricity consumption in the second quarter was 3.74%, 15.21%, and 11.12% lower than that in the first, third, and fourth quarters, respectively. These statistical findings support the results of this study.
The following impacts of various effects of carbon emission intensity changes from the analysis of the results shown in Figure 10 are given:
The Thermal Power Emission Effect: This effect is most pronounced from the third to the fourth quarter, where, for example, in 2012, the contribution from the thermal power emission effect was 0.0893 due to increased heating demands driving up power generation in autumn and winter.
The Power Source Structure Effect: The changes in this effect are relatively subtle across quarters, indicating a relatively stable power source structure in Tianjin over these years.
The Power Intensity Effect: This effect is particularly evident from the second to the third quarter, likely reflecting changes in electricity use efficiency during the summer.
The Economic Intensity Effect: This effect shows a significant impact from the first to the second quarter, for example, in 2012, where the contribution was −0.577988, reflecting reduced economic activities in spring impacting the carbon emission intensity.
In summary, the intra-annual variations in carbon emission intensity in Tianjin are influenced by seasonal factors, with the thermal power emission effect, the power intensity effect, and economic intensity effect playing significant roles in these variations. Among these, the economic intensity effect has the greatest impact on the carbon emission intensity, while the power source structure effect has a relatively minor impact, likely due to the stability of the power source structure over these years.

5. Conclusions and Recommendations

5.1. Conclusions

This study has conducted a detailed analysis of the seasonal variations and main influencing factors of carbon emission intensity in Tianjin from 2012 to 2022. It was found that the carbon emission intensity in Tianjin exhibits significant seasonal differences, with the highest levels in the first quarter (1.4093), the lowest in the second quarter (1.0019), and moderate levels in the third (1.1818) and fourth (1.0658) quarters. These seasonal fluctuations are influenced by a combination of factors, including the effects of thermal power emissions, electricity intensity, and economic activity. Economic growth has been identified as a core driver of changes in carbon emission intensity, particularly impacting the second quarter significantly (−0.0374). The effects of thermal power emissions and electricity usage intensity have noticeable impacts on carbon emission intensity in certain seasons, while the influence of the power source structure is relatively smaller and more stable.
The effect of thermal power emissions is especially pronounced from the third to the fourth quarter (0.0338), likely related to increased heating demands in autumn and winter. Changes in electricity intensity are significant from the second to the third quarter (0.0420), possibly due to seasonal adjustments in electricity use efficiency. The significant changes in economic intensity from the first to the second quarter (−0.3900) likely reflect the impact of a slowdown in economic activities on carbon emission intensity during spring.

5.2. Recommendations

Based on the analysis of the seasonal changes and influencing factors of carbon emission intensity in Tianjin from 2012 to 2022, the following targeted policy recommendations are proposed to support the development of more effective carbon reduction strategies in Tianjin:
(1)
Seasonal Management Strategies: Develop management strategies tailored to different seasons based on the identified seasonal variations. For example, focus on the impacts of slowed economic activities in the first quarter and promote the application of clean energy during the heating season to reduce carbon emissions from thermal power.
(2)
Optimize the Energy Structure: Considering the significant impact of thermal power emission effects on seasonal changes in carbon emissions, it is recommended that the government advances the optimization of the energy structure. This includes increasing the share of clean energy and reducing reliance on thermal power to effectively lower the carbon emission intensity.
(3)
Enhance Energy Efficiency: By increasing the negative contribution of power intensity effects, i.e., enhancing energy efficiency, the carbon emission intensity can be effectively reduced. The government should incentivize businesses and residents to adopt energy-saving technologies and equipment and promote advanced energy management systems.
(4)
Manage Seasonal Energy Demands: Given the impact of seasonal factors on carbon emission intensity, the government is advised to develop corresponding energy demand management measures. This policy should encourage the use of clean energy during peak carbon emission seasons.
(5)
Promote Economic Structural Transformation: Analysis of the economic intensity effects suggests that the government should facilitate a transition towards a low-carbon, high-efficiency economic model, develop green industries and a circular economy, and promote sustainable development.
(6)
Strengthen Carbon Emission Monitoring and Management: It is recommended to establish and improve a carbon emission monitoring system, regularly publish carbon emission intensity reports, and provide solid data support for policy-making and adjustments. Additionally, overall carbon emission management should be strengthened through mechanisms such as carbon trading and carbon taxes, incentivizing businesses and individuals to reduce emissions and achieve carbon reduction goals.
(7)
Encourage Community Involvement and Educational Campaigns: Encourage active participation from all sectors of society in carbon reduction efforts and enhance public awareness and understanding of carbon emission issues. The government could guide residents and businesses to adopt energy-saving and emission reduction measures through public education and awareness campaigns, collectively working to reduce carbon emissions.
Future research should further investigate other potential factors affecting carbon emission intensity, such as changes in industrial structure, the evolution of transport modes, and climate change. Given the ongoing pursuit of low-carbon development and carbon neutrality goals in Tianjin and globally, future studies should also explore the long-term trends in carbon emission intensity, reduction potentials, and policy and technological innovations that promote reductions. Through comprehensive and in-depth analysis and research, a more solid theoretical foundation and practical guidance can be provided for developing scientific and effective carbon reduction strategies and achieving the sustainable development goals in Tianjin and broader regions.

Supplementary Materials

The following supporting information can be downloaded at https://www.mdpi.com/article/10.3390/atmos15080947/s1, Table S1: Detailed Comparison of Index Decomposition Analysis Methods.

Author Contributions

Data curation, Y.W.; methodology, Y.Z.; project administration, J.B. and T.X.; supervision, J.W.; writing—original draft, Y.L.; writing—review and editing, Y.G. All authors have read and agreed to the published version of the manuscript.

Funding

This research was funded by the National Natural Science Foundation of China (72174097) and the Science and Technology Program of State Grid Tianjin Electric Power Company (DENK—R&D 2023-46).

Institutional Review Board Statement

Not applicable.

Informed Consent Statement

Not applicable.

Data Availability Statement

The original contributions presented in the study are included in the article, further inquiries can be directed to the State Grid Tianjin Electric Power Company.

Conflicts of Interest

The authors declare that this study received funding from the State Grid Tianjin Electric Power Company. The funder was not involved in the study design, collection, analysis, interpretation of data, the writing of this article or the decision to submit it for publication.

References

  1. Li, Z.-G.; Wang, J.; Che, S. Win-Win Development of Industrial Growth and Energy Conservation and Emission Reduction under the Constraint of Carbon Peaking in China. J. Environ. Econ. 2021, 6, 7–22. [Google Scholar] [CrossRef]
  2. Shi, Z.-T.; Qi, F. Steadily Advancing Energy Conservation and Carbon Reduction in the New Era. Red Flag Manuscr. 2023, 16, 29–32. [Google Scholar]
  3. Wu, Y.-Q.; Peng, Z.-S.; Ma, Q.-J. Study on the Factors Influencing Carbon Emission Intensity in the Yangtze River Delta Region. J. Liaoning Univ. Technol. (Soc. Sci. Ed.) 2023, 25, 28–34. [Google Scholar]
  4. Peng, C. Study on the Intensity of Industrial Carbon Emissions, Influencing Factors, and Countermeasures in Guiyang City. J. Guizhou Univ. Commer. 2022, 35, 59–70. [Google Scholar]
  5. Xia, Y.-S.; Sun, L.-X.; Feng, C. What causes spatial inequalities of low-carbon development in China’s transport sector? A newly proposed meta-frontier DEA-based decomposition approach. Socio-Econ. Plan. Sci. 2022, 80, 101151. [Google Scholar] [CrossRef]
  6. Zhao, J.; Liu, Q. Examining the Driving Factors of Urban Residential Carbon Intensity Using the LMDI Method: Evidence from China’s County-Level Cities. Int. J. Environ. Res. Public Health 2021, 18, 3929. [Google Scholar] [CrossRef]
  7. Wang, M.-K.; Bai, Y.-P. Decomposition Study of Carbon Emission Intensity Factors in Jiangsu Province Based on the LMDI Model. J. Ningxia Univ. (Nat. Sci. Ed.) 2022, 43, 109–114. [Google Scholar]
  8. Wang, K.; Tang, X.-H.; Gan, C.; Liu, H.-L. Spatial and Temporal Patterns and Influencing Factors of Carbon Emission Intensity in China’s Service Sector. China Popul. Resour. Environ. 2021, 31, 23–31. [Google Scholar]
  9. Wang, Y.; Zheng, Y. Spatial effects of carbon emission intensity and regional development in China. Environ. Sci. Pollut. Res. 2021, 28, 14131–14143. [Google Scholar] [CrossRef]
  10. Li, H.; Li, B.; Liu, H.; Zhao, H.; Wang, Y. Spatial distribution and convergence of provincial carbon intensity in China and its influencing factors: A spatial panel analysis from 2000 to 2017. Environ. Sci. Pollut. Res. 2021, 28, 54575–54593. [Google Scholar] [CrossRef]
  11. Hou, X.-N.; Cui, Y.-B. Statistical Measurement of Factors Affecting China’s Carbon Emission Intensity. Contemp. Econ. 2023, 40, 48–54. [Google Scholar]
  12. Waheed, R. The Significance of Energy Factors, Green Economic Indicators, Blue Economic Aspects towards Carbon Intensity: A Study of Saudi Vision 2030. Sustainability 2022, 14, 6893. [Google Scholar] [CrossRef]
  13. Zhang, C.; Zhou, B.; Wang, Q. Effect of China’s western development strategy on carbon intensity. J. Clean. Prod. 2019, 215, 1170–1179. [Google Scholar] [CrossRef]
  14. Sun, W.; Huang, C. Predictions of carbon emission intensity based on factor analysis and an improved extreme learning machine from the perspective of carbon emission efficiency. J. Clean. Prod. 2022, 338, 130414. [Google Scholar] [CrossRef]
  15. Mao, Y. Configurational conditions of national carbon intensity: A fuzzy set analysis of 136 countries. Environ. Sci. Pollut. Res. 2019, 26, 32446–32459. [Google Scholar] [CrossRef] [PubMed]
  16. Zheng, X.; Yu, H.; Yang, L. Factor Mobility, Industrial Transfer and Industrial Carbon Emission: A Spatial Matching Perspective. Front. Environ. Sci. 2022, 10, 822811. [Google Scholar] [CrossRef]
  17. Chen, T.; Li, X.-Y.; Chen, B. Decomposition and Peak Prediction Study of Factors Affecting China’s Carbon Emissions. J. Saf. Environ. 2024, 24, 396–406. [Google Scholar] [CrossRef]
  18. Li, W.; Meng, P.-Z.; Li, C.-D.; Yan, Z.-G. Analysis of Factors Affecting Carbon Emissions from Agricultural Production in Gansu Province and Emission Reduction Pathways Based on the LMDI Model. Crop Mag. 2023, 05, 264–271. [Google Scholar] [CrossRef]
  19. Fu, Y.-P.; Ma, S.-C.; Song, Q.; Gao, J. Study on the Decomposition of Carbon Emission Influencing Factors in China Based on LMDI. Pract. Underst. Math. 2019, 49, 7–17. [Google Scholar]
  20. Li, X.-M.; Ye, H.-J. Decomposition Study of Factors Influencing Carbon Emissions by Industry in China. Ecol. Econ. 2015, 31, 55–59+84. [Google Scholar]
  21. Lü, Z.-C.; Liu, Y.; Li, J.-R.; Guo, X.-M. Accounting and Analysis of Factors Affecting Energy Consumption Carbon Emissions in Hebei Province Based on LMDI. Environ. Ecol. 2023, 5, 74–78+87. [Google Scholar]
  22. Li, W.-H.; Li, Z.-G.; Yu, G.-H.; Liu, X.-Z.; Fu, L.-J. Analysis of Factors Influencing Carbon Emission Intensity in Hunan Province Based on LMDI Method. J. Chin. Acad. Environ. Manag. 2018, 28, 50–54. [Google Scholar] [CrossRef]
  23. Wang, Z.-L.; Wang, D.-D.; Qiu, S.-L. Decomposition Study of Industrial Carbon Emission Intensity Factors. Pract. Underst. Math. 2023, 53, 21–35. [Google Scholar]
  24. Chen, L.; Zhang, N.; Wang, Y.-F.; Hu, W.-T. Drivers and Attribution Analysis of Carbon Emission Intensity Changes in the Beijing-Tianjin-Hebei Region—From the Perspective of Subsectors and Five-Year Plans. China Environ. Sci. 2024, 08, 1–17. [Google Scholar] [CrossRef]
  25. Liu, J.; Ding, X. LMDI Factor Decomposition Model Study of China’s Carbon Emission Intensity—From the Perspective of Industrial Development. J. Shandong Inst. Bus. Technol. 2020, 34, 37–47. [Google Scholar]
  26. Sun, J.-S. Empirical Study on the Driving Factors of Carbon Emission Intensity in China. J. Guizhou Univ. Financ. Econ. 2011, 3, 1–6. [Google Scholar]
  27. Liang, J.; Shi, A.-N.; Zhu, H.-J. Analysis of Trends and Influencing Factors of Carbon Emission Intensity in Jiangsu Province. Nanjing Soc. Sci. 2013, 5, 143–148. [Google Scholar] [CrossRef]
  28. Wang, Y.-X.; Huang, H.-Q.; Chen, Y.; Dong, M.-Q.; Li, S.-W.; Yue, S.-J.; Lu, Z.-W. Analysis of Driving Factors of Carbon Emissions from Electric Power Consumption in China Based on the LMDI Decomposition Method. J. Hubei Univ. Econ. (Humanit. Soc. Sci.) 2023, 20, 38–44. [Google Scholar]
  29. Ma, J.-J. Who shapes the embodied carbon dioxide emissions of interconnected power grids in China? A seasonal perspective. J. Environ. Manag. 2022, 324, 116422. [Google Scholar] [CrossRef]
  30. Yang, P.-B.; Wang, Y.; Ma, X.-Y. Scientific Evaluation of Pollution Reduction and Carbon Reduction to Improve Pollution Control Levels. State Grid News, 23 February 2023; 5. [Google Scholar]
Figure 1. (a) displays the trends in annual carbon emission intensity, total carbon emissions, and GDP for Tianjin from 2012 to 2022; (b) shows the changes in the industrial structure proportions in Tianjin from 2012 to 2022 (Primary industry involves the extraction and initial processing of natural resources, such as agriculture, fishing, and mining. Secondary industry involves the processing and manufacturing of raw materials, such as manufacturing and construction. Tertiary industry provides services to other industries and consumers, including finance, education, healthcare, and retail).
Atmosphere 15 00947 g001aAtmosphere 15 00947 g001b
Figure 2. Illustrates the trends in quarterly carbon emission intensity in Tianjin from 2012 to 2022, comparing each quarter.
Atmosphere 15 00947 g002
Figure 3. Shows the annual versus quarterly carbon emission intensity trends for the same period.
Atmosphere 15 00947 g003
Figure 4. Displays the trends in quarterly carbon emission intensity, total carbon emissions, and GDP changes from 2012 to 2022.
Atmosphere 15 00947 g004aAtmosphere 15 00947 g004bAtmosphere 15 00947 g004cAtmosphere 15 00947 g004d
Figure 5. Presents the quarterly industrial structure proportions in Tianjin from 2018 to 2022.
Atmosphere 15 00947 g005
Figure 6. Shows a waterfall chart of the contributions to changes in carbon emission intensity in Tianjin’s first quarter from 2012 to 2022.
Atmosphere 15 00947 g006
Figure 7. Depicts a waterfall chart of the contributions to the changes in carbon emission intensity in Tianjin’s second quarter from 2012 to 2022.
Atmosphere 15 00947 g007
Figure 8. Displays a waterfall chart of the contributions to changes in carbon emission intensity in Tianjin’s third quarter from 2012 to 2022.
Atmosphere 15 00947 g008
Figure 9. Displays a waterfall chart of the contributions to changes in carbon emission intensity in Tianjin’s fourth quarter from 2012 to 2022.
Atmosphere 15 00947 g009
Figure 10. Shows waterfall charts of the contributions to the intra-annual quarterly changes in carbon emission intensity in Tianjin from 2012 to 2022.
Atmosphere 15 00947 g010aAtmosphere 15 00947 g010bAtmosphere 15 00947 g010cAtmosphere 15 00947 g010dAtmosphere 15 00947 g010eAtmosphere 15 00947 g010f
Table 1. Presents the corresponding indicators for the factors influencing carbon emission intensity.
Influencing FactorCodeFactorDescription
Thermal Power Emission EffectTP C E P Reflects the amount of carbon emissions per unit of electricity generated by thermal power. It measures the carbon emission efficiency of the thermal power generation process, indicating the impact of the technology and fuel type used in thermal power on carbon emissions. An improvement in this value indicates enhanced carbon efficiency in thermal power generation.
Power Source Structure EffectPS E P E T Measures the proportion of thermal power in the total power generation. It reflects the impact of the energy structure on carbon emissions, particularly the share of thermal power (primarily coal, natural gas, and other fossil fuels) in the energy mix. A decrease in this proportion suggests an increased share of non-fossil sources (such as hydro, wind, or solar) in total power generation, aiding in reductions in carbon intensity.
Power Intensity EffectPI E T E U Reflects the efficiency of the power supply system, i.e., the total power generation required per unit of electricity consumed. It can indicate power grid losses and the efficiency of the power system. A reduction in this value denotes improved power system efficiency, with reduced electricity loss during transmission and distribution, thereby aiding in carbon reduction.
Economic Intensity EffectEI E U G Measures the amount of electricity consumed per unit of GDP produced, reflecting the energy efficiency of economic activities. A decline in this value indicates that the growth in electricity consumption is slowing relative to economic growth, suggesting a shift towards a low-carbon, high-efficiency economic model.
Disclaimer/Publisher’s Note: The statements, opinions and data contained in all publications are solely those of the individual author(s) and contributor(s) and not of MDPI and/or the editor(s). MDPI and/or the editor(s) disclaim responsibility for any injury to people or property resulting from any ideas, methods, instructions or products referred to in the content.

