Article

Atmospheric Conditions Related to Extreme Heat and Human Comfort in the City of Rio de Janeiro (Brazil) during the First Quarter of the Year 2024

by
Ayobami Badiru Moreira
1,*,
Lucas Suassuna de Albuquerque Wanderley
2,
Cristiana Coutinho Duarte
3 and
Andreas Matzarakis
1,4
1
Chair of Environmental Meteorology, Faculty of Environment and Natural Resources, University of Freiburg, 79085 Freiburg im Breisgau, Germany
2
Federal Institute of Education, Sciences and Technology of Alagoas, Coruripe 57230-000, Brazil
3
Department of Geography, Federal University of Pernambuco, Recife 50670-901, Brazil
4
Democritus University of Thrace, GR-69100 Komotini, Greece
*
Author to whom correspondence should be addressed.
Atmosphere 2024, 15(8), 973; https://doi.org/10.3390/atmos15080973
Submission received: 26 June 2024 / Revised: 9 August 2024 / Accepted: 10 August 2024 / Published: 14 August 2024
(This article belongs to the Special Issue Urban Heat Islands, Global Warming and Effects)

Abstract

:
This study aims to investigate the atmospheric conditions and human thermal comfort related to extreme heat in Rio de Janeiro during the first quarter of 2024. The dataset includes meteorological data from the A636-Jacarepaguá station of INMET and seven stations from the Alerta Rio system. Weather types were classified using principal components analysis (PCA) and cluster analysis (CA). Additionally, three thermal comfort indices were calculated: the heat index (HI), physiologically equivalent temperature (PET), and modified PET (mPET). Five groups of surface weather types were identified, with two being more frequent and associated with extreme heat events. These two groups accounted for over 70% of the days in all months. Critical thermal sensation values were found, particularly at the Guaratiba station, where the daytime HI exceeded 60 °C, and at the Riocentro station, where the nighttime HI surpassed 40 °C. The HI showed a greater range and variability compared with the PET and mPET, highlighting the importance of investigating microclimatic factors which intensify urban heat in central and coastal areas and cause daytime overheating in more distant regions like Guaratiba. This study emphasizes the need for detailed investigation into microclimatic factors and their public health implications, especially in areas with high tourist activity and vulnerable populations.

1. Introduction

The increase in air temperatures resulting from urbanization and global climate change tends to exacerbate the negative effects of extreme heat in cities [1]. Extremely hot days can have adverse consequences for human health, increasing mortality rates from cardiovascular and respiratory diseases [2,3,4,5]. The year 2023 showed the highest historical global temperature anomalies, being nearly 1.5 °C above the pre-industrial period, resulting in the hottest summer on record [6].
This overheating was reflected in Brazil through consecutive heat waves which covered most of the country (from a continental extent) from August 2023 through the first quarter of 2024 [7]. The city of Rio de Janeiro (described in more detail in Section 2.1), located on the coast of the Southeast Region of Brazil and one of the main Brazilian cities, was particularly affected [7]. This city is historically known for its high temperature records [8], popularizing since the 1990s the expression “Rio 40 graus”, freely translated into English as “Rio 40 degrees”, referring to the high air temperatures recorded in the city.
Intense heat days are recurrent during the Brazilian summer [8]. In the major cities of southeastern Brazil, thermal indices tend to reach extremely high values when there is an expansion of hot and humid or hot and dry air of oceanic or continental origin [9]. On the hottest days, tropical or equatorial air masses interact with the continental surface, and the heat can be intensified by regional or local factors such as the wind direction, topography, and land cover [10,11]. In Rio de Janeiro, for example, the topography influences the formation of valley-mountain breezes at a regional level, which modifies the wind direction and adds complexities to the characterization of urban heat [9].
The first quarter of 2024 in Rio de Janeiro was marked by record-high air temperatures and alerts issued by the city government. The Alerta Rio system reported thermal sensations above 60 °C, which were internationally reported in the media as a record temperature in the city [12,13,14]. Such thermal sensation values were explored in the results of this study. Additionally, Rio de Janeiro faces complex socio-spatial issues which make its population particularly vulnerable to climate impacts [2]. These include increased notifications of respiratory and cardiovascular diseases, the spread of epidemic diseases (such as dengue, which occurs more frequently in the summer season), and impacts on the population’s mental health [2,15,16].
Thus, the present study aims to investigate atmospheric conditions and human thermal comfort related to extreme heat in the city of Rio de Janeiro during the first quarter of 2024. Understanding this issue at different scales, from synoptic to human thermal comfort, allows us to identify ways to support local and regional adaptation measures to heat vulnerability due to climate change.
The next section describes the methodology used for data collection and analysis, including the weather type classifications and the thermal comfort indices calculated. The heat index (HI) [17] was considered in this study as it is currently the index used by the municipal government of Rio de Janeiro to issue heat alerts, taking into account the influence of air temperature and relative humidity on human thermal perception. The physiologically equivalent temperature (PET) [18,19] and the modified physiologically equivalent temperature (mPET) [20] were also calculated because they consider a greater variety of biometeorological variables and are widely used in urban studies due to their ability to capture variations in urban microclimates. This is particularly relevant for the city of Rio de Janeiro, with its complex topography and diverse urban environments.
The results and discussions (Section 3 and Section 4, respectively) are presented while considering different atmospheric scales which influence extreme heat in Rio de Janeiro and the behavior of each thermal comfort index in relation to the existing atmospheric patterns, as well as the implications of our results and potential recommendations for policies and future research.

2. Materials and Methods
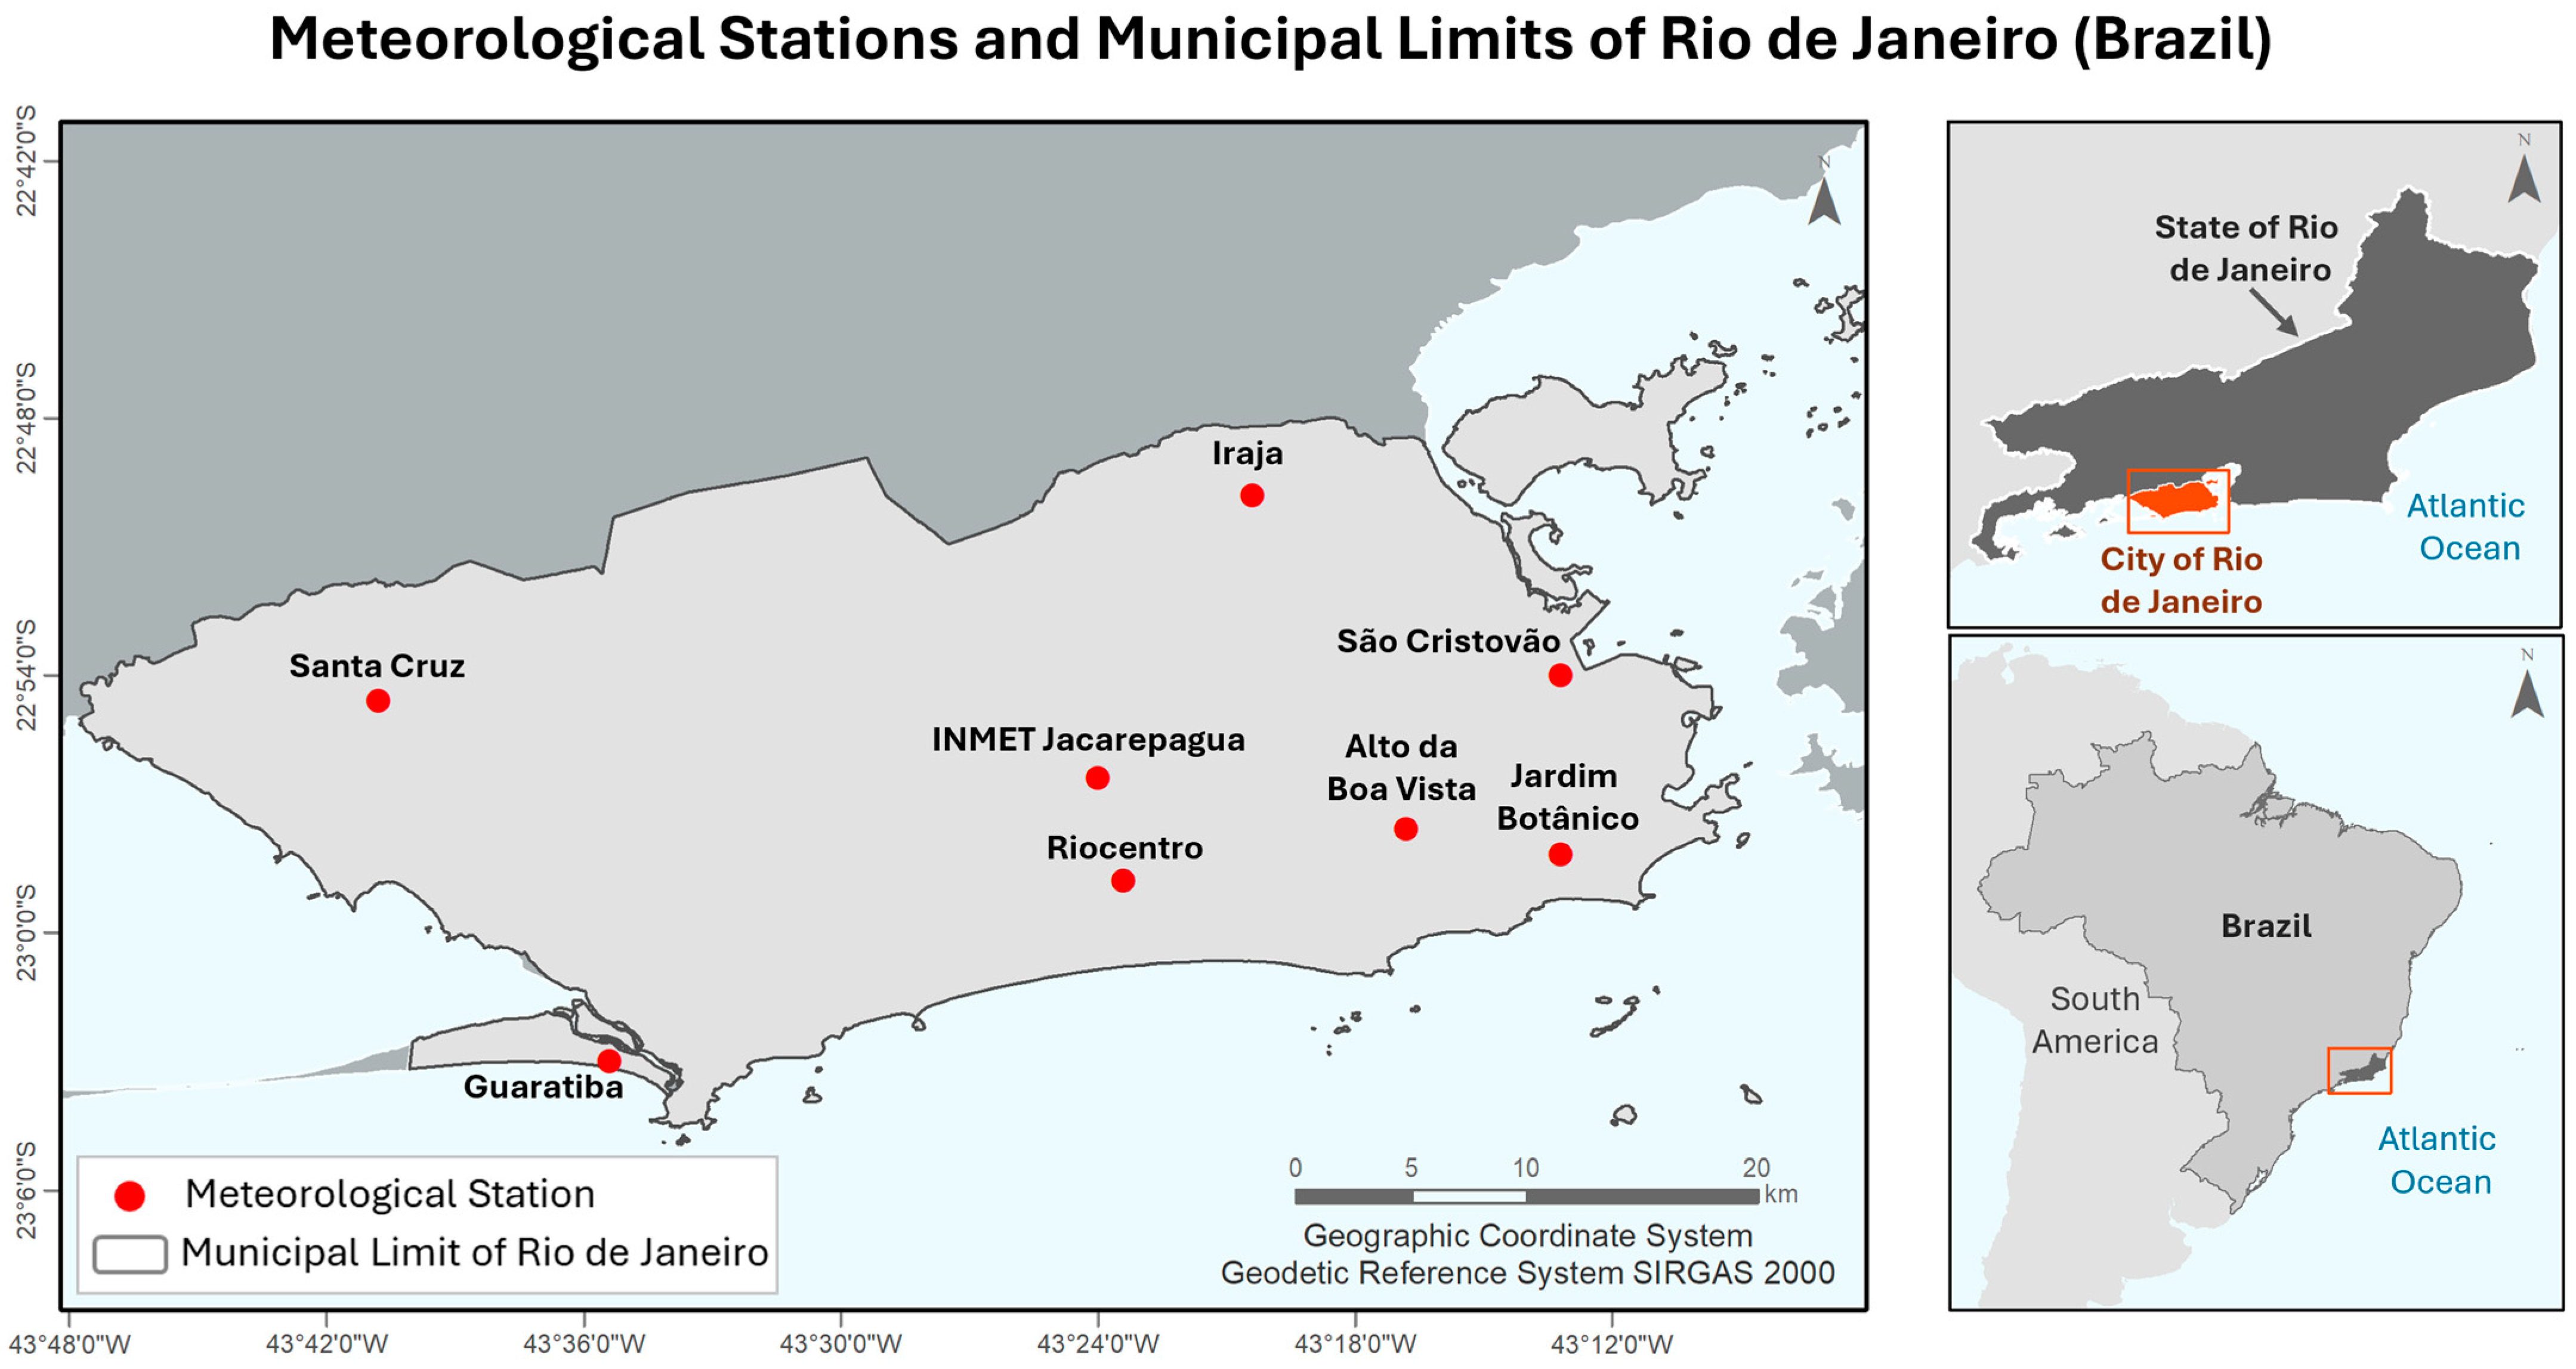
This section is structured with three main parts. Section 2.1, “Study Area”, describes the geographical and environmental characteristics of the research location. Section 2.2, “Datasets”, details the data sources, including the types and origins of the data utilized in the study; and Section 2.3, “Methodological Procedure”, presenting the steps employed to analyze the data and achieve the research objective.

2.1. Study Area

Rio de Janeiro is the principal city and capital of the state of Rio de Janeiro, Brazil. It is the second main city in Brazil and is located on the coast of the Southeast Region of this country. The city is characterized by the presence of hills and mountains, which are part of the Serra do Mar escarpment, in addition to the fluvial-marine plain at the lower altitudes of its territory. Its area comprises 1200.329 km2, with a population of approximately 6,211,223 inhabitants and a density of 5174.6 inhabitants per km2 [21].
It has a tropical humid climate, with rainfall concentrated in the summer season. Its average annual temperature is approximately 22 °C, and annual precipitation ranges between 1200 mm and 1800 mm, though it experiences high variability in both temperature and rainfall [21]. For the months under study, the climatological normal for the daily average air temperature is 30 °C (January and February) and 29 °C (March) [22]. Figure 1 depicts the location of the study area and the meteorological stations used in this research.

2.2. Datasets

The dataset used for this study refers to the first quarter of 2024 (from 1 January 2024 to 31 March 2024) and is composed of meteorological data (air temperature in degrees Celsius and relative humidity) from one automatic station INMET_Jacarepaguá (code: A636) of the National Institute of Meteorology (INMET), available at https://mapas.inmet.gov.br/#, accessed on 1 May 2020, and from seven meteorological stations from the Alerta Rio system, belonging to the Rio de Janeiro city government and available online at https://alertario.rio.rj.gov.br/download, accessed on 1 May 2020. The locations and respective names of the stations are presented in Figure 1.
The choice of stations for the study was based on data availability. As the Alerta Rio station network is part of the municipal government’s alert system, the locations of these stations were strategically selected to better understand the city’s microclimatic patterns. Additionally, the INMET_Jacarepaguá station belongs to the Brazilian network of meteorological stations (national level) and, therefore, was installed according to the specifications of the World Meteorological Organization (WMO). It provides a greater number of atmospheric variables essential for the analyses described in the next section. Additionally, synoptic charts from the Marine Hydrography Center of the Brazilian Navy [23], available in Supplementary Materials, were utilized to support the understanding of synoptic-scale atmospheric systems associated with extreme heat conditions.

2.3. Methodological Procedure

2.3.1. Analysis of Atmospheric Dynamics and Classification of Weather Types

The analysis of atmospheric dynamics for the study months was necessary to understand the large-scale atmospheric systems which interact with the local climate and, consequently, with the thermal indices. For this purpose, an analysis of the different weather types which occurred during the study period was conducted.
The hourly values of the air temperature, relative humidity, wind speed, solar radiation, atmospheric pressure, and precipitation from the A636-Jacarepaguá station were used as input data for the classification of weather types through principal component analysis (PCA) and cluster analysis in the free software InfoStat (https://www.infostat.com.ar/?lang=en, accessed on 1 May 2020).
The PCA aimed to select meteorological variables which showed the highest loads (weights) on components with an accumulated variance of at least 80% and to identify the relationships between the variables. The retained variables were then subjected to cluster analysis to assist in classifying weather types which exhibited similar variation patterns concerning surface meteorological data.
The average linkage hierarchical clustering method was applied to form groups of days with similar variations in surface data. The choice of this method of clustering was supported by a cophenetic correlation index, which demonstrated better performance when compared with the Ward and centroid methods [24,25,26]. For the average linkage method, the cophenetic correlation index was 0.75, while for the other methods, the index was under 0.6. Each resulting cluster of days was related to air masses which produced the corresponding weather types near the surface. The classification of air masses was completed subjectively based on the classic methods of synoptic climatology [27,28,29,30].
Synoptic charts and satellite images for the days of each group were analyzed. The air mass classification model was adapted from rhythmic analysis [29], which considers the existence of three atmospheric systems related to the origin of air masses in the southern and southeastern Brazil regions: (1) tropical and equatorial systems (tropical Atlantic air mass (Tam), tropical continental air mass (Tcm), and equatorial continental air mass (Ecm)); (2) polar systems (polar Atlantic air mass (Pam)); and (3) frontal systems (polar Atlantic front (Paf)).

2.3.2. Calculation and Analysis of Thermal Comfort Indices

This study calculated three different metrics for estimating the thermal comfort indices: the HI, PET, and mPET. The HI corresponds to the equation provided by the United States National Weather Service (NWS). These three indices over others, such as the universal thermal climate index (UTCI), were used to avoid extending the analysis to a wider variety of indices, focusing instead on comparing the one used by the municipal government of Rio de Janeiro to issue meteorological alerts (HI) with the PET and mPET, as they capture a broader range of biometeorological variables and are particularly well suited for analyzing microclimate variations in complex urban environments [20,31]. Still, we acknowledge the importance of other indices and encourage their investigation in further studies.
The Rothfusz regression equation [32] (Equation (1)) is the primary equation for this index and considers the effect of the relative humidity (RH (%)) and air temperature (T (°C)) on the perceived heat felt by a person. This equation also includes adjustments for weather conditions with an RH below 13% combined with a T between 26.7 and 44.4 °C (Equation (2)), as well as for weather conditions with an RH above 85% combined with a T between 26.7 and 30.5 °C (Equation (3)). Additionally, HI values are recalculated using Equation (4) when the Rothfusz regression equation [32] yields thermal sensation values below 26.7 °C. These equations were calculated in the Python 3.11 environment:
HI = −42.379 + 2.04901523 × T + 10.14333127 × RH − 0.22475541 × T × RH
− 0.00683783 × T × T − 0.05481717 × RH × RH + 0.00122874 × T × T × RH
+ 0.00085282 × T × RH × RH − 0.00000199 × T × T × RH × RH
Adjustment = [(13 − RH)/4] × SQRT{[17 − ABS (T − 95]/17}
Adjustment = [(RH − 85)/10] × [(87 − T)/5]
HI = 0.5 × {T + 61.0 + [(T − 68.0) × 1.2] + (RH × 0.094)}
The PET and mPET are widely used indices and consider a greater number of input variables, in addition to temperature and humidity. The PET is defined as the air temperature at which, in a typical indoor setting (without wind and solar radiation), the energy budget of the human body is balanced with the same core and skin temperature under the complex outdoor conditions to be assessed. The mPET is an adaptation of the PET which incorporates a wider range of biometeorological variables, including clothing and human activities [31].
Both the PET and mPET were calculated in the RayMan model [20,33] from hourly data of the following variables recorded by station A636, namely the air temperature (°C), relative humidity (%), wind velocity (m/s), and global radiation (W/m2) for the following parameters: height (1.75 m); weight (75 Kg); age (35 years); clothing (0.90 clo); and activity (80.0 W, sitting). In addition to the PET and mPET calculations in the RayMan model, the other equations (HI equations, as well as descriptive statistics of the meteorological data) and the resulting tables and graphs were implemented in a Python environment.

3. Results

3.1. Weather Types and Air Masses

Four selected components presented 87% of the accumulated variance, and their atmospheric variables with the highest loadings were selected for cluster analysis. Table 1 presents the variables selected, which were the average temperature (aT), maximum temperature (mT), average dew point (aDP), minimum dew point (minDP), average atmospheric pressure (aP), maximum atmospheric pressure (maxP), minimum atmospheric pressure (minP), maximum relative humidity (maxRH), average wind speed (aWS), and daily rainfall (R). As a selection criterion, loads equal to or greater than 0.4 were retained for cluster analysis, and they are presented in Table 1.
Five groups of surface weather types were formed for the cluster analysis according to the subjective method of dendrogram analysis. Table 2 presents the five clusters and their respective atmospheric variables and confidence intervals. Synoptic charts related these groups are available in the Supplementary Materials, and they were the basis for explaining the synoptic patterns related to the meteorological characteristics of the weather types presented in Table 2.
The first group (G1) accounted for 6.6% of the weather types. It was associated with stable atmospheric conditions, high daily average temperatures, and high moisture availability. Based on the analysis of the synoptic charts for G1, it can be observed that the synoptic patterns in this group were related to the dominance of tropical oceanic or continental air masses, resulting from the advance of a subtropical anticyclone from the Atlantic Ocean.
The second group (G2) represented 4.4% of the data series and was associated with the maximum atmospheric instability on hot and humid days. The high daily rainfall volumes were conditioned by the advance of cold fronts over the domain of the tropical Atlantic air mass. G3 represented 3.3% of the data series and was associated with unstable weather types. The daily average temperature values were moderate compared with the other groups. On the days comprising this group, the development of meteorological troughs occurred within the isobars of the semi-permanent Atlantic anticyclone under the domain of the tropical Atlantic air mass.
G4 had the most observed weather types over the analyzed period, accounting for 51.6% of the study’s time frame, while G5 had the second most observed ones, with a frequency of 34.1%. These groups presented greater similarities in the behavior of meteorological variables and were associated with the highest values for the maximum temperatures. They differed in terms of the variation intervals for atmospheric pressure (Pm, Pmax, and Pmin), with lower values recorded in G5. The pressure difference reflects distinct synoptic conditions, as the weather types in G4 were related to anticyclonic conditions of an oceanic origin, whereas G5 was associated with the advancement of continental air masses.
The days grouped in G4 exhibited weather types related to the influence of the South Atlantic Subtropical High (SASH) through the tropical Atlantic air mass. On stable days, the advance of the tropical Atlantic air mass (Ta) or modified tropical Atlantic air mass was observed during hot or extremely hot days. It is noteworthy that for the hottest days in G4, the presence of the modified tropical Atlantic air mass was identified, with the advancement of anticyclonic isobars over the continent.
In weather patterns of weak or moderate instability, transient synoptic conditions were observed, including the development of troughs, the formation of fronts, or the South Atlantic Convergence Zone (SACZ) advancing over the SASH. To a lesser extent, a transient situation between the continental humid air of the equatorial continental air mass (Ec) and the stable oceanic air of the tropical Atlantic mass was also observed.
G5 represented the weather type most frequently associated with extremely hot days. The synoptic conditions linked to these weather types were characterized by the eastward displacement of the South Atlantic Subtropical High (SASH) and the expansion of hot continental air over the city of Rio de Janeiro. It is noteworthy that the days in G5 exhibited variable atmospheric instability, recording both hot and humid days with rainfall (32%) and hot and stable days (68%).
The observed instability conditions were related to the influence of the equatorial continental air mass (Ec), the frontal advance over the Ec, and the formation of troughs with the intrusion of continental air into the domain of the tropical Atlantic air mass (Ta). The atmosphere showed stability under the influence of the tropical continental air mass (Tc) due to the expansion of dry continental air. Low minimum relative humidity values (<50%) were observed on 32% of the days in G5.
The analysis of weather types and air masses indicated that intense heat days were predominantly associated with the expansion of continental air (about 40%), whether dry or wet, and with the advance of the modified tropical Atlantic air mass (about 60%) as it interacted with the continental surface.

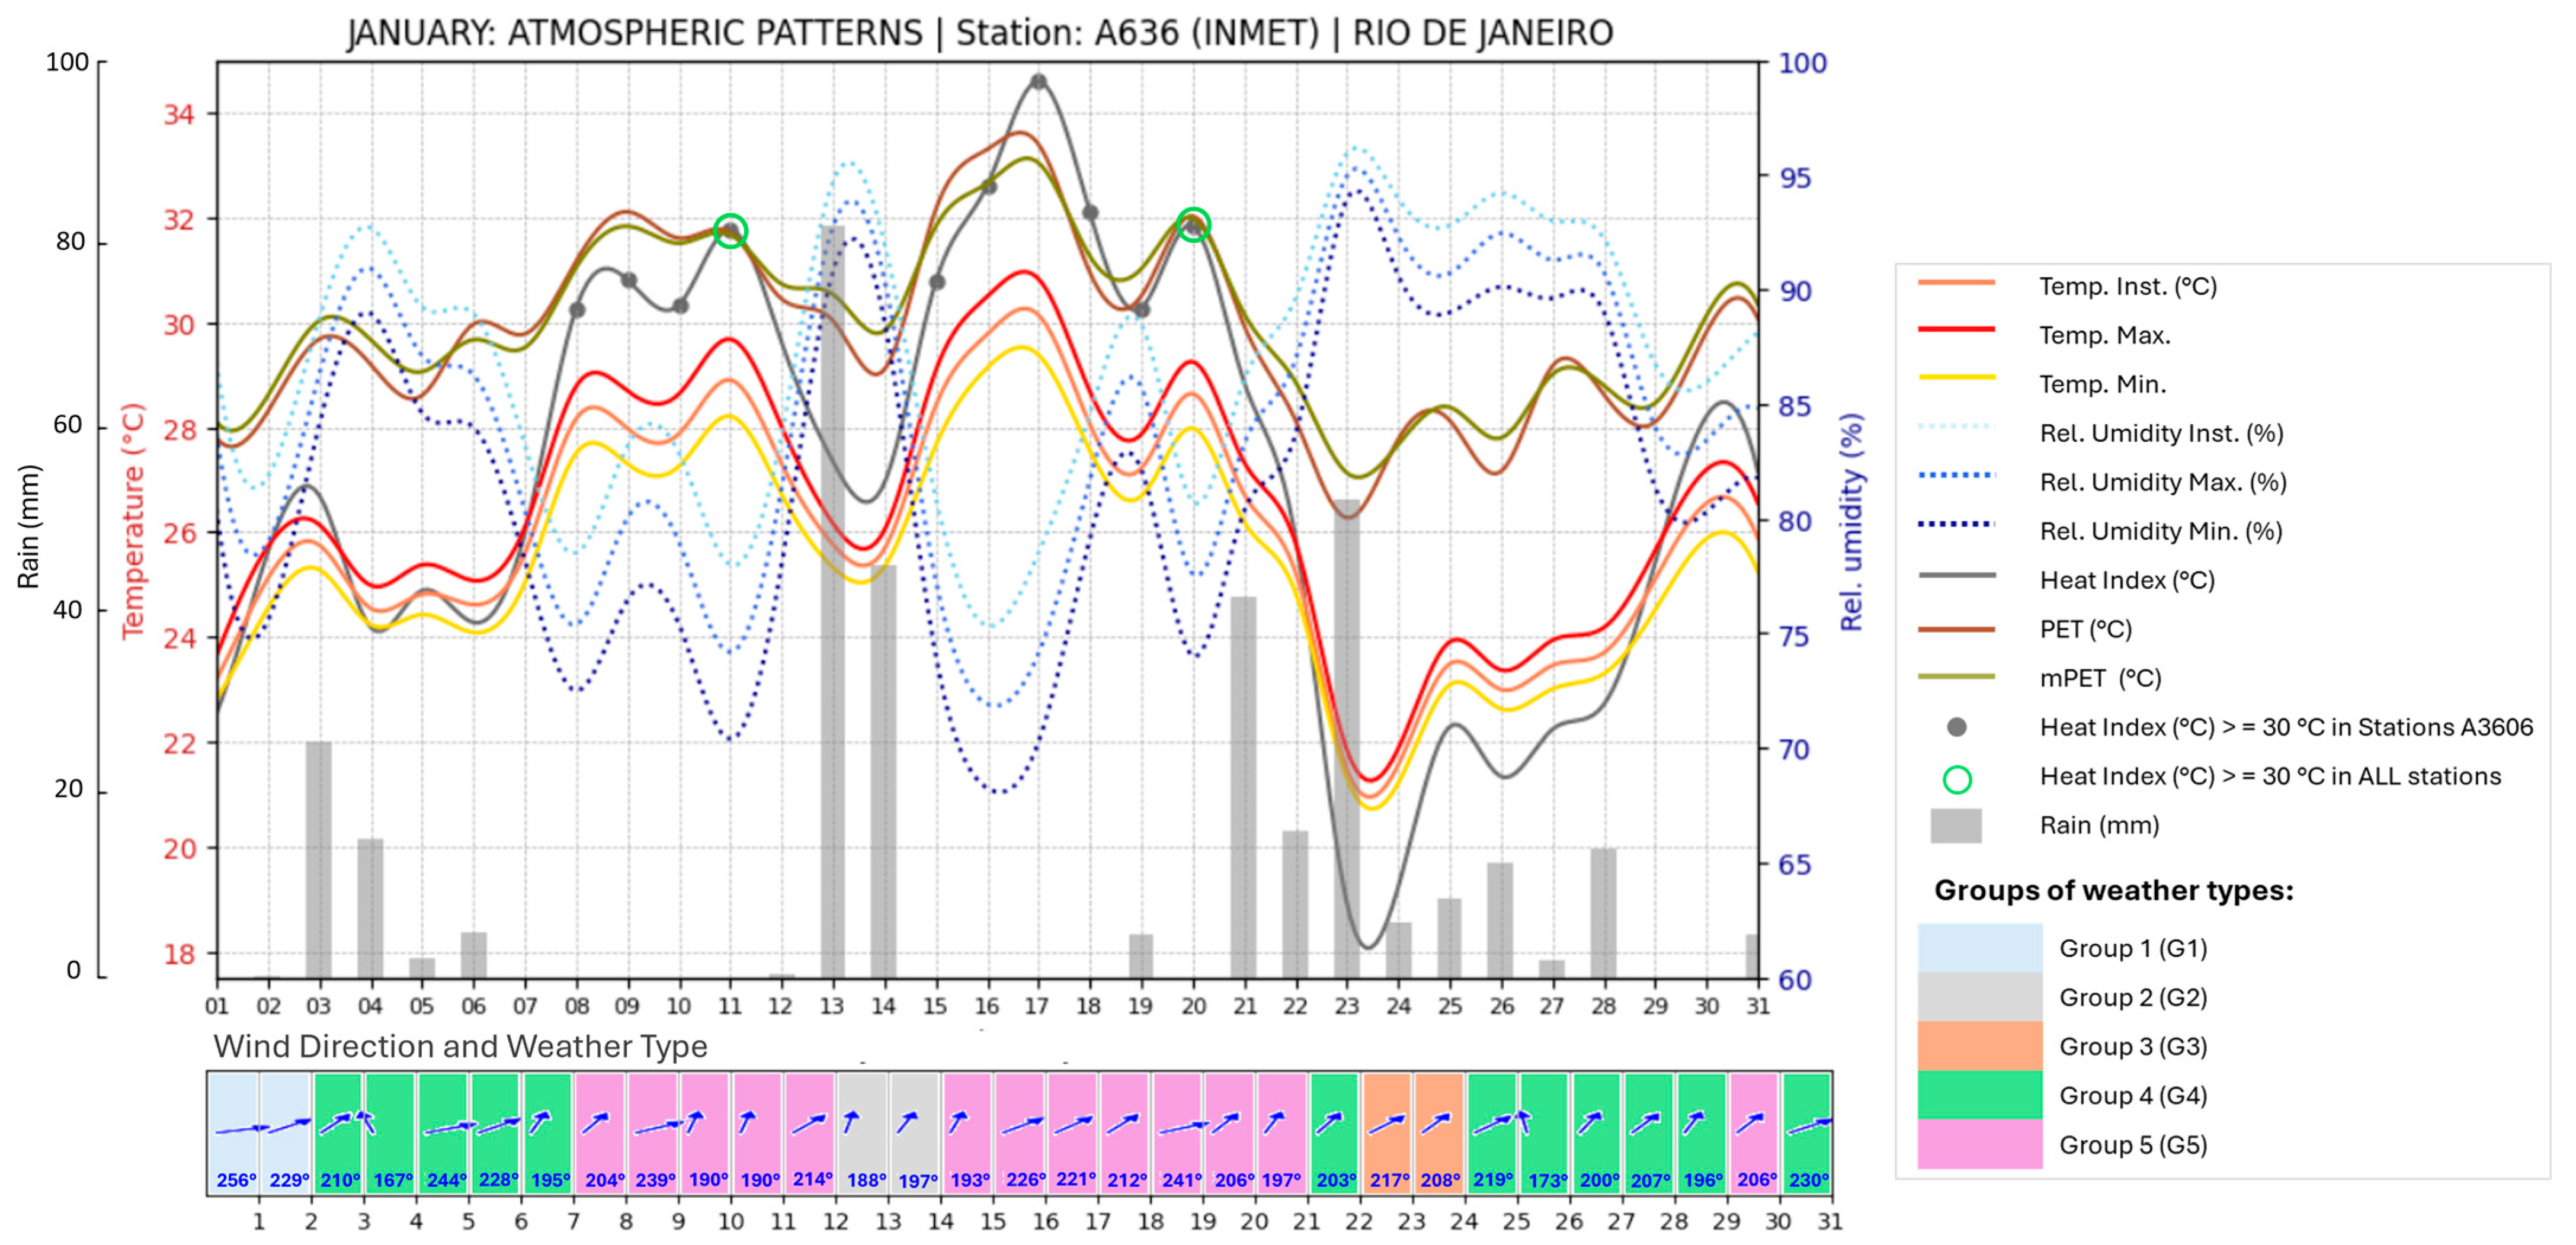
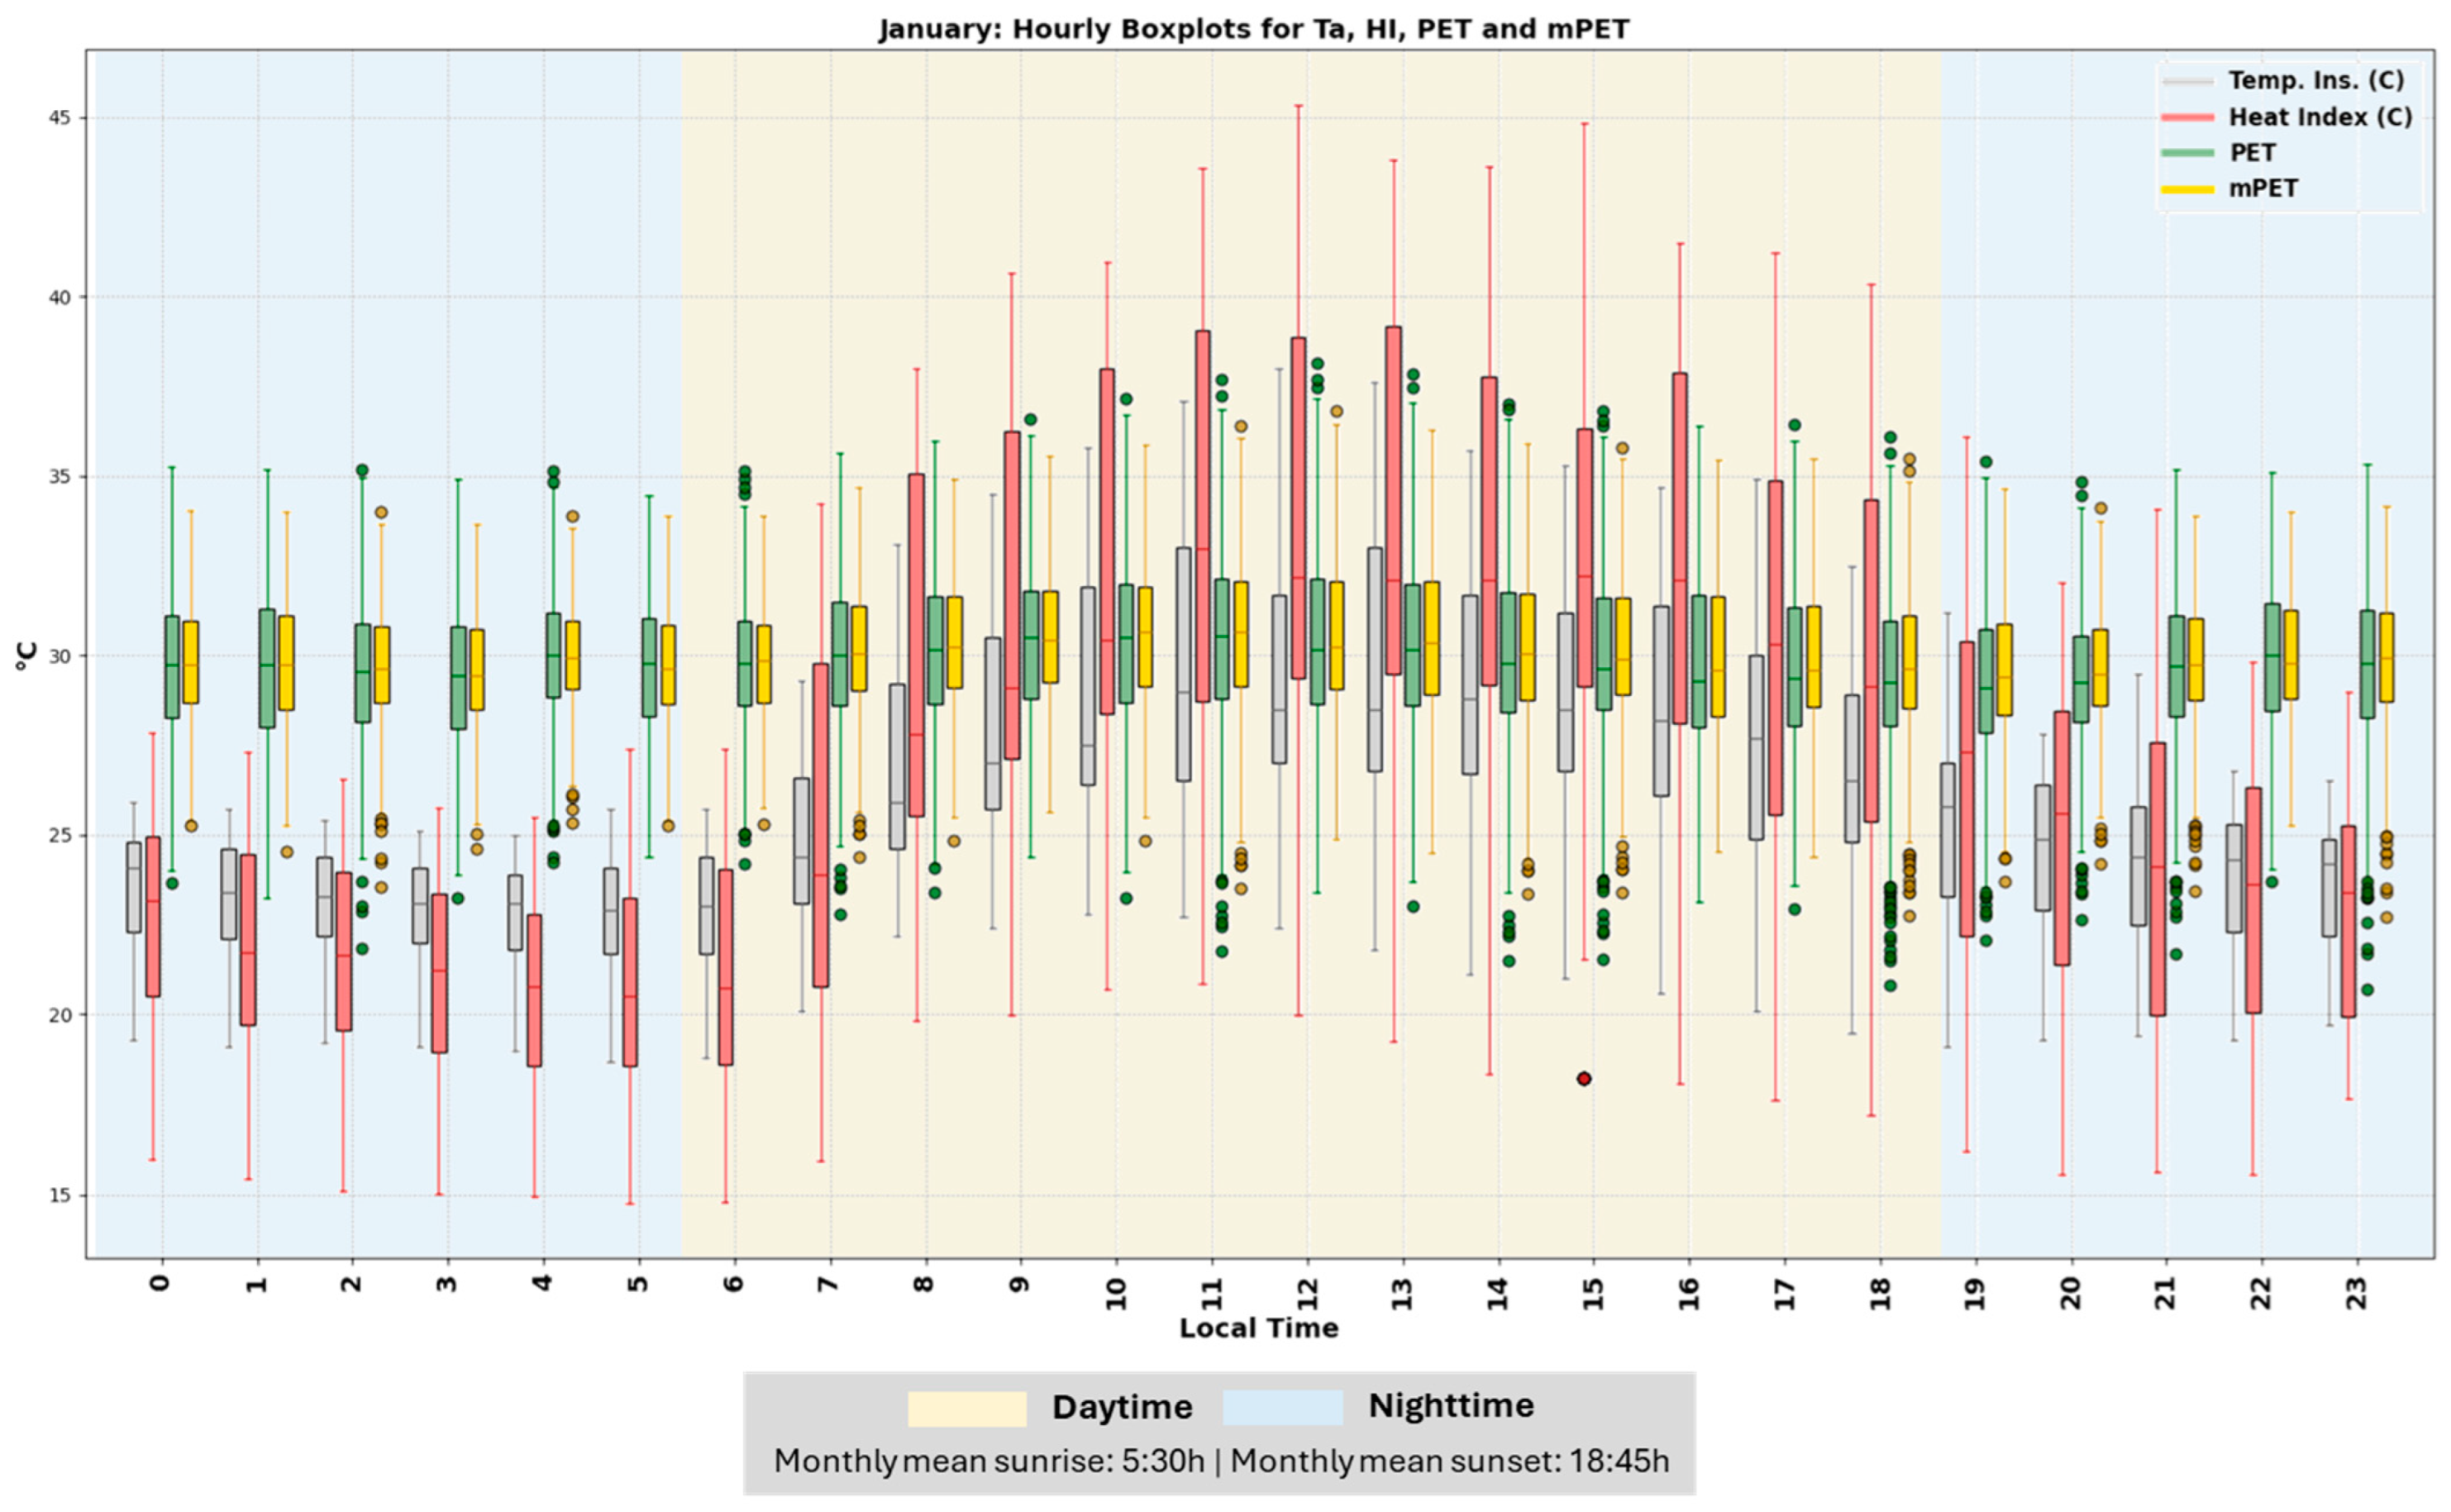
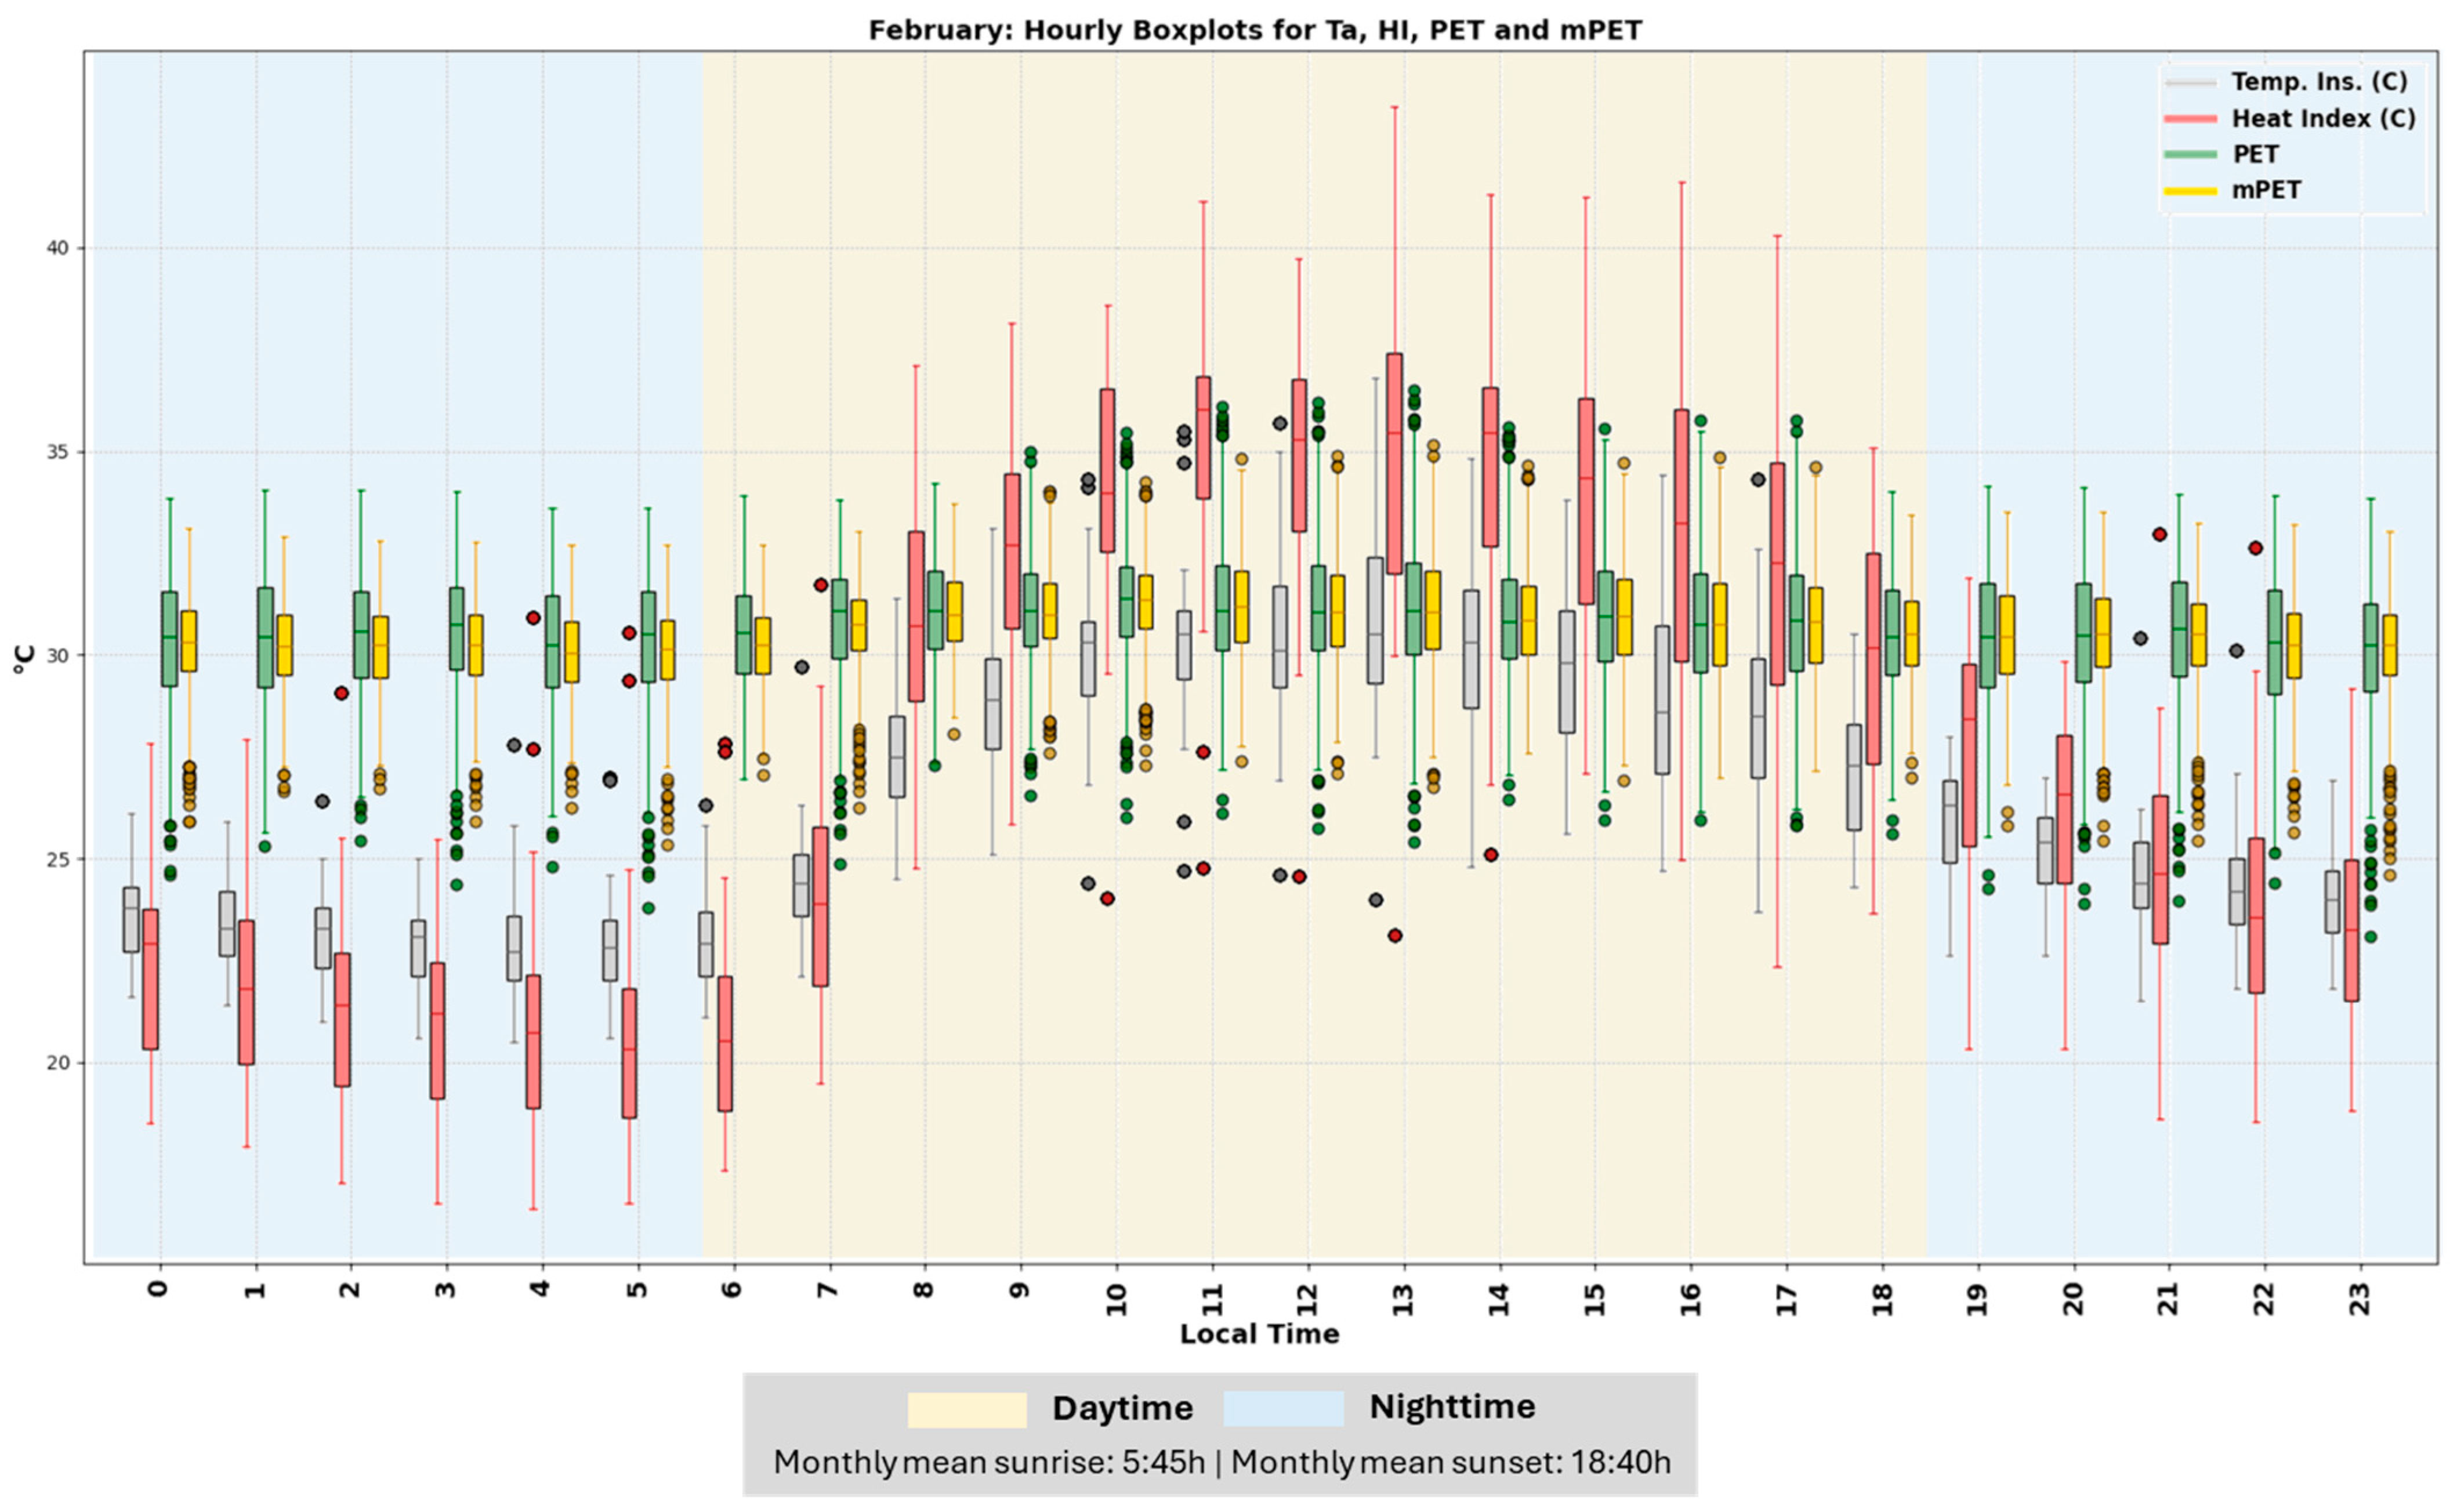
3.2. Monthly Atmospheric Rhythm and Thermal Comfort Indices’ Variability

This section presents the results related to the atmospheric patterns during the study months, with discussions focused on the behavior of the thermodynamic variables. Figure 2 shows the daily values of the meteorological variables for January 2024. The solid gray line indicates the daily average HI values, where daily HI values ≥ 30 °C are highlighted with gray dots for this station and overlaid with green circles for all stations. The daily PET and mPET are presented as brown and olive green solid lines, respectively. The solid red lines depict the temperature values, the dashed blue lines indicate the humidity values, and the gray bars show the daily accumulated precipitation. Additionally, the horizontal bar shows the daily average values of the wind speed and wind direction and the predominant weather type.
Station A636 recorded a total of 10 days with an HI ≥ 30 °C in January 2024, of which two (11 and 20 January) stood out for exceeding this threshold at all other stations combined. The period between the 8th and 21st of this month had the highest temperatures and, consequently, days with HI values above the 30 °C threshold. From these days, nine (8, 9, 10, 11, 15, 16, 17, 18, and 19 January) were influenced by the tropical continental air mass (Tc), and one (20 January) was influenced by the equatorial continental air mass (Ec). All 10 of these days were categorized into G5 under the influence of continentality on the local climate.
G5 was the most frequent group in this month (41.9%) followed by G4 (38.7%), related to the presence of extreme heat and high heat, respectively. Although G3 occurred on just two days this month (23 and 24 January), its presence was responsible for the lowest daily PET, mPET, and HI values of the entire quarter (value), having the only daily HI record below 20 °C.
When observing the hourly values, depicted in the boxplot diagrams in Figure 3, the highest hourly temperatures were between 8 h and 18 h, reaching the highest values with mean above 30 °C and a wider HI amplitude between 10 h and 17 h. The nighttime period had the expected relatively mild HI (compared with the daytime period), but it was still high for the time, with the maximum HI values only dropping below 30 °C after 10:00 p.m., indicating a slow rate of air cooling during this period. The PET and mPET did not show significant contrast between the daytime and nighttime periods. Their average values fluctuated near 30 °C throughout the day, with a positive variation between 8:00 a.m. and 2:00 p.m. The most noticeable difference between these periods in these variables was in their maximum and minimum values, with the daytime period exhibiting a greater amplitude.
Figure 4 presents the daily meteorological variables for February 2024, and Figure 5 shows the boxplot diagrams of the hourly HI values for this month. February 2024 had a total of 10 days at Station A636 with an HI ≥ 30 °C, of which three (12, 14, and 24 February) exceeded this threshold at the other studied stations as well. G4 was the most frequent group (62.1%) followed by G5 (24.2%), which was present from 20 February. The predominance of G4 influenced high temperatures for the whole month. The PET and mPET maintained minimal contrasts between the daytime and nighttime periods. However, their average values were slightly higher than the previous month, all exceeding 30 °C. The relatively low temperatures on 15 February were due to the influence of a mild cold front on this day, which increased the humidity, with the highest daily rain being recorded in this month (value).
The hourly HI values show that this month’s daytime warming occurred faster than in the previous month, recording 10 h per day with hourly HI averages above 30 °C (from 8:00 a.m. to 6:00 p.m.); which is practically the entire daytime period. February 2024 exceeded the HI values of the previous month, both in terms of the number of hours above the 30 °C threshold and the average and extreme values, which were higher than those in January. Despite a faster cooling rate after sunset compared with the previous month, February 2024 had more positive outliers, including in the early morning hours. At 4:00 a.m. and 5:00 a.m., there were positive outliers above 30 °C, indicating that on some days, the heat persisted throughout the night, possibly suggesting an intensification of the urban heat island (UHI) effect. Figure 6 presents the daily values of the meteorological variables for March 2024.
March 2024 was the month with the lowest quantity of days with an HI >30 °C at Station A636 during the studied quarter, of which half were above this threshold at all other stations. G4 continued being the most frequent weather type group in this month (58.1%) followed by G5 (32.2%). Although G5 was less frequent than G4, it was associated with all the days when the HI was ≥30 °C. On 21 February, the highest HI value of the month was recorded, a value not seen since 17 January (value). The following day was marked by a high daily precipitation volume (value) due to a frontal system associated with the polar Atlantic air mass (Paf/Ta). The subsequent days, influenced by this air mass and G4, saw their temperatures and HIs drop sharply, making the HI values even milder than the other temperatures from 23 to 28 March.
The hourly HI variability in the boxplot diagrams for March 2024 (Figure 7) shows that daytime heating became pronounced from 8:00 a.m., with daily average HI values exceeding 30 °C from that time and remaining so until 4:00 p.m. As a result, March 2024 had a total of 8 h with a daily average HI above 30 °C, a reduction of two hours compared with the previous month. Nighttime HI values, as in the previous months, showed a slow cooling rate. Additionally, March had the highest number of positive outliers exceeding 30 °C, especially during the early morning hours. This increased the indication of an intense urban heat island (UHI) effect, the investigation of which extends beyond the methodological tools of the current study.
The days with an HI ≥ 30 °C at Station A636, as well as the days when this value was recorded at all other study stations, are indicated by a green outline around the circles, and they are listed in Table 3. Among these days, those in March had the highest number of HI values above 39 °C. Among the stations, Jardim Botânico Station had the highest quantity of days exceeding this value (six out of a total of eight days). Alto da Boa Vista Station, located in an elevated area with extensive vegetation cover, presented the lowest HI values for all days.
Table 4 lists the number of days with an HI greater than or equal to 30 °C for each studied month, while Table 5 lists the number of days where the HI was equal to or greater than 30 °C for at least one station for each month. Riocentro Station had the highest frequency of these days for all three months, accounting for 71% of the quarter, marked by daily HI averages above 30 °C. February was the standout month for this station, with only two days below this threshold, making it the month with the highest frequency of these days, followed by March (21 days) and January (20 days).
Table 6 presents a ranking of the times and dates which recorded the highest HI values. Despite Riocentro Station, located in the city center, having the highest frequency of daily HI averages above 30 °C, Guaratiba Station, situated on the coast and away from the center, recorded the highest extreme values of this index for all 10 ranked days.
In this ranking, March had the highest number of days (16, 17, and 21 March), with 17 March (from 9:45 a.m. to 12:15 a.m.) and 16 March (from 10:30 a.m. to 11:15 p.m.) standing out for having the highest number of records. The only day in Table 6 outside of March was 17 January at 11:45 a.m. (seventh place in Table 6’s ranking). The highest hourly HI value for February was on 24 February 2024 at 9:00 a.m., which did not appear in Table 6’s ranking. The Guaratiba Station stood out for having the highest HI values in all the records of the ranking. Therefore, the charts in Figure 8, Figure 9 and Figure 10 show the hourly HI values at the other stations for the highlighted day of each month (17 January, 24 February, and 17 March), as well as the tabulated values of the PET and mPET for both men and women at the time of the highest HI intensity on these days.
Figure 8 shows the hourly HI for 17 January, which recorded the highest daily HI of the month. On this day, the HI increased from early morning, peaking around 11:00 a.m., particularly at the Guaratiba Station (59.2 °C), and gradually decreased in the afternoon and evening. Among the different stations, Guaratiba consistently recorded the highest HI values throughout the day, followed by Alto da Boa Vista, Inhaú, and Santa Cruz, with slightly lower values at the peak time of 11:00 a.m. At this time, the PET was 35.3 °C, and the mPET were 32.8 °C and 36.4 °C for men and women respectively.
Figure 9 presents the hourly HI for 24 February, which recorded the highest daily HI of the month. The HI naturally increased from early morning, peaking at 9:00 a.m., and then gradually declined through the afternoon and evening. Among the stations, Guaratiba (57.7 °C at 10:00 a.m.) and Jardim Botanico (48.4 °C at 10:00 a.m.) had the highest HI values. PET value at 10:00 a.m. was 33.3 °C and mPET were 32.1 °C and 33.7 °C for men and women respectively, indicating the modified PET temperatures for both genders.
The hourly HI on 17 March 2024, shown in Figure 10, increased from 5:00 a.m. and peaked between 9:00 a.m. and 12:00 p.m. Guaratiba continued to be the station with the highest hourly HI peaks, reaching 60.5 °C at 11:00 a.m., and then it gradually declined through the afternoon and evening. Jardim Botanico followed Guaratiba, recording HI values above 50 °C between 12:00 p.m. and 2:00 p.m. The PET value at 10:00 a.m. was 33.6 °C and and mPET were 32.1 °C and 34.5 °C for men and women.

4. Discussion

The synoptic analysis of the studied months identified the occurrence of five main weather types in the city during the study period, of which two (G4 and G5) were associated with high air temperature values. The G4 type was linked to the presence of the maritime tropical air mass (Mta) and the subtropical Atlantic high-pressure center, while the G5 type was influenced by the equatorial continental air mass, and this synoptic pattern was related to the increase in heat intensity in the study area, Generally, these weather types predominated throughout the studied months and were consistently associated with days with high air temperatures [34].
From a local climatic perspective, stations located at seven different points of the city were analyzed, along with their respective HI values. The PET and mPET were calculated for one of these stations (A636) with the quantity of variables needed for these indices. All stations exhibited critical thermohygrometric values with low nighttime cooling rates, especially at the Riocentro station located in the city center, indicating the possibility of intense UHI occurrence. Nighttime overheating is becoming an increasingly significant concern in Rio de Janeiro [35]. On the hottest days of each analyzed month (17 January, 24 February, and 17 March), this station reached HI, PET and mPET values above 40 °C, 38 °C, and 37 °C, respectively, during the night.
There is a need to investigate the microclimatic factors [36] which both favor the intense occurrence of UHI in the city’s central areas and also contribute to daytime overheating in locations far from the central areas, such as the Guaratiba station. This station is located far from the center and near the coastal line, and it recorded all the hourly HI values which were even more intense under weather types influenced by continental conditions. The high records registered at this station are noteworthy as it is located on the coastal line, with records registered during a period of high frequency of city residents and tourists on the beaches of Rio de Janeiro, resulting in a larger population exposed to thermal stress and intense radiation.
The results also indicated a significant contrast between the outputs from the different calculated indices. The HI, used by the Rio de Janeiro city government, showed greater variability and fluctuations in values on both the hourly and monthly scales, whereas the PET and the mPET remained elevated and more stable in comparison with the HI. The PET and mPET calculations were complementary, as they considered a broader range of biometeorological variables and did not necessarily fluctuate with each peak in temperature and humidity. For example, on 17 March at 10:00 a.m., the Guaratiba station recorded an HI of 60.5, while the PET and mPET did not exceed 40 °C, highlighting a significant difference between these indices.
Furthermore, hourly box plot diagrams revealed that the PET and mPET did not estimate significant thermal contrasts between the daytime and nighttime periods, with average nighttime hourly values oscillating around 30 degrees in January and above this value at all hours in February and March. At the same time, the lowest average hourly HI values occurred at night, dropping below the air temperature in the early morning hours of the three months studied, particularly in February. In this context, the greatest divergence observed in the presented results lies in how these indices contrast the hourly thermal conditions. Understanding this local contrast is crucial for accurately assessing heat exposure [37,38] and, consequently, supporting the development of effective measures to mitigate thermal vulnerability [39,40].
Given that the city of Rio de Janeiro exhibited critical thermal sensation values across all calculated methods despite the differences between them, and this city is historically marked by extreme heat [4] which is worsening with climate change [7,11], a more detailed investigation is recommended. This investigation should focus on the different thermal sensation calculations and the thermal perception of the local population in order to develop an index more adapted to the local biometeorological characteristics.
Culturally, the population of Rio de Janeiro (as well as other coastal cities in Brazil) tends to frequent coastal areas during periods of high thermal stress, overcrowding these environments, which have high tourist appeal, during the summer season. The results showed that special attention is needed regarding the implications of this on public health [4]. For example, a more detailed investigation of the coastal microclimatic elements in this city, their relationship with larger-scale climatic phenomena, and the impacts of thermal contrasts in this microclimate on public health is necessary. This includes considering the contrast between high air and sandy surface temperatures and the cold waters, partially resulting from coastal upwelling, and its potential impact on human health, combined with investigation of the high concentration of thermal stress risk groups in these environments (children, women, and the elderly) [41,42]. Additionally, educational campaigns should be directed at both the general population and tourists regarding measures to protect against thermal stress.

5. Conclusions

The present study aimed to investigate atmospheric conditions, respective trends, and human thermal comfort related to extreme heat in the city of Rio de Janeiro during the first quarter of 2024. The results presented significant differences between the methods of calculating thermal sensations.
The analysis of atmospheric dynamics and classification of weather types resulted in the identification of five weather type groups during the study period. The two most frequent groups (G4 and G5) were associated with the occurrence of intense heat. Days associated with these two groups occurred more than 70% of the time in all months.
The calculation and analysis of thermal comfort indices showed that the heat index (HI), used by the municipal government, exhibited a greater range and variability compared with the PET and mPET, which are based on more comprehensive approaches [20]. The latter indices are based on more comprehensive approaches that take into account a wider range of influencing factors, making them more suitable for accurately assessing thermal comfort across various environmental conditions. As a result, PET and mPET provide a more precise and reliable evaluation, particularly in scenarios where the simple variability of the HI may not adequately reflect the actual impact on thermal comfort.
This contrast between indices highlights the importance of investigating the microclimatic factors which intensify urban heat in both the central and coastal areas and cause daytime overheating in more distant regions, such as the Guaratiba station. The HI is a validated and widely used index which requires fewer meteorological variables, making it easier to calculate for various parts of the city when compared with the PET and mPET. However, Rio de Janeiro is increasingly exposed to intense heat, making it urgent to invest in a more complex network of biometeorological sensors across the city and studies to develop heat indices better suited to local particularities.
It is necessary to consider the impact of extreme heat on public health [2], especially in coastal areas where the population and tourists face high levels of thermal stress. Therefore, the incidence of ultraviolet (UV) radiation should also be included in heat alerts. Educational campaigns targeted at the local population and tourists, informing them about measures to protect against thermal stress, are recommended. Therefore, the development of a heat warning system (HWS) becomes urgent for this city to minimize the adverse health effects associated with extreme heat events by triggering action and enabling subsequent preventive measures [43].

Supplementary Materials

The following supporting information can be downloaded at https://www.mdpi.com/article/10.3390/atmos15080973/s1. Figure S1: Synoptic chart for 9 January 2024, corresponding to the weather type of group G5. Figure S2: Synoptic chart for 13 January 13 2024, corresponding to the weather type of group G2. Figure S3: Synoptic chart for 23 January 2024, corresponding to the weather type of group G3. Figure S4: Synoptic chart for 10 February 2024, corresponding to the weather type of group G4 in the city of Rio de Janeiro. Figure S5: Synoptic chart for 12 February 2024, corresponding to the weather type of group G1 in the city of Rio de Janeiro. Figure S6: Synoptic chart for 14 February 2024, corresponding to the weather type of group G1 in the city of Rio de Janeiro. Figure S7: Synoptic chart for 15 February 2024, corresponding to the weather type of group G2 in the city of Rio de Janeiro. Figure S8: Synoptic chart for 4 March 2024, corresponding to the weather type of group G4 in the city of Rio de Janeiro. Figure S9: Synoptic chart for 21 March 2024, corresponding to the weather type of group G5 in the city of Rio de Janeiro. Figure S10: Synoptic chart for 23 March 2024, corresponding to the weather type of group G3 in the city of Rio de Janeiro.

Author Contributions

Conceptualization, A.B.M. and A.M.; methodology A.B.M., L.S.d.A.W. and A.M.; formal analysis, A.B.M. and L.S.d.A.W.; data curation A.B.M.; writing—original draft preparation, A.B.M. and L.S.d.A.W.; writing—review and editing, A.B.M., A.M., L.S.d.A.W. and C.C.D.; visualization A.B.M., A.M., L.S.d.A.W. and C.C.D.; supervision, A.M. All authors have read and agreed to the published version of the manuscript.

Funding

This research was funded by the Alexander von Humboldt Foundation (AVH) through the International Climate Protection Fellowship.

Institutional Review Board Statement

Not applicable.

Informed Consent Statement

Not applicable.

Data Availability Statement

The original database from this study is stored in a GitHub repository. The link will be made available upon acceptance of this article due to the confidentiality of authorship in the blind review process.

Acknowledgments

The authors thank the International Climate Protection Fellowship of the Alexander von Humboldt Foundation.

Conflicts of Interest

The authors declare no conflicts of interest.

References

  1. IPCC. Climate Change 2023: Synthesis Report. Contribution of Working Groups I, II and III to the Sixth Assessment Report of the Intergovernmental Panel on Climate Change; Core Writing Team, Lee, H., Romero, J., Eds.; IPCC: Geneva, Switzerland, 2023. [Google Scholar] [CrossRef]
  2. Prosdocimi, D.; Klima, K. Health Effects of Heat Vulnerability in Rio de Janeiro: A Validation Model for Policy Applications. SN Appl. Sci. 2020, 2, 1948. [Google Scholar] [CrossRef]
  3. Silveira, I.H.; Cortes, T.R.; Bell, M.L.; Junger, W.L. Effects of Heat Waves on Cardiovascular and Respiratory Mortality in Rio de Janeiro, Brazil. PLoS ONE 2023, 18, e0283899. [Google Scholar] [CrossRef] [PubMed]
  4. Silveira, I.H.; Cortes, T.R.; Oliveira, B.F.A.; Junger, W.L. Temperature and Cardiovascular Mortality in Rio de Janeiro, Brazil: Effect Modification by Individual-Level and Neighbourhood-Level Factors. J. Epidemiol. Community Health 2021, 75, 69–75. [Google Scholar] [CrossRef]
  5. Berry, P.; Campbell-Lendrum, D.; Corvalan, C.; Guillemot, J. Protecting Health from Climate Change: Vulnerability and Adaptation Assesment, 1st ed.; Ebi, K., Ed.; World Health Organization: Geneva, Switzerland, 2013; ISBN 978-92-4-156468-7. Available online: https://www.who.int/publications/i/item/protecting-health-from-climate-change-vulnerability-and-adaptation-assessment (accessed on 2 May 2024).
  6. World Meteorological Organization. Provisional State of the Global Climate 2023; WMO: Geneva, Switzerland, 2023; Volume 6, Available online: https://www.un.org/en/climatechange/reports?gad_source=1&gclid=CjwKCAjwnqK1BhBvEiwAi7o0X9ZVol0FF6yR9j-vtXsOt6yqLzD0qUczYnXSLsacS-SIamAkDTjwIhoCrl8QAvD_BwE (accessed on 2 May 2024).
  7. World Meteorological Organization. State of the Climate in Latin America and the Caribbean 2022; WMO: Geneva, Switzerland, 2022; ISBN 978-92-63-11351-1. Available online: https://reliefweb.int/report/argentina/state-climate-latin-america-and-caribbean-2022?gad_source=1&gclid=CjwKCAjwnqK1BhBvEiwAi7o0X1qzzZ8OIVptBNnQuA0PgI3NM-HCNVnP6xg3XR7OZxp75xEl6A5DhBoCd2cQAvD_BwE (accessed on 2 May 2024).
  8. Marengo, J.A.; Camargo, C.C. Surface Air Temperature Trends in Southern Brazil for 1960–2002. Int. J. Climatol. 2008, 28, 893–904. [Google Scholar] [CrossRef]
  9. de Lucena, A.J.; Rotunno Filho, O.C.; de Almeida França, J.R.; de Faria Peres, L.; Xavier, L.N.R. Urban Climate and Clues of Heat Island Events in the Metropolitan Area of Rio de Janeiro. Theor. Appl. Climatol. 2013, 111, 497–511. [Google Scholar] [CrossRef]
  10. Geirinhas, J.L.; Trigo, R.M.; Libonati, R.; Castro, L.C.O.; Sousa, P.M.; Coelho, C.A.S.; Peres, L.F.; de Avelar, F.M.; Magalhães, M. Characterizing the Atmospheric Conditions during the 2010 Heatwave in Rio de Janeiro Marked by Excessive Mortality Rates. Sci. Total Environ. 2019, 650, 796–808. [Google Scholar] [CrossRef] [PubMed]
  11. Rusticucci, M. Observed and Simulated Variability of Extreme Temperature Events over South America. Atmos. Res. 2012, 106, 1–17. [Google Scholar] [CrossRef]
  12. CNN Brasil Calor Sufocante: Com 60.1 °C, Rio Atinge Recorde de Sensação Térmica. Available online: https://www.cnnbrasil.com.br/nacional/calor-sufocante-com-601oc-rio-atinge-recorde-de-sensacao-termica/ (accessed on 2 May 2024).
  13. Deutsche Welle Brazil Heat Wave Hits Record Temperatures, Rio at 62 °C. Available online: https://www.dw.com/en/brazil-heat-wave-hits-record-temperatures-rio-at-62c/g-68621375 (accessed on 2 May 2024).
  14. Al Jazeera Record Heat Index of 62.3C Scorches Brazil’s Rio de Janeiro. Available online: https://www.aljazeera.com/gallery/2024/3/18/photos-record-heat-index-of-62-3c-scorches-rio-de-janeiro (accessed on 2 May 2024).
  15. Câmara, F.P.; Gomes, A.F.; Dos Santos, G.T.; Câmara, D.C.P. Clima e Epidemias de Dengue No Estado Do Rio de Janeiro. Rev. Soc. Bras. Med. Trop. 2009, 42, 137–140. [Google Scholar] [CrossRef] [PubMed]
  16. Ebi, K.L.; Capon, A.; Berry, P.; Broderick, C.; de Dear, R.; Havenith, G.; Honda, Y.; Kovats, R.S.; Ma, W.; Malik, A.; et al. Hot Weather and Heat Extremes: Health Risks. Lancet 2021, 398, 698–708. [Google Scholar] [CrossRef]
  17. NCEP. The Heat Index Equation. Available online: https://www.wpc.ncep.noaa.gov/html/heatindex_equation.shtml (accessed on 2 May 2024).
  18. Höppe, P. The Physiological Equivalent Temperature—A Universal Index. Int. J. Biometeorol. 1999, 43, 71–75. [Google Scholar]
  19. Höppe, P. Different Aspects of Assessing Indoor and Outdoor Thermal Comfort. Energy Build. 2002, 34, 661–665. [Google Scholar] [CrossRef]
  20. Chen, Y.C.; Chen, W.N.; Chou, C.C.K.; Matzarakis, A. Concepts and New Implements for Modified Physiologically Equivalent Temperature. Atmosphere 2020, 11, 694. [Google Scholar] [CrossRef]
  21. Instituto Brasileiro de Geografia e Estatística, I. Cidades e Estados: Rio de Janeiro. Available online: https://cidades.ibge.gov.br/brasil/rj/panorama (accessed on 2 May 2024).
  22. Instituto Nacional de Meteorologia Normal Climatológica (Período de Referência: 1991–2020). Available online: https://clima.inmet.gov.br/GraficosClimatologicos/DF/83377 (accessed on 1 May 2024).
  23. Ministerio da Defesa Marinha Do Brasil. Available online: https://www.marinha.mil.br/ (accessed on 1 May 2024).
  24. Duan, H.; Li, Q.; He, L.; Zhang, J.; An, H.; Ali, R.; Vazifedoust, M. Climate Classification for Major Cities in China Using Cluster Analysis. Atmosphere 2024, 15, 741. [Google Scholar] [CrossRef]
  25. Kwon, Y.; Lee, H.; Lee, H. Implication of the Cluster Analysis Using Greenhouse Gas Emissions of Asian Countries to Climate Change Mitigation. Mitig. Adapt. Strateg. Glob. Chang. 2018, 23, 1225–1249. [Google Scholar] [CrossRef]
  26. Badr, H.S.; Zaitchik, B.F.; Dezfuli, A.K. A Tool for Hierarchical Climate Regionalization. Earth Sci. Inform. 2015, 8, 949–958. [Google Scholar] [CrossRef]
  27. Sheridan, S.C. The Redevelopment of a Weather-Type Classification Scheme for North America. Int. J. Climatol. 2002, 22, 51–68. [Google Scholar] [CrossRef]
  28. Yarnal, B.; Comrie, A.C.; Frakes, B.; Brown, D.P. Developments and Prospects in Synoptic Climatology. Int. J. Climatol. 2001, 21, 1923–1950. [Google Scholar] [CrossRef]
  29. Zavatini, J.A.; Boin, N.M. Climatologia Geográfica: Teoria e Prática de Pesquisa; Editora Alínea: Campinas, SP, Brazil, 2013; Volume 1. [Google Scholar]
  30. Lee, C.C.; Sheridan, S.C. Trends in Weather Type Frequencies across North America. NPJ Clim. Atmos. Sci. 2018, 1, 41. [Google Scholar] [CrossRef]
  31. Chen, Y.C.; Matzarakis, A. Modified Physiologically Equivalent Temperature—Basics and Applications for Western European Climate. Theor. Appl. Climatol. 2018, 132, 1275–1289. [Google Scholar] [CrossRef]
  32. Rothfusz, L.P. The Heat Index “Equation” (or, More Than You Ever Wanted to Know about Heat Index); National Oceanic and Atmospheric Administration, National Weather Service, Office of Meteorology: Fort Worth, TX, USA, 1990.
  33. Matzarakis, A.; Rutz, F.; Mayer, H. Modelling Radiation Fluxes in Simple and Complex Environments: Basics of the RayMan Model. Int. J. Biometeorol. 2010, 54, 131–139. [Google Scholar] [CrossRef]
  34. Silva, W.L.; Dereczynski, C.P. Caracterização Climatológica e Tendências Observadas em Extremos Climáticos No Estado Do Rio de Janeiro. Anu. Inst. Geocienc. 2014, 37, 123–138. [Google Scholar] [CrossRef]
  35. Vieira Silveira, H.C.; Pinto de Almeida Palmeira, A.C.; Albuquerque de Almeida, V. Avaliação de Um Caso de Intenso Aquecimento Do Ar Noturno Superficial No Estado Do Rio de Janeiro. Sist. Gestão 2023, 18, 270–283. [Google Scholar] [CrossRef]
  36. Harlan, S.L.; Brazel, A.J.; Prashad, L.; Stefanov, W.L.; Larsen, L. Neighborhood Microclimates and Vulnerability to Heat Stress. Soc. Sci. Med. 2006, 63, 2847–2863. [Google Scholar] [CrossRef] [PubMed]
  37. Weber, S.; Sadoff, N.; Zell, E.; de Sherbinin, A. Policy-Relevant Indicators for Mapping the Vulnerability of Urban Populations to Extreme Heat Events: A Case Study of Philadelphia. Appl. Geogr. 2015, 63, 231–243. [Google Scholar] [CrossRef]
  38. de Costa Trindade Amorim, M.C.; Dubreuil, V.; Amorim, A.T. Day and Night Surface and Atmospheric Heat Islands in a Continental and Temperate Tropical Environment. Urban. Clim. 2021, 38, 100918. [Google Scholar] [CrossRef]
  39. Lim, J.; Skidmore, M. Heat Vulnerability and Heat Island Mitigation in the United States. Atmosphere 2020, 11, 558. [Google Scholar] [CrossRef]
  40. Icaza, L.E.; Van Den Dobbelsteen, A.; Van Der Hoeven, F. Integrating Urban Heat Assessment in Urban Plans. Sustainability 2016, 8, 320. [Google Scholar] [CrossRef]
  41. Reid, C.E.; O’Neill, M.S.; Gronlund, C.J.; Brines, S.J.; Brown, D.G.; Diez-Roux, A.V.; Schwartz, J. Mapping Community Determinants of Heat Vulnerability. Environ. Health Perspect. 2009, 117, 1730–1736. [Google Scholar] [CrossRef]
  42. Bell, M.L.; O’Neill, M.S.; Ranjit, N.; Borja-Aburto, V.H.; Cifuentes, L.A.; Gouveia, N.C. Vulnerability to Heat-Related Mortality in Latin America: A Case-Crossover Study in São Paulo, Brazil, Santiago, Chile and Mexico City, Mexico. Int. J. Epidemiol. 2008, 37, 796–804. [Google Scholar] [CrossRef] [PubMed]
  43. Matzarakis, A. Importance of Heat Health Warnings in Heat Management. Atmosphere 2024, 15, 684. [Google Scholar] [CrossRef]
Figure 1. Location map of the study area and the meteorological stations used in this research.
Atmosphere 15 00973 g001
Figure 2. Daily values of temperature, humidity, heat index, wind direction, and weather types for January 2024 at Station A636 in Jacarepaguá, Rio de Janeiro. Air temperatures (instantaneous, maximum, and minimum) are shown in yellow to red gradient color lines. Relative humidities (instantaneous, maximum, and minimum) in blue gradient dashed lines. HI, PET, and mPET are shown in black, brown, and green lines, respectively. Rain is shown as gray bars, and wind direction and weather types are colored bars (G1 = light blue, G2 = pink, G3 = orange, G4 = green, and G5 = purple).
Atmosphere 15 00973 g002
Figure 3. Hourly boxplot diagram of heat index for January 2024 at Station A636 in Jacarepaguá, Rio de Janeiro. The diagram displays hourly values with the following color codes: instantaneous temperature (°C) in red, HI (°C) in pink, PET (°C) in green, and mPET (°C) in yellow. Colored dots, corresponding to these same colors, represent outliers for each respective variable. The shaded background indicates daytime (yellow) and nighttime (blue) periods, based on the monthly mean sunrise at 5:30 a.m. and sunset at 6:45 p.m.
Atmosphere 15 00973 g003
Figure 4. Daily values of temperature, humidity, heat index, wind direction, and weather types for February 2024 at Station A636 in Jacarepaguá, Rio de Janeiro. Air temperatures (instantaneous, maximum, and minimum) are shown in yellow to red gradient color lines; relative humidities (instantaneous, maximum, and minimum) are in blue gradient dashed lines; the HI, PET, and mPET are in black, brown, and green lines, respectively; rain is shown in gray bars; and wind direction and weather types are colored bars (G1 = light blue, G2 = pink, G3 = orange, G4 = green, G5 = purple).
Atmosphere 15 00973 g004
Figure 5. Hourly box plot diagram of heat index for February 2024 at Station A636 in Jacarepaguá, Rio de Janeiro. Instantaneous temperature (°C) shown in red, HI (°C) in pink, PET (°C) in green, and mPET (°C) in yellow. Colored dots, corresponding to these same colors, represent outliers for each respective variable. The shaded background indicates daytime (yellow) and nighttime (blue) periods, based on the monthly mean sunrise at 5:45 a.m. and sunset at 6:40 p.m.
Atmosphere 15 00973 g005
Figure 6. Daily values of temperature, humidity, heat index, wind direction, and weather types for March 2024 at Station A636 in Jacarepaguá, Rio de Janeiro. Air temperatures (instantaneous, maximum, and minimum) are shown in yellow to red gradient color lines; relative humidities (instantaneous, maximum, and minimum) are shown in blue gradient dashed lines; HI, PET, and mPET are shown in black, brown, and green lines, respectively; rain shown in gray bars; and wind direction and weather types shown as colored bars (G1 = light blue, G2 = pink, G3 = orange, G4 = green, G5 = purple).
Atmosphere 15 00973 g006
Figure 7. Hourly box plot diagram of heat index for March 2024 at Station A636 in Jacarepaguá, Rio de Janeiro. Instantaneous temperature (°C) shown in red, HI (°C) in pink, PET (°C) in green, and mPET (°C) in yellow. Colored dots, corresponding to these same colors, represent outliers for each respective variable. The shaded background indicates daytime (yellow) and nighttime (blue) periods, based on the monthly mean sunrise at 5:55 a.m. and sunset at 6:20 p.m.
Atmosphere 15 00973 g007
Figure 8. Hourly HI for 17 January 2024 at seven stations in Rio de Janeiro, highlighting the tabulated values of PET and mPET for men and women at the time of the highest HI on this day (11:00 a.m.). The shaded background indicates daytime (yellow) and nighttime (blue) periods. The lines represent different stations: Alto da Boa Vista (purple), Guaratiba (brown), Irajá (red), Madureira (orange), Santa Cruz (black), São Cristóvão (gray), and INMET Jacarepaguá (yellow).
Atmosphere 15 00973 g008
Figure 9. Hourly HI for 24 February 2024 at seven stations in Rio de Janeiro, highlighting the tabulated values of PET and mPET for men and women at the time of the highest HI on this day (10:00 a.m.). The shaded background indicates daytime (yellow) and nighttime (blue) periods. The lines represent different stations: Alto da Boa Vista (purple), Guaratiba (brown), Irajá (red), Madureira (orange), Santa Cruz (black), São Cristóvão (gray), and INMET Jacarepaguá (yellow).
Atmosphere 15 00973 g009
Figure 10. Hourly HI for 17 March 2024 at seven stations in Rio de Janeiro, highlighting the tabulated values of PET and mPET for men and women at the time of the highest HI on this day (10:00 a.m.). The shaded background indicates daytime (yellow) and nighttime (blue) periods. The lines represent different stations: Alto da Boa Vista (purple), Guaratiba (brown), Irajá (red), Madureira (orange), Santa Cruz (black), São Cristóvão (gray), and INMET Jacarepaguá (yellow).
Atmosphere 15 00973 g010
Table 1. List of variables and respective loading in each component.
VariablesPC1 (42%)PC2 (22%)PC3 (14%)PC4 (10%)
aT0.40.00.20.0
maxT0.4−0.10.10.1
minT0.30.30.3−0.1
aRH−0.30.3−0.10.1
maxRH−0.10.1−0.20.6
minRH−0.30.30.00.0
aDP0.30.40.20.1
maxDP0.30.30.20.2
minDP0.10.50.20.1
aP−0.3−0.10.50.1
maxP−0.2−0.10.50.0
minP−0.3−0.10.50.1
aWS0.2−0.20.1−0.5
Rad0.3−0.30.00.3
Precip−0.10.30.0−0.5
Data source: INMET. Legend: average temperature (aT), maximum temperature (maxT), minimum temperature (minT), average relative humidity (aRH), maximum relative humidity (maxRH), minimum relative humidity (minRH), average dew point (aDP), maximum dew point (maxDP), minimum dew point (minDP), average atmospheric pressure (aP), maximum atmospheric pressure (maxP), minimum atmospheric pressure (minP), average wind speed (aWS), global radiation (Rad) and precipitation (Precip).
Table 2. Confidence intervals of each atmospheric variable in each cluster.
GroupRel. Freq. (%)aT (°C)maxT (°C)maxRH (%)aDP (°C)minDP (°C)aP (hPa)maxP (hPa)minP (hPa)aWS (m/s)R (mm)
G16.624–2828–3493–9521–2218–201011–10141013–10161009–10120.6–1.10.0–1.0
G24.425–2627–309724–2523–241010–10121012–10141009–10100.4–0.752.9–71.9
G33.321–2324–2797–9820–21181009–10161012–10181008–10150.4–0.812.4–50.2
G451.624–2728–3397–9822–2320–221010–10141012–10161008–10130.4–0.80.0–9.6
G534.126–2931–3696–9823–2421–231006–10101008–10121004–10070.5–1.00.0–18.7
Data source: INMET. Legend: average temperature (aT (°C)), maximum temperature (maxT (°C)), maximum relative humidity (maxRH (%)), average dew point (aDP), minimum dew point (minDP (°C)), average atmospheric pressure (aP (hPa)), maximum atmospheric pressure (maxP (hPa)), minimum atmospheric pressure (minP (hPa)), average wind speed (aWS (m/s)), and daily rainfall (R (mm)).
Table 3. List of days with heat index (HI) ≥ 30 °C for all stations (with average per day).
DateAlto da B.V.GuaratibaIrajáJardim BotânicoRiocentroSanta CruzSão
Cristóvão
Inmet
Jacarepaguá
Average
11 January 202430.538.134.943.338.835.935.431.836.1
20 January 202430.837.738.539.739.038.638.831.836.9
12 February 202430.535.035.637.836.935.535.8730.534.7
13 February 202431.236.935.539.838.036.237.131.335.8
24 February 202430.537.537.440.338.837.838.731.636.6
16 March 202430.237.939.538.237.637.637.531.536.3
17 March 202432.137.240.41.239.538.440.432.937.8
21 March 202433.041.138.544.141.239.238.833.938.7
Table 4. Days with heat index ≥30 °C per station and month (with totals).
StationJanuaryFebruaryMarchTotal
Riocentro18 (58%)27 (87%)20(64%)65 (71%)
Irajá17 (55%)23 (74%)18 (58%)58 (64%)
São Cristóvão15 (48%)23 (74%)16 (52%)54 (59%)
Jardim Botânico13 (42%)23 (74%)16 (52%)52 (57%)
Santa Cruz15 (48%)20 (64%)16 (52%)51 (56%)
Guaratiba13 (42%)17 (55%)10 (32%)40 (44%)
Inmet Jacarepaguá10 (32%)7 (22%)6 (19%)23 (25%)
Alto da Boa Vista4 (13%)3 (8%)3 (8%)10 (11%)
Table 5. Quantity of days with heat index ≥ 30 °C for at least 1 station per month.
MonthQuantity of Days with
Heat Index ≥ 30 °C
Percentage of Days with
Heat Index ≥ 30 °C in the Month
24 January2065%
24 February2793%
24 March2168%
Table 6. Ranking of the hottest dates, times, and stations during the first quarter of 2024 in the city of Rio de Janeiro.
RankingDayTimeStationHeat Index (°C)
17 March 202410:00Guaratiba60.5
16 March 202412:15Guaratiba60.1
17 March 202409:45Guaratiba60.0
17 March 202412:15Guaratiba59.2
17 January 202411:45Guaratiba59.2
16 March 202410:30Guaratiba59.1
21 March 202414:00Guaratiba59.1
17 March 202411:45Guaratiba59.0
16 March 202411:15Guaratiba59.0
10°21 March 202413:00Guaratiba59.0
Disclaimer/Publisher’s Note: The statements, opinions and data contained in all publications are solely those of the individual author(s) and contributor(s) and not of MDPI and/or the editor(s). MDPI and/or the editor(s) disclaim responsibility for any injury to people or property resulting from any ideas, methods, instructions or products referred to in the content.

