Article

A Comprehensive Study on Winter PM2.5 Variation in the Yangtze River Delta: Unveiling Causes and Pollution Transport Pathways

1
Key Laboratory of Urban Environment and Health & Ningbo Observation and Research Station, Institute of Urban Environment, Chinese Academy of Sciences, Xiamen 361021, China
2
College of Resources and Environment, University of Chinese Academy of Sciences, Beijing 100049, China
3
Ningbo Key Laboratory of Urban Environmental Pollution Control, CAS Haixi Industrial Technology Innovation Center in Beilun, Ningbo 315830, China
4
Applied Modelling and Computation Group, Department of Earth Science and Engineering, Imperial College London, Prince Consort Road, London SW7 2AZ, UK
5
Beilun Branch of the Ningbo Municipal Bureau of Ecology and Environment, Ningbo 315800, China
*
Authors to whom correspondence should be addressed.
Atmosphere 2024, 15(9), 1037; https://doi.org/10.3390/atmos15091037
Submission received: 19 July 2024 / Revised: 15 August 2024 / Accepted: 26 August 2024 / Published: 28 August 2024

Abstract

:
To thoroughly investigate the impact of meteorological conditions and emission changes on winter PM2.5 variation in the Yangtze River Delta (YRD) from 2015 to 2019, we leveraged advanced modeling techniques, namely, the Weather Research and Forecasting (WRF) model and the Nested Air Quality Prediction Model System (NAQPMS). The results revealed that a notable trend of high-PM2.5-concentration regions shifted from coastal areas towards to the inland regions. While emission reduction can effectively reduce the concentration of PM2.5, meteorological changes exert a significant impact on PM2.5 concentration. Unfavorable meteorological changes in 2018 and 2019 emerged as crucial factors driving PM2.5 pollution in the region (up 0~50 µg·m−3). Our findings also shed light on the potential sources and transport pathways of PM2.5 pollution in key cities within the YRD, indicating that the coastal channel of Hebei–Shandong–Jiangsu and the inland channel bordering Hebei, Henan, Shandong, and Anhui serve as major contributors. Light and moderate pollution was predominantly influenced by the medium-distance coastal channel (48~70%). Remarkably, short-distance inland (19~54%) and coastal transportation (33~53%) channels emerged as the primary causes of severe PM2.5 pollution in the YRD. To effectively combat this issue, it is imperative to bolster key control and prevention measures in these regions.

1. Introduction

With the development of society and the economy, the acceleration of urbanization, the population growth, and the adjustment and transformation of the energy structure, China’s air pollution, dominated by fine particulate matter (PM2.5), has become increasingly prominent and severe [1,2,3], drawing growing attention. Air pollution in China exhibits regional characteristics influenced by the local pollution emissions and trans-regional pollution transmission [4,5,6,7,8], leading to adverse effects on human health, production activities, atmospheric visibility, and climate change [9,10,11,12,13,14,15,16]. The spatiotemporal variation in atmospheric pollutants is primarily influenced by anthropogenic emissions and meteorological conditions. Pollution events are prone to occurring under stable weather conditions, temperature inversion, and high humidity [17,18,19,20]. Regional air pollution is caused by the combination of excessive anthropogenic emissions (the internal cause) and unfavorable meteorological conditions (the external cause) [21,22,23,24,25,26]. Especially in winter, high emissions and meteorological changes often lead to PM2.5 pollution. Regional meteorological changes affect the transport and dispersion of pollutants [25], which are important factors leading to the formation of severe pollution [27,28,29]. Chen et al. [30] conducted an analysis of PM2.5 sources during the typical heavy pollution period in Beijing and showed that unfavorable meteorological factors are important reasons for pollution accumulation. High relative humidity contributed to the increase in the hygroscopy and concentration of PM2.5. As pollution levels increased, the contribution of external areas increased from 42.9% to 67.4%. Zhang et al. [31] analyzed the impact of meteorological changes on the reduction in PM2.5 concentration in key areas of China from 2013 to 2017. In winter, the PM2.5 concentration increased by 40% to 100% compared to other seasons. Xu et al. [32] quantitatively analyzed the impact of meteorological and emission changes on PM2.5 pollution based on the WRF-CMAQ (Community Multiscale Air Quality) model; the decrease in pollution emissions was the decisive factor in reducing PM2.5 pollution. Lu et al. [33] quantitatively analyzed the impact of meteorological and emission changes on PM2.5 during the COVID-19 outbreak using the WRF-CMAQ model. The increase in PM2.5 concentration during the strict control period was primarily caused by adverse meteorological conditions. Qiu et al. [34] studied the impact of meteorological changes on PM2.5 concentration in the Beijing–Tianjin–Hebei (BTH) region based on the WRF-Chem model, and they found that changes in the meteorological field led to an increase in PM2.5 concentration during the COVID-19 control period in 2020. Against the backdrop of relatively stable emission reductions, meteorological changes were an important factor affecting the spatial distribution of air pollution.
The Yangtze River Delta (YRD) region is the most densely populated and economically developed area on the eastern coast of China. The overall terrain is relatively flat [35]; the north is mostly low-altitude plain and dense urban areas, with low vegetation coverage. Human production activities have a great influence on the environment. In the southern mountains, with a high forest coverage rate, the atmospheric environment is less affected by human activities. Relevant studies [5,36,37,38] have shown that PM2.5 pollution is still severe in winter in the YRD. According to the statistical distribution of PM2.5 pollution days in January, February, and December from 2015 to 2019 in the YRD’s cities (Figure 1), PM2.5 pollution has gradually improved, but the overall level of air quality still remains poor. Compared to February and December, PM2.5 pollution in January was relatively heavy, especially in the northwest region of the YRD (Anhui and western Jiangsu). The number of pollution days could exceed 14 days, and in the northernmost region, urban pollution days could even exceed 20 days. Therefore, PM2.5 data for January in the YRD from 2015 to 2019 were selected for this study. The NAQPMS model was used to simulate the characteristics and causes of PM2.5 pollution in the YRD during this period, and to quantitatively assess the impact of meteorological changes and pollution emissions on PM2.5. Combined with backward trajectory clustering, this study aims to analyze the potential pollution sources and transport pathways of major cities under different PM2.5 pollution levels, in order to continuously improve air quality in the YRD, reduce PM2.5 concentration, enhance pollution prevention and control capabilities, and provide a scientific theoretical basis for the formulation of air pollution prevention and control paths and regional joint prevention strategies.

2. Materials and Methods

2.1. Database Sources

The urban air quality data for the YRD were taken from China’s historical air quality data (https://quotsoft.net/air/ (accessed on 1 January 2023)). The analysis periods were chosen from 2015 to 2019 in January, and the data’s temporal resolution was 1 h. The model initial and boundary meteorological fields used the global final analysis data with a 1° × 1° spatial resolution and 6 h temporal resolution (http://rda.ucar.edu/datasets/ds083.2/ (accessed on 1 January 2023)) provided by the NCEP (National Center for Environmental Prediction). To ensure the reliability of the data and maintain the continuity of the time series, we mainly conducted checks for missing values and outliers on the dataset. The k-nearest neighbors interpolation method was employed to address missing values within the dataset. Outliers were identified and corrected according to changes in the adjacent data. Different PM2.5 pollution levels were analyzed according to the technical regulations of China’s environmental air quality index (HJ6J33-2012) [39].

2.2. Study Area and Model Settings

The NAQPMS model is a multi-pollutant, multi-process, and multi-scale air quality simulation system [40,41,42,43] independently developed by the Institute of Atmospheric Physics, Chinese Academy of Sciences. The model is based on the design concept of “one atmosphere” and adopts the three-dimensional Euler transport model. The horizontal direction is based on the multiple nested grid of the WRF model, and the vertical direction follows the Earth’s coordinate system. The model includes the emission of atmospheric composite pollutants and their precursors, regional transport, chemical conversion, and dry/wet deposition reaction processes, including physical transport modules, as well as aqueous-phase, gas-phase, and heterogeneous-phase spatial convective diffusion of pollutants [44,45]. The model realizes multi-scale and multi-species simultaneous parallel computing, and its gas-phase chemistry adopts the Carbon Bond Mechanism Z (CBM-Z) [46], including 71 species and 176 chemical reactions. The aqueous-phase chemistry and inorganic aerosol chemistry adopt the improved mechanisms of the second-generation Regional Acid Deposition Model (RADM2) and ISORROPIA1.7 mechanisms [47], respectively. Considering the effects of the precursors of anthropogenic and biological activity emissions, the formation of secondary organic aerosols uses the calculation scheme of Odum et al. [48]. In terms of natural aerosols, the NAQPMS model adopts the dust and sea salt production mechanisms developed by Luo et al. [49] and Athanasopoulou et al. [50], respectively, including 28 heterogeneous chemical reaction modules. In this study, the NAQPMS model adopts two layers of nested simulation areas, the coordinate system is Lambert projection, the upper and lower standard latitude lines are 23° N and 43° N, respectively, and the central longitude is (115° E, 33° N); the outer simulation area covers Central and Eastern China on 76 × 97 grids, with a horizontal resolution of 27 km; the inner simulation area includes the whole YRD and Zhengzhou, Wuhan, and Nanchang on 123 × 114 grids, with a horizontal resolution of 9 km. Considering the transmission of pollutants in the vertical direction of diffusion and pollution mainly concentrated on the surface, the model in the vertical direction was unequal divided into 12 layers, with 6 layers below 1000 m in order to more accurately simulate the spatial distribution characteristics of pollutants. More detailed model settings, descriptions, and the reliability of the model can be found in the literature [51,52].

2.3. Analysis Methods

2.3.1. Quantitative Analysis of the Impact of Meteorology and Emissions

Meteorological conditions and pollution source emissions have direct effects on the variation in PM2.5 concentration. We carried out a quantitative analysis of the impact of meteorological and emission changes on PM2.5 concentration. The analysis method was as described by Xu et al. [32,53]. This study took 2015 as the base year, and the specific calculation formula was as follows:
C m i j k = C s i j k C s 2015 j k
M e i j k = C m i j k C s 2015 j k × 100
where Cs2015jk is the simulated PM2.5 concentration in 2015, while i, j, and k represent the year, month, and region, respectively. Csijk is the simulated PM2.5 concentration, Cmijk is the effect concentration of PM2.5 relative to 2015, and Meijk is the degree of influence on PM2.5 concentration compared to meteorological change in 2015. Positive values of Cmijk and Meijk indicate that the meteorological conditions become poorer, while negative values indicate that the meteorological conditions have improved and are conducive to the reduction in PM2.5. According to the observed change in PM2.5 concentration, and after deducing the influence of meteorology on PM2.5 concentration, the influence of emission changes on PM2.5 concentration can be quantified.
R o i j k = C o i j k C o 2015 j k C o 2015 j k × 100
E e i j k = R o i j k M e i j k
where Co2015jk is the observed concentration of PM2.5 in the base year 2015, Coijk is the observed PM2.5 concentration, Roijk is the change rate of the observed PM2.5 concentration, and Eeijk is the degree of impact of emission changes on PM2.5 concentration. The impact of emission concentration changes on PM2.5 can be estimated by subtracting the PM2.5 concentration caused by the meteorological changes from the observed concentration of PM2.5.
C m e i j k = C o i j k × M e i j k
C e e i j k = C o i j k C m e i j k
where Cmeijk is the variation in PM2.5 concentration caused by meteorological changes, while Ceeijk is the variation caused by pollution emissions.

2.3.2. Backward Trajectory and Potential Source Analysis Method

To further explore the sources of PM2.5 pollution, we adopted the potential source contribution function (PSCF) method. In this study, we used the simulated meteorological field from the WRF-NAQPMS model to exhibit a high spatial and temporal resolution, so that we could calculate the backward trajectories using the high-precision weather field to accurately trace the sources of the air masses. The PSCF is the main method used in the HYSPLIT (hybrid single-particle Lagrangian integrated trajectory) model, which can effectively analyze the main transport paths and identify the regional potential sources, and has been widely used in many studies on the transport of air pollution [5,54,55,56,57,58]. In this study, the PSCF [59] was used to analyze the pollution sources. The PSCF is a conditional probability method used to analyze the pollution potential sources [6,60,61], investigating the relative magnitude of the potential contribution probabilities of different regions, based on the ratio of the number of pollution tracks (mijL) to the total number of all tracks (nijL) passing through the grid (i, j), and using the proportion of the grid pollution trajectory to reflect the potential impact on the pollution of the target city. The specific PSCF calculation formula for the grid (i, j) is as follows:
P S C F i j = m i j L n i j L
where L represents the index of the trajectory, mijL is the number of pollution trajectories passing through the grid (i, j), the pollution trajectory is judged according to the pollutants carried by air mass exceeding the pollutant threshold value (PM2.5 > 75 µg·m−3), and nijL is the total number of trajectories passing through the grid (i, j). Since distant regions may pass through fewer air mass trajectories, i.e., the nijL is small, this may lead to greater uncertainty in the calculation results. In order to reduce the uncertainty of the PSCF value in this case, an arbitrary weighted function Wij is introduced as a correction to enhance accuracy [54,62,63,64]. The grid (i, j) Wij is defined as follows:
W i j   = 1.00   ( n i j L > 80 )   0.72   ( 20 < n i j L 80 ) 0.42   ( 10 < n i j L 20 ) 0.05   ( n i j L 10 )  
W P S C F i j = P S C F i j × W i j
where WPSCFij is the potential source contribution factor after the introduction of the weight factor Wij. The larger the value, the greater the potential contribution impact probability of the grid (i, j) region to the receptor city, which indicates the main potential source [5,65]. Regions with the same PSCF value are qualitatively grouped as potential source areas; however, this does not indicate the pollution levels within the air mass, which are crucial for identifying significant source areas. Therefore, the CWT (concentration-weighted trajectory) method is applied, and the calculation formula is as follows:
C W T i j = 1 L = 1 M T i j L × L = 1 M C L T i j L
where CWTij is the average weighted concentration of the grid (i,j), M is the total number of trajectories passing through the grid (i, j), CL is the PM2.5 concentration observed upon the arrival of track L, and TijL is the residence time in the grid (i, j) by trajectory L. On average, higher values of CWTij imply that air parcels traveling over the grid (i, j) region would be associated with higher potential concentration and would have greater potential pollution influence on the target city. Similarly, to reduce the uncertainty caused when nij is small, the weight function Wij used in the PSCF analysis is also cited and named WCWT.

3. Results

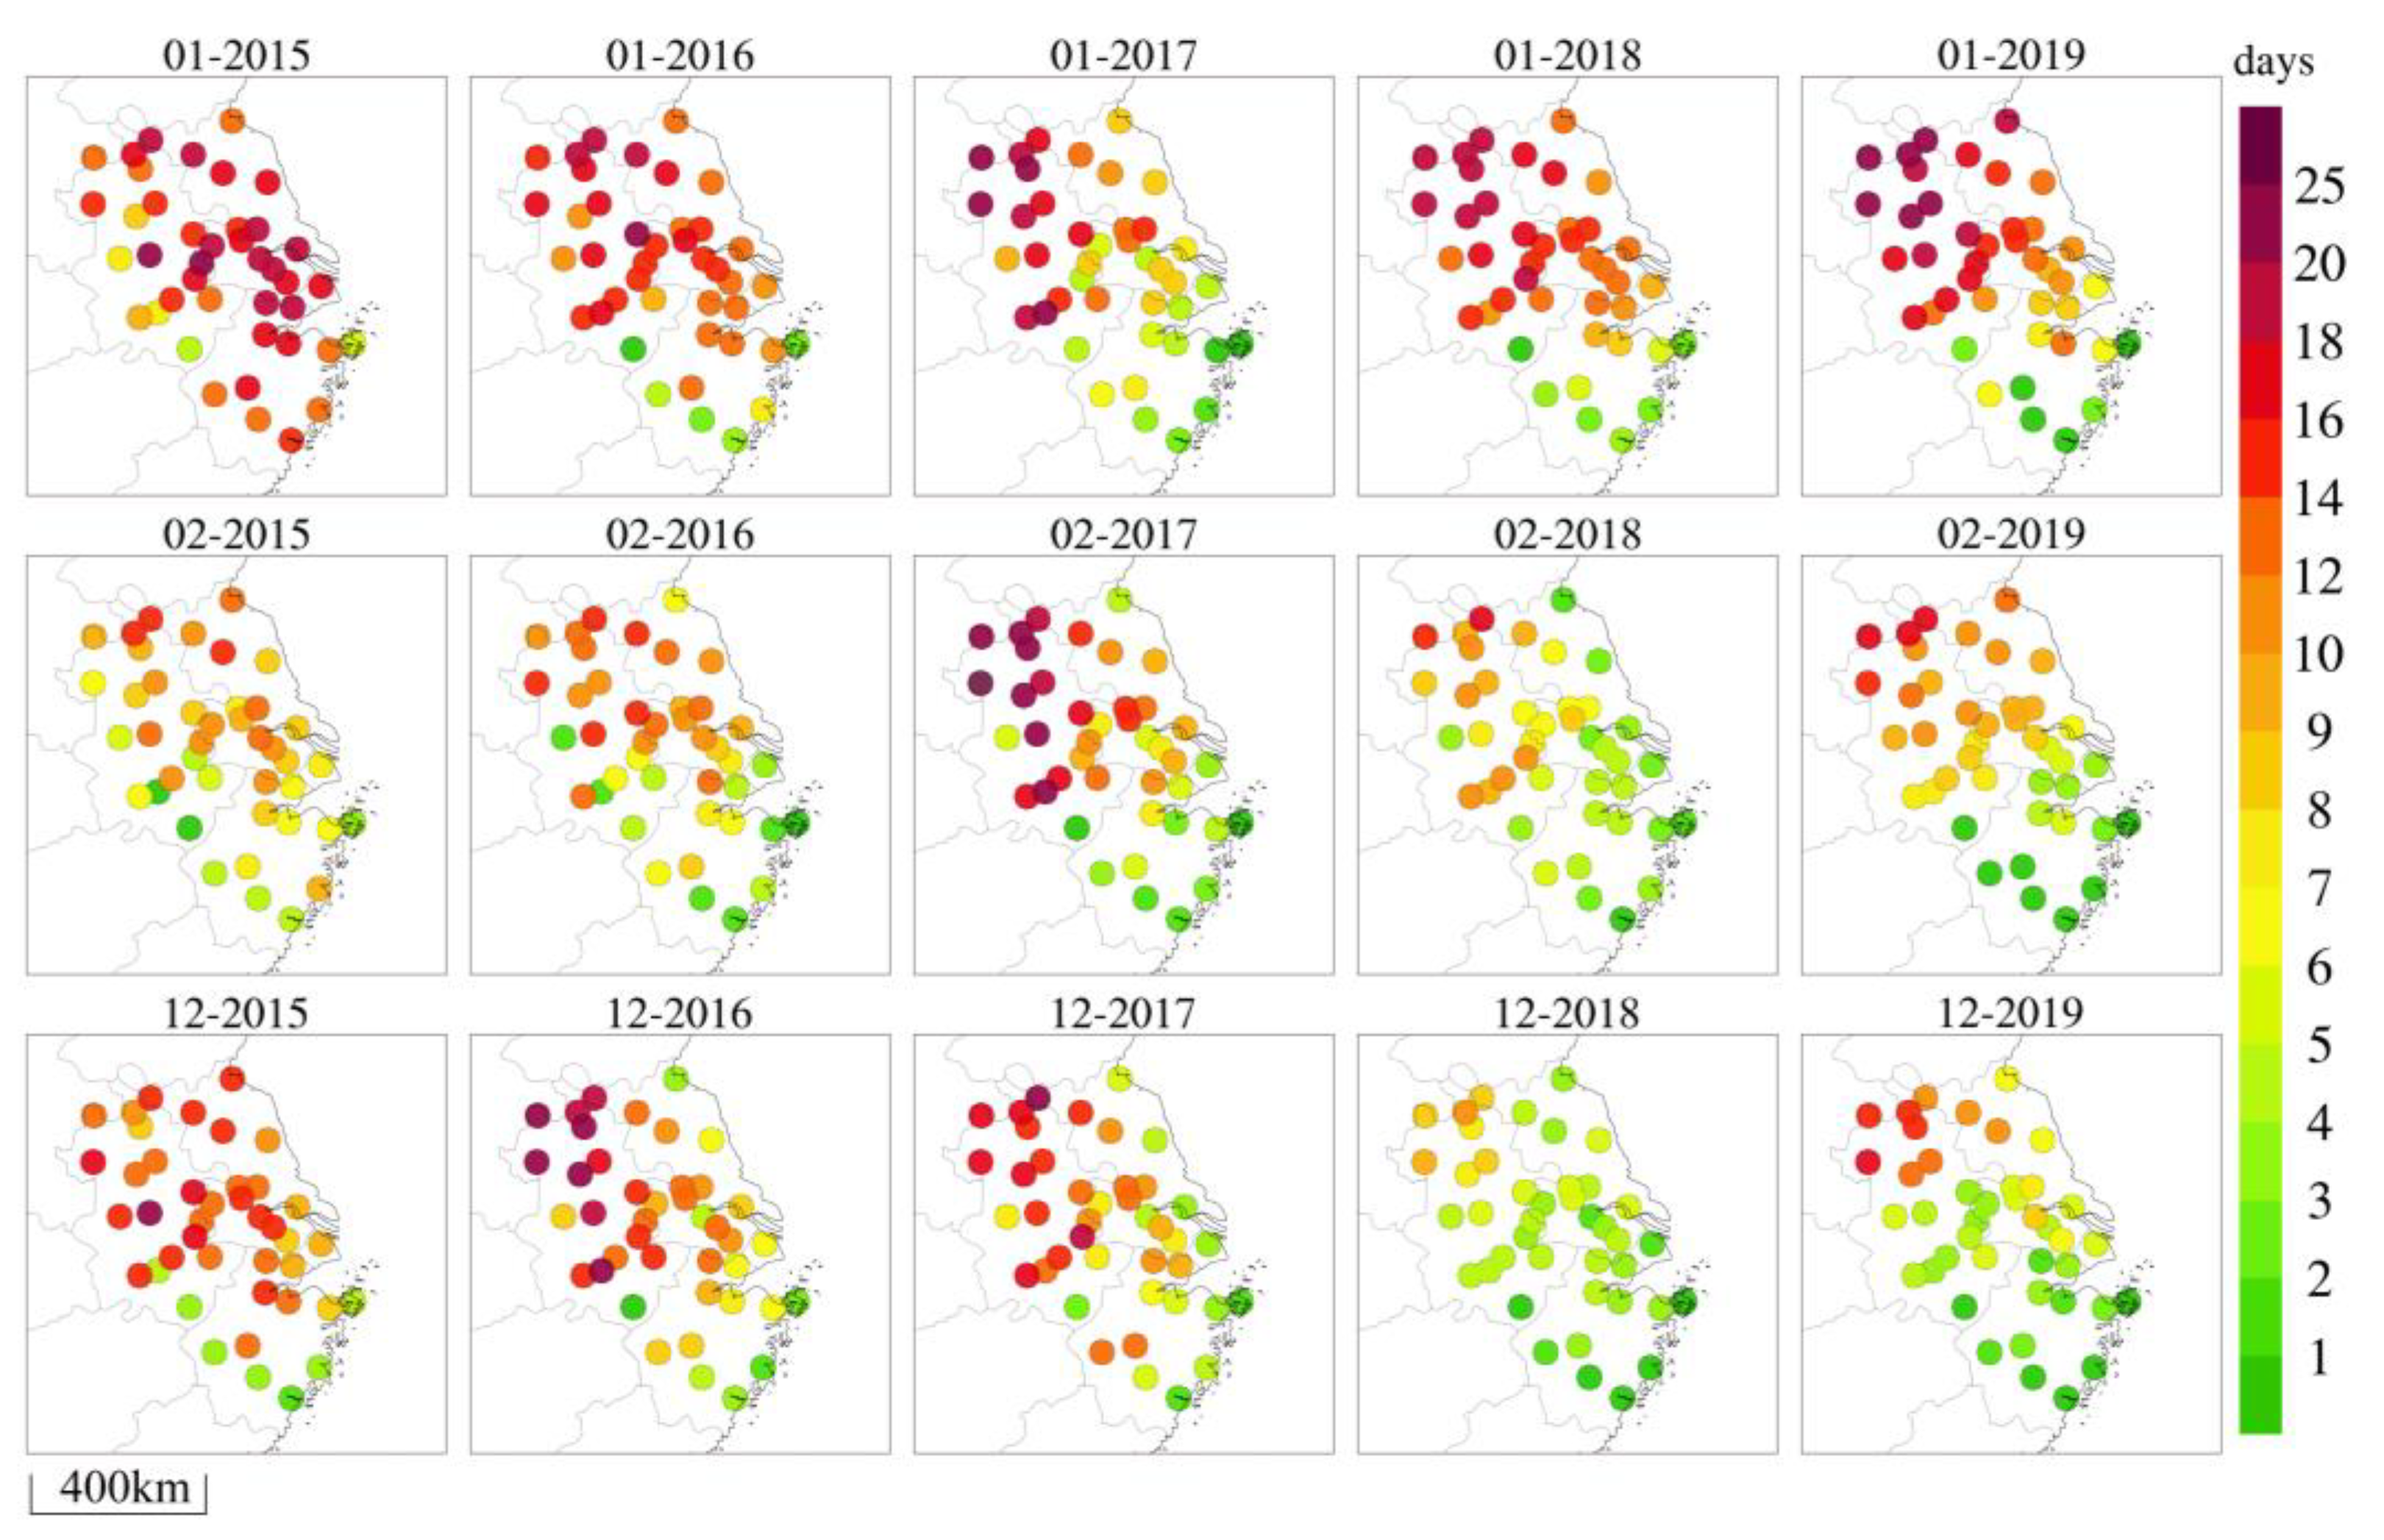
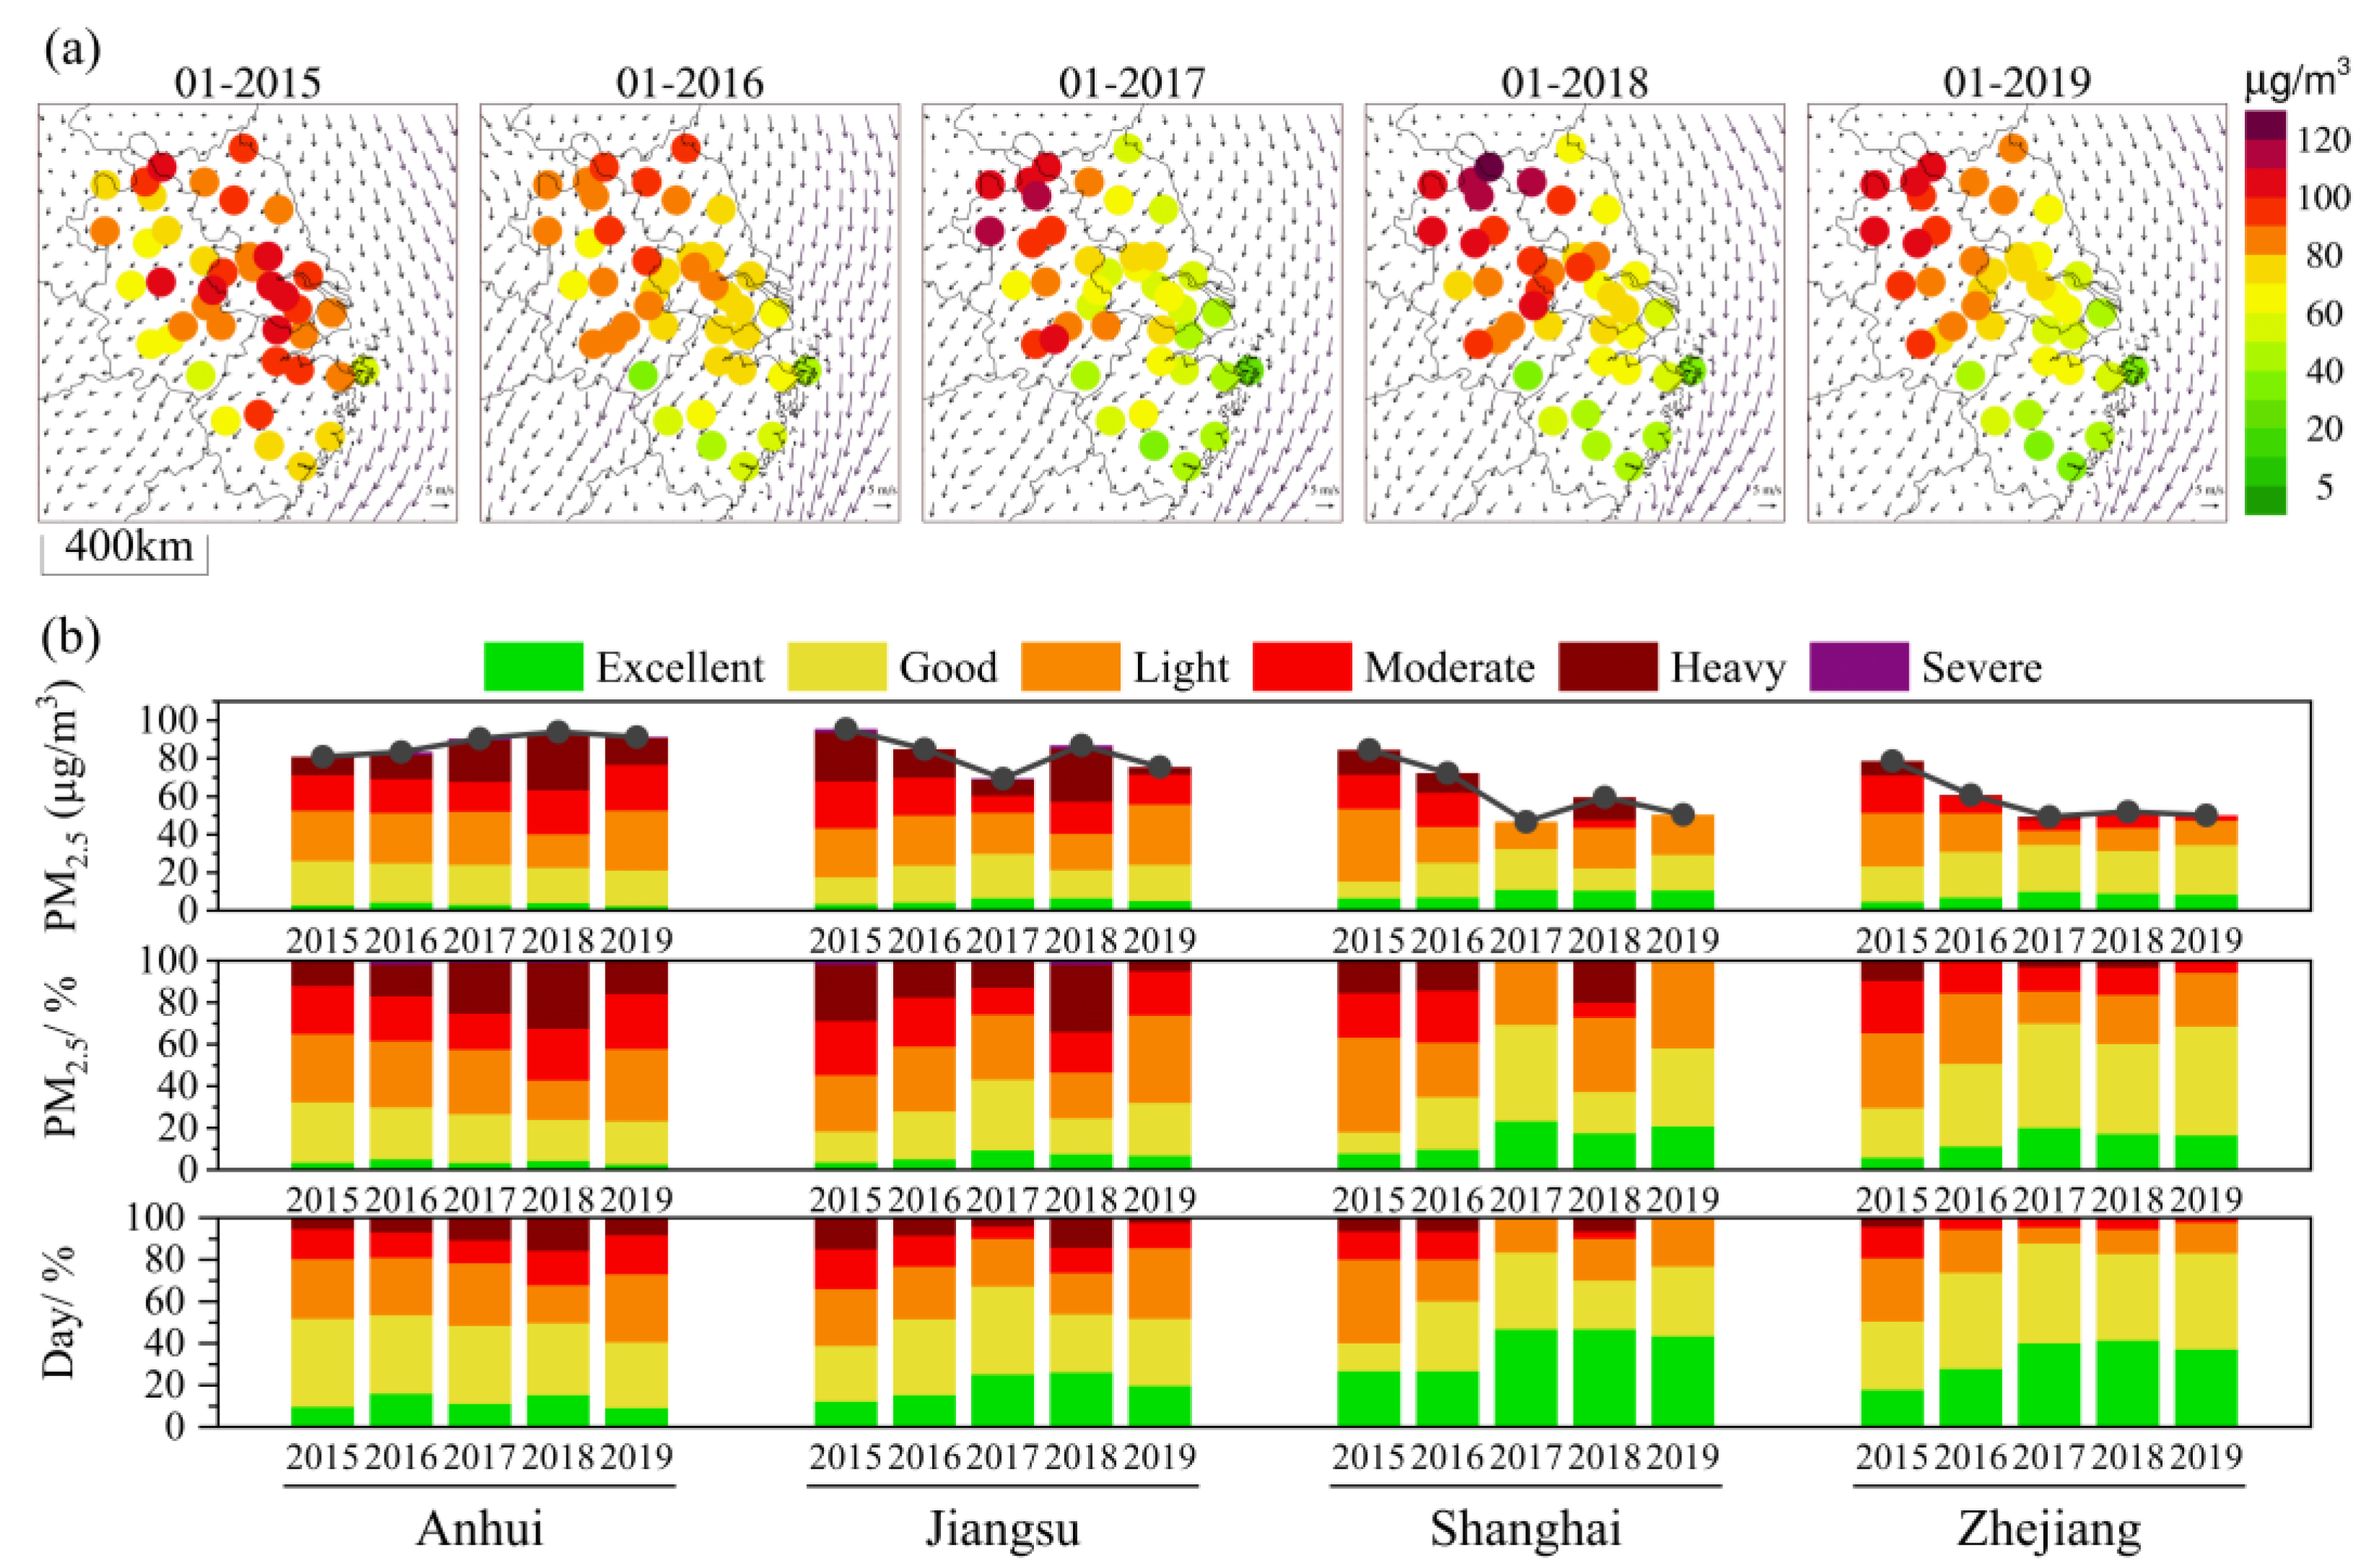
3.1. Variation Characteristics of PM2.5 Concentration in the YRD

In the YRD, the region of high PM2.5 concentration has shifted, with more pronounced differences in PM2.5 levels between inland and coastal areas (Figure 2a). In the YRD’s urban agglomeration, the spatial PM2.5 concentration variations were lower in the south and higher in the north. Coastal cities were less polluted than those inland, and the pollution level of Zhejiang and Shanghai was generally lower than that of Jiangsu and Anhui. The trend of PM2.5 concentration variations was consistent with the findings of Huang et al. [38]. The PM2.5 concentration showed a significant improvement and a decrease in 2016 compared to 2015, especially in Shanghai and its surrounding areas. Moreover, the changes in wind field and the meteorological conditions in 2016 were conducive to the diffusion of PM2.5. In 2015, the central region of the YRD was mainly characterized by low wind and steady weather, while there was a strong northeast wind in 2016. From 2017 to 2019, the PM2.5 concentration in the eastern and southern parts of the YRD significantly improved, but the PM2.5 concentration in the northwestern YRD remained high. In the northern YRD, the wind field changes were also mainly a convergence zone of stable wind fields, which was not conducive to the outward transport and diffusion of PM2.5, causing the PM2.5 concentration to accumulate and resulting in pollution. On the whole, the PM2.5 concentration in the coastal areas of the YRD showed a gradually decreasing trend from 2015 to 2019, especially in Zhejiang and Shanghai. However, the PM2.5 concentration in inland regions increased from 2015 to 2019. The average PM2.5 concentration in the northwestern YRD remained high (>60 µg·m−3).
In Anhui, the PM2.5 concentration showed a continuous upward trend and remained high (>80 µg·m−3), and the pollution days accounted for a relatively high proportion (Figure 2b). Although the number of days of heavy pollution was small, the PM2.5 grade concentration was relatively high. In Jiangsu, the PM2.5 concentration decreased, but it rebounded significantly in 2018, with an increase in the number of pollution days and the contribution of PM2.5 grade concentration. In Shanghai, the PM2.5 concentration has decreased significantly, and the rebound in 2018 indicates that the heavy pollution concentration had a significant contribution. In Zhejiang, the PM2.5 concentration decreased overall and rebounded slightly from 2018 to 2019, and the contribution of grade concentration cannot be ignored during the reduction in the number of pollution days.
Overall, the region with high PM2.5 concentration in the YRD showed a trend from the coast (around Shanghai) to the inland regions (Anhui and western Jiangsu). In 2015, the spatial distribution of high PM2.5 concentration was mainly concentrated in Shanghai and the surrounding coastal areas. From 2016 to 2019, the concentration of PM2.5 in coastal areas decreased and improved significantly, while the concentration of PM2.5 in the inland areas of Anhui and northwest Jiangsu remained high, especially in Anhui, where the PM2.5 pollution increased instead of decreasing. The overall rebound of PM2.5 concentration in 2018 and 2019 may be attributed to the existence of obviously unfavorable meteorological conditions, resulting in the recovery of PM2.5 concentration and pollution in the YRD. The following sections will quantitatively assess the contributions of meteorological changes and pollution emissions to PM2.5 concentrations in cities within the YRD, based on numerical simulation results.

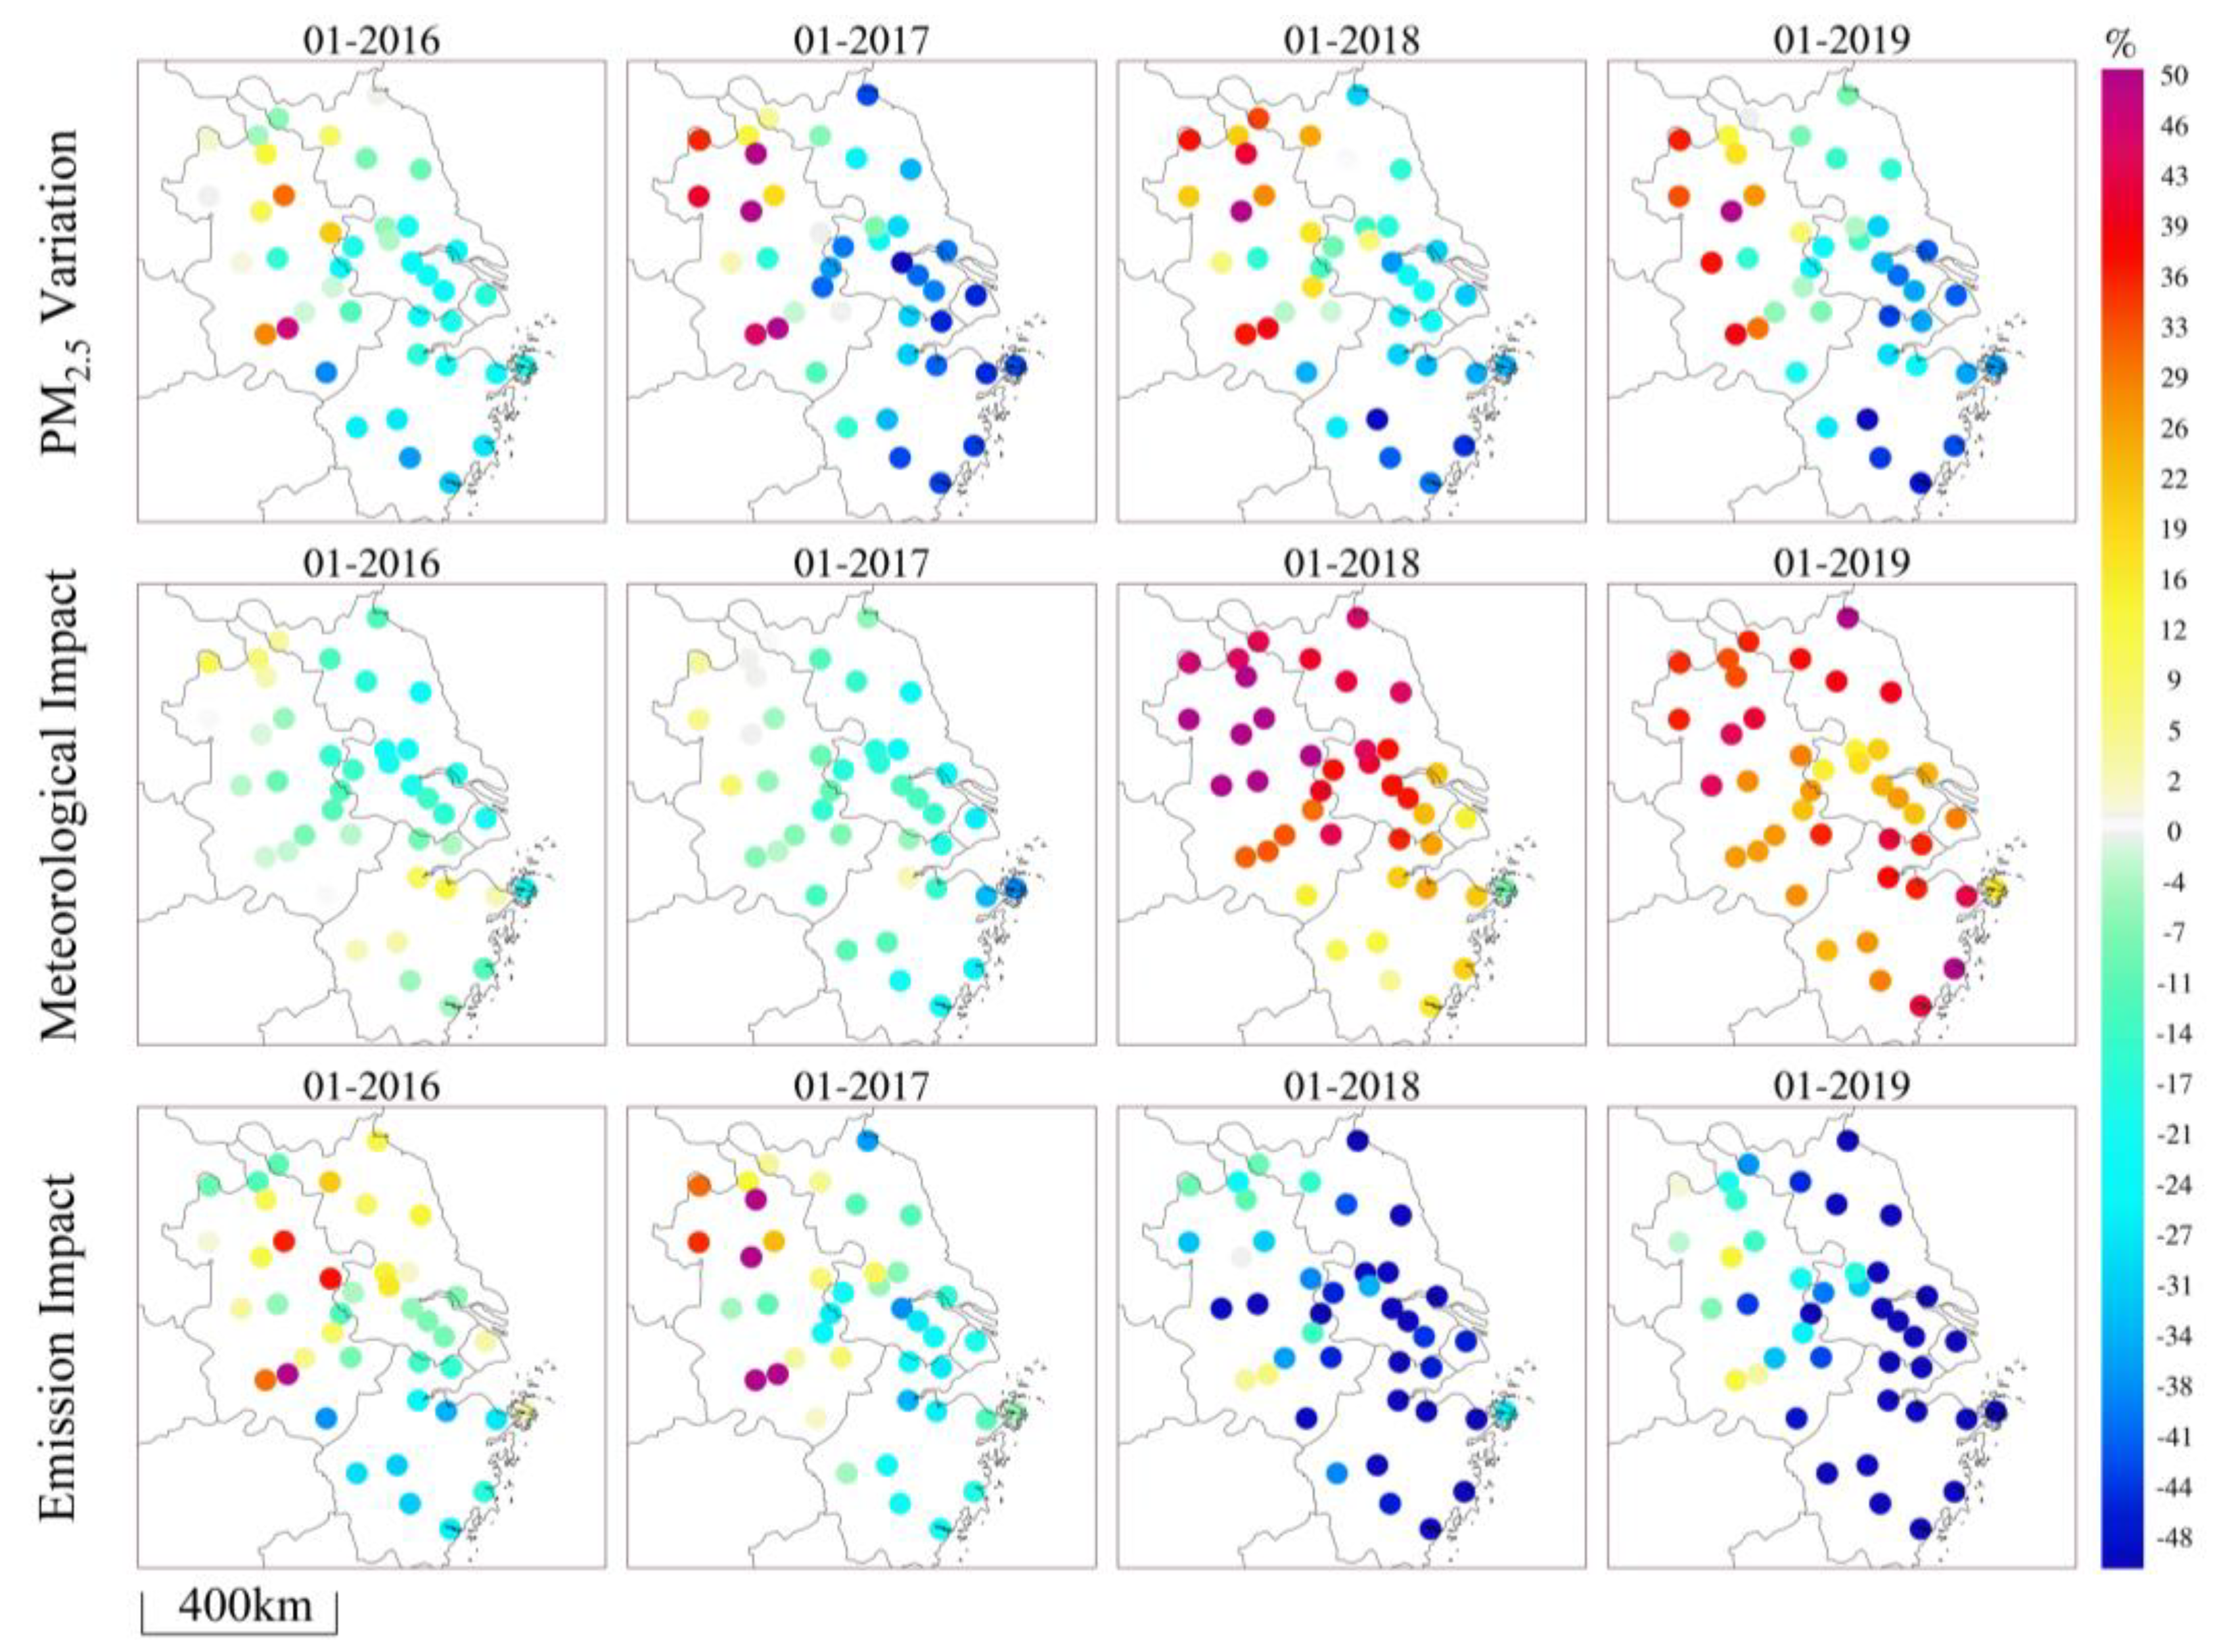
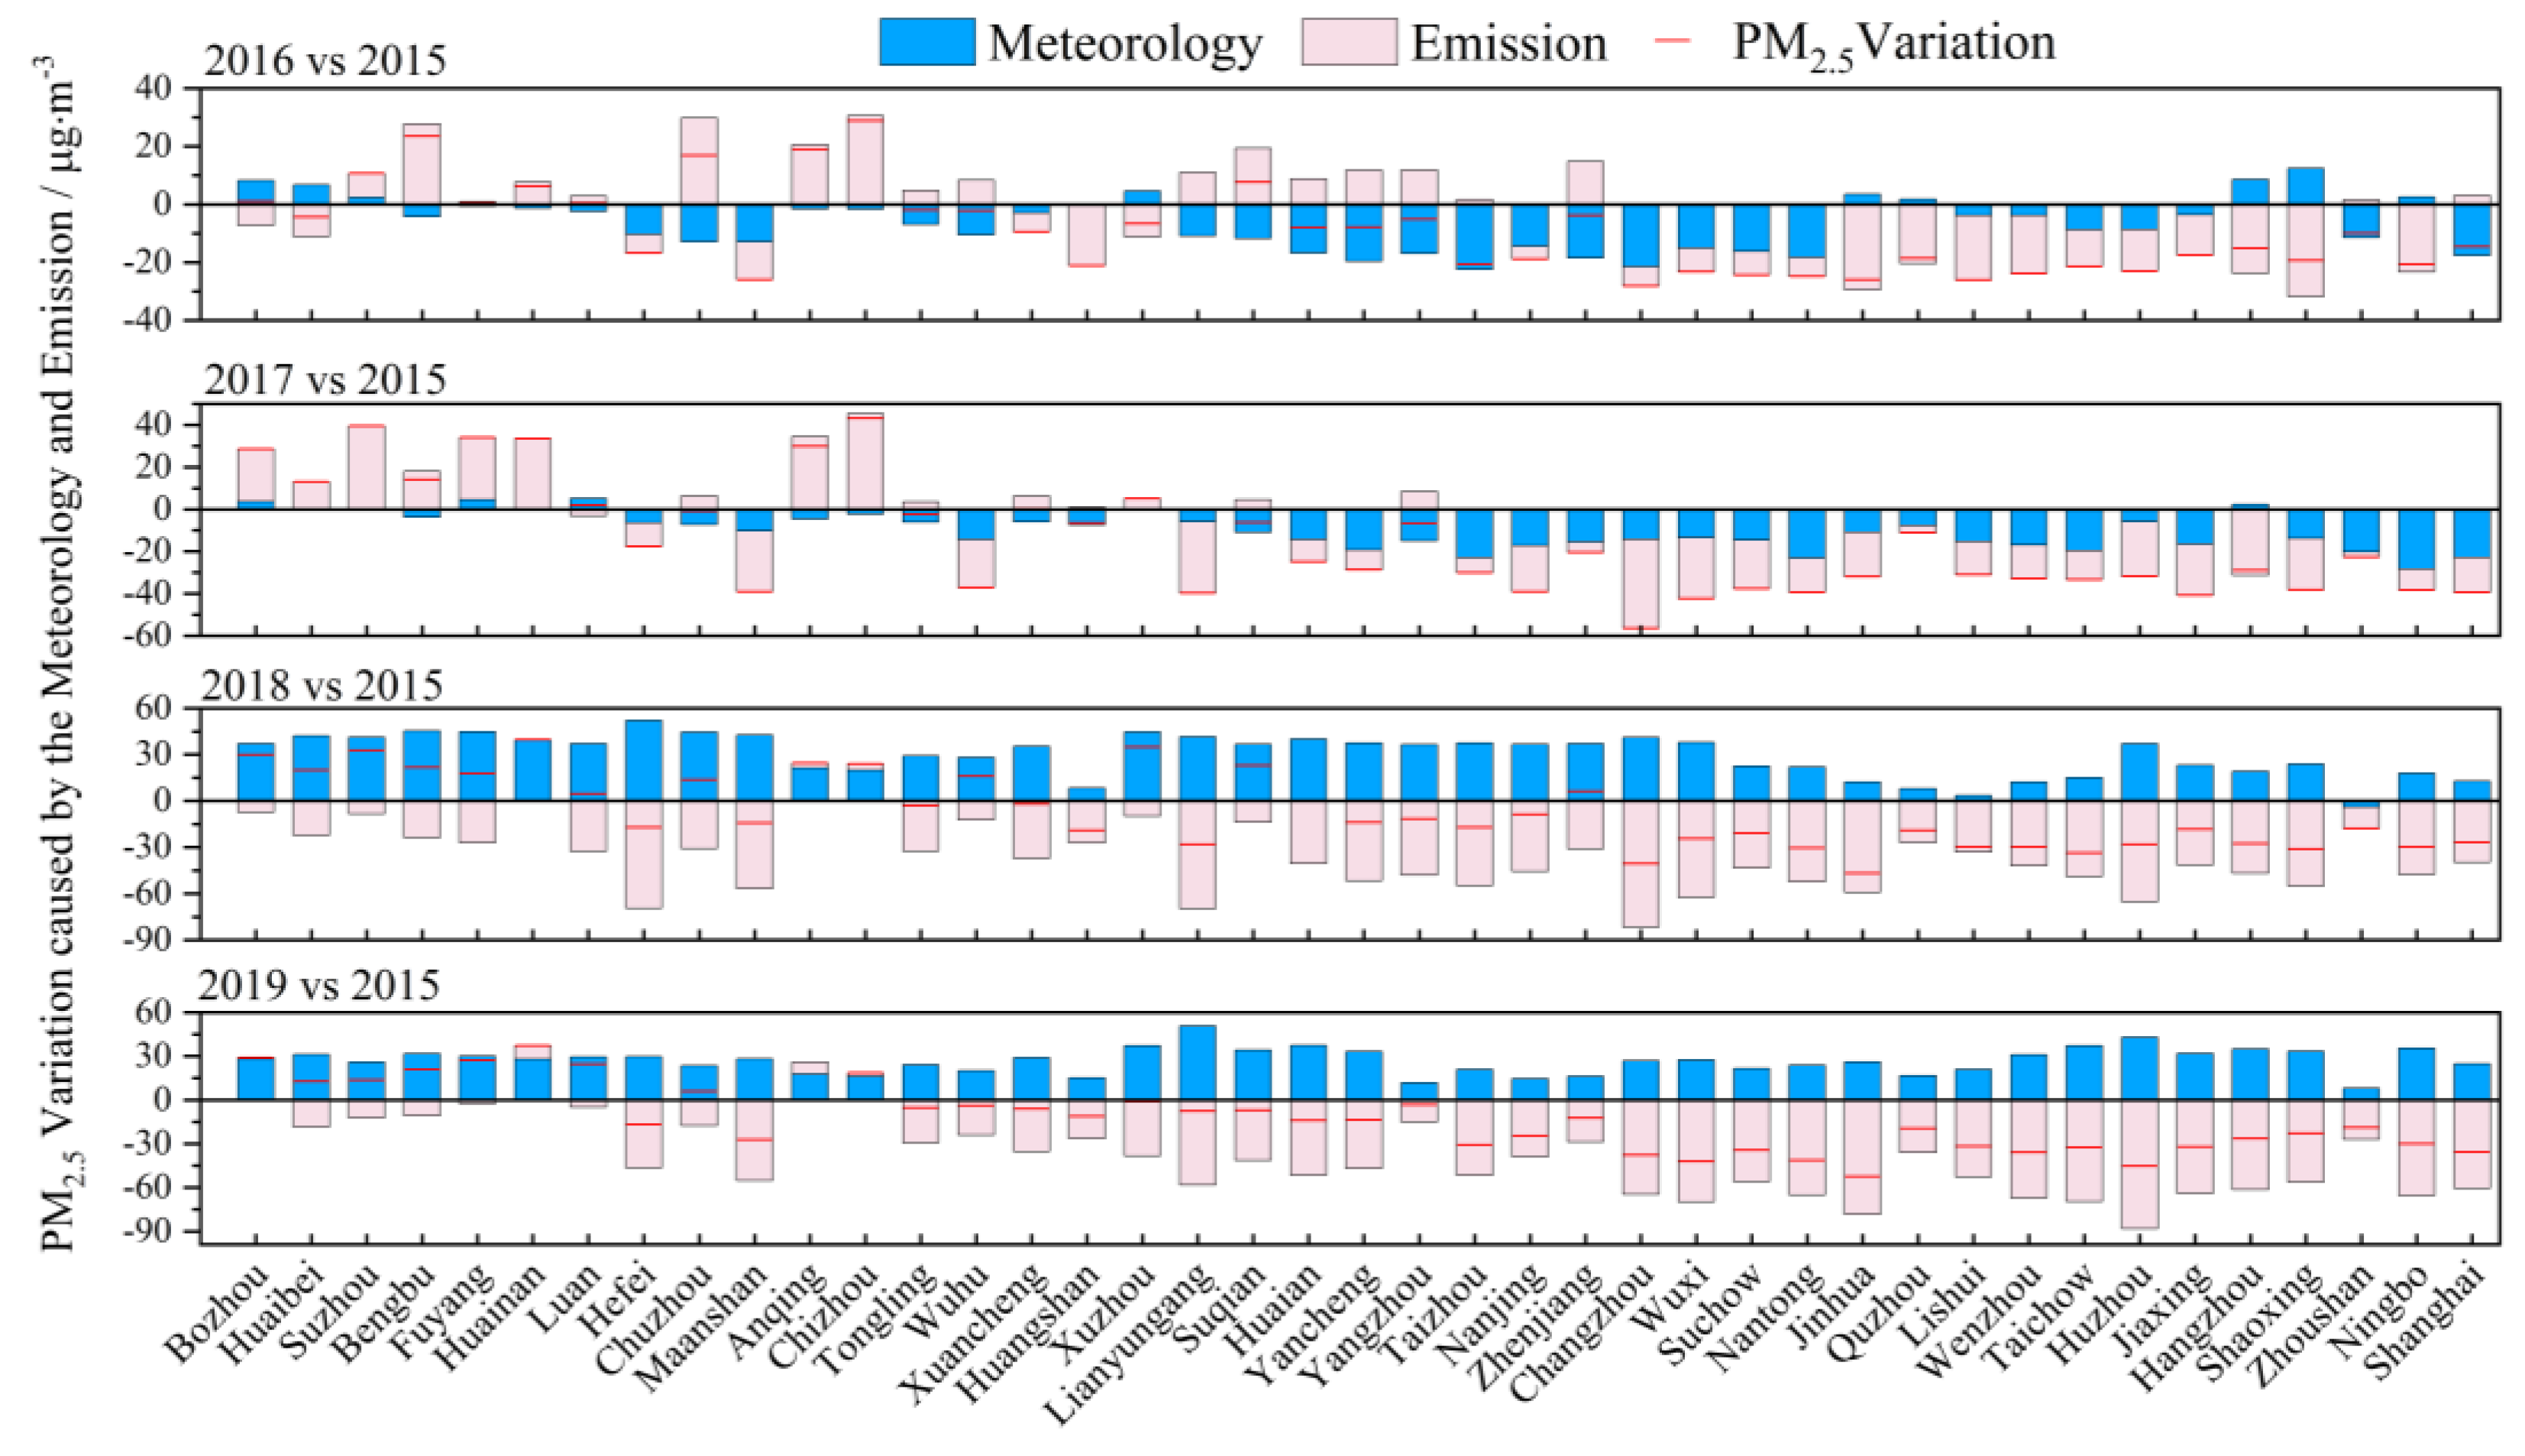
3.2. Impact Assessment of Meteorology and Emission Changes on PM2.5 Concentration

The PM2.5 concentration showed an overall trend of improvement and decline compared to 2015 (Figure 3). In Southeast China and the coastal areas of Jiangsu Province, the PM2.5 concentration decreased significantly, with the coastal regions of Zhejiang Province and the area around Shanghai experienced reductions exceeding 30%. However, the PM2.5 concentration in the northwest of the YRD did not improve; instead, it showed a worsening trend. Notably, in the northwest of Anhui, it increased by more than 30%. According to the assessment of the impact of meteorological changes on PM2.5 compared to 2015, the changes in meteorological factors in 2016 and 2017 were conducive to reducing the PM2.5 concentration by 0~20% in total. The worsening weather conditions in 2018 and 2019 were not conducive to the reduction in PM2.5 concentration, resulting in an increase of 0~40%. Overall, the influence of pollution emission changes on PM2.5 concentration showed a positive improvement trend. Except for 2016 and 2017, the pollution emissions in the northwest inland region of the YRD (Anhui) had an aggravating impact on PM2.5 concentration. In 2018 and 2019, pollution emissions’ effect on PM2.5 concentration in the YRD showed a decrease, especially in the coastal areas of Jiangsu Province, Shanghai, and Zhejiang.
In 2016 and 2017, the overall meteorological conditions were conducive to the reduction in PM2.5 concentration, and the reduction in PM2.5 concentration was more significant in Jiangsu, but less so in Anhui and Zhejiang (Figure 4). The pollution emission changes in the northern part of the YRD increased (<40 µg·m−3), while the emission reduction in southern Jiangsu and Zhejiang was significant (>−30 µg·m−3). In Anhui, emissions contributed to an increase in PM2.5 concentration, while in the rest of the region the PM2.5 concentration decreased. The weather in 2018 and 2019 was not conducive to the reduction in PM2.5 concentration, resulting in the contribution of PM2.5 concentration being between 0~50 µg·m−3. The change in pollution emissions led to a decrease in PM2.5 concentration in the YRD, especially in the coastal areas of Jiangsu, Shanghai, and Zhejiang, with a significant impact on emission reduction, affecting the PM2.5 concentration. The impact of emission reduction in Anhui was not obvious, leading to an increase in PM2.5 concentration under the comprehensive influence of meteorology. Overall, with the background of robust emission reduction measures, effective pollution control can significantly decrease PM2.5 concentrations. Adverse meteorological changes and regional pollution transport are key factors leading to the recovery of PM2.5 concentration and pollution in the YRD.

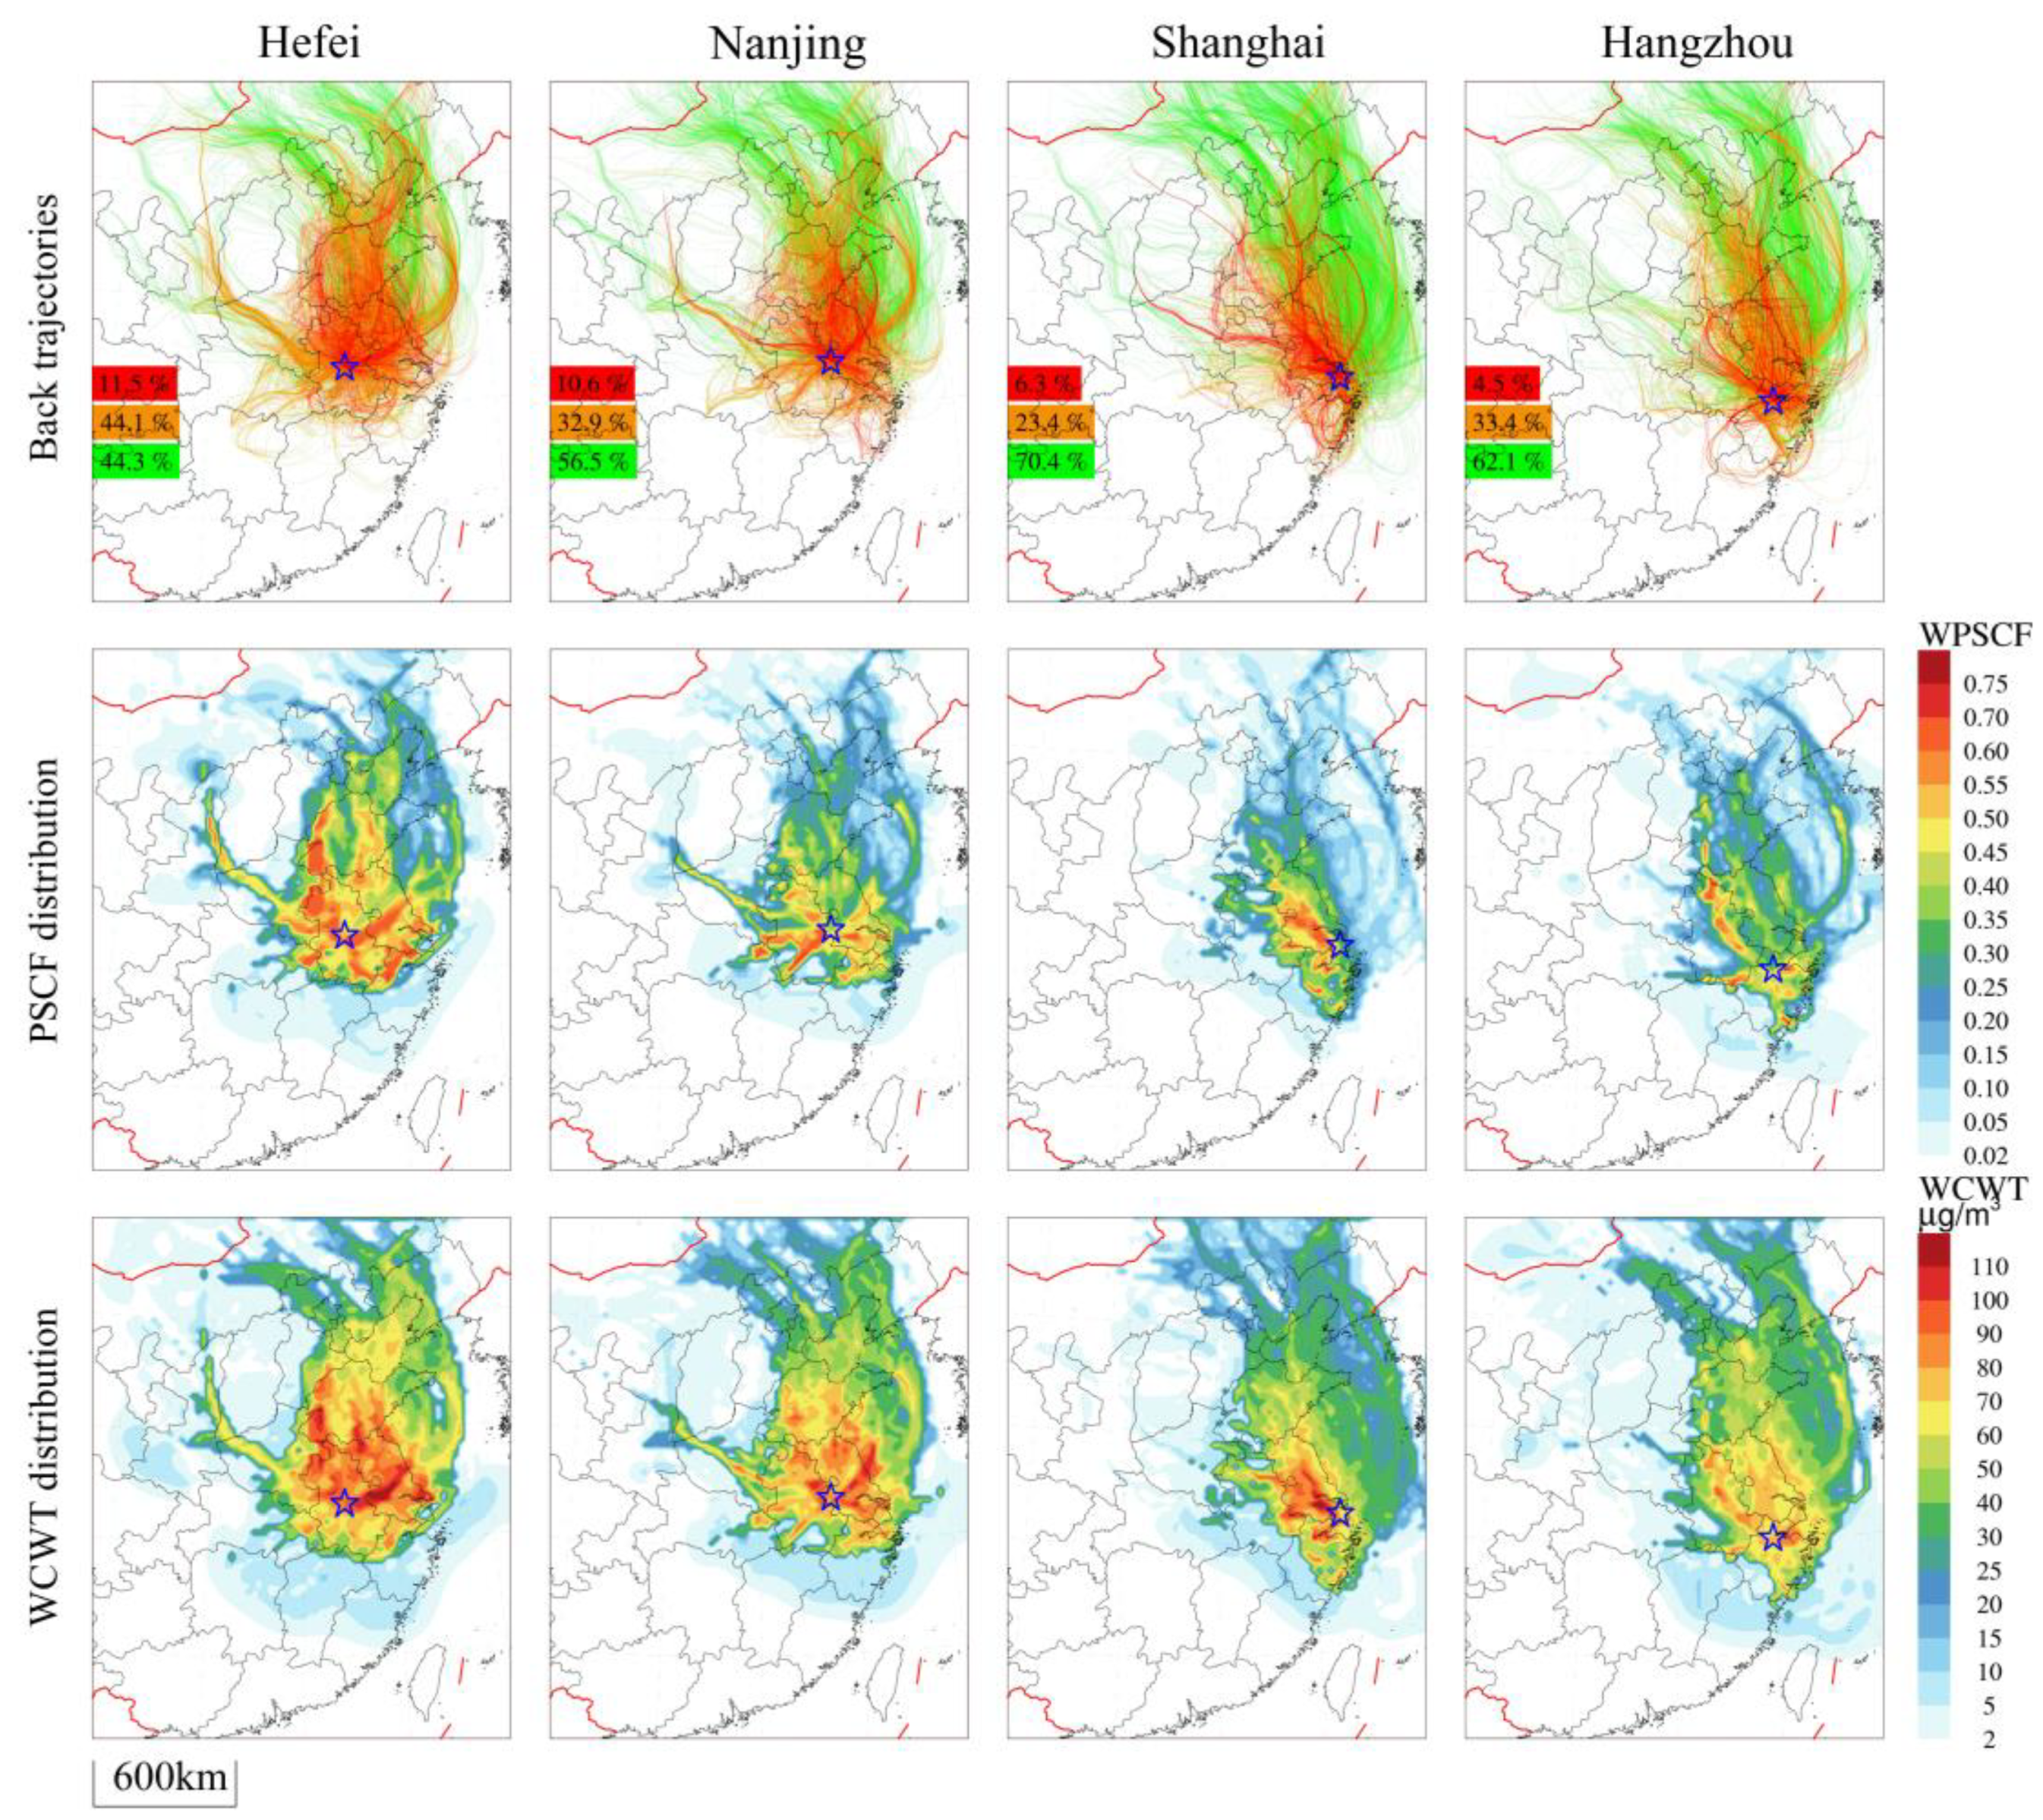
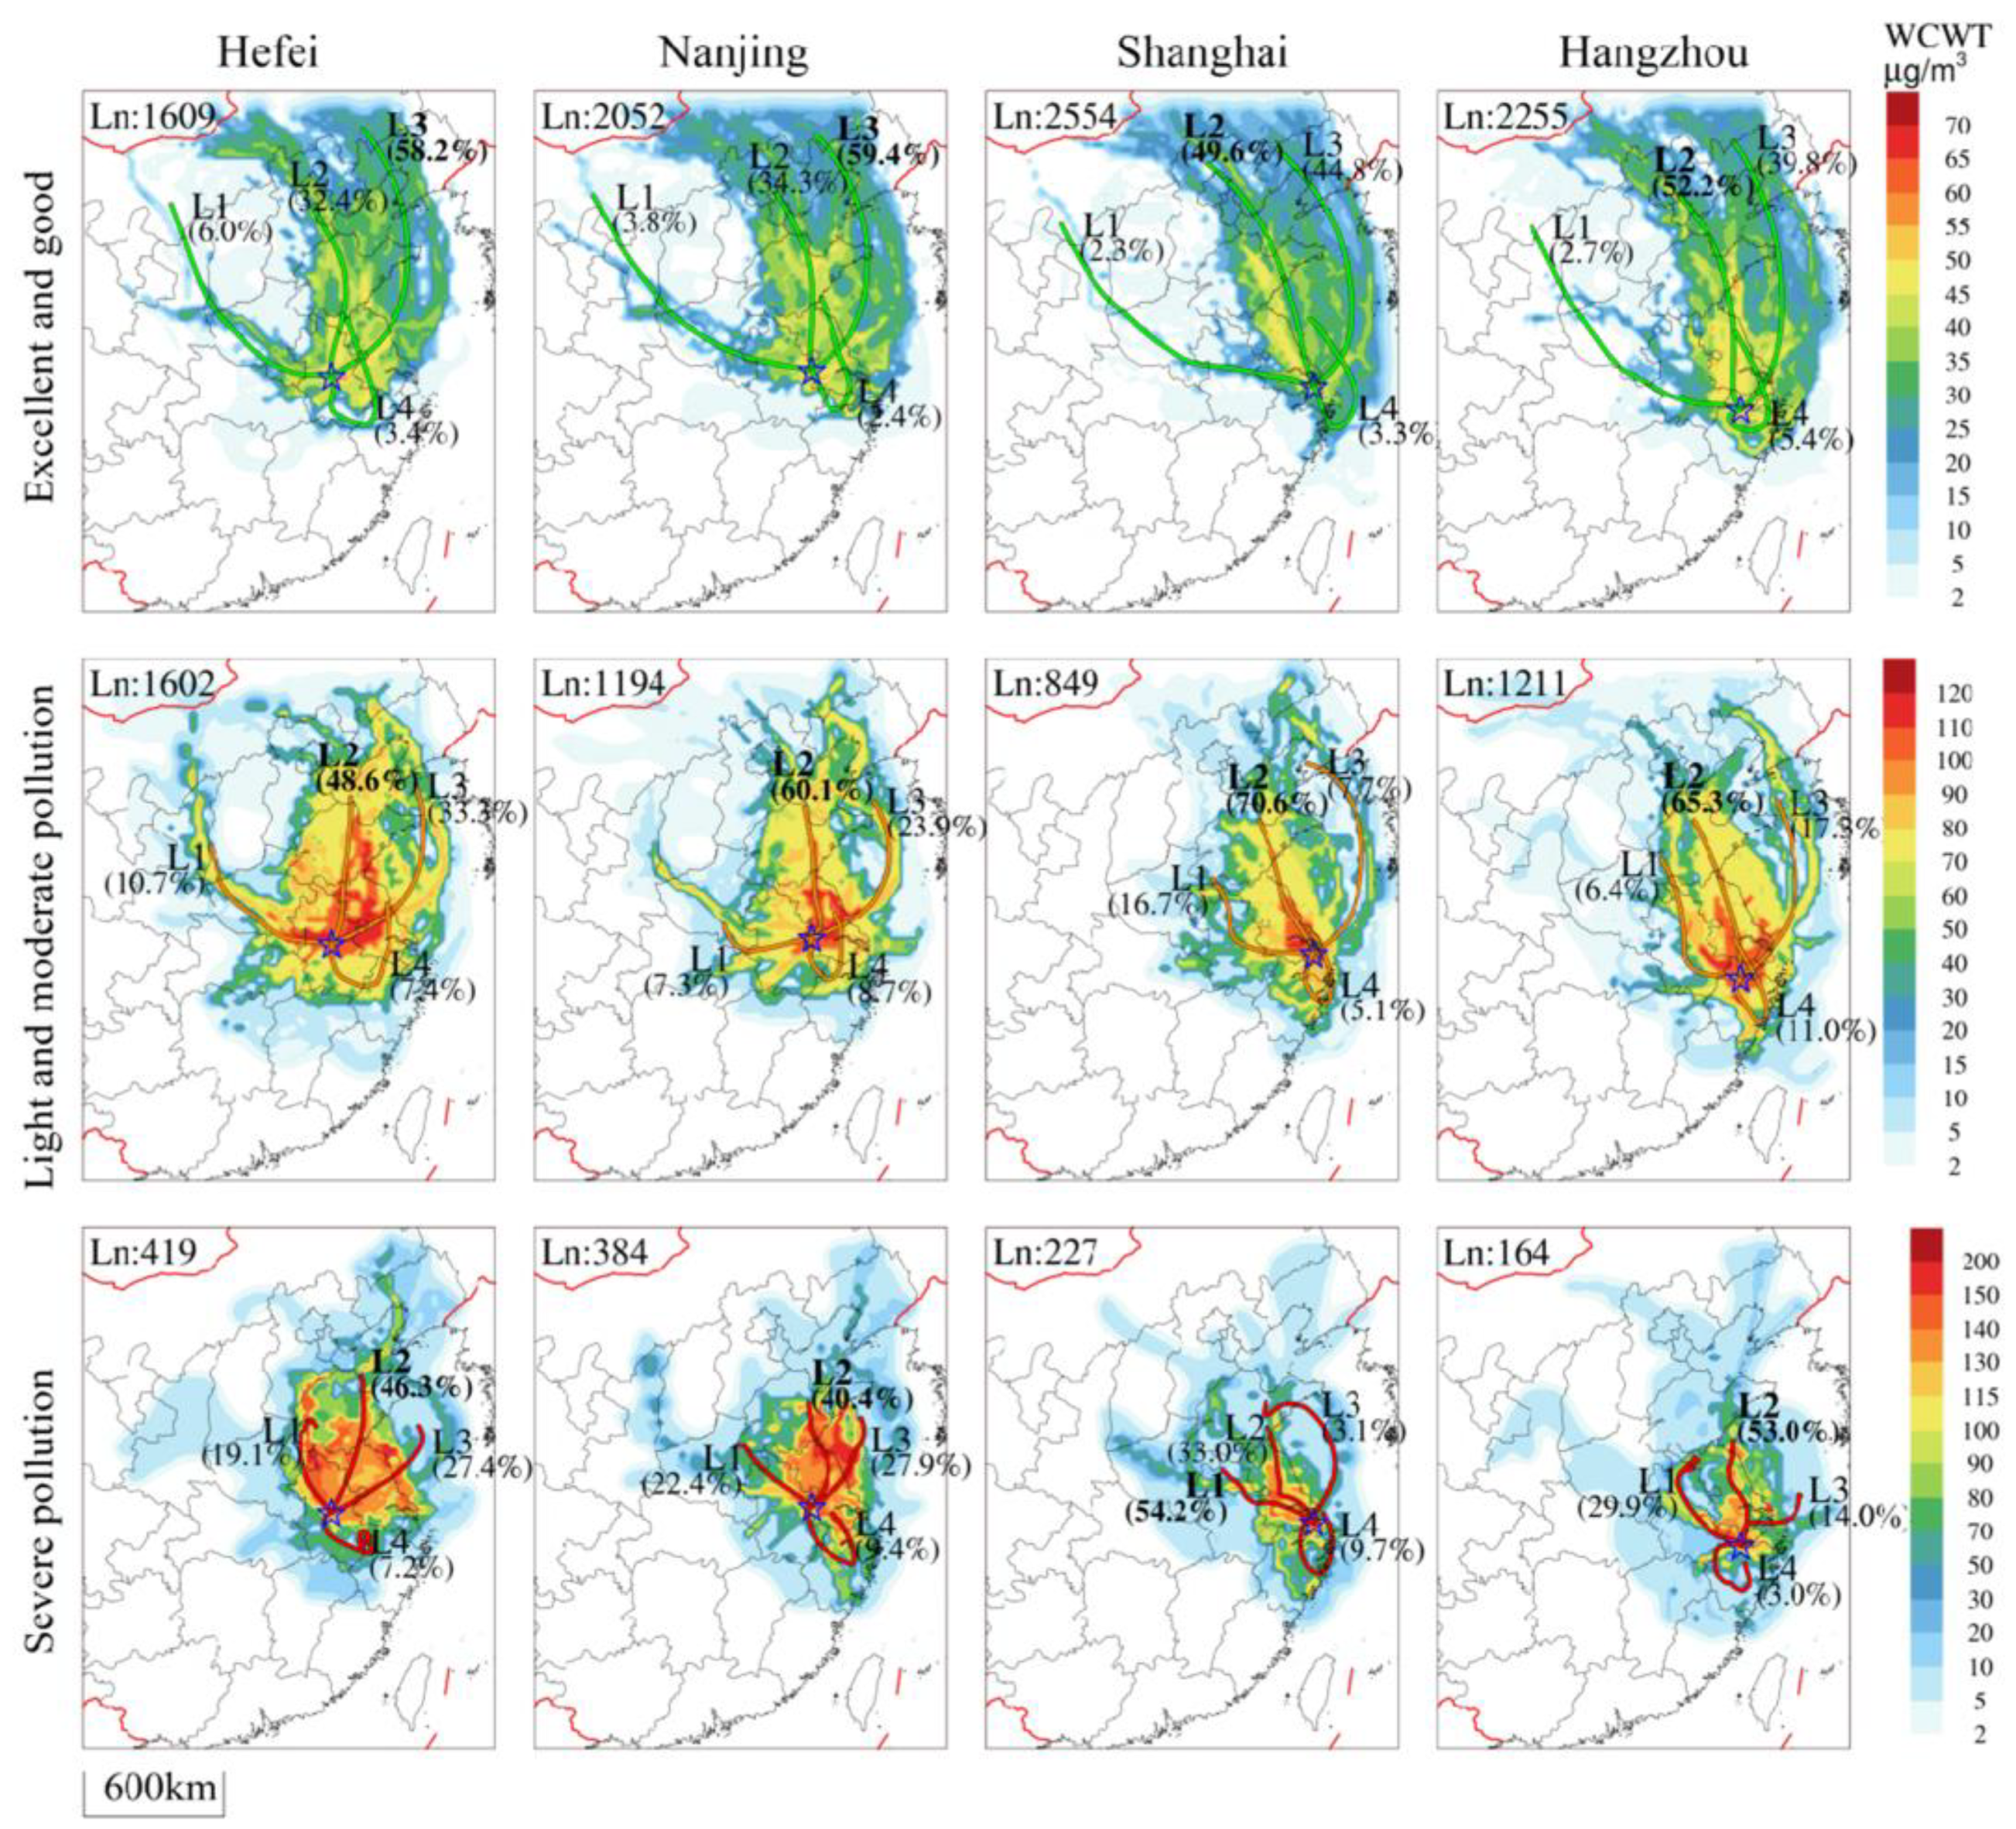
3.3. Pollution Potential Sources and Transport Pathways in Major Cities

The contribution of PM2.5 concentrations at different pollution levels was significant to the overall concentration, and the heavier the pollution, the larger the contribution (Figure 2b). Thus, we employed the meteorological field from the WRF-NAQPMS simulation to analyze the backward trajectories of air masses and potential sources. To comprehensively assess the long-term impact of the potential sources on the YRD and the pollution transport pathways, Hefei, Nanjing, Hangzhou, and Shanghai were selected as key representative cities to conduct PSCF and CWT analyses of all 72 h backward trajectories from 2015 to 2019 in January.
The air mass trajectories in the four cities predominantly originated from over the ocean, to the north and northwest of the YRD, while relatively fewer trajectories originated from or passed through the southern region (Figure 5). These trajectories were classified into clean trajectories (ρ (PM2.5) ≤ 75 µg·m−3, green), light and moderate pollution trajectories (75 µg·m−3 < ρ (PM2.5) ≤150 µg·m−3, orange), and heavy pollution trajectories (ρ (PM2.5) > 150 µg·m−3, red). In Hefei, the clean trajectories accounted for 44.1%, the heavy pollution trajectories accounted for 11.5%, and the PM2.5 pollution was the most serious. In Nanjing, the clean trajectories accounted for 56.5%, while the heavy pollution trajectories accounted for 10.6%, and the PM2.5 pollution was also relatively serious. In contrast, Shanghai and Hangzhou had clean trajectories accounting for 70.4% and 62.1%, respectively. Compared to the inland cities of Hefei and Nanjing, pollution was lighter.
The clean trajectories mainly came from the ocean and coastal areas, with fewer coming from inland, according to the trajectory levels’ distribution. The pollution trajectories of the YRD mainly passed through the BTH–Shandong–Jiangsu coastal regions and the Hebei, Henan, and Shandong border–Anhui inland regions. The regions with larger WPSCF values are marked with darker colors, indicating a greater proportion of trajectories that caused pollution and a greater potential impact of pollution on PM2.5 in the target city. In Hefei, the WPSCF high-value regions (≥0.6) were mainly located at the junction of Shandong and Hebei, in the middle and south of Shandong, in Fuyang to the north of Anhui, and extending from the middle of Jiangsu to Hefei. The WCWT high-value regions were mainly located at the junction of western Shandong and Hebei, central and southern Shandong, Anhui, and northern Jiangsu. In Nanjing, the WPSCF high-value regions were mainly located in Chuzhou, Bengbu, the southwest of Nanjing, and the southeast coast of Jiangsu. The WCWT high-value regions were mainly located in Nanjing and in the middle of Shandong, and Yancheng. In Shanghai, the WPSCF high-value regions were mainly located in Suzhou, Changzhou, and Taizhou of Jiangsu, as well as the northwest of Shanghai. The WCWT high-value regions were mainly located in western Shanghai, southwestern Jiangsu, Suzhou, and other areas. In Hangzhou, the WPSCF high-value regions were mainly located in the northwest of Hangzhou and Bengbu, Xuancheng, the east of Anhui, and the east and south of Hangzhou. The WCWT high-value regions were mainly located in the east of Hangzhou, central and southern Jiangsu, and the northwest of Hangzhou, Bengbu, and Xuancheng. Based on the identification of potential sources through PSCF and CWT analyses, the primary distribution of potential PM2.5 sources was observed at the southern end of the BTH region, along the border of Shandong, southeastern Henan, and eastern Hubei, as well as northern Anhui and the surrounding areas of southern Jiangsu and Shanghai.
To further explore the PM2.5 sources and the main pollution transmission pathways, we conducted trajectory clustering and corresponding WCWT analyses under excellent and good, light and moderate, and severe PM2.5 pollution in Hefei, Nanjing, Shanghai, and Hangzhou, in order to clearly analyze the transport sources and different channels of PM2.5 at different grades, summarize the main channels, and provide suggestions for the PM2.5 prevention paths. Therefore, there were four types of transportation channels (Figure 6), namely, L1 (inland channel), L2 (coastal channel), L3 (marine channel), and L4 (near local channel), according to the trajectories classified for the key representative cities in the YRD in the above context (Figure 5). In the clean pathways, the long-distance transport marine channel L3 had a relatively high proportion. The ocean effectively had no emission sources, and the air masses of marine channel L3 with the low-concentration PM2.5 and the fast transmission speed were conducive to the diffusion and concentration reduction of PM2.5 in the YRD.
In Hefei and Nanjing, representing inland cities, the clean air masses mainly come from the ocean channel L3 (accounting for 58.2% and 59.4%), with the low PM2.5 concentration in channel L3 transportation contributing to reducing and diluting the PM2.5 concentration. Coastal channel L2 (about 33%) contributed through BTH–Shandong–Jiangsu–Anhui long-distance transport. Inland channel L1 and local channel L4 accounted for less (<10%). For the light and moderate PM2.5 pollution, the primary transport pathways were coastal channel L2 (48.6%, 60.1%) and marine channel L3 (33.3%, 23.9%). The potential sources corresponding to the high WCWT values (>100 µg·m−3) were mainly located between the coastal channel L2 and the marine channel L3, with middle-distance transportation through Shandong, Jiangsu, and Anhui. These high-value WCWT areas have a large pollution effect on the passing air mass. For the heavy PM2.5 pollution in Hefei and Nanjing, the main transport source was coastal channel L2 (46.3% and 40.4%), while the influence of inland channel L1 was significantly enhanced (19.1% and 22.4%) as it was transported through the short distance between the border of Henan and Shandong–Anhui. In Hefei, the potential sources corresponding to the high WCWT values (>140 µg·m−3) were mainly located in the inland channel L1, followed by the regions between the coastal channel L2 and the marine channel L3. In Nanjing, the potential sources were mainly located between the coastal channel L2 and the marine channel L3.
In Shanghai and Hangzhou, representing the coastal cities, the clean air masses mainly came from the coastal channel L2 (49.6%, 52.2%), through the BTH–Bohai Sea–Shandong–Jiangsu long-distance transport, followed by the ocean channel L3 (44.8%, 39.8%). For the light and moderate PM2.5 pollution, the main pollution transport channel was the coastal channel L2 (accounting for 70.6% and 65.3%, respectively), which involved middle-distance transportation through Shandong–Jiangsu. The potential sources corresponding to the high WCWT values (>100 µg·m−3) of Shanghai were mainly located in the southern coastal areas of Jiangsu on the coastal channel L2, while those of Hangzhou were located in the adjacent coastal L2, marine L3, and inland L1 transport channels. For the heavy PM2.5 pollution in Shanghai, the main channel was the northwest inland channel L1 (54.2%), followed by the coastal channel L2 (33.0%). The potential sources corresponding to the high WCWT values were mainly located in Jiangsu between the inland L1 and coastal L2 channels. In contrast, for the heavy PM2.5 pollution in Hangzhou, the main pollution channel was the coastal channel L2 (53.0%), followed by the northwest inland passage L1 (29.9%). The main potential sources were mainly located in the inland L1 and coastal L2 transport channels.
In summary, the proportion of clean air masses in the coastal cities of Shanghai and Hangzhou accounted for 70.4% and 62.1%, respectively, while the proportion of heavy pollution trajectories was about 5%. In contrast, in the inland cities of Hefei and Nanjing, clean trajectories accounted for 44.3% and 56.5%, respectively, and heavy pollution trajectories accounted for about 10% (twice that of coastal cities), which was the main cause of the severe PM2.5 pollution. Conversely, coastal cities have a higher proportion of clean air masses and a lower proportion of heavily polluted air masses, which is an important reason for their lower PM2.5 concentrations. According to the trajectory clustering analysis of different PM2.5 pollution levels, the marine L3 channel was the main clean transport pathway for long-distance transport, which was conducive to the reduction in PM2.5 concentration in the YRD. The main PM2.5 pollution channels were the coastal channel L2, which passed through BTH–Shandong–Jiangsu, and the inland channel L1, which passed through Hebei, Henan, and Shandong boundary–Anhui. Light and moderate pollution were mainly affected by the middle-distance transport of coastal channel L2 (48~70%). As the relative proportion of L1 in inland channels increased, PM2.5 pollution became more serious. Short-distance transport in the inland channel L1 (19~54%) and coastal channel L2 (33~53%) was the main cause of heavy PM2.5 pollution in the YRD. In comparison, the PM2.5 pollution in the inland cities of Hefei and Nanjing was more serious, and it is necessary to strengthen the key control and prevention in the major potential pollution source locations and transportation channels.

4. Conclusions

January witnessed relatively severe PM2.5 pollution in the YRD. While PM2.5 pollution was mainly concentrated in and occurred in the southern coastal areas of the YRD in the winter of 2015, significant improvement was observed from 2016 to 2019. Nevertheless, high PM2.5 concentrations persisted in the inland areas of Anhui and western Jiangsu. Notably, our study highlights a striking trend: high-PM2.5-concentration regions shifted from coastal areas towards inland areas.
Our research underscores the effectiveness of emission reduction measures in reducing PM2.5 concentrations. However, it is essential to note that meteorological changes exert a significant influence on PM2.5 levels. Adverse meteorological conditions can offset the benefits of emission reduction, leading to an increase in PM2.5 concentration. The variations in meteorological conditions during 2018 and 2019 nullified the emission reduction efforts, resulting in an increase in PM2.5 concentration and pollution levels. Indeed, unfavorable meteorological changes and regional transport are key drivers of PM2.5 pollution in the YRD.
Furthermore, our study identified potential sources and transport channels at various levels of PM2.5 pollution in key cities throughout the YRD. The long-distance transport marine channel L3 emerged as the primary cleansing pathway, contributing to reduced PM2.5 concentrations in the region. The main channels of PM2.5 pollution were found to be the coastal channel L2 passing through Hebei–Shandong–Jiangsu and the inland channel L1 passing at the border of Hebei, Henan, and Shandong–Anhui. Light and moderate pollution mainly resulted from medium-distance transportation through the coastal channel L2 (48~70%). As the proportion of the inland channel L1 increased, the severity of PM2.5 pollution escalated. The transport through the inland channel L1 (19~54%) and the short-distance transport via the coastal channel L2 (33~53%) emerged as the primary causes of heavy PM2.5 pollution in the YRD. The results show the major potential sources in the southern part of Beijing–Tianjin–Hebei, southeastern Shandong, northern Anhui, and eastern Henan, while the main attention channels are the inland channel L1 and coastal channel L2, which may provide scientific reference for improving PM2.5 regional joint prevention and control and pollution transmission path control.
PM2.5 pollution remains a significant concern in inland cities such as Hefei and Nanjing. Consequently, intensifying key control and prevention measures in major potential source regions, such as the inland channel L1 along the border of Hebei, Henan, and Anhui, as well as the coastal channel L2 along the boundary of Shandong and Jiangsu, has become imperative. The implementation of the continuous air quality improvement action plan, issued by the State Council on November 30, 2023, emphasizes the gravity of pollution in the border regions of Jiangsu, Anhui, Shandong, and Henan, showcasing their significance as essential sources of pollution in the Yangtze River Delta (YRD) and Beijing–Tianjin–Hebei (BTH) regions. Furthermore, the expansion of the cities within the BTH and surrounding areas from “2 + 26” to “2 + 36” necessitates heightened pollution control and collaborative prevention efforts between the YRD and BTH regions.

Author Contributions

Conceptualization, Y.P., J.Z. and H.X.; Methodology, Y.P. and J.Z.; Data Curation, Y.P.; Writing—Original Draft Preparation, Y.P.; Writing—Review and Editing, F.F., F.L. and L.T.; Conceptualization and Supervision, J.Z. and H.X.; Project Administration, H.X. All authors have read and agreed to the published version of the manuscript.

Funding

This research was funded by the National Key R&D Program of China (No. 2023YFC3705701), National Natural Science Foundation of China (No. 21976171), and Guangxi Key Research and Development Program (GuikeAB21220063).

Institutional Review Board Statement

Not applicable.

Informed Consent Statement

Not applicable.

Data Availability Statement

Air quality data published by the China National Environmental Monitoring Centre: https://quotsoft.net/air/ (accessed on 15 July 2024).

Conflicts of Interest

The authors declare no conflicts of interest.

References

  1. Tao, T.H.; Shi, Y.S.; Gilbert, G.K.; Liu, X.Y. Spatiotemporal variations of air pollutants based on ground observation and emission sources over 19 Chinese urban agglomerations during 2015–2019. Sci. Rep. 2022, 12, 4293. [Google Scholar] [CrossRef] [PubMed]
  2. Liang, L.; Gong, P. Urban and air pollution: A multi-city study of long-term effects of urban landscape patterns on air quality trends. Sci. Rep. 2020, 10, 18618. [Google Scholar] [CrossRef]
  3. Zhang, Y.J.; Lei, R.Y.; Cui, S.J.; Wang, H.L.; Chen, M.D.; Ge, X.L. Spatiotemporal trends and impact factors of PM2.5 and O3 pollution in major cities in China during 2015~2020. Chin. Sci. Bull 2022, 67, 2029–2042. [Google Scholar] [CrossRef]
  4. Liu, J.; Shen, J.Y.; Cheng, Z.; Wang, P.; Ying, Q.; Zhao, Q.B.; Zhang, Y.H.; Zhao, Y.; Fu, Q.Y. Source Apportionment and Regional Transport of Anthropogenic Secondary Organic Aerosol during Winter Pollution Periods in the Yangtze River Delta, China. Sci. Total Environ. 2020, 710, 135620. [Google Scholar] [CrossRef] [PubMed]
  5. Li, R.; Li, Q.; Xu, J.; Li, L.; Ge, C.J.; Huang, L.; Sun, D.H.; Liu, Z.Y.; Zhang, K.; Zhou, G.Z.; et al. Regional Air Pollution Process in Winter over the Yangtze River Delta and Its Influence on Typical Northern Cities. Environ. Sci. 2020, 41, 1520–1534. [Google Scholar]
  6. Li, L.; Cai, J.L.; Zhou, M. Potential Source Contribution Analysis of the Particulate Matters in Shanghai During the Heavy Haze Episode in Eastern and Middle China in December, 2013. Environ. Sci. 2015, 36, 2327–2336. [Google Scholar]
  7. Xue, W.B.; Fu, F.; Wan, J.N.; Tang, G.Q.; Lei, Y.; Yang, J.T.; Wang, Y.S. Numerical study on the characteristics of regional transport of PM2.5 in China. China Environ. Sci. 2014, 34, 1361–1368. [Google Scholar]
  8. Miao, Y.C.; Liu, S.H.; Guo, J.P.; Yan, Y.; Huang, S.X.; Zhang, G.; Zhang, Y.; Lou, M.Y. Impacts of meteorological conditions on wintertime PM2.5 pollution in Taiyuan, North China. Environ. Sci. Pollut. Res. 2018, 25, 21855–21866. [Google Scholar] [CrossRef] [PubMed]
  9. Li, D.Y.; Wu, Q.Z.; Cheng, H.Q.; Feng, J.M.; Li, D.X.; Wang, Y.L.; Cao, K.; Wang, L.N. Numerical Study of the Future PM2.5 Concentration under Climate Change and Best-Health-Effect (BHE) Scenario. Environ. Pollut. 2024, 357, 124391. [Google Scholar] [CrossRef]
  10. Fang, C.S.; Li, X.L.; Li, J.; Tian, J.Q.; Wang, J. Impact of Meteorological Conditions on PM2.5 Pollution in Changchun and Associated Health Risks Analysis. Atmosphere 2024, 16, 616. [Google Scholar] [CrossRef]
  11. Li, L.; Li, Q.; Huang, L.; Wang, Q.; Zhu, A.S.; Xu, J.; Liu, Z.Y.; Li, H.L.; Shi, L.S.; Li, R.; et al. Air Quality Changes during the COVID-19 Lockdown over the Yangtze River Delta Region: An Insight into the Impact of Human Activity Pattern Changes on Air Pollution Variation. Sci. Total Environ. 2020, 732, 139282. [Google Scholar] [CrossRef] [PubMed]
  12. Luan, T.; Guo, X.L.; Guo, L.J.; Zhang, T.H. Quantifying the relationship between PM2.5 concentration, visibility and planetary boundary layer height for long-lasting haze and fog-haze mixed events in Beijing. Atmos. Chem. Phys. 2018, 18, 203–225. [Google Scholar] [CrossRef]
  13. Yang, Y.R.; Xiu, X.G.; Qu, Y.; An, J.L.; Jiang, R.; Zhang, Y.H.; Sun, Y.L.; Wu, Z.J.; Zhang, F.; Xu, W.Q.; et al. Characteristics and formation mechanism of continuous hazes in China: A case study during the autumn of 2014 in the North China Plain. Atmos. Chem. Phys. 2015, 15, 8165–8178. [Google Scholar] [CrossRef]
  14. Liang, R.M.; Yin, P.; Zhou, M.G. Long-term exposure to fine particulate air pollution and health effects: A review of recent cohort studies. J. Environ. Health 2016, 33, 172–177. [Google Scholar]
  15. Guo, X.B.; Wei, H.Y. Progress on the health effects of ambient PM2.5 pollution. Chin. Sci. Bull 2013, 58, 1171–1177. [Google Scholar]
  16. Huang, S.X. Air pollution and control: Past, present and future. Chin. Sci. Bull 2018, 63, 895–919. [Google Scholar] [CrossRef]
  17. Yu, C.; Zhao, T.; Bai, Y.; Zhang, L.; Kong, S.; Yu, X.; He, J.; Cui, C.; Yang, J.; You, Y.; et al. Heavy Air Pollution with a unique “non-stagnant” Atmospheric Boundary Layer in the Yangtze River Middle Basin Aggravated by Regional Transport of PM2.5 over China. Atoms. Chem. Phys. 2020, 20, 7217–7230. [Google Scholar] [CrossRef]
  18. Ji, D.; Li, L.; Wang, Y.; Zhang, J.; Cheng, M.; Sun, Y.; Liu, Z.; Wang, L.; Tang, G.; Hu, B.; et al. The heaviest particulate air-pollution episodes occurred in northern China in January, 2013: Insights gained from observation. Atmos. Environ. 2014, 92, 546–556. [Google Scholar] [CrossRef]
  19. Sun, Y.L.; Jiang, Q.; Wang, Z.F.; Fu, P.Q.; Li, J.; Yang, T.; Yin, Y. Investigation of the sources and evolution processes of severe haze pollution in Beijing in January 2013. J. Geophys. Res. Atmos. 2014, 119, 4380–4398. [Google Scholar] [CrossRef]
  20. Streets, D.G.; Fu, J.S.; Jang, C.J.; Hao, J.; He, K.; Tang, X.; Zhang, Y.; Wang, Z.; Li, Z.; Zhang, Q.; et al. Air quality during the 2008 Beijing Olympic Games. Atmos. Environ. 2006, 41, 480–492. [Google Scholar] [CrossRef]
  21. Dong, Z.X.; Wang, S.X.; Xing, J.; Chang, X.; Ding, D.; Zheng, H.T. Regional Transport in Beijing-Tianjin-Hebei Region and its Changes during 2014–2017: The Impacts of Meteorology and Emission Reduction. Sci. Total Environ. 2020, 737, 139792. [Google Scholar] [CrossRef]
  22. Hu, X.M.; Ma, Z.Q.; Lin, W.L.; Zhang, H.L.; Hu, J.L.; Wang, Y.; Xu, X.B.; Fuentes, J.D.; Xue, M. Impact of the Loess Plateau on the atmospheric boundary layer structure and air quality in the North China Plain: A case study. Sci. Total Environ. 2014, 499, 228–237. [Google Scholar] [CrossRef] [PubMed]
  23. Zhang, H.L.; Wang, Y.G.; Hu, J.L.; Ying, Q.; Hu, X.M. Relationships between meteorological parameters and criteria air pollutants in three megacities in China. Environ. Res. 2015, 140, 242–254. [Google Scholar] [CrossRef] [PubMed]
  24. Miao, Y.C.; Liu, S.H.; Sheng, L.; Huang, S.X.; Li, J. Influence of Boundary Layer Structure and Low-Level Jet on PM2.5 Pollution in Beijing: A Case Study. Int. J. Environ. Res. Public Health 2019, 16, 616. [Google Scholar] [CrossRef] [PubMed]
  25. Wang, X.Q.; Duan, W.J.; Zhu, J.X.; Wei, W.; Cheng, S.Y.; Mao, S.S. Nonlinear influence of winter meteorology and precursor on PM2.5 based on mathematical and numerical models: A COVID-19 and Winter Olympics case study. Atmos. Environ. 2022, 278, 119072. [Google Scholar]
  26. Huang, R.J.; Zhang, Y.; Bozzetti, C.; Ho, K.F.; Cao, J.J.; Han, Y.; Daellenbach, K.R.; Slowik, J.G.; Platt, S.M.; Canonaco, F.; et al. High secondary aerosol contribution to particulate pollution during haze events in China. Nature 2014, 514, 218–222. [Google Scholar] [CrossRef]
  27. Zhai, H.; Zhu, B.; Zhao, X.T.; Pan, C. Analysis of a heavy air pollution event in early winter in the Yangtze River Delta. China Environ. Sci. 2018, 38, 4001–4009. [Google Scholar]
  28. Hua, S.B.; Shi, H.D.; Wang, K.; Gao, J.J. Analysis of Meteorological Conditions for a Heavy Pollution Process in North China During 2016–2017 Winter. Meteor. Environ. Sci. 2018, 41, 47–53. [Google Scholar]
  29. Xiao, Z.M.; Xu, H.; Cai, Z.Y.; Li, P.; Liu, B.; Yuan, J.; Zheng, N.Y.; Tang, M.; Chen, K.; Deng, X.W. Characterization of Two Heavy Pollution Episodes in Tianjin in 2020. Environ. Sci. 2020, 41, 3879–3888. [Google Scholar]
  30. Chen, Y.B.; Xu, J.; He, Y.J.; Du, X.H.; Tang, W.; Meng, F. Model analytic research of typical heavy PM2.5 pollution periods in winter in Beijing. Res. Environ. Sci. 2016, 29, 627–636. [Google Scholar]
  31. Zhang, X.Y.; Xu, X.D.; Ding, Y.H.; Liu, Y.J.; Zhang, H.D.; Wang, Y.Q.; Zhong, J.T. The impact of meteorological changes from 2013 to 2017 on PM2.5 mass reduction in key regions in China. Sci. China Earth Sci. 2019, 62, 1885–1902. [Google Scholar] [CrossRef]
  32. Xu, Y.L.; Xue, W.B.; Lei, Y. Impact of meteorological conditions and emission change on PM2.5 pollution in China. China Environ. Sci. 2019, 39, 4546–4551. [Google Scholar]
  33. Lu, S.Z.; Shi, X.R.; Xue, W.B.; Lei, Y.; Yan, G. Impacts of Meteorology and Emission Variations on PM2.5 Concentration throughout the Country During the 2020 Epidemic Period. Environ. Sci. 2021, 42, 3099–3106. [Google Scholar]
  34. Qiu, Y.L.; Chen, L.; Zhu, J.; Ma, Z.Q.; Li, Z.M.; Guo, H.; Tang, Y.X. Impacts of Changes in Meteorological Conditions during COVID-19 Lockdown on PM2.5 Concentrations over the Jing-Jin-Ji Region. Environ. Sci. 2022, 43, 2831–2839. [Google Scholar]
  35. Zhao, L.F. Spatio-Temporal Characteristics of PM2.5 and Correlation Analysis of Atmospheric Composite Pollutants in Winter in the Yangtze River Delta. Master’s Dissertation, Zhejiang University, Hangzhou, China, 2018. [Google Scholar]
  36. Sulaymon, I.D.; Zhang, Y.X.; Hu, J.L.; Hopke, P.K.; Zhang, Y.; Zhao, B.; Xing, J.; Li, L.; Mei, S.D. Evaluation of Regional Transport of PM2.5 during Severe Atmospheric Pollution Episodes in the Western Yangtze River Delta, China. J. Environ. Manag. 2021, 293, 112827. [Google Scholar] [CrossRef] [PubMed]
  37. Mi, K.N.; Zhuang, R.L.; Liang, L.W.; Duan, Y.P.; Gao, J. Spatio-temporal evolution and characteristics of PM2.5 in the Yangtze River Delta based on real-time monitoring data during 2013–2016. Geogr. Res. 2018, 37, 1641–1654. [Google Scholar]
  38. Huang, X.Y.; Wang, L.; Pan, H.; Xie, F.F. Evolution trend and spatial differentiation characteristics of PM2.5 and PM10 in Yangtze River Delta urban agglomeration. Environ. Pollut. Control 2021, 43, 1309–1315. [Google Scholar]
  39. Ministry of Environmental Protection of the People’s Republic of China. HJ633–2012: Technical Requirements for Ambient Air Quality Index (AQI) (Trial); China Environmental Science Press: Beijing, China, 2012.
  40. Wang, Z.; Li, J.; Wang, Z.; Yang, W.; Tang, X.; Ge, B.; Yan, P.; Zhu, L.; Chen, X.; Chen, H.; et al. Modeling study of regional severe hazes over mid-eastern China in January 2013 and its implications on pollution prevention and control. Sci. China Earth Sci. 2014, 57, 3–13. [Google Scholar] [CrossRef]
  41. Li, J.; Yang, W.Y.; Chen, H.S.; Wang, Z.F.; Hu, B.; Song, T.; Li, J.J. Modeling study of atmospheric respirable particulate matter over East Asia. Acta Sci. Circumst. 2014, 34, 548–557. [Google Scholar]
  42. Wang, W.D.; Chen, H.S.; Wu, Q.Z.; Wei, L.F.; Wang, Z.F.; Li, C.; Chen, D.H.; Jiang, Z.M.; Wu, W.W. Numerical study of PM2.5 regional transport over Pearl River Delta during a winter heavy haze event. Acta Sci. Circumst. 2016, 36, 2741–2751. [Google Scholar]
  43. Wang, Z.F.; Xie, F.Y.; Wang, Q.X.; An, J.L.; Zhu, J. Development and Application of Nested Air Quality Prediction Modeling System. Chinese J. Atmos. Sci. 2006, 30, 778–790. [Google Scholar]
  44. Li, J.; Wang, Z.F.; Zhuang, G.; Luo, G.; Sun, Y.; Wang, Q. Mixing of Asian mineral dust with anthropogenic pollutants over East Asia: A model case study of a super-duststorm in March 2010. Atmos. Chem. Phys. 2012, 12, 7591–7607. [Google Scholar] [CrossRef]
  45. Li, J.; Wang, Z.; Wang, X.; Yamaji, K.; Takigawa, M.; Kanaya, Y.; Pochanart, P.; Liu, Y.; Irie, H.; Hu, B.; et al. Impacts of aerosols on summertime tropospheric photolysis frequencies and photochemistry over Central Eastern China. Atmos. Environ. 2011, 45, 1817–1829. [Google Scholar] [CrossRef]
  46. Zaveri, R.A.; Peters, L.K. A new lumped structure photochemical mechanismfor large-scale applications. J. Geophys. Res. Atmos. 1999, 104, 30387–30415. [Google Scholar] [CrossRef]
  47. Nenes, A.; Pilinis, C.; Pandis, S.N. ISORROPIA: A New Thermodynamic Equilibrium Model for Multiphase Multicomponent Inorganic Aerosols. Aquat. Geochem. 1998, 4, 123–152. [Google Scholar] [CrossRef]
  48. Odum, J.R.; Jungkamp, T.P.W.; Griffin, R.J.; Flagan, R.C.; Seinfeld, J.H. The atmospheric aerosol-forming potential of whole gasoline vapor. Science 1997, 276, 96–99. [Google Scholar] [CrossRef]
  49. Luo, G.; Wang, Z.F. A global environmental atmospheric transport model (GEATM): Model description and validation. Chin. J. Atmos. Sci. 2006, 30, 504–518. [Google Scholar]
  50. Athanasopoulou, E.; Tombrou, M.; Pandis, S.N.; Russell, A.G. The role of sea-salt emissions and heterogeneous chemistry in the air quality of polluted coastal areas. Atmos. Chem. Phys. 2008, 8, 5755–5769. [Google Scholar] [CrossRef]
  51. Yang, T.; Gbaguidi, A.; Yan, P.Z.; Zhang, W.D.; Zhu, L.L.; Yao, X.F.; Wang, Z.F.; Chen, H. Model elucidating the sources and formation mechanisms of severe haze pollution over Northeast mega-city cluster in China. Environ. Pollut. 2017, 230, 692–700. [Google Scholar] [CrossRef]
  52. Pan, Y.; Zheng, J.; Xiao, H. Simulation Evaluation of the Contribution of Typical PM2.5 Pollution and Trans-regional Transport to Ningbo Pollution in the Yangtze River Delta. Environ. Sci. 2023, 44, 634–645. [Google Scholar]
  53. Xu, Y.L.; Xue, W.B.; Lei, Y.; Zhao, Y.; Cheng, S.Y.; Ren, Z.H.; Huang, Q. Impact of Meteorological Conditions on PM2.5 Pollution in China during Winter. Atmosphere 2018, 9, 429. [Google Scholar] [CrossRef]
  54. Li, D.; Liu, J.; Zhang, J.; Gui, H.; Du, P.; Yu, T.; Wang, J.; Lu, Y.; Liu, W.; Cheng, Y. Identification of long-range transport pathways and potential sources of PM2.5 and PM10 in Beijing from 2014 to 2015. J. Environ. Sci. 2017, 56, 214–229. [Google Scholar] [CrossRef]
  55. Li, H.L.; He, Q.; Liu, X.C. Identification of long-range transport pathways and potential source regions of PM2.5 and PM10 at akedala station, central asia. Atmosphere 2020, 11, 1183. [Google Scholar] [CrossRef]
  56. Wang, J.; Zhang, M.; Bai, X.; Tan, H.; Li, S.; Liu, J.; Zhang, R.; Wolters, M.A.; Qin, X.; Zhang, M.; et al. Large-scale transport of PM2.5 in the lower troposphere during winter cold surges in China. Sci. Rep. 2017, 7, 13238. [Google Scholar] [CrossRef]
  57. Zhao, N.; Wang, G.; Li, G.H.; Lang, J.L.; Zhang, H.Y. Air pollution episodes during the COVID-19 outbreak in the Beijing-Tianjin-Hebei region of China: An insight into the transport pathways and source distribution. Environ. Pollut. 2020, 267, 115617. [Google Scholar] [CrossRef] [PubMed]
  58. Wang, X.D.; Yin, S.S.; Yang, J.; Yuan, M.H.; Zhang, R.Q.; Li, Y.S.; Lu, X. Characteristics, Meteorological Influences, and Transport Source of Ozone Pollution in Zhengzhou City. Environ. Sci. 2021, 42, 604–615. [Google Scholar] [CrossRef]
  59. Wang, Y.; Cai, F.H.; Wang, Y.H.; Liu, M. Transport Characteristics of Air Pollutants over the Yangtze Delta. Environ. Sci. 2008, 29, 1430–1435. [Google Scholar]
  60. Seibert, P.; Kromp-Kolb, H.; Baltensperger, U.; Jost, D.T.; Schwikowski, M. Trajectory Analysis of High-Alpine Air Pollution Data. Air Pollut. Model. Its Appl. X 1994, 18, 595–596. [Google Scholar]
  61. Hsu, Y.K.; Holsen, T.M.; Hopke, P.K. Comparison of hybrid receptor models to locate PCB sources in Chicago. Atmos. Environ. 2003, 37, 545–562. [Google Scholar] [CrossRef]
  62. Zhang, H.Y.; Cheng, S.Y.; Yao, S.; Wang, X.Q.; Zhang, J.F. Pollution Characteristics and Regional Transport of Atmospheric Particulate Matter in Beijing from October to November, 2016. Environ. Sci. 2019, 40, 1999–2009. [Google Scholar]
  63. Duan, S.G.; Jiang, N.; Yang, L.M.; Zhang, R.Q. Transport Pathways and Potential Sources of PM2.5 during the Winter in Zhengzhou. Environ. Sci. 2019, 40, 86–93. [Google Scholar]
  64. Wang, G.C.; Wang, J.; Xin, Y.J.; Chen, L. Transportation pathways and potential source areas of PM10 and NO2 in Tianjin. China Environ. Sci. 2014, 34, 3009–3016. [Google Scholar]
  65. Yan, S.M.; Wang, Y.; Guo, W.; Li, Y.; Zhang, F.S. Characteristics, Transportation, Pathways, and Potential Sources of Air Pollution During Autumn and Winter in Taiyuan. Environ. Sci. 2019, 40, 4801–4809. [Google Scholar]
Figure 1. Distribution of PM2.5 pollution days in January, February, and December in the Yangtze River Delta from 2015 to 2019.
Atmosphere 15 01037 g001
Figure 2. The spatial distribution of PM2.5 concentration in the YRD from 2015 to 2019 in January (a); the change characteristics of PM2.5 concentration and contributions of different pollution levels in Anhui, Jiangsu, Shanghai, and Zhejiang from 2015 to 2019 in January (b).
Atmosphere 15 01037 g002
Figure 3. The changes in PM2.5 concentration in the YRD from 2016 to 2019 in January, and the impact assessment of meteorology and emissions from 2016 to 2019 compared to 2015.
Atmosphere 15 01037 g003
Figure 4. Impact of meteorological conditions and pollutant emissions on the variation in PM2.5 concentration in the YRD caused by changes in meteorology and emissions from 2016 to 2019 compared to 2015.
Atmosphere 15 01037 g004
Figure 5. Distribution of air mass backward trajectories, with the WPSCF and WCWT for PM2.5 in Hefei, Nanjing, Shanghai, and Hangzhou from 2015 to 2019 in January. The green, orange, and red in the backward trajectories chart indicate the clean, light and moderate pollution, and heavy pollution trajectories and their corresponding proportions, respectively, and the star represents the receptor city location.
Atmosphere 15 01037 g005
Figure 6. Backward trajectory clusters and corresponding WCWT analysis under excellent and good, light and moderate, and severe PM2.5 pollution in Hefei, Nanjing, Shanghai, and Hangzhou. Ln represents the number of trajectories under the PM2.5 level, L1 represents the inland channel trajectory, L2 represents the coastal channel trajectory, L3 represents the ocean channel trajectory, and L4 represents the close local channel trajectory, and the star represents the receptor city location.
Atmosphere 15 01037 g006
Disclaimer/Publisher’s Note: The statements, opinions and data contained in all publications are solely those of the individual author(s) and contributor(s) and not of MDPI and/or the editor(s). MDPI and/or the editor(s) disclaim responsibility for any injury to people or property resulting from any ideas, methods, instructions or products referred to in the content.

