Abstract
This study takes the Danjiangkou reservoir basin, which is the water source area of the South-to-North Water Diversion Project, one of the largest water diversion projects in the world, as the research area. Three different types of evapotranspiration (ET) datasets are adopted, including the Global Land Evaporation Amsterdam Model (GLEAM), European Centre for Medium-Range Weather Forecasts ERA5—Land Component (ERA5Land), and Complementary Relationship (CR) datasets. These datasets are analyzed for spatiotemporal evolution and data fusion using Mann–Kendall analysis, Sen’s Slope analysis, and Extended Triple Collocation (ETC). The aim is to improve the accuracy of evapotranspiration estimation in the watershed of the water source area. The results show the following: (1) All three sets of evapotranspiration data indicate an increasing trend in the watershed, with rates of 0.78 mm/year, 0.14 mm/year, and 2.56 mm/year, respectively. Additionally, the seasonal variation in evapotranspiration is significant, with the rate of change being summer > spring > autumn > winter. (2) The data fusion results indicate that ERA5Land performs best in the water source area watershed, with the smallest root mean square error (RMSE) value. In the fused data, ERA5Land’s evapotranspiration data account for the largest proportion at 59.93%, GLEAM ET data account for 39.96%, and CR’s evapotranspiration data account for the smallest proportion at only 0.11%. (3) The spatial distribution shows that the fused data fully exploits the advantages of different evapotranspiration data, inherits the advantages of ERA5Land and GLEAM ET products, and achieves effective fusion of multi-source data, thereby forming a more accurate dataset. These research findings provide scientific references for the construction of digital twin watersheds, intelligent water resource allocation, and effective responses to climate change in the water source area of the South-to-North Water Diversion Project.
1. Introduction
Precise hydrological simulation is an important cornerstone for the construction of smart water conservancy projects and digital twin basins. As the core link between hydrological and energy processes, the accuracy of evapotranspiration (ET) measurement directly affects the entire surface process of the basin [1]. In today’s world, climate change and global warming have accelerated the hydrological cycle, profoundly affecting the evapotranspiration process and causing significant changes in the evapotranspiration pattern [2]. The middle route of the South-to-North Water Diversion Project, as an important part of China’s “Four Horizontal and Three Vertical” water resource allocation pattern, is a large-scale inter-basin water diversion project aimed to alleviate the shortage of water resources in North China [3]. At present, one of the biggest challenges faced by the dispatch and management of the middle route project is the uncertainty of the available water volume of the Danjiangkou Reservoir in the source area [4]. According to the observed data, the inflow runoff of the Danjiangkou Reservoir from 1999 to 2014 decreased by 7.36 billion m3 compared to the project demonstration period (1954 to 1998), accounting for 78.00 of the first-phase planned diversion water volume (9.50 billion m3) [5]. Moreover, the Danjiangkou Reservoir has a vast drainage area of nearly 100,000 km2, and the loss of evapotranspiration cannot be ignored [6]. Therefore, it is of great significance to accurately estimate the amount of evapotranspiration to ensure the optimal water resource management of the source area basin.
The calculation methods of basin evapotranspiration can be generally divided into three types [7]: ① calculations based on ground flux station observations, ② calculations based on satellite sensing monitoring, and ③ calculations based on land surface model simulation. However, all three methods have their own disadvantages to varying degrees [8]. For example, ground-based station observations can obtain more accurate data. However, the coverage of station deployment is small, and the equipment is expensive. Thus, it is impossible obtain large-scale data. Satellite remote sensing technology can obtain a large range of ground information, but it cannot be used for real-time continuous observation (data are only available when the satellite passes over). Although the land surface model can be continuously simulated, it is limited by the parameterization scheme of the model, and the differences between different models may be large, resulting in greater uncertainty [9].
Some scholars have made improvements to this drawback from multiple perspectives, and multivariate models are an important direction for optimization and improvement. Norman [10] improved the Shuttleworth–Wallace (S–W) model applied at a single-point scale and proposed the first TSEB-PT evapotranspiration model based on energy balance theory. The advantage of this model is that it decomposes the mixed pixel surface temperature into soil surface temperature and vegetation canopy temperature, improving the reliability of soil evaporation and vegetation transpiration calculations. The disadvantage of this model is that there may be differences in accuracy at different scales. Anderson [11] proposed the ALEXI model based on the TSEB-PT model. The model added a new calculation module to estimate the sensible heat flux in the planetary boundary layer (PBL) thermal energy-constrained region based on time integration. The relationship between the surface heating rate and radiation temperature within 1–5 h after the sun rises has been established and combined with the surface temperature information inverted by the Geostationary Orbit Environmental Service Satellite (GOES). Model advantages include accurate estimations of ground evapotranspiration during satellite transit. A disadvantage is that it uses the time difference method to process remote sensing data. This leads to calculation errors in latent heat flux, which affects the estimation of evapotranspiration. Anderson [12] proposed the DisALEXI model. This model effectively considers the impact of PBL on regional heat flux estimation and high-resolution and low-resolution remote sensing images. The model obtains high-resolution sensible heat flux and latent heat flux distributions and fully utilizes remote sensing data sources to map the regional distribution of evapotranspiration. The application of the DisALEXI model has been extended to estimate photosynthetic efficiency, and it is currently the only evapotranspiration model based on both thermal infrared remote sensing and impedance processes [13]. The disadvantage of the model is that the uncertainty of data such as surface temperature, albedo, and leaf area index affects the estimation of evapotranspiration. Cammalleri [14] proposed the TSEB-IC model. The model selects pixels in the area that are completely moist or completely covered by vegetation, and uses the Priestley–Taylor equation to estimate the air temperature and evapotranspiration in the study area. However, the model cannot be used during non-vegetation growing seasons, and using the air temperature of a single pixel to represent the air temperature of the entire study area inevitably generates errors. Chen [15] improved the PCACA model and developed the PCALEP model to distinguish between large-scale soil evaporation and vegetation transpiration. The model proposed a new trapezoidal upper and lower boundary localization algorithm that achieved automatic recognition and localization of trapezoidal upper and lower boundaries, reducing the model uncertainty that may be caused by extreme pixel selection in traditional trapezoidal feature space models. The model has shortcomings: ① It does not take into account the advection effect, resulting in an underestimation of evapotranspiration calculation results. ② It is dependent on ground-based meteorological observation data. Penman–Monteith MU (PM-MU) [16] is an improvement of the Penman–Monteith (PM) model that constrains canopy impedance calculations with water vapor pressure difference and temperature data. The surface evapotranspiration at day and night was calculated separately based on surface temperature, and the sum of the two was the daily evapotranspiration. Complementary correlation theory was used to estimate soil evaporation, which improved the estimation accuracy to a certain extent. The limitation of this model is that there are a large number of empirical parameter calculations in the soil evaporation parameterization scheme, and obtaining soil moisture content from relative humidity will result in certain errors.
Based on these studies, it can be seen that multi-source models have more advanced physical mechanisms compared to single-source models and can distinguish between soil evaporation and vegetation transpiration. However, the advantages and disadvantages of different model combinations vary, and there are differences in evaluation accuracy when dealing with different spatial scales, earth dimensions, surface types, and vegetation cover. For some key areas, it is necessary to try coupling different evaluation models and developing datasets with higher accuracy.
In response to the characteristics of the South-to-North Water Diversion Middle Route Project, which has a large water diversion volume, a large storage capacity in the Danjiangkou Reservoir, and significant strategic significance, this study intends to make full use of the data advantages of all parties and explore the potential of multi-source data. This study proposes a fusion method for evapotranspiration datasets based on extended triple collocation that optimizes the best evapotranspiration dataset pixel by pixel based on the principle of minimum uncertainty and develops a new source area evapotranspiration dataset that provides a scientific reference and data support for deeply understanding the water cycle of the source area basin.
2. Materials and Methods
2.1. Overview of the Study Area
This study takes the Danjiangkou reservoir basin, which is the water source area of the South-to-North Water Diversion Project, as the research area. The South-to-North Water Diversion Middle Route Project is one of the largest water diversion projects in the world, with the main canal spanning four provinces in China: Henan, Hebei, Beijing, and Tianjin. The total length of the main canal is 1277 km, with an average annual water transfer volume of 9.5 billion m3.
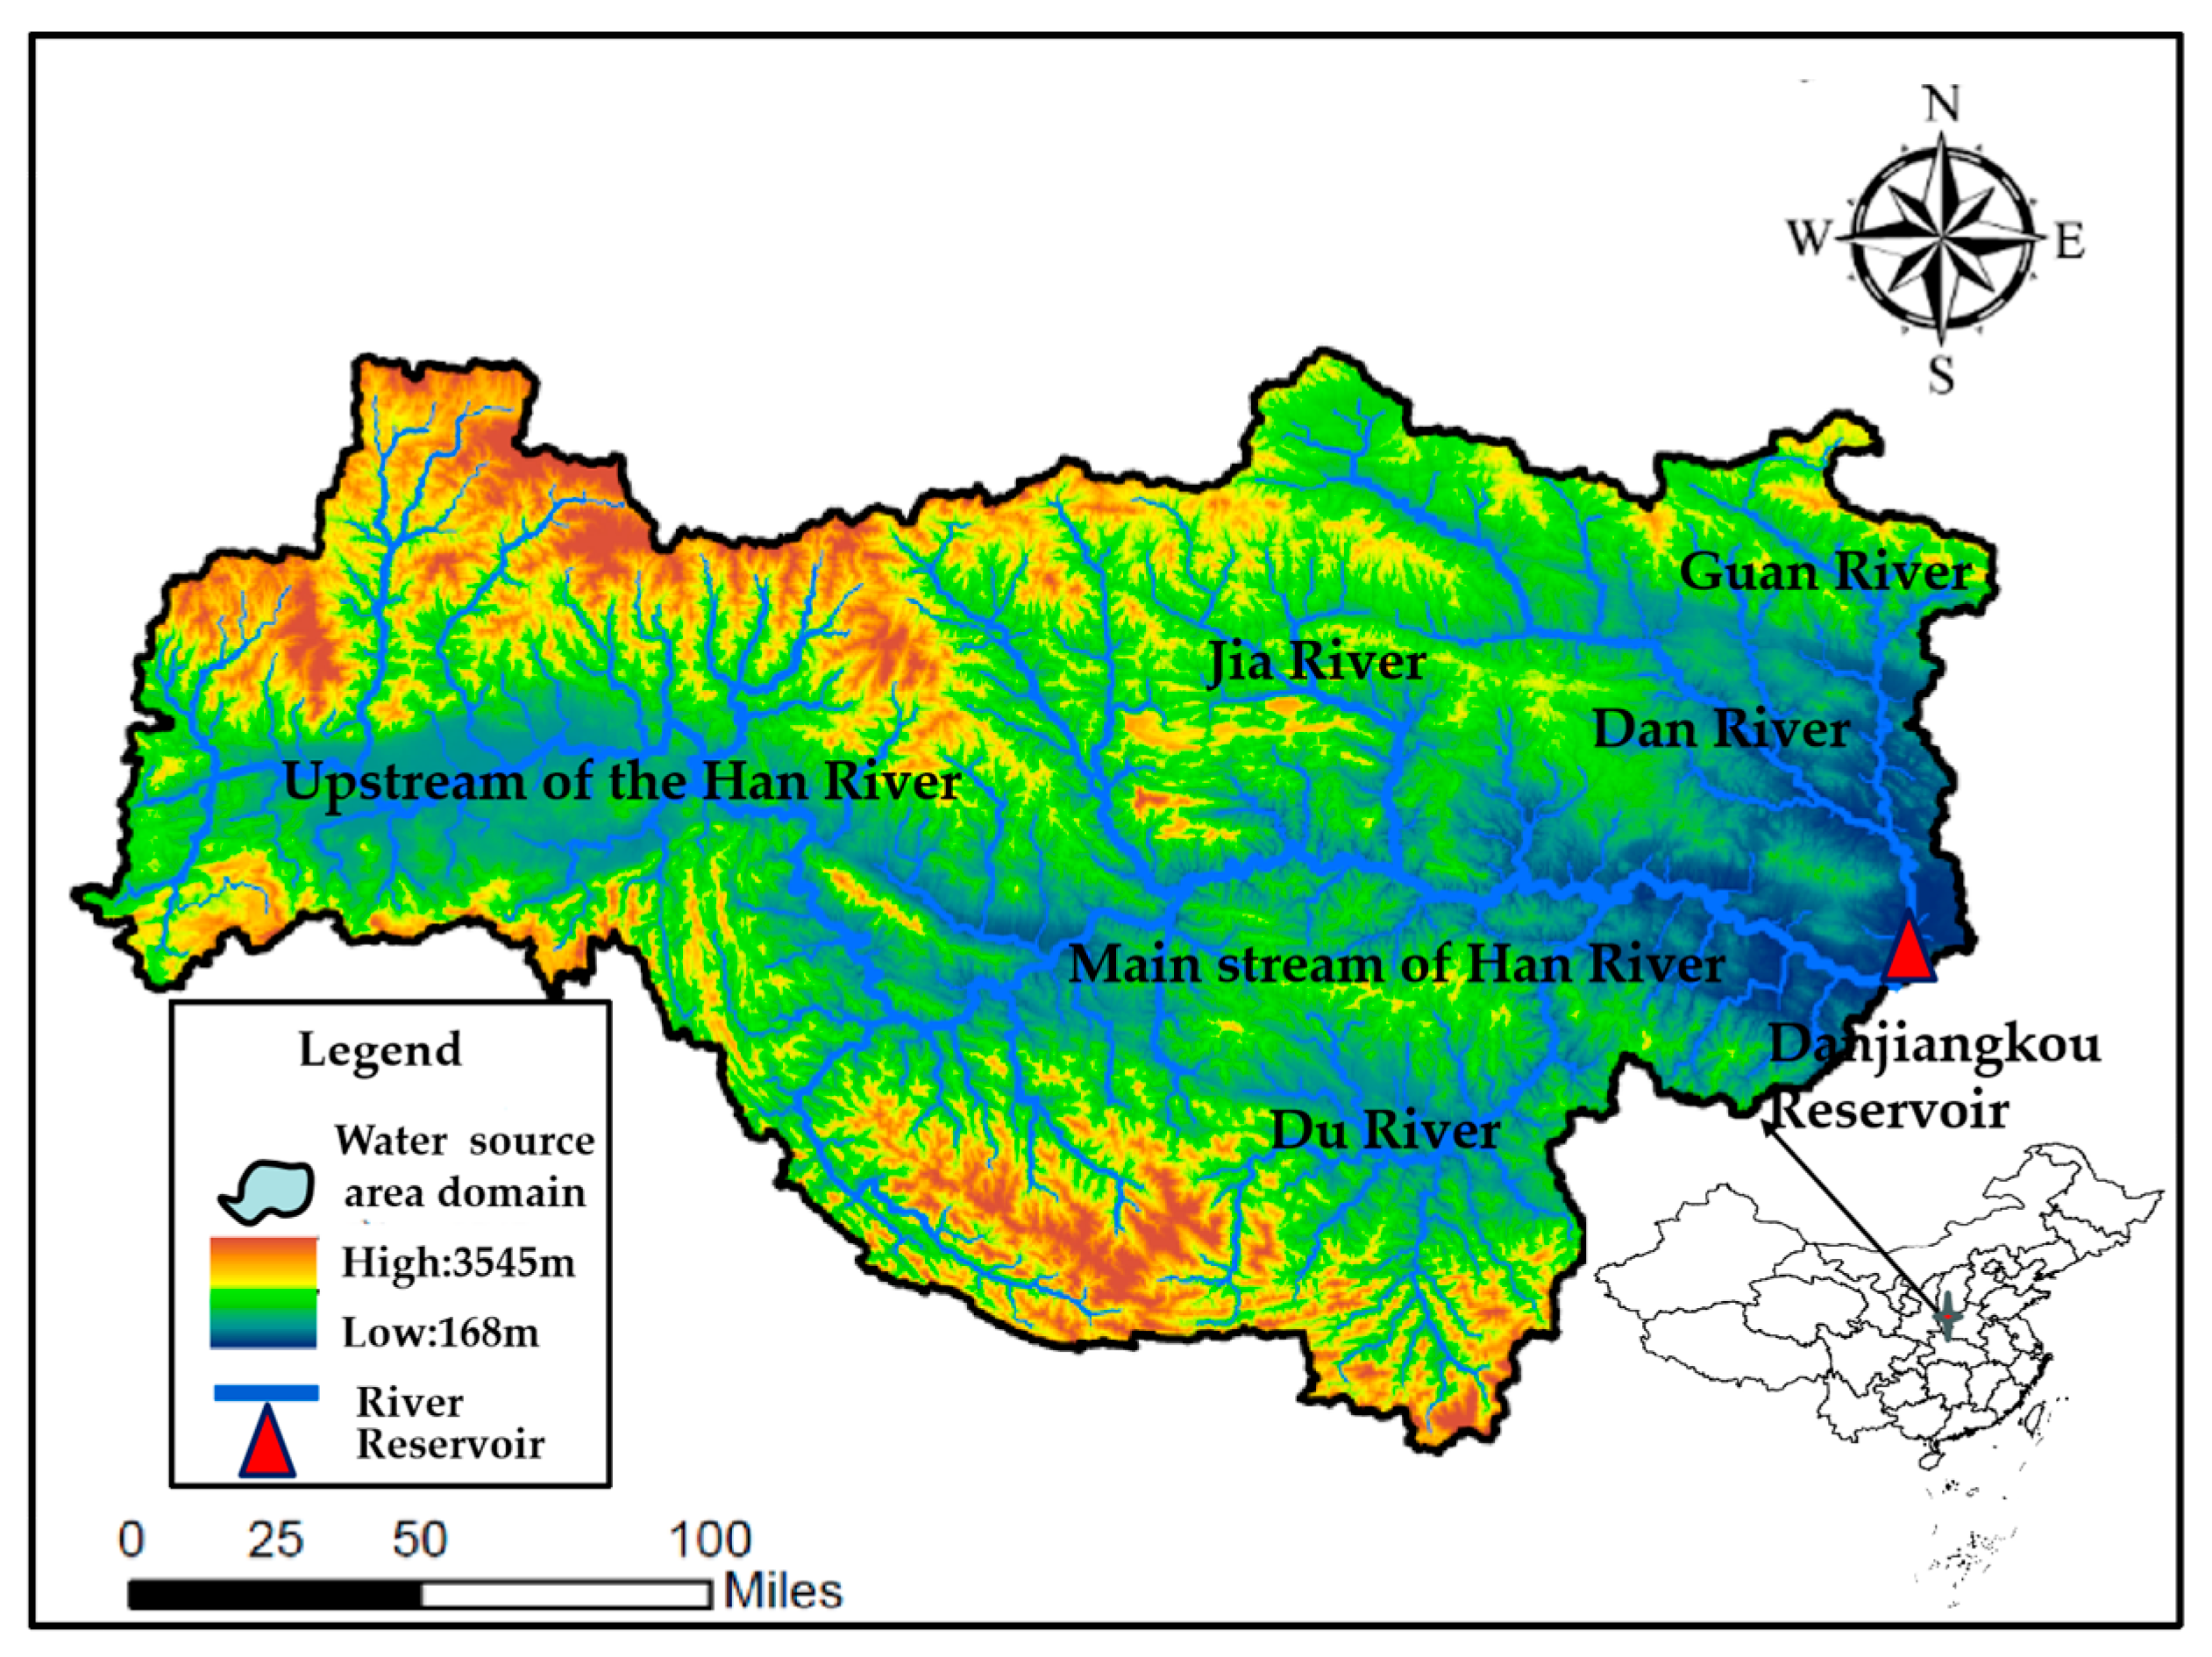
The range of the Danjiangkou reservoir basin is 31°0′–35°0′ N,106°0′–112°0′ E, and it spans six provincial administrative regions: Shanxi, Gansu, Henan, Hubei, Chongqing, and Sichuan [17]. The overall topography of the source area is characterized by being higher in the west and lower in the east. Climatically, the northern part of the basin has a warm temperate semi-humid climate, while the southern part has a subtropical humid climate. The temperature is −13.2–42.6 °C, the average annual temperature is 14.5 °C [18]. The water source area is rich in water resources, with an average annual runoff of 36.9 billion m3. The runoff during the wet season accounts for 77.80% of the annual runoff. The annual average precipitation is 750–850 mm, and the annual average wind speed is between 1.0–2.5 m/s. The Danjiangkou Reservoir provides a stable and reliable water resource guarantee for the middle route of the South-to-North Water Diversion Project [19]. The digital elevation map of the study area is shown in Figure 1.
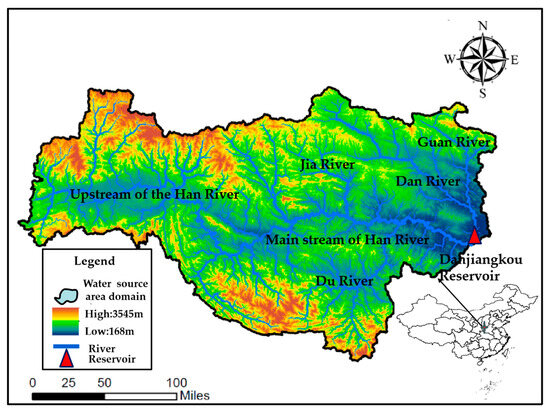
Figure 1.
Digital elevation model (DEM) of the Danjiangkou Reservoir Basin.
2.2. Research Data
2.2.1. GLEAM Dataset
The GLEAM (Global Land Evaporation Amsterdam Model) was developed by Dr. Diego G. Miralles from the School of Geographical Sciences at the of Bristol, UK, based on multi-satellite remote sensing observation data [20]. Here, the potential evapotranspiration is calculated using the Priestley–Taylor formula. Then, it is converted into actual evapotranspiration using data on soil, evaporation pressure, etc. The dataset spans the period from 1980 to 2018, with a spatial resolution of 0.25° × 0.5° and a temporal resolution that includes both daily and monthly scales [21].
2.2.2. ERA5Land Reanalysis Dataset
The ERA5Land evapotranspiration data are a reanalysis dataset launched by the European Centre for Medium-Range Weather Forecasts (ECMWF) based on the simulation and data assimilation technology of land surface models. It uses the atmospheric variables of the fifth-generation reanalysis product ERA5 as driving data and adopts the optimized land surface hydrological model HTESSEL and CY45R1 for simulation, which is an optimization and upgrade of the original version [22]. Compared with the ERA5 data, ERA5Land data offer a significant improvement in the precision of data products and the spatiotemporal resolution. The dataset spans the period from 1979 to 2020, with a temporal resolution of monthly and a spatial resolution of 0.1° × 0.1°. In this study, ERA5L is used to represent ERA5Land.
2.2.3. CR Dataset
The CR (Complementary Relationship) evapotranspiration dataset is sourced from the National Tibetan Plateau Data Center of China and was developed by the team led by researcher Ma Ning from the Institute of Geography of the Chinese Academy of Sciences [8]. These data are based on the complementary principle of evapotranspiration, integrating solar shortwave radiation, longwave radiation, temperature, and air pressure data the China Meteorological Driving Dataset. The dataset incorporates the surface emissivity and albedo data from the Global Land Surface Characteristics Parameters Data Collection (GLASS) and the surface temperature, air humidity information, and the scattered radiation rate data from the National Centers for Environmental Prediction (NCEP) in the United States. The dataset has a monthly temporal resolution, a time span of 1982–2017, and a spatial resolution of 0.1° × 0.1°.
2.3. Research Methods
2.3.1. Mann–Kendall Trend Analysis Method
The Mann–Kendall trend analysis method is a non-parametric statistical method used to analyze the change trend of time series. Since this method does not require the distribution characteristics of the analysis data, it is widely used in hydrological and meteorological fields [23]. This method analyzes the precipitation sequence of for n samples and tests the statistical variable Z. The calculation method is shown in Formulas (1)–(3).
Here, S can be approximated by a normal distribution with a mean of 0 and a variance as shown in Formula (4).
Here, n is the length of the time series; Var(·) is the variance; and are the th and th time series values the sequence, respectively; and is the sign function. When , it indicates that the sequence has an increasing trend. Conversely, when , it indicates that the sequence has decreasing trend. If , it indicates that there is a significant trend change in the sequence at the given 95% level. Moreover, in order to eliminate the influence of the autocorrelation of the time series itself, it is necessary to pre-whiten the data before trend detection.
This study applied this method to analyze the seasonal variation trends of evapotranspiration within a one-year period.
2.3.2. Sen’s Slope Trend Analysis Method
Sen’s Slope is a non-parametric trend test method based on the difference of medians that was jointly proposed by the Dutch econometrician Henriil and the American statistician Pranab Sen [24]. Since the median difference in this method can effectively eliminate outliers, it is not affected by outliers. The calculation method is shown in Formula (5).
Here, is the Sen’s Slope statistic. When , the sequence shows an upward trend. When , it shows a downward trend. denotes the median function.
This study applies this method to analyze the spatiotemporal trend of multi-year average evapotranspiration.
2.3.3. Expansion of the Triple Configuration Method (ETC)
The Extended Triple Collocation (ETC) is an improvement and extension of the Triple Collocation (TC) method [20], which was first proposed in the study of the calibration problem of satellite wind speed products and was used estimate the errors of different wind speed products. After that, the TC method was applied to estimate the error in geophysical measurement systems, and it has become an important tool for evaluating the error and uncertainty of soil moisture [25].
The TC method is usually used to evaluate the errors of three data products simultaneously, which can be different types of data products [26]. The relationship between the three data products and the truth can be expressed as noted in Formula (6).
Here, represents the above three data products, and it is assumed that there is a linear relationship between them and the true value. and represent the intercept and slope of the linear relationship, respectively, which are calculated using the least squares method; represents the additional random error. Therefore, the covariance between different products can be expressed as noted in Formula (7).
Here, . Since there are six unique terms in a 3 × 3 covariance matrix, including there are six equations in the system. However, there are seven unknowns that need to be solved for, including . Therefore, the solution to the system of equations is not unique. Instead of solving for and directly, we can merge them into a new variable . The system of equations can be transformed into Formula (8).
Through transformation, it becomes a problem of solving six unknowns with six equations, and the system of equations has a unique solution at this time. Based on this solution, we can also calculate the root mean square error (RMSE) between different datasets and the true value, which is calculated as noted in Formula (9).
On the basis of continuing a series of mathematical assumptions of the TC method, the ETC method has further improved and upgraded the TC method. Compared with the TC method, the ETC method has three obvious advantages: ① There is no need to select a reference dataset; ② It can provide the absolute errors between the three datasets and the unknown true value; ③ It can provide the Pearson correlation coefficients between the three datasets and the unknown true value. Therefore, the ETC method has greater application potential than the TC method [27]. This study intends to adopt the ETC method to fuse multi-source evapotranspiration data.
In addition, to facilitate the fusion of datasets, in this study, the spatial resolution of the three evapotranspiration datasets is uniformly resampled to 0.1° × 0.1°. The time span is selected as the time jointly covered by the three datasets, that is, from 1982 to 2017, and the time scale is monthly. The interannual scale is obtained by averaging the 12 months, and the seasonal scale within a year is obtained by averaging the corresponding months. Specifically, spring is from March to May, summer is from June to August, autumn is from September to November, and winter is from December to February of the following year.
3. Results
3.1. Spatial Distribution Characteristics of the Evapotranspiration Dataset
3.1.1. Interannual Change Trend of Evapotranspiration
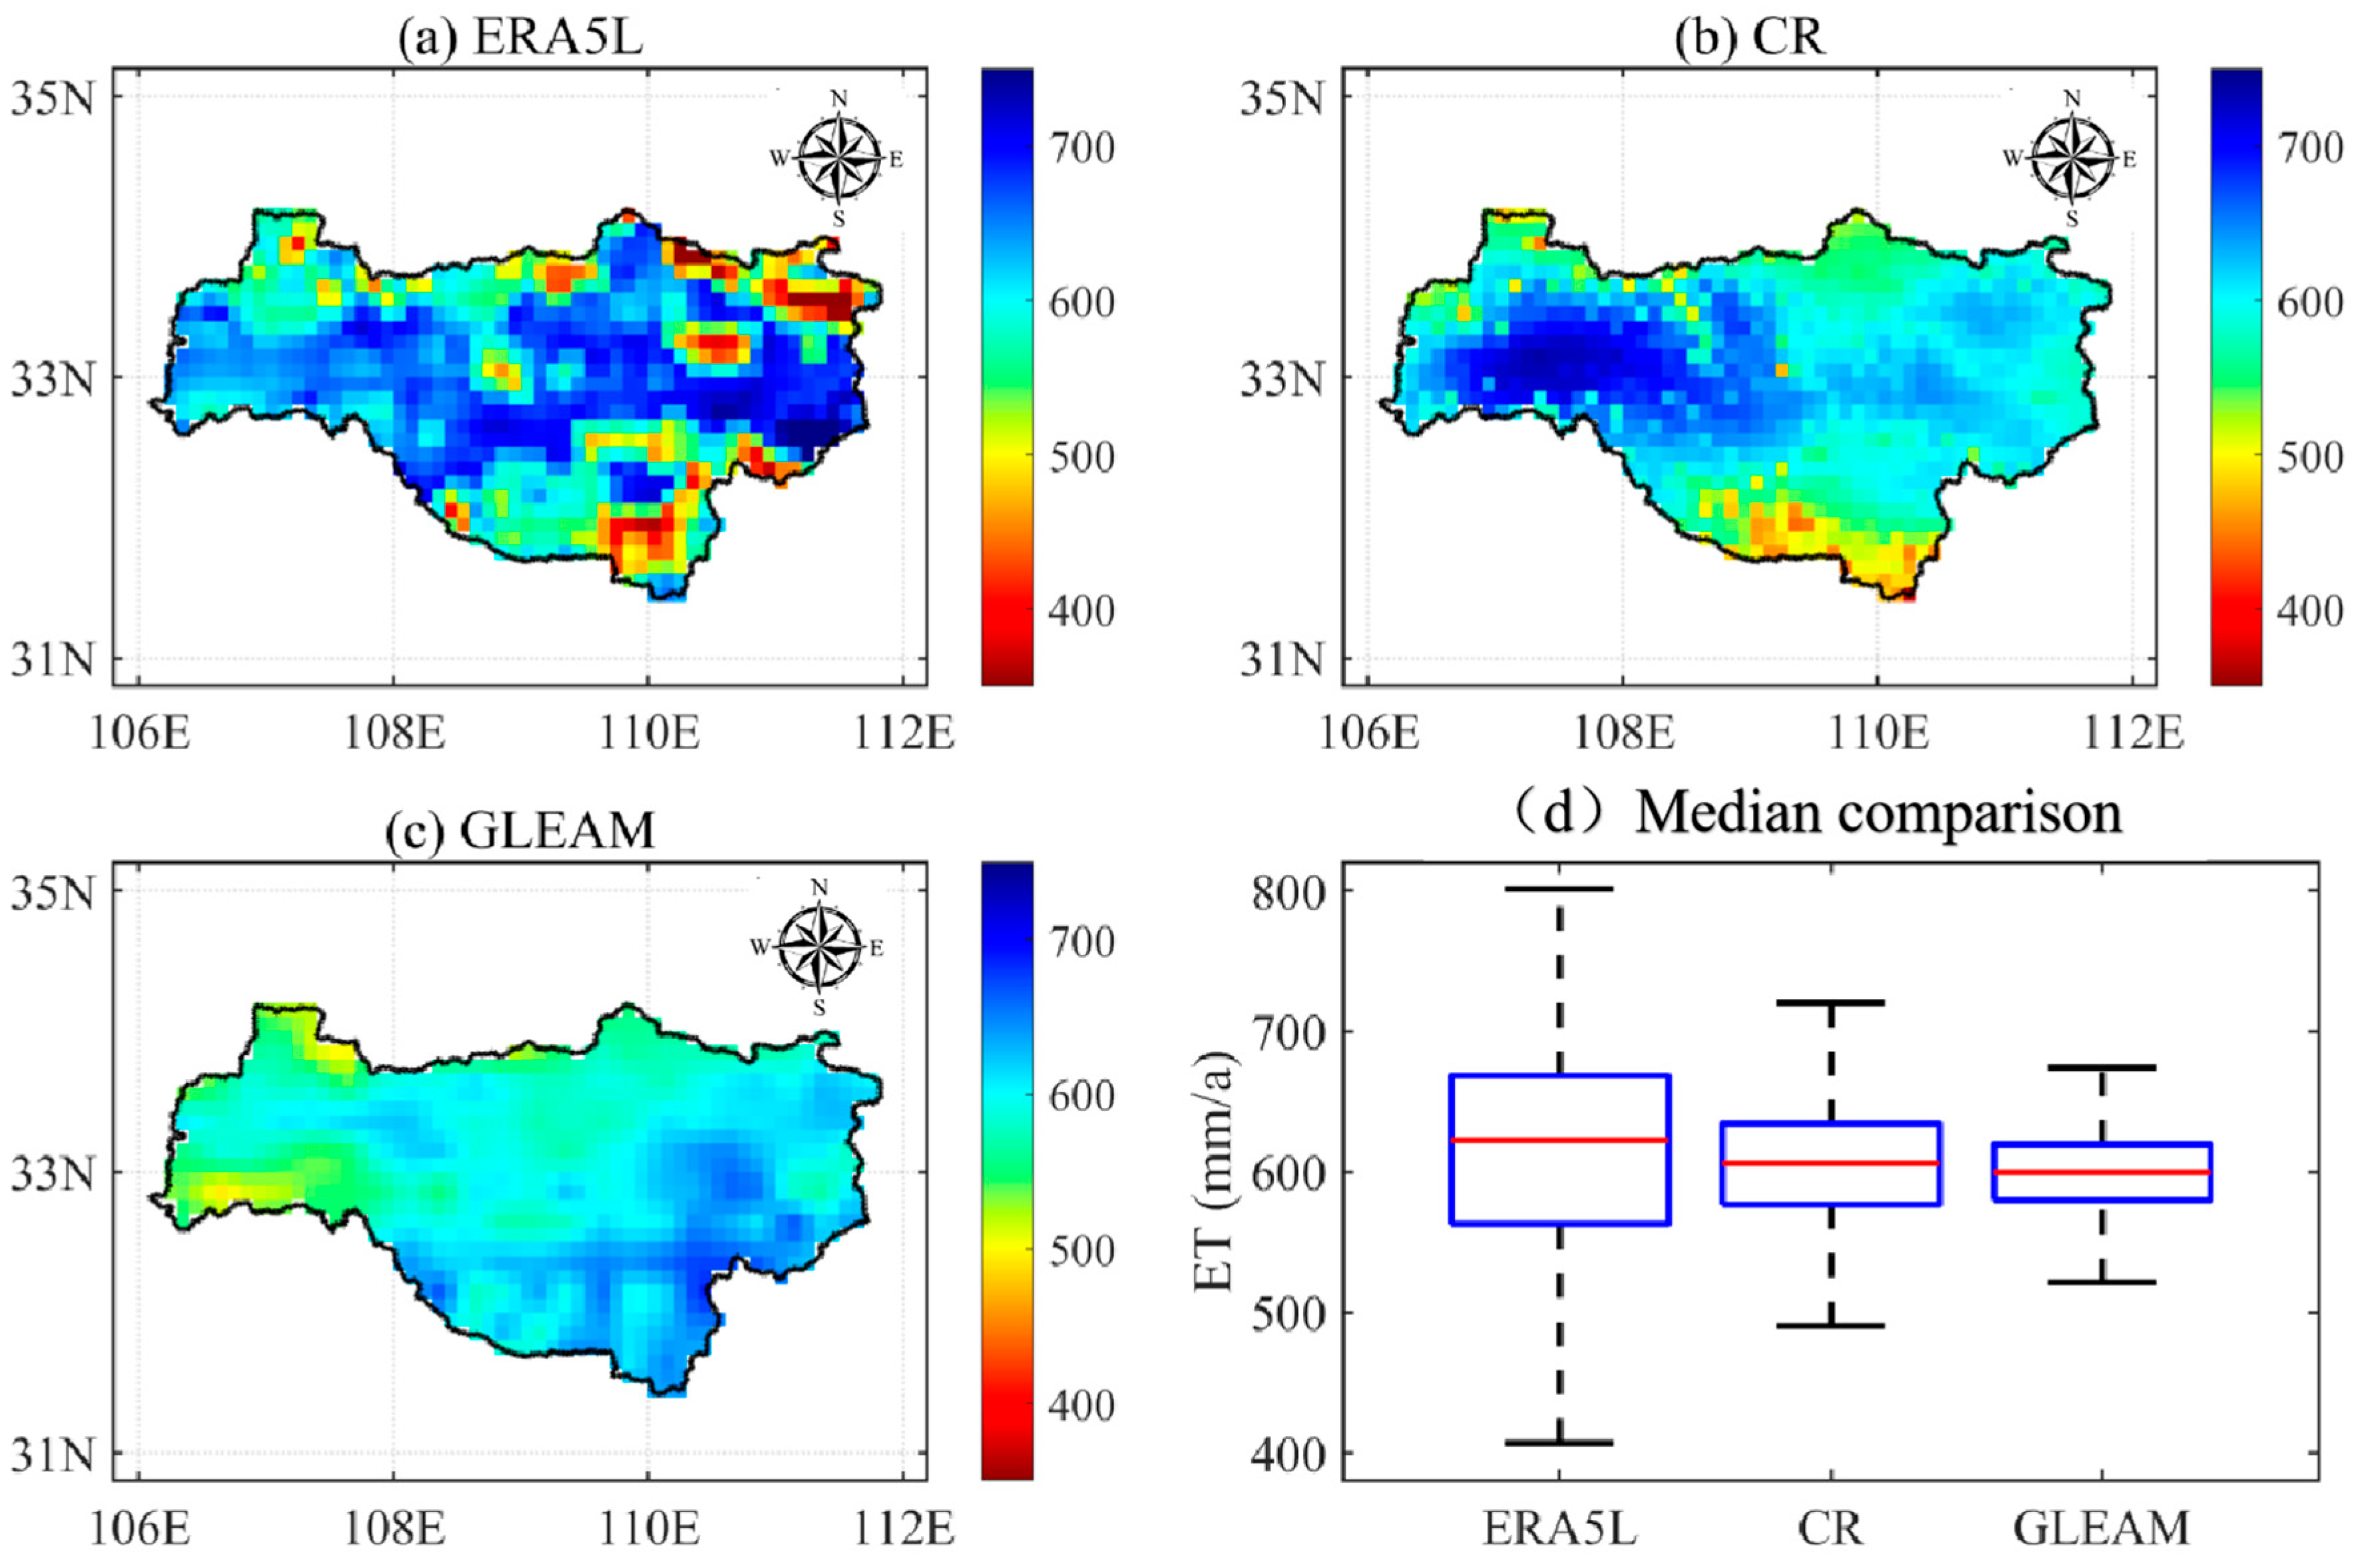
The spatial distribution of the multi-year average evapotranspiration from 1982 to 2017 in the Danjiangkou Reservoir was mapped in Figure 2 using the ERA5Land, CR, and GLEAM datasets.

Figure 2.
Spatial distribution of average annual evapotranspiration in the Danjiangkou Reservoir Basin from 1982 to 2017.
It can be seen from Figure 2 that the spatial distribution of evapotranspiration in the Danjiangkou Reservoir Basin from 1982 to 2017 is relatively obvious. For example, the evapotranspiration in the eastern and central parts of the basin is larger in ERA5Land, and the evapotranspiration in northeastern and southern parts is smaller. The multi-year average evapotranspiration for the whole basin is 605 mm/a. The evapotranspiration the western part of the basin is larger in CR, and the evapotranspiration in the southern part is smaller. The multi-year average evapotranspiration for the whole basin is 604 mm/a. The evapotranspiration in the southeastern part is larger in GLEAM, and the evapotranspiration the northwestern part is smaller. The multi-year average evapotranspiration for the whole basin is 598 mm/a. This difference may stem from the model algorithm using different data. Moreover, the spatial difference of evapotranspiration also reflects the complexity and heterogeneity of the underlying surface in the Danjiangkou Reservoir Basin. Although the spatial variability of the three sets of evapotranspiration data is large, the box plot in Figure 2d shows that the medians of the evapotranspiration amounts of the three are relatively close. Overall, ERA5Land has the largest range of values, with the most pronounced difference between its maximum and minimum values, while the GLEAM data is more consistent.
Plots of the interannual change trend of the three sets of evaporation data in the Danjiangkou Reservoir Basin from 1982 to 2017 are presented in Figure 3.
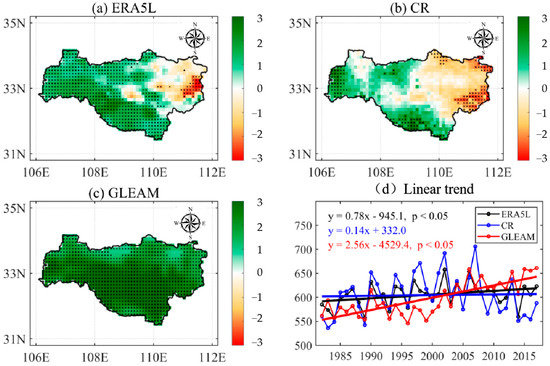
Figure 3.
Temporal and spatial trends of average annual evapotranspiration in the Danjiangkou Reservoir Basin from 1982 to 2017. Note: Red indicates a downward trend, green indicates an upward trend, and black dots indicate significant changes.
From Figure 3, it can be seen that overall, the three ET datasets all show an increasing trend, but there are some differences in their spatial distribution change rate. Among them, ERA5Land and CR data show significantly decreased trends in the eastern part of the basin and significantly increased trends in the northwest and southwest; GLEAM, on the other hand, showed a significant increase throughout the basin. Through linear trend analysis, it can be seen that the increasing trend of GLEAM evapotranspiration is the most obvious, with a growth rate of 2.56 mm/a, and it has passed the significance test at the 95% level. CR evapotranspiration has the weakest increasing trend, with growth rate of 0.14 mm/a, but it is not significant.
3.1.2. Seasonal Variation Trend of Evapotranspiration Within a Year
The interannual changes of the three ET datasets in the four seasons of the Danjiangkou Reservoir Basin from 1982 to 2017 are shown in Figure 4.
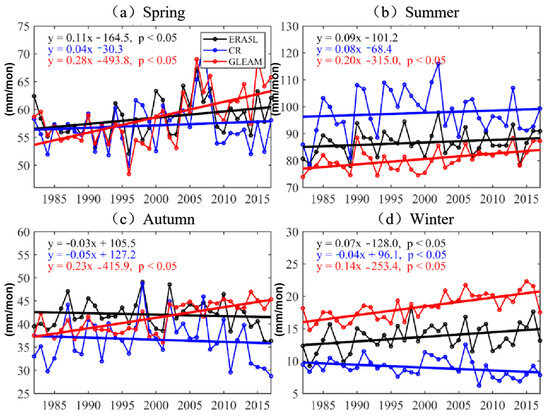
Figure 4.
Variation trend of evapotranspiration across four seasons in Danjiangkou Reservoir Basin from 1982 to 2017.
It can be seen from Figure 4 that the three sets of evapotranspiration data show different change trends in the four seasons of the year. In spring, the three datasets all showed an increasing trend, and the ERA5Land and GLEAM evapotranspiration data showed a significant increasing trend, with a growth rate of 0.11 mm/a and 0.28 mm/a, respectively. Similar to spring, summer evapotranspiration data from the three datasets showed an increasing trend, but its growth rate was less than that in spring. For autumn and winter, the three datasets show a divergence. In autumn, ERA5Land and CR data showed an insignificant decreasing trend, while the GLEAM dataset still maintained an increasing trend. For winter, the performance of the three datasets was more distinct, with ERA5Land and GLEAM data showing a significant increasing trend, but with a large difference in the growth rate for the CR data. On the other hand, CR data showed a significant decreasing trend. Overall, the three sets of data show a high degree of consistency in summer and a greater degree of variability in winter.
The spatial distribution of evapotranspiration across the four seasons of the Danjiangkou Reservoir Basin from 1982 to 2017 is mapped in Figure 5.
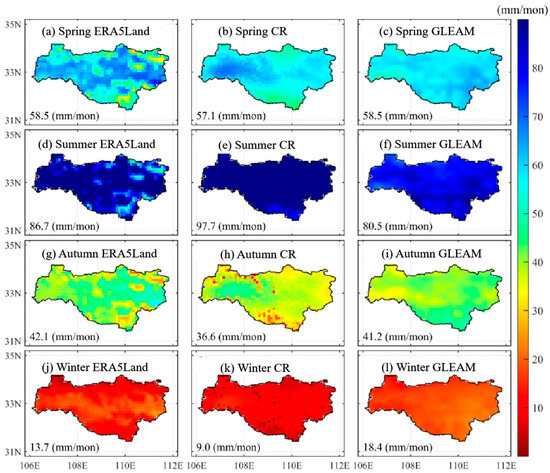
Figure 5.
Spatial distribution of evapotranspiration across four seasons in the Danjiangkou Reservoir Basin from 1982 to 2017. Note: The four lines from top to bottom represent the four seasons of spring, summer, autumn, and winter, and the three columns from left to right represent ERA5Land, CR, and GLEAM.
From Figure 5, it can be seen that the evapotranspiration in the summer of the Danjiangkou Reservoir Basin is the largest, exceeding 80.00 mm/mon. The spring and autumn are quite similar, basically maintained between 40.00 and 60.00 mm/mon. The evapotranspiration in winter is significantly less than other seasons, which is related to the relatively low temperature in winter. In addition to the significant reduction in vegetation coverage in winter, its vegetation transpiration is also reduced, resulting in a low overall evapotranspiration.
3.2. Data Fusion of Evapotranspiration Datasets Using the ETC Method
3.2.1. Integration of Data Source Error Analysis
According to the above ETC calculation principle, it can be seen that the root mean square error (RMSE) and correlation coefficient (CC) relative to unknown true value can be calculated using three fusion data sources without the need for the true value. The RMSE and correlation coefficient (CC) of the three sets of evapotranspiration data estimated based on the ETC method are plotted in Figure 6.
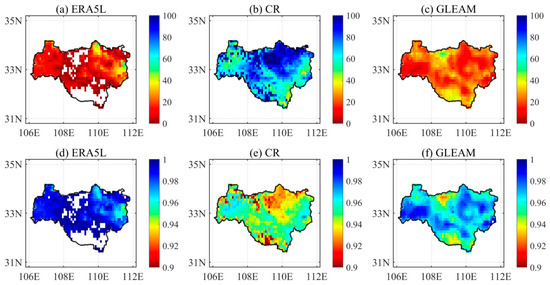
Figure 6.
The root mean square error (RMSE) (a–c) and correlation coefficient (CC) (d–f) are estimated based on ETC method.
From Figure 6a–c, it can be seen that the RMSE values of ERA5Land and GLEAM evapotranspiration data relative to the unknown true value are generally smaller than those of CR evapotranspiration data. Both are basically below 40.00 mm/mon and even less than 20.00 mm/mon in the middle and western parts of the basin, indicating that the difference between the two and the unknown value is small. In contrast, the RMSE value of CR is significantly larger than the former two, and the RMSE in some parts of the northeast of the can exceed 100.00 mm/mon. From Figure 6d–f, it can be seen that the correlation coefficient shows similar results to the RMSE. The correlation coefficient between ERA5Land and GLEAM evapotranspiration is generally high, mostly above 0.98. In comparison, although the correlation coefficient of CR can basically reach above 0.90, its performance is still slightly inferior to that of ERA5Land and GLEAM evapotranspiration data.
3.2.2. Analysis of the Data Fusion Results of Evapotranspiration
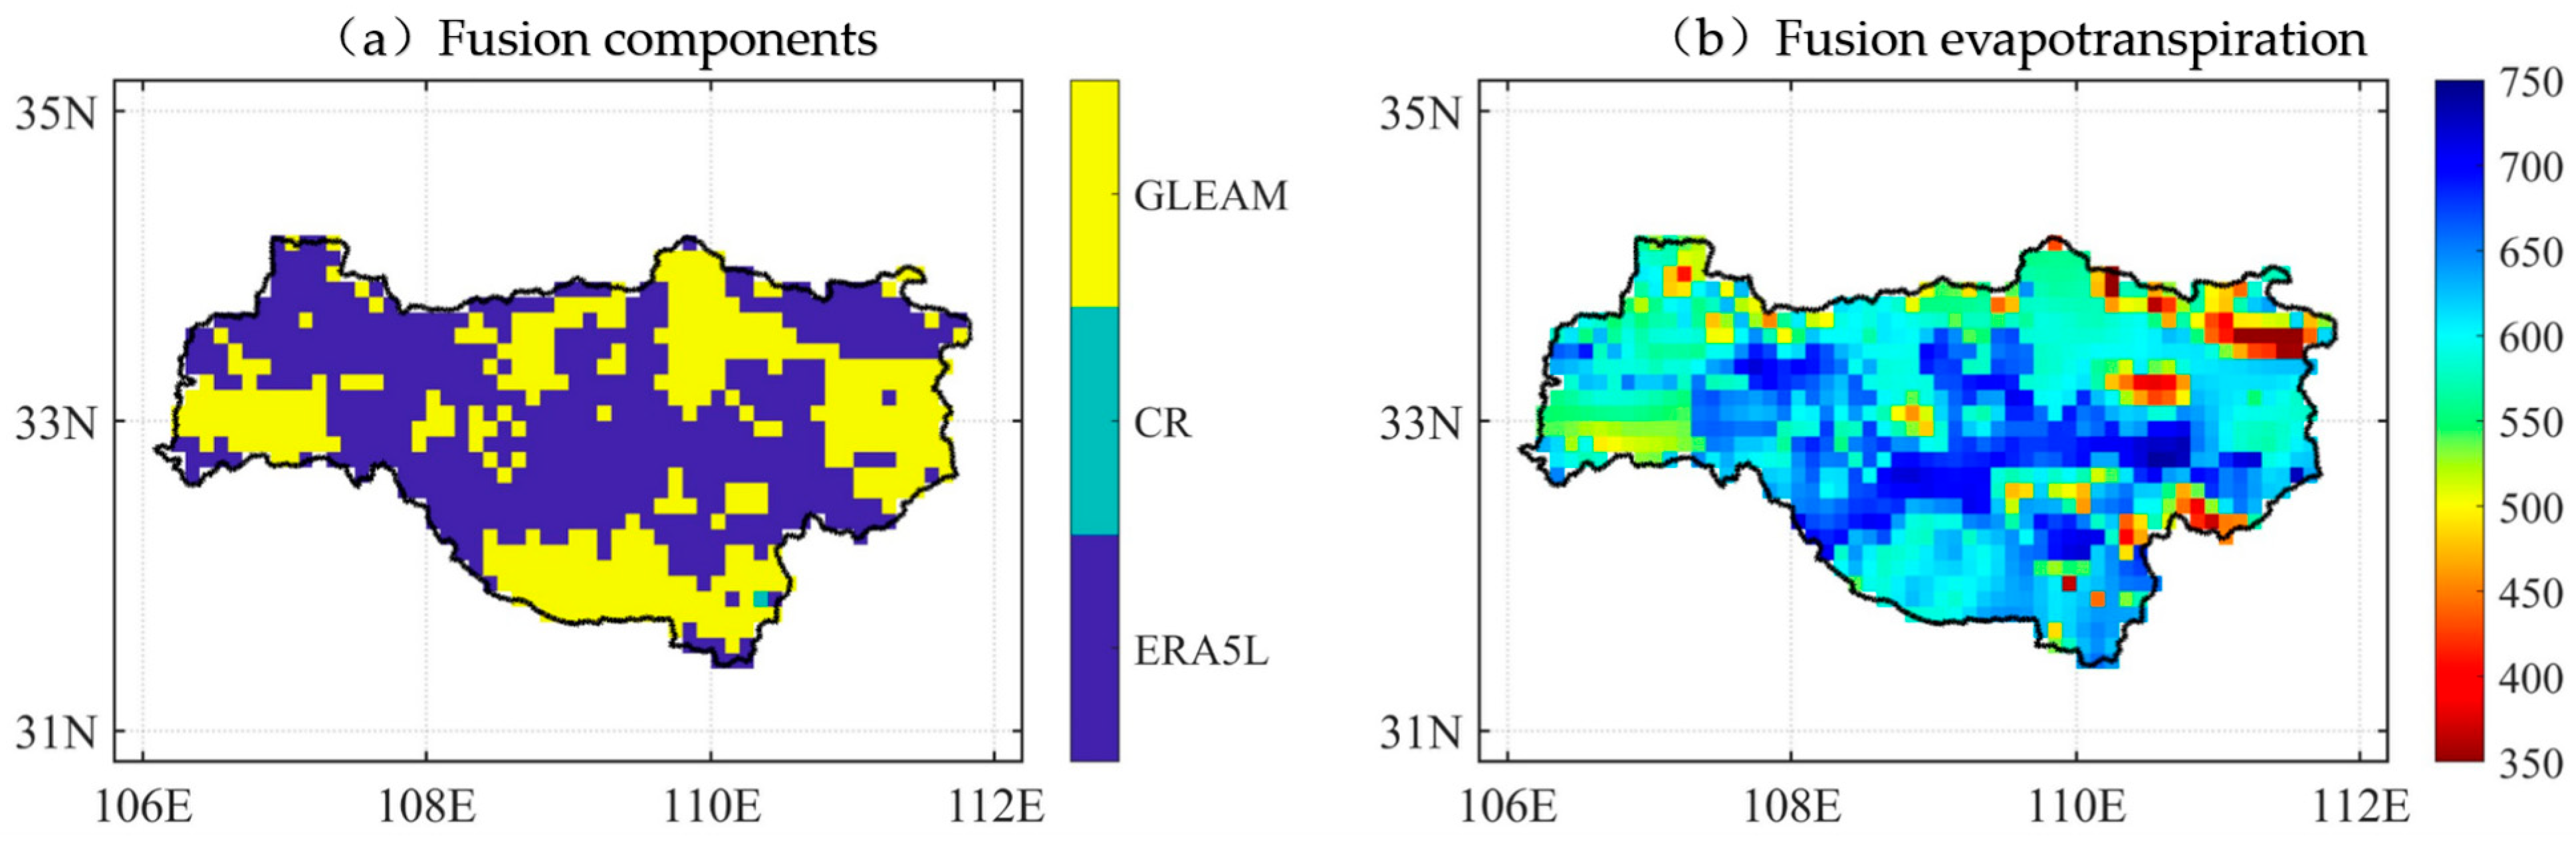
Based on the ERA5Land, CR, and GLEAM data sources, and following the principle of minimizing RMSE, the best performing evapotranspiration dataset was selected pixel by pixel as the basis for fusion, and the final fusion data product was formed, as shown in Figure 7.
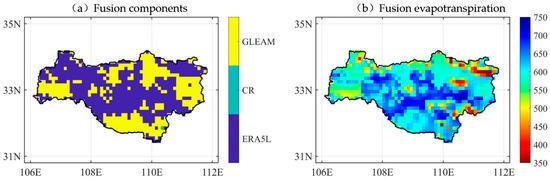
Figure 7.
Fusion components (a) and fusion evapotranspiration (b).
It can be seen from Figure 7 that the fusion evapotranspiration dataset is mainly composed of ERA5Land and GLEAM. It can be seen from Figure 7a that among the 552 pixels in the Danjiangkou Reservoir Basin, the ERA5Land data accounts for the largest proportion, with a value of 59.93%, mainly distributed in the northwest, northeast, and central parts of the basin. Second, the GLEAM dataset, with its outstanding performance, accounts for 39.96% of the integrated dataset, mainly distributed in the eastern and southern regions of the basin. In contrast, the CR evapotranspiration dataset contributed the least to the fusion results, with only about 1 pixel performing well, distributed in the eastern corner the basin. By comparing Figure 7b and Figure 2, it can be seen that the fusion dataset inherits the advantages of the ERA5Land dataset well, and the distribution of the fusion dataset is most similar to that of ERA5Land. Moreover, in the regions where GLEAM performs better, the fusion dataset can also inherit the characteristics of the GLEAM dataset well, achieving the organic integration of multi-source data.
3.3. Validation of Evapotranspiration Fusion
In order to assess the performance of merged evapotranspiration, we adopted the water balance method to derive the evapotranspiration observations. The equation can be written as follows:
where , , , and denote the precipitation (mm/month), streamflow (mm/month), evapotranspiration (mm/month), and the terrestrial water storage change (mm/month), respectively, and is the time step (here is month). For a given basin, P and Q are observed from meteorological or hydrological stations, and has been widely estimated from the Gravity Recovery and Climate Experiment (GRACE) satellite-based gravity field using numerical differentiation (Equation (11)) to reduce the noise. Consequently, the derived is usually regarded as “observational” to evaluate the evapotranspiration data performance. In this study, the precipitation is obtained from the CMFD (China Meteorological Forcing Dataset), which can be accessed from http://www.tpedatabase.cn (accessed on 30 June 2024). This dataset is produced based on 830 meteorological stations across China, resulting in a high-quality meteorological forcing dataset that covers China. The streamflow data are the inflow discharge into the reservoir, and these data are available from the Bureau of Hanjiang Hydrological and Water Resources Survey (http://hj.cjh.com.cn (accessed on 30 June 2024)). In this study, the monthly gravity solutions from the GRACE-FO Science Data System (https://grace.jpl.nasa.gov (accessed on 30 June 2024)) were averaged to minimize uncertainty. For months with missing solutions, cubic spline interpolation was adopted to reconstruct the continuous hydrometeorological series [28]. Concurrently, a Gaussian filtering technique was applied to mitigate high-frequency noise and refine data accuracy, following the methodology proposed by [29]. Given the GRACE mission’s temporal coverage of 2002–2017, the validation period was constrained to this exact duration.
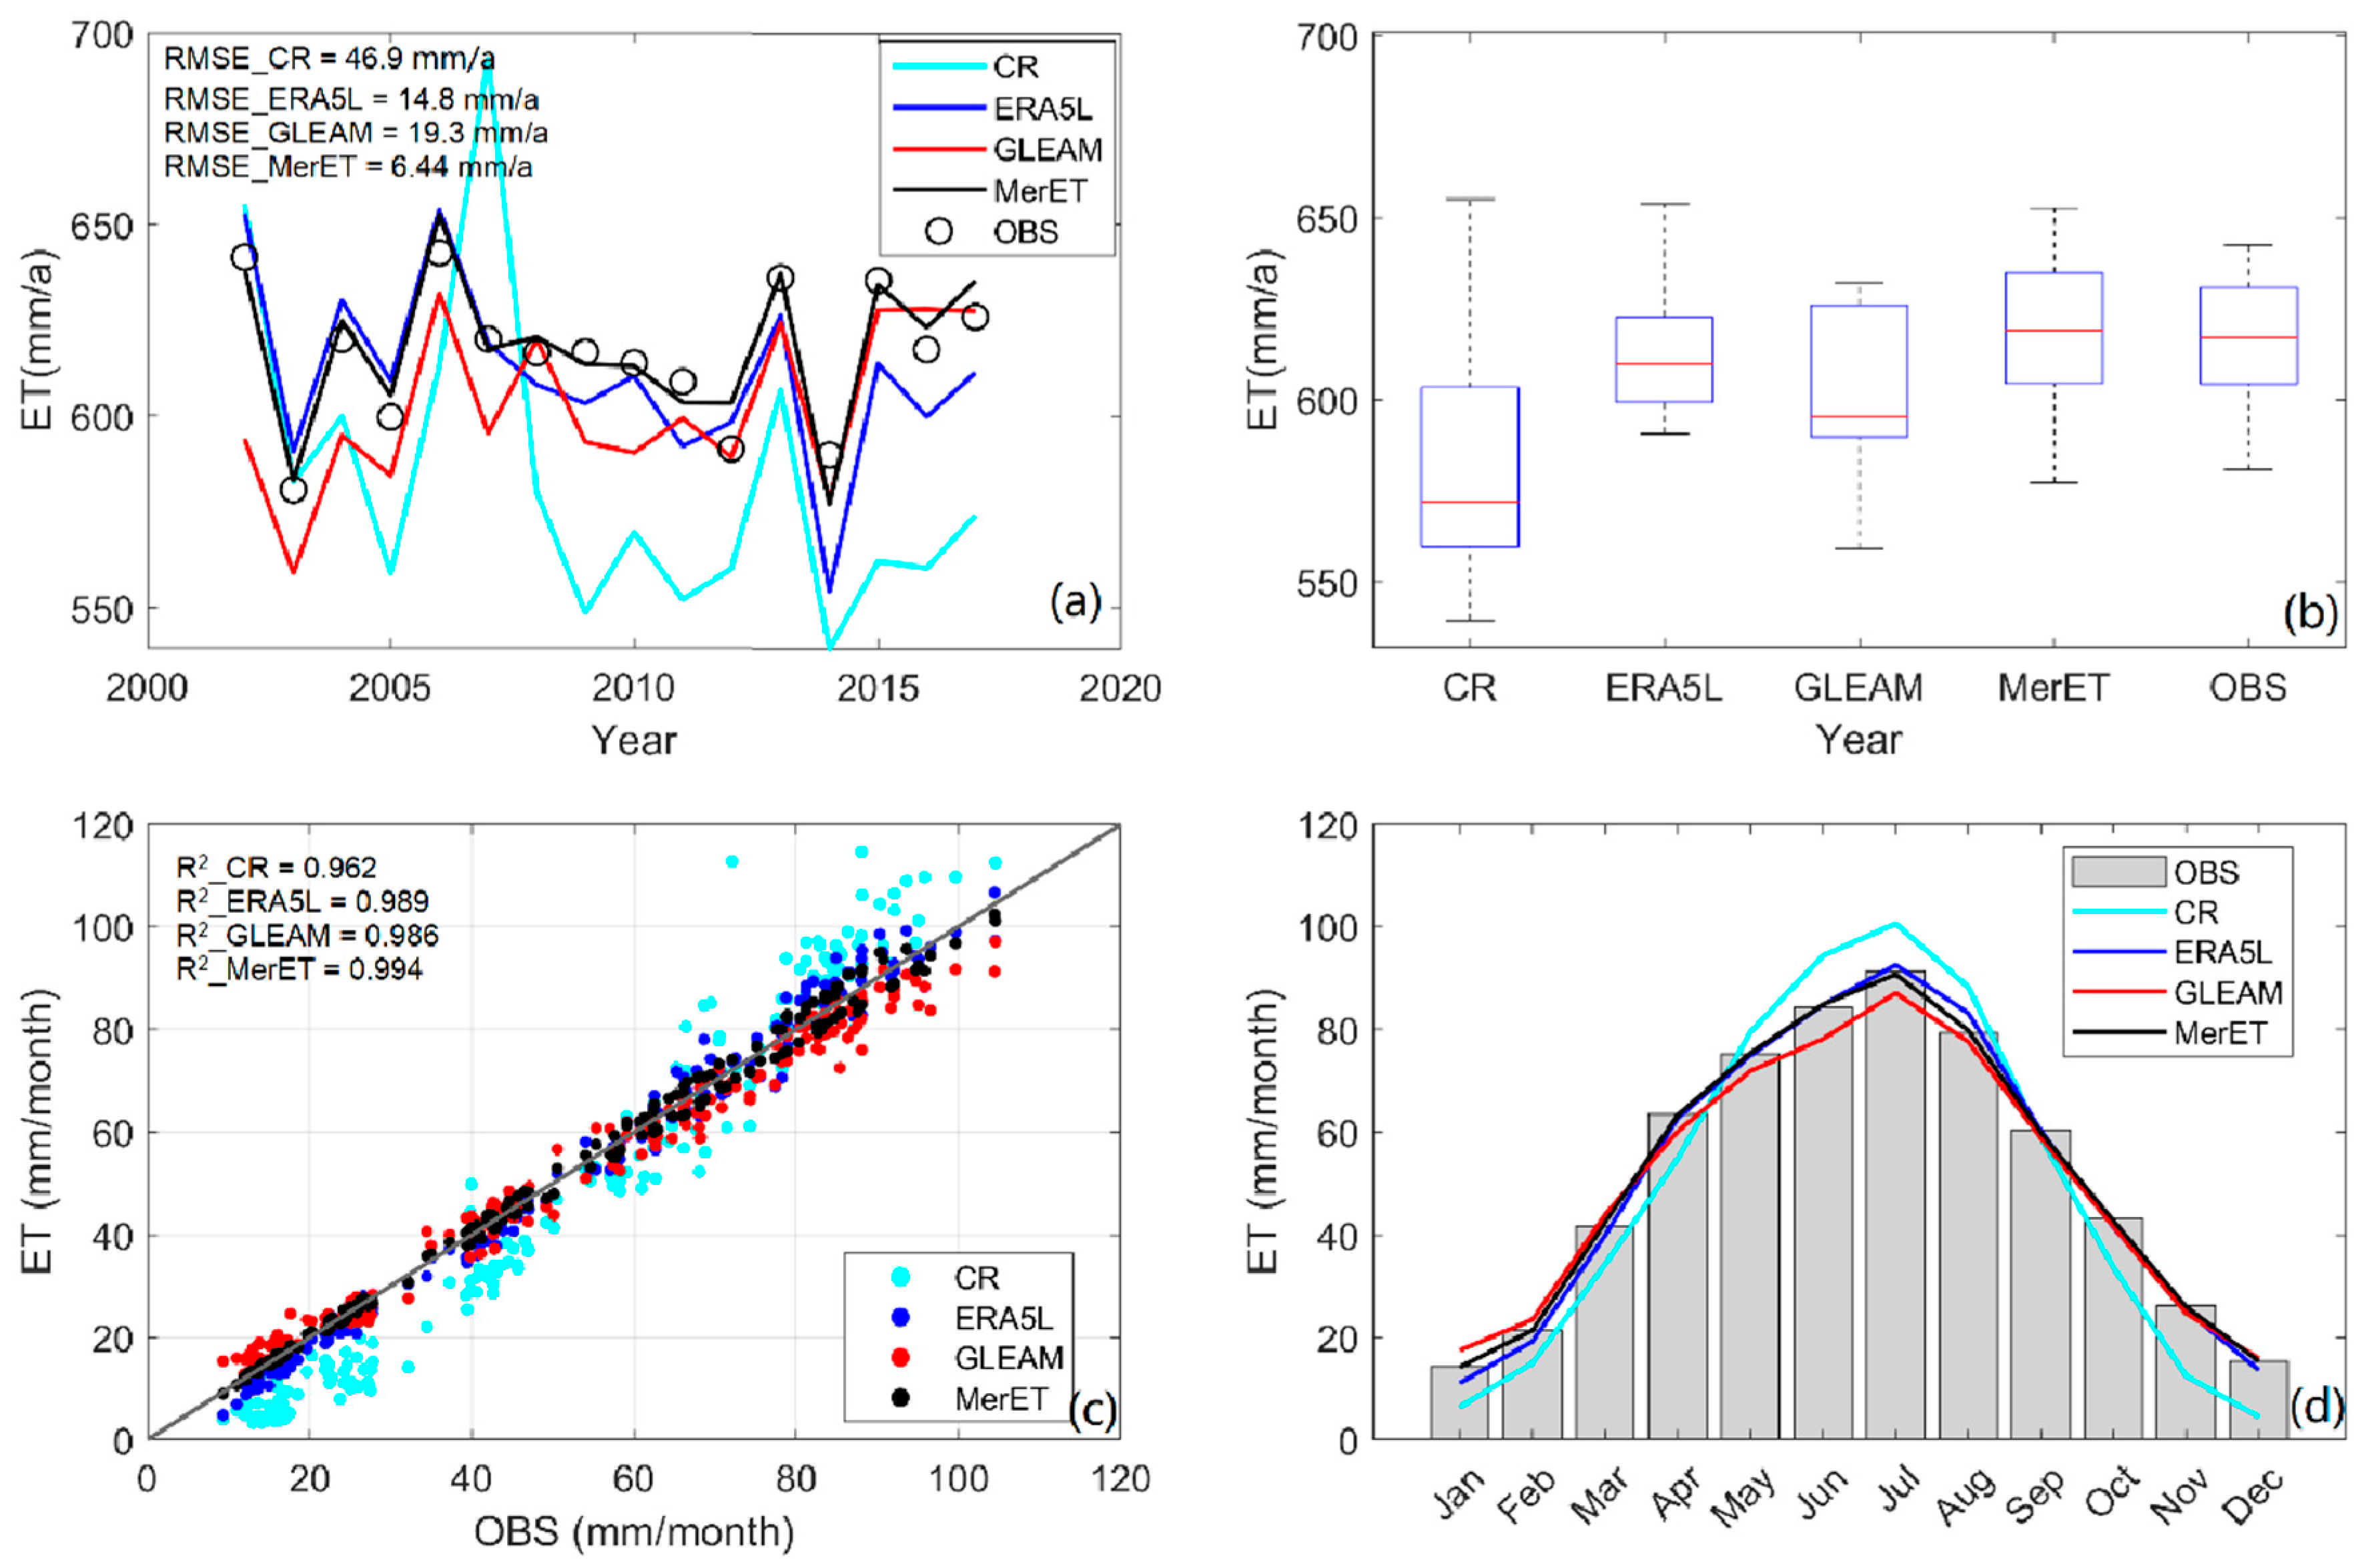
The results of validation are illustrated in Figure 8. The interannual evolution of evapotranspiration estimates and evapotranspiration observations are presented. The merged evapotranspiration yields the smallest RMSE (6.44 mm/a), and its curve best matches the interannual fluctuations of OBS, indicating optimal simulation accuracy for evapotranspiration interannual changes. The CR model shows the largest RMSE (46.9 mm/a), with curve fluctuations significantly deviating from observations, reflecting the poorest simulation performance, which implies the efficiency of the ETC method in ET data fusion. Moreover, the boxplot reflects the evapotranspiration data dispersion, which shows that merged evapotranspiration and OBS have smaller box ranges, with close medians. This indicates low data dispersion, concentrated evapotranspiration value distribution, and strong stability. On the contrary, the ERA5Land evapotranspiration product presents abnormal values in its data distribution and relatively poor stability. For CR, large overall deviation between its estimation values and observations are found, indicating the worst performance of this model. In addition, the monthly performances of evapotranspiration and observed data are illustrated in Figure 8c,d. Overall, all models exhibit significant positive correlations with observed monthly evapotranspiration (all the coefficient of determination R2 > 0.96), indicating reliable estimation of evapotranspiration on a monthly scale. By comparison, merged evapotranspiration has the highest R2 (0.994), with scatter points closest to the 1:1 fitting line, indicating the strongest linear correlation between fused monthly evapotranspiration data and observations. This further validates the effectiveness of the ETC method. CR shows the lowest R2 (0.962), with relatively dispersed scatter points and the weakest correlation. For seasonal cycles, all evapotranspiration estimations follow a distinct seasonal pattern: peaks in summer (June–August) and lows in winter (December–February). This is consistent with observed evapotranspiration seasonal changes. Among them, the monthly average curve of merged evapotranspiration best matches the observations, especially with nearly identical simulated and observed values in peak months (e.g., July). By contrast, the CR model presents evident overestimations in the warm season (June–August) and underestimations in the cold season (December–February). In a word, at both the interannual scale and the intra-annual seasonal scale, the merged evapotranspiration data demonstrate higher consistency with observed evapotranspiration. This indicates that the evapotranspiration fusion based on the ETC method exhibits reliability and stability in the Danjiangkou Basin.
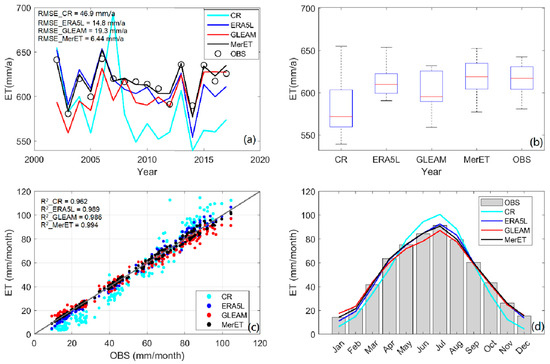
Figure 8.
Comparison of four evapotranspiration datasets, including the three original evapotranspiration datasets (i.e., CR, ERA5Land, GLEAM) and the merged evapotranspiration (MerET) and observational evapotranspiration (OBS) data obtained during 2002–2017. (a) Interannual variations of evapotranspiration estimates, (b) the evapotranspiration distribution characteristics of each evapotranspiration data and observational data, (c) the correlation of monthly evapotranspiration values between evapotranspiration data and observational data, and (d) the seasonal variations of monthly average ET.
4. Discussion
4.1. Advantages of the Newly Developed Dataset
In this study, through the analysis of three evapotranspiration datasets from different sources in the Danjiangkou Reservoir Basin, which is the water source area of the Middle Route Project of the South-to-North Water Diversion, the spatiotemporal evolution characteristics of the basin’s evapotranspiration were deeply explored. Moreover, using the ETC method, these datasets were integrated to reconstruct the basin’s evapotranspiration dataset, providing reliable data support for hydrological simulation research in the water source area.
In recent years, with the intensification of the trend of global warming, climate change has been profoundly affecting the Earth’s hydrological cycle [30]. Higher temperatures will directly lead to an increase in the saturation vapor pressure in the air. This means that under the same conditions, the air can hold more water, which may result in more precipitation. Moreover, the increased saturation vapor pressure will make the saturation difference between the actual vapor pressure and the saturation vapor pressure greater, leading a further increase in the evapotranspiration rate [20]. Therefore, the interannual change trend of the three evapotranspiration datasets obtained from this study can reflect this phenomenon, which indicates that this study is in line with the current climate change background. Moreover, compared with the previous scholars’ relevant research, Chen [31] merged the three evapotranspiration datasets of GLEAM, GLDAS, and ERA5 in the Yellow River Basin, and the study found that the proportions of GLEAM and ERA5 were 43.00% and 51.00%, respectively. This was similar to the performance of GLEAM and ERA5Land in the Danjiangkou Reservoir Basin in this study. On the one hand, this can indirectly verify the reliability of the results in this study. On the other hand, it also reveals that the GLEAM and ERA5Land evapotranspiration datasets have relatively excellent performances in both the Yellow River Basin and the Yangtze River Basin and provide a data source for further research on hydrological simulation in the basin. The excellent performance of the GLEAM dataset mainly stems from the Priestley–Taylor equation, which is a simplification of the Penman–Monteith equation considering only the radiation factor control term, avoiding the need to consider complex micro-processes such as stomatal resistance [32]. Therefore, under the condition of sufficient surface moisture supply, the Priestley–Taylor formula is more widely used and can be applied to a variety of surface conditions [33].
4.2. Limitations and Prospects
Although the ERA5Land evapotranspiration dataset shows the smallest RMSE and the highest correlation coefficient overall, it can be seen from Figure 6a,d that the values in the northern and southern regions of ERA5Land are missing. This result is due to the fact that some grid data in the fusion process violate the assumption of zero error expectation for the ETC method; thus, it is difficult to obtain the optimal value for the whole basin using the ERA5Land dataset [24]. Of course, this is also related to the complexity of the evapotranspiration process itself, which is affected by meteorological conditions (such as temperature, vapor pressure, and wind speed) and is also limited by the underlying surface of the land (such as soil type, soil moisture, vegetation type). Thus, it is difficult for a single evapotranspiration data source to perform optimally on all land surfaces [34]. To this end, it is necessary to merge the multi-source evapotranspiration dataset to better mine the advantages of all parties to form an optimal merged dataset [35,36].
Moreover, this study analyzed and integrated the spatiotemporal evolution of evapotranspiration in the Danjiangkou Reservoir basin using datasets from different sources, achieving certain research results. However, there are still some shortcomings that need to be further investigated in future research.
- (1)
- In the context of big data, the ways and means of obtaining surface information are increasing, and the resulting datasets are also increasing. This study only selected three sets of evapotranspiration data from different sources for analysis and fusion. In future research, the advantages of big data can be utilized to integrate more different types of evapotranspiration datasets for research, to minimize the uncertainty brought by the choice of datasets.
- (2)
- Due to the limitations of the source data itself, the spatial scale of this study is 0.1° × 0.1°, which is an approximate grid of 10 km × 10 km. For watersheds with strong surface heterogeneity, this resolution is still slightly coarse [35]. In future research, downscaling studies can be conducted by first combining land surface types, and then higher-resolution fusion studies can be carried out.
- (3)
- This study focuses on the evolution and integration of basin evapotranspiration methods. Thus, when combined with the time span of the source dataset, the time period of study is 1982–2017. In future research, the model data of the sixth international coupled model intercomparison project (CMIP6) organized by the World Climate Research Program “Coupled Intercomparison Project” [37] can be combined to predict and simulate the evapotranspiration process in the source area basin in the future, so as to better correspond the impact of climate change on the basin water cycle.
5. Conclusions
This paper explores the spatiotemporal evolution characteristics of evapotranspiration in the Danjiangkou Reservoir Basin, the water source area of middle route of the South-to-North Water Transfer Project, from 1982 to 2017, based on the advantages of multi-source evapotranspiration datasets. The study used three evapotranspiration datasets, namely, ERA5Land, CR, and GLEAM, and Mann–Kendall analysis and Sen’s Slope trend analysis. The ETC method was used to merge the three sets of evapotranspiration data, and a higher-precision evapotranspiration dataset was developed. The main conclusions of this study are as follows:
- (1)
- The ERA5Land, CR, and GLEAM evapotranspiration datasets show a consistent multi-year average evapotranspiration value in the Danjiangkou Reservoir Basin, basically around 600 mm/a. However, due to the different algorithms used for the different types of models, the spatial distribution of the three ET datasets showed significant differences, indicating the complexity of the ET and the challenge of measuring it.
- (2)
- The annual evapotranspiration of the three datasets in the Danjiangkou Reservoir Basin has shown an increasing trend to varying degrees. Specifically, ERA5Land and GLEAM datasets show a significant increasing trend, and the GLEAM dataset has the largest growth rate, with a value of 2.56 mm/a. In contrast, the CR growth rate was the smallest, with a value of 0.14 mm/a. The interannual change in evapotranspiration is mainly due to the increase in evapotranspiration during spring and summer within the year. Among them, the increase in spring is the most obvious. Although the evapotranspiration in summer accounts for the largest proportion of the whole year, its growth rate is less than that in spring. In addition, although the evapotranspiration in winter is the smallest, the difference in the change trend of the three evapotranspiration datasets is the largest.
- (3)
- Based on the principle of minimum uncertainty, the ETC was used to merge the three sets of evapotranspiration data. The results show that the data quality of ERA5Land and GLEAM evapotranspiration data generally better than that of CR, and the RMSE and indicators of the former two are significantly better than those of the latter. Therefore, in the merged dataset, the proportions of ERA5Land and GLEAM among the three datasets were 59.93% and 3.96%, respectively, and the combined proportion exceeded 99%.
- (4)
- In the context of climate change, by taking advantage of multi-source data sources, the data fusion study of evapotranspiration in the Danjiangkou Reservoir Basin can provide data support for further realizing precise hydrological simulation, constructing digital twin basins, and building smart water conservancy projects in the basin. It can also provide scientific guidance for the basin to better respond to extreme climate changes and scientifically manage the allocation of water resources.
Author Contributions
Conceptualization, Writing—original draft, Supervision, Funding acquisition, Validation, Writing—review & editing, S.L.; Conceptualization, Methodology, Writing—review & editing, Project administration, Supervision, Validation, Funding acquisition, D.W.; Funding acquisition, Methodology, Writing—review & editing, Supervision, Conceptualization, Project administration, X.L.; Software, Investigation, Writing—original draft, Visualization, Data curation, M.W.; Validation, Writing—review & editing, Project administration, Supervision, Writing—original draft, Y.M.; Formal analysis, Resources, Funding acquisition, Writing—review & editing, Project administration, Z.Y. All authors have read and agreed to the published version of the manuscript.
Funding
This research was supported by the Henan Province’s Water Conservancy Science and Technology Research and Development (No. GG202453), the High-Level Talent Introduction Research Project of the Nanyang Normal University (No. 2024ZX017), the Key Projects of the Basic and Frontier Technology Research Special Program in Nanyang City (No. 23JCQY1004), the Natural Science Foundation of Henan (No. 242300420354), the National Natural Science Foundation Cultivation Project of the Nanyang Normal University (No. 2025PY010), and the Overseas Expertise Center for Discipline Innovation of Watershed Ecological Security in the Water Source Area of the Mid-line Project of South-to-North Water Diversion (D23015).
Institutional Review Board Statement
This study does not involve any content related to ethics.
Informed Consent Statement
Not applicable.
Data Availability Statement
The original contributions presented in this study are included in the article; further inquiries can be directed to the corresponding author.
Conflicts of Interest
The authors declare no conflicts of interest.
References
- Zipper, S.; Kastens, J.; Foster, T.; Wilson, B.B.; Melton, F.; Grinstead, A.; Deines, J.M.; Butler, J.J.; Marston, L.T. Estimating irrigation water use from remotely sensed evapotranspiration data: Accuracy and uncertainties at field, water right, and regional scales. Agric. Water Manag. 2024, 303, 109036. [Google Scholar] [CrossRef]
- Perez, M.; Lombardi, D.; Bardino, G.; Vitale, M. Drought assessment through actual evapotranspiration in Mediterranean vegetation dynamics. Ecol. Indic. 2024, 166, 112359. [Google Scholar] [CrossRef]
- Li, F.; Yang, Y. Impacts of the Middle Route of China’s South-to-North Water Diversion Project on the water network structure in the receiving basin. Environ. Sci. Pollut. Res. 2024, 31, 15611–15626. [Google Scholar] [CrossRef] [PubMed]
- Liu, S. The Impact of Ecological Governance Projects on Regional Ecological Carrying Capacity Under Climate Change. Atmosphere 2024, 15, 1490. [Google Scholar] [CrossRef]
- Wu, L.; Wang, Z.; Chang, T.; Song, B.; Zhao, T.; Wang, H.; Ma, M. Morphological characteristics of amino acids in wet deposition of Danjiangkou Reservoir in China’s South–to–North Water Diversion Project. Environ. Sci. Pollut. Res. 2022, 29, 73100–73114. [Google Scholar] [CrossRef]
- Nong, X.; Guan, X.; Chen, L.; Wei, J.; Li, R. Identifying environmental impacts on planktonic algal proliferation and associated risks: A five-year observation study in Danjiangkou Reservoir, China. Sci. Rep. 2024, 14, 21568. [Google Scholar] [CrossRef] [PubMed]
- Cai, Y.; Xu, Q.; Bai, F.; Cao, X.; Wei, Z.; Lu, X.; Wei, N.; Yuan, H.; Zhang, S.; Liu, S.; et al. Reconciling Global Terrestrial Evapotranspiration Estimates From Multi-Product Intercomparison and Evaluation. Water Resour. Res. 2024, 60, e2024WR037608. [Google Scholar] [CrossRef]
- Ma, N.; Szilagyi, J.; Zhang, Y. Calibration-Free Complementary Relationship Estimates Terrestrial Evapotranspiration Globally. Water Resour. Res. 2021, 57, e2021WR029691. [Google Scholar] [CrossRef]
- Di, Z.; Ao, J.; Duan, Q.; Wang, J.; Gong, W.; Shen, C.; Gan, Y.; Liu, Z. Improving WRF model turbine-height wind-speed forecasting using a surrogate-based automatic optimization method. Atmos. Res. 2019, 226, 1–16. [Google Scholar] [CrossRef]
- Norman, J.M. Source approach for estimating soil and vegetationenergy fluxes in observations of directionalradiometric surface temperature. Agric. For. Meteorol. 1995, 77, 263–293. [Google Scholar]
- Anderson, M.C.; Norman, J.M.; Mecikalski, J.R.; Otkin, J.A.; Kustas, W.P. A climatological study of evapotranspiration and moisture stress across the continental United States based on thermal remote sensing: 2. Surface moisture climatology. J. Geophys. Res. Atmos. 2007, 112, D11112. [Google Scholar] [CrossRef]
- Anderson, M.; Norman, J.; Kustas, W.; Houborg, R.; Starks, P.; Agam, N. A thermal-based remote sensing technique for routine mapping of land-surface carbon, water and energy fluxes from field to regional scales. Remote Sens. Environ. 2008, 112, 4227–4241. [Google Scholar] [CrossRef]
- Cawse-Nicholson, K.; Braverman, A.; Kang, E.L.; Li, M.; Johnson, M.; Halverson, G.; Anderson, M.; Hain, C.; Gunson, M.; Hook, S. Sensitivity and uncertainty quantification for the ECOSTRESS evapotranspiration algorithm—DisALEXI. Int. J. Appl. Earth Obs. Geoinf. 2020, 89, 102088. [Google Scholar] [CrossRef]
- Cammalleri, C.; Anderson, M.C.; Ciraolo, G.; D’Urso, G.; Kustas, W.P.; La Loggia, G.; Minacapilli, M. Applications of a remote sensing-based two-source energy balance algorithm for mapping surface fluxes without in situ air temperature observations. Remote Sens. Environ. 2012, 124, 502–515. [Google Scholar] [CrossRef]
- Chen, H.; Jeanne Huang, J.; Berg, A.; McBean, E. Development of a trapezoidal framework-based model (PCALEP) for partition of land evapotranspiration. J. Hydrol. 2020, 589, 124994. [Google Scholar] [CrossRef]
- Mu, Q.; Heinsch, F.A.; Zhao, M.; Running, S.W. Development of a global evapotranspiration algorithm based on MODIS and global meteorology data. Remote Sens. Environ. 2007, 111, 519–536. [Google Scholar] [CrossRef]
- Chen, P.; Wang, L.; Li, J.-Y.; Wan, W.; Zhang, R.-Q.; Liu, Y.; Li, Z.-G. Response of soil aggregate-associated fertility and microbial communities to afforestation in the degraded ecosystem of the Danjiangkou Reservoir, China. Plant Soil 2023, 501, 171–189. [Google Scholar] [CrossRef]
- Jin, H.; Yu, C.; Lin, L.; Cheng, J.; Qin, H.; Tao, J.; Deng, S. Pollution levels and ecological risks of PPCPs in water and sediment samples of Danjiangkou Reservoir. Environ. Sci. Pollut. Res. 2024, 31, 30163–30173. [Google Scholar] [CrossRef]
- Feng, W.; Tao, Y.; Liu, M.; Deng, Y.; Yang, F.; Liao, H.; Li, T.; Song, F.; Ngien, S.K. Distribution and risk assessment of nutrients and heavy metals from sediments in the world-class water transfer projects. Environ. Sci. Eur. 2024, 36, 140. [Google Scholar] [CrossRef]
- Liu, Z.; Di, Z.; Zhang, W.; Sun, H.; Tian, X.; Meng, H.; Liu, J. The Historical and Future Variations of Water Conservation in the Three-River Source Region (TRSR) Based on the Soil and Water Assessment Tool Model. Atmosphere 2024, 15, 889. [Google Scholar] [CrossRef]
- Lu, L.; Ma, Q. Diurnal Cycle in Surface Incident Solar Radiation Characterized by CERES Satellite Retrieval. Remote Sens. 2023, 15, 3217. [Google Scholar] [CrossRef]
- Harrigan, S.; Zsoter, E.; Alfieri, L.; Prudhomme, C.; Salamon, P.; Wetterhall, F.; Barnard, C.; Cloke, H.; Pappenberger, F. GloFAS-ERA5 operational global river discharge reanalysis 1979–present. Earth Syst. Sci. Data 2020, 12, 2043–2060. [Google Scholar] [CrossRef]
- Pei, W.; Hao, L.; Fu, Q.; Ren, Y.; Li, T. The standardized precipitation evapotranspiration index based on cumulative effect attenuation. J. Hydrol. 2024, 635, 131148. [Google Scholar] [CrossRef]
- Duan, Z.; Duggan, E.; Chen, C.; Gao, H.; Dong, J.; Liu, J. Comparison of traditional method and triple collocation analysis for evaluation of multiple gridded precipitation products across Germany. J. Hydrometeorol. 2021, 221, 2983–2999. [Google Scholar] [CrossRef]
- Wang, H.; Gong, W.; Duan, Q.; Di, Z. Evaluation of parameter interaction effect of hydrological models using the sparse polynomial chaos (SPC) method. Environ. Model. Softw. 2020, 125, 104612. [Google Scholar] [CrossRef]
- Yao, Y.; Liang, S.; Fisher, J.B.; Zhang, Y.; Cheng, J.; Chen, J.; Jia, K.; Zhang, X.; Bei, X.; Shang, K.; et al. A Novel NIR–Red Spectral Domain Evapotranspiration Model from the Chinese GF-1 Satellite: Application to the Huailai Agricultural Region of China. IEEE Trans. Geosci. Remote Sens. 2021, 59, 4105–4119. [Google Scholar] [CrossRef]
- Li, M.; Di, Z.; Duan, Q. Effect of sensitivity analysis on parameter optimization: Case study based on streamflow simulations using the SWAT model in China. J. Hydrol. 2021, 603, 126896. [Google Scholar] [CrossRef]
- Zheng, S.; Zhang, Z.; Yan, H.; Zhao, Y.; Li, Z. Characterizing drought events occurred in the Yangtze River Basin from 1979 to 2017 by reconstructing water storage anomalies based on GRACE and meteorological data. Sci. Total Environ. 2023, 868, 161755. [Google Scholar] [CrossRef]
- Xiang, L.; Wang, H.; Steffen, H.; Qiao, B.; Feng, W.; Jia, L.; Gao, P. Determination of Weak Terrestrial Water Storage Changes from GRACE in the Interior of the Tibetan Plateau. Remote Sens. 2022, 14, 544. [Google Scholar] [CrossRef]
- Yang, Y.; Roderick, M.L.; Guo, H.; Miralles, D.G.; Zhang, L.; Fatichi, S.; Luo, X.; Zhang, Y.; McVicar, T.R.; Tu, Z.; et al. Evapotranspiration on a greening Earth. Nat. Rev. Earth Environ. 2023, 4, 626–641. [Google Scholar] [CrossRef]
- Chen, X.; Deng, C. Evaluation and Integration of Multiple Evapotranspiration Products in the Yellow River Basin. Water Resour. Power 2021, 39, 5–8+57. [Google Scholar]
- Dong, J.; Lei, F.; Crow, W.T. Land transpiration-evaporation partitioning errors responsible for modeled summertime warm bias in the central United States. Nat. Commun. 2022, 13, 336. [Google Scholar] [CrossRef] [PubMed]
- Zheng, Q.; Huang, X.; Zheng, T.; He, J.; Xiang, M.; Qin, M.; Jin, K. The Abrupt Change in Potential Evapotranspiration and Its Climatic Attribution over the Past 50 Years in the Sichuan–Chongqing Region, China. Atmosphere 2024, 15, 829. [Google Scholar] [CrossRef]
- Lu, L.; Li, Y.; Liang, L.; Ma, Q. Diurnal Variation in Surface Incident Solar Radiation Retrieved by CERES and Himawari-8. Remote Sens. 2024, 16, 2670. [Google Scholar] [CrossRef]
- Fisher, J.B.; Melton, F.; Middleton, E.; Hain, C.; Anderson, M.; Allen, R.; McCabe, M.F.; Hook, S.; Baldocchi, D.; Townsend, P.A.; et al. The future of evapotranspiration: Global requirements for ecosystem functioning, carbon and climate feedbacks, agricultural management, and water resources. Water Resour. Res. 2017, 53, 2618–2626. [Google Scholar] [CrossRef]
- Wang, H.; Huo, X.; Duan, Q.; Liu, R.; Luo, S. Uncertainty Quantification for the Noah-MP Land Surface Model: A Case Study in a Grassland and Sandy Soil Region. J. Geophys. Res. Atmos. 2023, 128, e2023JD038556. [Google Scholar] [CrossRef]
- Yao, Y.; Liang, S.; Cao, B.; Liu, S.; Yu, G.; Jia, K.; Zhang, X.; Zhang, Y.; Chen, J.; Fisher, J.B. Satellite Detection of Water Stress Effects on Terrestrial Latent Heat Flux With MODIS Shortwave Infrared Reflectance Data. J. Geophys. Res. Atmos. 2018, 123, 410–430. [Google Scholar] [CrossRef]


Disclaimer/Publisher’s Note: The statements, opinions and data contained in all publications are solely those of the individual author(s) and contributor(s) and not of MDPI and/or the editor(s). MDPI and/or the editor(s) disclaim responsibility for any injury to people or property resulting from any ideas, methods, instructions or products referred to in the content. |
© 2025 by the authors. Licensee MDPI, Basel, Switzerland. This article is an open access article distributed under the terms and conditions of the Creative Commons Attribution (CC BY) license (https://creativecommons.org/licenses/by/4.0/).