Abstract
Over the past two decades, agricultural nitrous oxide (N2O) emissions have increased significantly, further intensifying their impact on global warming. Accurate emission estimates are essential for developing effective N2O-mitigation strategies. However, the high-resolution, dynamic simulations of emissions and comprehensive analysis of their driving mechanisms in China remain unclear. In this study, we constructed a city-level agricultural N2O emission inventory covering 336 cities in China from 2000 to 2022 based on multi-source data and machine learning algorithms. Results demonstrate that China’s cropland N2O emissions averaged 390 Gg year−1 during 2000 and 2022, exhibiting sustained growth until 2016, followed by a 13% reduction driven by the nationwide Fertilizer Reduction Policy implementation. Maize, wheat, and rice are identified as the main sources of cropland N2O emissions. Spatially, higher N2O emission intensities were concentrated in eastern China, and hotspots were identified in the Huang-Huai-Hai Plain (5.23 kg ha−1) and the Middle-Lower Yangtze River Plain (2.95 kg ha−1). These emission patterns are primarily influenced by soil organic carbon, crop type, and fertilizer-management practices. This study provides robust data support and methodological basis for formulating agricultural mitigation policies.
1. Introduction
Over the past century, global emissions of greenhouse gases (GHGs), including carbon dioxide (CO2), methane (CH4), and N2O, have risen steadily, becoming a major driver of global warming [1]. Among all these GHGs, N2O is particularly potent, with a global warming potential 298 times that of CO2 and an atmospheric lifetime of about 109 years [2]. In addition to its climate forcing effect, N2O is currently the dominant anthropogenic ozone-depleting substance, contributing to stratospheric ozone layer depletion. This not only increases anthropogenic exposure to ultraviolet radiation, raising the risk of skin cancer and related health issues, but also threatens ecosystem stability [3].
N2O emissions originate from both natural and anthropogenic sources. Natural sources include processes in natural ecosystems such as soils and oceans, whereas anthropogenic sources mainly involve agricultural activities, biomass burning, and industrial production processes [4]. Anthropogenic emissions account for approximately 43% of total global N2O emissions, among which agricultural activities contribute more than 60% [5]. Agricultural N2O emissions could be broadly divided into two major contributions: cropland systems and livestock systems, which correspond to emissions from synthetic nitrogen fertilizer application and from animal manure management, respectively [6,7]. Globally, cropland systems account for approximately 70% of agricultural N2O emissions, while livestock systems contribute about 30%. As the world’s largest agricultural producer, China contributes about 18% of global agricultural N2O emissions, significantly exceeding other countries [8]. The agricultural sector is the largest contributor to China’s total N2O emissions, accounting for 46%. Among these, synthetic fertilizer application alone is responsible for 23% of the national total [5,9]. In 2023, China’s nitrogen fertilizer application in agriculture reached approximately 25 million tons, with an average application intensity of 191 kg N ha−1, which is three times the global average [10,11]. This widespread, intensive cropping system makes China a critical region for global agricultural N2O mitigation [12]. Traditional estimates of cropland N2O emissions predominantly rely on the standardized emission factors (EFs) recommended by the IPCC and regional agricultural activity data for statistical extrapolation [6]. The spatial homogenization assumption of EFs significantly limits estimation accuracy. To address this limitation, studies have developed regionally adaptive EF systems through multi-scale observations. For example, Zheng et al. [13] established regional EFs for North China (41% lower than IPCC defaults) based on static chamber measurements at 15 sites, estimating China’s cropland emissions at 275 Gg year−1. However, incomplete spatial coverage compromised spatial representativeness. Zhou et al. [14] developed a 2008 high-resolution national inventory, quantifying cropland emissions at 266 Gg year−1 (72% of agricultural total), yet the single-year dataset cannot resolve interannual dynamics. Cui et al. [15] integrated global field observations from 1243 sites with remotely sensed fertilizer application data to construct crop-specific EFs maps, identifying intercrop disparities and global mitigation hotspots. However, reliance on 30-year static climate means resulted in 47% EFs errors in monsoon regions. Gao et al. [8] simulated China’s cropland N2O emissions during 1980–2020 using the DNDC model, reporting annual mean emissions of 130 ± 9 CO2−eq, but spatial resolution remained at the provincial level. We reviewed published literature on N2O emissions in China and collected data to compile an N2O emission inventory (Table S3). Current N2O emission inventories from Chinese croplands suffer from coarse spatial resolution, discontinuous temporal coverage, and unquantified driving mechanisms. Therefore, the objectives of this study are:
- Identify the driving factors influencing cropland N2O EFs.
- Develop a city-level N2O emission inventory for Chinese croplands from 2000 to 202
- Examine the impacts of agricultural policies on the spatial-temporal patterns of N2O emissions.
To achieve these goals, a total of 2022 sets of field measurements were collected to compile a cropland EFs database, integrating multi-source data including soil properties (soil pH, soil organic carbon (SOC), total nitrogen (TN), bulk density (BD), clay content), climatic variables (temperature, precipitation), and agricultural management practices (fertilizer type, tillage practices, fertilization methods). Then, a Random Forest-based EFs prediction model was developed, and a cropland N2O emission inventory was established for the period 2000–2022. This approach addresses the limitations of traditional emission inventories regarding coarse spatial resolution, limited temporal coverage, and static EF assumptions, enabling precise spatiotemporal pattern simulations and dynamic estimation. It provides data support and a methodological foundation for developing region-specific mitigation strategies and advancing national “Dual Carbon” goals.
2. Methods
2.1. Emission Factor Database
In this study, a database of EFs for N2O emissions from agricultural fields covering 19 types of crops was established, including rice, wheat, maize, legumes, tubers, peanuts, rapeseed, cotton, fiber crops, sugar crops, tobacco, tea plantations, oil crops, vegetables, fruits, green manure, medicinal herbs, orchards, and flowers. The EF data were obtained from field observation literature published in major databases, including Web of Science, PubMed, Scopus, and China National Knowledge Infrastructure (CNKI). We used keywords such as “N2O emissions”, “nitrous oxide emissions”, “N2O flux”, “N2O emissions inventory of China”, and “agricultural N2O” for literature retrieval. Through screening based on four criteria:
- Studies must be field experiments on agricultural soils.
- Experiments must be conducted within China.
- Implementation of sound N2O sampling and measurement methodologies.
- Reported experimental results within a reasonable range.
- Include complete experimental data covering fertilizer type, nitrogen application rate, mode of fertilizer application, and tillage practice.
We collected 327 publications, as listed in Table S1. Subsequently, experimental data were extracted and collated from these publications to construct an emission factor database; after further screening, the database contains 2021 sets of usable datasets, covering field observations for maize (560), wheat (761), rice (483), and other crops (217; 191 vegetables and 26 other cash crops). Each data record includes seven core information fields, with details provided in Table S2.
2.2. Model Construction and Optimization
To determine the optimal regression algorithm for predicting cropland N2O EFs, we evaluated the performance of several commonly used models, including multiple linear regression, ridge regression, lasso regression, random forest (RF), gradient boosting, support vector regression (SVR), and K-nearest neighbors (KNN) (Figure S1). According to evaluation metrics such as mean square error (MSE) and the coefficient of determination (R2), the RF model exhibited the best predictive performance, with the lowest MSE (0.188) and highest R2 (0.616) [16]. Consequently, the RF model was used in subsequent analyses. Data cleaning and filtering procedures are detailed in Text S1. The dataset was split into training and testing subsets at a ratio of 8:2 using the train–test split function in scikit-learn (Text S2). Hyperparameter tuning was performed using Grid Search (Text S3), which employed cross-validation to identify the optimal combination of key parameters, including number of trees, maximum tree depth, and minimum samples per leaf using cross-validation to determine the optimal configuration. The optimized RF model performed well on both training and testing datasets (Figure S2). Detailed model performance metrics are provided in Table S4, and the grid search parameter settings are summarized in Table S5. The model was constructed using the Random Forest Regressor function from the scikit-learn library (version 1.5.1) in Python (version 3.10.10).
To improve the spatial resolution of EFs, we applied a machine learning algorithm using the RF model to predict cropland N2O EFs [17]. Specifically, the model was trained using empirically observed EFs collected from published literature as the target variable, with meteorological conditions, soil properties, and agricultural management practices as input features. Based on the trained model, N2O EFs were predicted for each city by inputting the corresponding regional climate, soil, and management characteristics. Meteorological data, including temperature and precipitation for each city, were sourced from the China Meteorological Administration, and Soil properties, including BD, Clay, pH, and SOC, were acquired from HWSDv2.0 [18,19].
2.3. Estimation of N2O Emissions
Based on the 2019 Refinement to the 2006 IPCC Guidelines for National Greenhouse Gas Inventories and the methodological framework of the 2006 IPCC Guidelines, this study estimated cropland N2O emissions at the city-level scale in China using the EF approach [20]. The city-level units used in this analysis strictly follow China’s national administrative division standards. The calculation formula for N2O emissions is as follows:
where:
E(i,j,y) = A(i,j,j) × EF(i,j,y)
- i: The city, referring to prefecture-level cities in China.
- j: The agricultural source type (e.g., crop or fertilizer type).
- y: The year, referring to the research period from 2000 to 2022.
- A(i,j,y): The fertilization amount corresponding to the j-th emission source in the i-th prefecture-level city in year y.
- EF(i,j,y): The cropland EF of the j-th emission source in the i-th prefecture-level city in year y.
- E(i,j,y): The emissions amount of the j-th emission source in the i-th prefecture-level city in year y.
Activity data were obtained from the National Bureau of Statistics and the China Statistical Yearbook [10]. Additional details are provided in Text S4.
To better understand the spatiotemporal distribution of N2O in China, the country was divided into nine agricultural regions based on geographical, climatic, and agricultural production characteristics: Northeast Plain (NEP), Huang-Huai-Hai Plain (HHH), Middle-Lower Yangtze River Plain (MLYP), Sichuan Basin (SCB), South China (SC), Northern Arid and Semiarid Region (NASR), Loess Plateau (LP), Yunnan-Guizhou Plateau (YGP), and Tibetan Plateau (QTP), following the criteria of the China Comprehensive Agricultural Regionalization study [21].
3. Results
3.1. Drivers of Spatial Variation in EFs
Cropland N2O EFs are influenced by natural and anthropogenic factors. To elucidate their driving mechanisms, this study included the following variables: natural factors, including SOC, BD, TN, pH, precipitation, and temperature; anthropogenic factors, including tillage practice (categorized as conventional tillage or no-tillage based on field records) and nitrogen application rate. All variables were used as features in a random forest model, and their contributions to the variation in EFs were quantified by calculating feature importance. Machine learning results indicated that SOC was the most influential natural factor affecting EF (feature importance: 18%, Figure S3a). SOC regulates N2O emissions by providing carbon sources for denitrification and modifying soil structure, aeration, and microbial activity [22,23]. This conclusion was further validated at the prefectural scale, where SOC showed a significant positive correlation with EFs (p < 0.001, Figure S3b). Climatic factors (temperature and precipitation) primarily impact EFs indirectly by altering soil moisture and temperature conditions, thereby affecting microbial metabolic rates. Among anthropogenic factors, tillage practice was identified as the primary driver (importance: 13%). Conventional tillage disturbs soil structure and promotes organic matter mineralization and nitrogen transformation, significantly increasing EFs; under no-tillage, straw mulching reduces soil aeration and prolongs anaerobic conditions, which can also enhance N2O emissions. Nitrogen application rate, the second major anthropogenic factor (importance: 9%), directly increases available soil nitrogen, thereby enhancing nitrification and denitrification processes to increase per unit nitrogen emission intensity. In summary, SOC is the core variable driving the spatial heterogeneity of EFs, while tillage practice and nitrogen application as management measures also play important roles.
3.2. Spatiotemporal Characteristics of EFs
From 2000 to 2022, cropland N2O EFs in China remained relatively stable, with an annual mean of 1.44% ± 0.06%. From the perspective of fertilizer types and crop types, EFs also exhibit no significant interannual fluctuations. To be more specific regarding fertilizer types (Figure 1a), the EF for compound (1.47% ± 0.07%) was higher than that for urea (1.41% ± 0.07%), which can be attributed to the higher proportion of nitrate nitrogen in the compound, making it more susceptible to denitrification under moist and low-oxygen conditions. Similarly, significant EFs variations emerge among crop types (p < 0.01) (Figure 1b). Maize showed the highest EF (1.73%), compared with wheat (1.45%), rice (1.01%), and other crops (1.54%). The relatively high EF observed for maize is attributed to the specific characteristics of nitrogen transformation during its growth cycle [24]. This suggests that maize has a higher potential for N2O emissions and should be prioritized for mitigation in high-intensity cultivation regions.
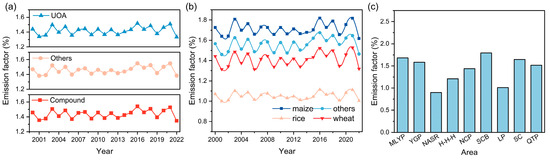
Figure 1.
Temporal variation of N2O EFs in Chinese croplands from 2000 to 2022. (a) Temporal trends in N2O EFs for different fertilizers: (urea, compound, and others). (b) Annual variations in N2O EFs among different crop types: maize, wheat, rice, and others. (c) Average N2O EFs across the different agricultural zones.
Spatially, the N2O EFs across major agricultural regions in China exhibit significant heterogeneity (Figure 1c). Overall, emission factors are higher in the eastern region than in the west. The highest values are concentrated in the MLYP, SCB, and the southern coastal areas (>1.9%), while lower values are typically found in the NASR and the QTP (<1.0%). (Figure 2). High-EF areas are primarily distributed in the eastern and southern coastal regions, while lower values are dominant in the northwest and southwest, exhibiting an east–west gradient, with higher values in the east and lower values in the west. Further analysis reveals that EFs for the same crop type differ significantly across the agricultural zoning regions (Figure S4, Table S7). The rice EFs in the NEP agricultural region (1.18%) are significantly higher than those in the HHH (0.84%). This difference may be primarily driven by soil pH: soils in the NEP are predominantly black soils with a characteristic pH range of 5.5–6.5. Under these acidic conditions (pH < 6.0), N2O cannot be fully reduced to N2, leading to its accumulation and higher N2O emissions [25]. In contrast, alkaline soils in the HHH (pH 7.0–8.0) reduce net N2O emissions compared to acidic soils by enhancing complete denitrification. High pH soils are conducive to enzyme activity and the growth of microorganisms involved in denitrification, enabling more complete conversion of N2O to N2, which reduces N2O accumulation and EF [26,27].
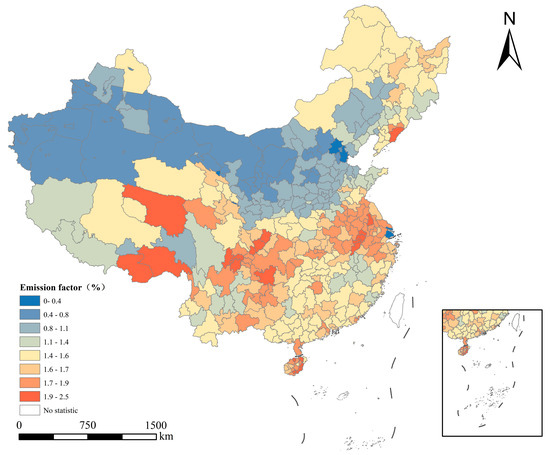
Figure 2.
Spatial distribution of cropland N2O EFs in China during 2000–2022. White areas indicate regions not included in this study.
3.3. Total Emission Dynamics and Temporal Heterogeneity
From 2000 to 2022, N2O emissions from Chinese croplands exhibited an inverted U-shaped trend. Emissions increased steadily from 359 Gg year−1 in 2000 to a peak of 472 Gg year−1 in 2016, followed by a continuous decline to 310 Gg year−1 in 2022, representing a cumulative decrease of approximately 34% (Figure 3a). This trend aligns with the implementation of the “Zero Growth of Fertilizer Use” policy around 2015 in China [28]. Piecewise linear regression analysis revealed that fertilizer application decreased by 19% after policy implementation (2016–2022), and N2O emissions declined at an average annual rate of 5% (Figure S5). Significant differences in N2O emissions were observed among different crop types (Figure 3b). The three major grain crops (maize, wheat, and rice) collectively contributed approximately 47% of total emissions, with maize being the largest contributor (25%), followed by wheat (13%) and rice (9.8%). The interannual variation in N2O emissions from maize, wheat, rice, and other crops showed significant differences. Among them, maize showed a trend of first increasing and then decreasing, reaching a peak in 2016 (132 Gg) and then decreasing year by year until 2022 (with a decrease of about 38%); Wheat emissions showed an overall fluctuating downward trend, with emissions in 2022 (35.7 Gg) decreasing by approximately 41% compared with those in 2000 (60.8 Gg). Rice emissions continuously decreased starting from 2000 (52.57 Gg), reaching a reduction of 36% by 2022. Other crops showed an overall fluctuating trend, peaking around 2015 (223 Gg), then declining year by year to 160 Gg in 2022, with a decrease of approximately 27%, representing the smallest reduction among all crops. The vegetable-cultivation area expanded to 23 million ha from 2000 to 2023 (an increase of 50%, average annual growth rate 1.8%) [10]. Moreover, the nitrogen application intensity of vegetables reached 700–900 kg N ha−1, 2.5–3 times that of grain crops (200–300 kg N ha−1) [29]. Due to high application rates and frequency, vegetables, as the dominant component of other crops, drove this high emission share (53%) through intensive nitrogen fertilization. Studies indicate that cash crop production regions are key areas for future emission reduction [8].
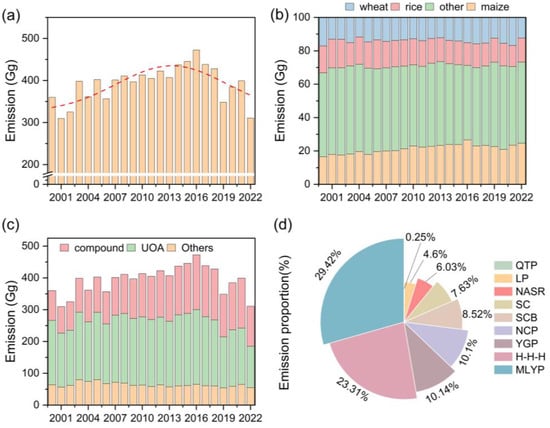
Figure 3.
Temporal variation in cropland N2O emissions in China from 2000 to 2022. (a) Inter-annual trends in cropland N2O emissions. (b) Temporal dynamics of N2O emissions from different crops (rice, maize, wheat, and others). (c) N2O emissions are attributed to different fertilizer types (urea, compound, and others). (d) Contributions of cropland N2O emissions across the nine main agricultural regions.
Regarding fertilizer sources (Figure 3c), urea was the primary contributor to cropland N2O emissions, accounting for 62% of total emissions, significantly higher than compound (22%) and others (17%). Research indicates that approximately 70% of fertilizer nitrogen applied in agriculture exists in the form of urea, further increasing its contribution to N2O emissions [30]. Although the current contribution of the compound is lower than that of urea, its emissions have increased significantly in recent years, with a 128% increase in 2022 compared to 2000. This trend is closely related to the national policy promoting the use of the compound. Notably, compounds typically contain nitrate nitrogen, which has a higher potential for direct denitrification, possibly leading to higher N2O emission intensity per unit of nitrogen applied.
3.4. Spatial Distribution of Emissions
From a spatial perspective, cropland N2O emissions in China exhibit a distinct east–west gradient, with higher values in the east and lower values in the west (Figure 4). The annual average N2O emissions in eastern China reach 63 Gg year−1, significantly higher than the 27 Gg year−1 in western China. Emissions are concentrated in two key agricultural regions: the HHH (91 Gg year−1) and the MLYP (115 Gg year−1), which together account for 52% of the national total. Major agricultural provinces, including Henan (42 Gg year−1), Jiangsu (32 Gg year−1), and Shandong (29 Gg year−1), being located in these plain regions, all rank among the top emitters nationwide.
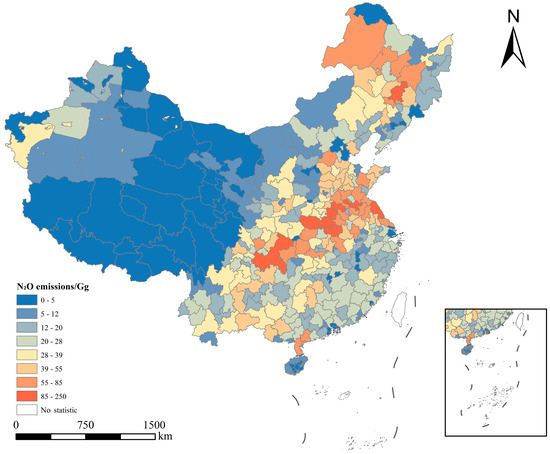
Figure 4.
Spatial distribution of cropland N2O emissions across China. White areas indicate regions not included in this study.
Further analysis shows that the emission intensity in the eastern region reaches 3.35 kg ha−1, 2.4 times higher than that of the western region (1.36 kg ha−1), exhibiting pronounced spatial heterogeneity (Figure S6). The HHH (5.23 kg ha−1) and the MLYP (2.95 kg ha−1) have significantly higher emission intensities than other regions, forming national hotspots. In contrast, constrained by natural endowments and limited agricultural activities, the NASR (0.74 kg ha−1), the QTP (0.53 kg ha−1), and subregions such as Tibet (0.35 kg ha−1), Xinjiang (0.50 kg ha−1), and Qinghai (0.69 kg ha−1) exhibit relatively low emission intensities.
To assess the spatiotemporal variation of cropland N2O emissions, the period from 2000 to 2022 was divided into five sub-periods (2000–2005, 2005–2010, 2010–2015, 2015–2020, and 2020–2022), and a comparative analysis of emission trends was conducted for each stage (Figure 5). Table 1 lists the top five cities with the highest N2O emissions for each reference year. The results indicated that national emissions increased from 2000 to 2015 but declined significantly after 2015. The HHH and MLYP showed notable reductions of 7.2% and 5.6%, respectively, making them the key contributors to national N2O mitigation. At the city level, a total of 311 cities (accounting for approximately 87%) experienced emission reductions, indicating that cropland N2O emissions in China are on a consistent downward trajectory.
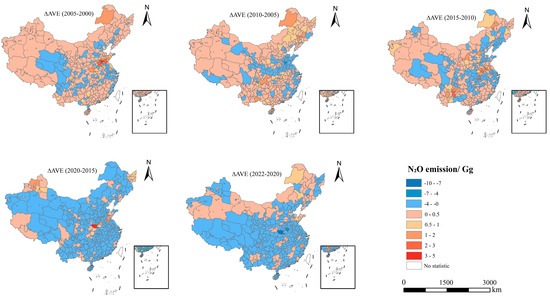
Figure 5.
Spatial variation in city-level cropland N2O emissions (2000–2022), showing changes between consecutive 5-year intervals: 2000–2005, 2005–2010, 2010–2015, 2015–2020, and 2020–2022.

Table 1.
Top 5 cities with the highest total cropland N2O emissions in each base year.
Table 1.
Top 5 cities with the highest total cropland N2O emissions in each base year.
| Rank | 2000 | 2005 | 2010 | 2015 | 2020 | 2022 |
|---|---|---|---|---|---|---|
| 1 | Chongqing | Nanyang | Chongqing | Chongqing | Nanyang | Chongqing |
| (5.5 Gg) | (9.3 Gg) | (9.9 Gg) | (10.3 Gg) | (13.9 Gg) | (7.1 Gg) | |
| 2 | Nanyang | Chongqing | Nanyang | Xinyang | Chongqing | Nanyang |
| (7.6 Gg) | (8.7 Gg) | (7.1 Gg) | (6.1 Gg) | (9.2 Gg) | (4.5 Gg) | |
| 3 | Xushui | Yancheng | Yancheng | Zhoukou | Zhoukou | Hulunbuir |
| (7.0 Gg) | (6.8 Gg) | (5.5 Gg) | (5.9 Gg) | (7.8 Gg) | (4.2 Gg) | |
| 4 | Yancheng | Zhumadian | Xinyang | Yancheng | Zhumadian | Changchun |
| (6.0 Gg) | (6.6 Gg) | (5.0 Gg) | (5.6 Gg) | (6.2 Gg) | (3.9 Gg) | |
| 5 | Zhumadian | Jining | Zhumadian | Zhumadian | Xuzhou | Xuzhou |
| (5.8 Gg) | (6.4 Gg) | (4.8 Gg) | (5.3 Gg) | (6.0 Gg) | (3.4 Gg) |
4. Discussion
The RF model identifies the relative importance of variables on cropland N2O EFs, enabling more accurate and reliable assessments of multi-factor impacts. Our finding that SOC, climate, and soil properties are key drivers of spatial variability in cropland EFs is consistent with previous studies [15,31]. Moreover, our analysis identifies SOC as the primary natural driver of EF variability. SOC decomposition releases organic carbon substrates that fuel denitrifying microorganisms, thereby enhancing the conversion efficiency from nitrate (NO3−) to N2O under equivalent nitrogen inputs [32]. Additionally, SOC-rich soils accelerate nitrogen mineralization, increasing ammonium (NH4+) production, and promote nitrification to NO3−, further boosting denitrification substrates under constant nitrogen input [33,34]. Furthermore, climatic conditions amplify these effects. For example, in China’s southern region, the annual mean temperature typically ranges from 15–22 °C with precipitation between 1000–1600 mm, substantially higher than in northern agricultural regions [10]. Elevated temperatures enhance microbial metabolism and organic matter decomposition, while high rainfall causes soil waterlogging, limiting oxygen diffusion and creating anaerobic conditions that favor denitrification [35,36,37]. These natural factors collectively increase N2O conversion efficiency per unit nitrogen input, manifesting as elevated EFs.
The changes in the distribution of N2O emissions from China’s cropland exhibit a distinct two-stage pattern, driven primarily by the combined effects of growing population demand and policy regulation. From 2000 to 2022, the changing trend of N2O emissions was highly consistent with the total national nitrogen fertilizer input. N2O emissions can be roughly divided into two stages: first, a continuous increase from 2000 to 2015 (rising by 31%), which corresponded to the nitrogen fertilizer input trend during the same period (increasing at an average annual rate of 1.82% between 2000 and 2015); second, a clear decrease after 2016, in line with the subsequent decline in nitrogen fertilizer input (decreasing by an average of 5.11% per year from 2016 to 2022) (Figure S5). In the first stage (2000–2016), the population increased from 1.26 billion to 1.38 billion, leading to a significant rise in food demand [10]. To ensure food supply, the government encouraged the expansion of agricultural production through policies such as raising grain purchase prices, reducing agricultural input costs, and strengthening agricultural infrastructure [38,39]. Driven by both population growth and policy guidance, the scale of agricultural production continued to expand: the crop planting area increased from 1.56 × 10⁸ ha in 2000 to 1.67 × 10⁸ ha in 2015. Spatially, high-emission hotspots were concentrated in key grain-producing regions in eastern China, such as the Huang–Huai–Hai Plain and the Middle-Lower Yangtze Plain, due to their intensive agricultural systems and high fertilizer application rates. Around 2015, the government launched the “Zero Growth Action for Chemical Fertilizer Use”, precisely controlling nitrogen fertilizer input through technologies such as soil testing, formula fertilization, and organic fertilizer substitution [40]. Data from this study show that total fertilizer use decreased by 19%, and average annual N2O emissions fell by 5%, with a noticeable turning point in the emission trend before the implementation of the policy. Regionally, the reduction was most pronounced in the eastern region, with N2O emissions falling from 130 Gg in 2016 to 87.6 Gg in 2022. In contrast, western China experienced a smaller reduction, from 134 Gg to 97.8 Gg, primarily due to differences in policy implementation, agricultural modernization rates, and natural limitations. Therefore, the observed changes in N2O emissions align with the patterns of agricultural development in China, shaped by population food demand, economic growth, and policy measures [41,42,43].
Spatially, China’s cropland N2O emission intensity exhibits pronounced heterogeneity. Eastern regions show much higher intensities than western regions, driven by intensive agricultural systems, favorable climate, and urbanization-linked production demands [44]. Although eastern croplands account for 40% of national cropland, their urbanization rate and per capita GDP are 1.2 times and 1.4 times those of the west. Although the western region occupies 39% of cropland, it is constrained by a cold, arid climate (<400 mm annual precipitation) and lower levels of agricultural modernization, limiting denitrification and resulting in N2O intensities approximately 1/20 those of the east [10]. These findings underscore the need for region-specific N2O-mitigation strategies, emphasizing precision fertilizer management, controlled-release fertilizers, and reduced tillage in the east, and stringent nitrogen limits and protected cultivation technologies for vegetables in coastal and peri-urban areas.
China is a core hotspot for global cropland N2O emissions [6]. Compared with other countries, Europe has achieved a cumulative 31% reduction in agricultural N2O emissions since the 1980s through early policy interventions such as the Nitrates Directive, establishing itself as the world’s first region to realize long-term mitigation of agricultural N2O emissions [45]. The United States, by contrast, shows stable emissions with occasional fluctuations. While no significant decline has been observed, the popularization of precision fertilization technologies has slowed the annual growth rate of its agricultural N2O emissions from 1.8% in the 1990s to less than 0.5% after the 2010s [46]. Similarly, China has seen a sharp decline in cropland N2O emissions since the implementation of the “Action Plan for Zero Growth in Chemical Fertilizer Use” in 2015, with an average annual reduction rate of approximately 5% between 2015 and 2022. This distinct trend highlights China’s late-mover advantage in agricultural N2O mitigation and confirms the effectiveness of targeted mitigation policies.
In implementing cropland N2O mitigation, cross-media pollution must be considered. Studies show that using nitrification inhibitors or deep fertilizer placement can reduce N2O emissions but increase ammonia (NH3) volatilization, reduce nitrogen use efficiency, and contribute to the formation of fine particulate matter that degrades air quality [47]. Concurrently, excessive nitrogen inputs lead to nitrate leaching into surface and groundwater, causing eutrophication and nitrate contamination [48]. These interactions reveal a “pollution transfer” effect, where focusing on one pollutant may shift the environmental burden to other media. Therefore, cropland-mitigation strategies should systematically assess soil, air water interactions, balancing multi-media pollution risks to avoid burden displacement and promote sustainable mitigation pathways.
Uncertainty in cropland N2O emission estimation primarily arises from the accuracy of EFs and activity data. Due to the lack of a unified and comprehensive dataset for organic fertilizer EFs, organic fertilizers were not included in the current estimation. Furthermore, the existing EFs dataset is spatially imbalanced and limited in sample size, which may compromise the representativeness and reliability of model predictions. Methodologically, although the RF algorithm is effective in capturing nonlinear relationships, it remains a conventional machine learning approach. Advanced algorithms such as deep learning or neural networks were not employed, which may have limited the overall precision and robustness of the estimation.
5. Conclusions
This study constructed a municipal-scale predictive model for cropland N2O EFs in China, utilizing an RF algorithm, which enabled high-resolution and high-precision emission simulations. The model provides comprehensive data and technical support for cropland emission reduction efforts under the “Dual Carbon” goals. The results demonstrate that SOC is the core driving factor influencing EFs. Crop types and fertilizer types further intensified emission spatial heterogeneity: the EF for maize (1.73%) was significantly higher than that for wheat (1.45%) and rice (1.01%). Compound fertilizer also had a higher EF (1.47%) compared to urea (1.41%). During 2000–2022, China’s annual average cropland N2O emissions were approximately 392 Gg, showing an initial increase followed by a decline. Emissions peaked at 472 Gg in 2016, then dropped at an average annual rate of 5% to 310 Gg by 2022, reflecting the impact of the “Zero Growth Action Plan for Chemical Fertilizers”. Spatially, emissions exhibit a distinct east–west gradient pattern. The eastern hotspots, namely the HHH (5.23 kg ha−1) and the MLYP (2.95 kg ha−1), had emission intensities 9 and 5 times higher than the QTP (0.53 kg ha−1), making them key areas for future regional emission reduction.
Supplementary Materials
The following supporting information can be downloaded at: https://www.mdpi.com/article/10.3390/atmos16091092/s1, Figure S1: Scatter plots of predicted versus observed values for seven regression models: Linear Regression, Ridge Regression, Lasso Regression, Random Forest, Gradient Boosting, Support Vector Regression, and K-Nearest Neighbors. The dashed line represents the 1:1 relationship. Mean squared error (MSE) and coefficient of determination (R2) for each model are shown in the corresponding subplot; Figure S2: Scatter plots of predicted versus observed values from the Random Forest model. The left panel shows the training set (R2 = 0.775, MSE = 0.531, n = 1992); the right panel shows the test set (R2 = 0.675, MSE = 0.714, n = 498); Figure S3: Analysis of variable importance and correlation. (a) Ranked feature importance of variables in-fluencing cropland N2O EFs. (SOC: soil organic carbon; BD: bulk density; STP: soil total phosphorus; TN: total nitrogen; Water: mean annual precipitation; Nrate: nitrogen application rate; PH: soil pH; Tem: mean annual temperature. (b) Correlation between SOC and EFs at the prefecture level. The solid line shows the linear regression (R2 = 0.19, p < 0.05) with a 95% confidence interval; Figure S4: N2O EFs for different crops (maize, wheat, rice, and others) across various agricultural zones. (NEP: Northeast Plain; HHH: Huang-Huai-Hai Plain; MLYP: Middle-Lower Yangtze River Plain; SCB: Sichuan Basin; SC: South China; NASR: Northern Arid and Semiarid Region; LP: Loess Plateau; YGP: Yunnan-Guizhou Plateau; QTP: Tibetan Plateau); Figure S5: Segmented trends of fertilizer application and N2O emissions over time: blue bars represent annual N2O emissions, and the red line represents fertilizer application. Dashed lines indicate trends before and after the policy intervention in 2015, which is marked by the vertical black line; Figure S6: N2O emission intensity (kg ha−1) across nine agricultural zones in China from 2000 to 2022. Box plots display the distribution of emission intensity for each region, with blue triangles and dark red diamonds indicating the median and mean, respectively. Different colors represent different regions. (NEP: Northeast Plain; HHH: Huang-Huai-Hai Plain; MLYP: Middle-Lower Yangtze River Plain; SCB: Sichuan Basin; SC: South China; NASR: Northern Arid and Semiarid Region; LP: Loess Plateau; YGP: Yunnan-Guizhou Plateau; QTP: Tibetan Plateau); Text S1: Data processing; Text S2: Random Forest Modeling Steps; Test S3: Grid Search; Text S4: Activity data [49]; Text S5: Feature Importance of Key Anthropogenic Factors; Text S6: Calculation Strategy for N2O EFs (2000–2022); Table S1: References for the dataset; Table S2 Classification of core fields in EFs database; Table S3: China’s agricultural production system N2O emission inventory [50,51,52,53,54]; Table S4: The classification, definitions, and units of parameters in the N2O training set; Table S5: Key parameters and optimal parameter combination for the random forest model; Table S6: Performance comparison of regression algorithms; Table S7:Descriptive statistics (mean, minimum, and maximum) of N2O emission factors for each crop type.
Author Contributions
Conceptualization, X.L., Z.W.; methodology, Z.W.; investigation, formal analysis, visualization, C.L.; writing—original draft preparation, C.L.; writing—review and editing, Z.W., X.L., C.L.; supervision, X.L., J.W.; project administration, X.L.; funding acquisition, X.L., Z.W. All authors have read and agreed to the published version of the manuscript.
Funding
This research was funded by the National Natural Science Foundation of China (42277097 and 42407157) and the High-level Talent Program of Hebei Province (2024HBQZYCXY037).
Institutional Review Board Statement
Not applicable.
Informed Consent Statement
Not applicable.
Data Availability Statement
The original contributions presented in this study are included in the article/Supplementary Materials. Further inquiries can be directed to the corresponding authors.
Conflicts of Interest
The authors declare no conflict of interest.
References
- Intergovernmental Panel on Climate Change (IPCC). Mitigation of Climate Change. In Contribution of Working Group III to the Sixth Assessment Report of the Intergovernmental Panel on Climate Change; Masson-Delmotte, V., Zhai, P., Pirani, A., Connors, S.L., Pean, C., Berger, S., Caud, N., Chen, Y., Goldfarb, L., Gomis, M., et al., Eds.; Cambridge University Press: Cambridge, UK; New York, NY, USA, 2022; Available online: https://www.ipcc.ch/report/ar6/wg3/ (accessed on 15 March 2024).
- Intergovernmental Panel on Climate Change (IPCC). Climate Change 2013: The Physical Science Basis. In Contribution of Working Group I to the Fifth Assessment Report of the Intergovernmental Panel on Climate Change; Stocker, T.F., Qin, D., Plattner, G.K., Tignor, M., Allen, S.K., Boschung, J., Nauels, A., Xia, Y., Bex, V., Midgley, P.M., Eds.; Cambridge University Press: Cambridge, UK; New York, NY, USA, 2013; Available online: https://www.ipcc.ch/report/ar5/wg1/ (accessed on 15 March 2024).
- Ravishankara, A.R.; Daniel, J.S.; Portmann, R.W. Nitrous oxide (N2O): The dominant ozone-depleting substance emitted in the 21st century. Science 2009, 326, 123–125. [Google Scholar] [CrossRef]
- Tian, H.; Pan, N.; Thompson, R.L.; Canadell, J.G.; Suntharalingam, P.; Regnier, P.; Davidson, E.A.; Prather, M.; Ciais, P.; Muntean, M.; et al. Global nitrous oxide budget (1980–2020). Earth Syst. Sci. Data 2024, 16, 2543–2604. [Google Scholar] [CrossRef]
- Liang, M.; Zhou, Z.; Ren, P.; Xiao, H.; Ri, X.; Hu, Z.; Piao, S.; Tian, H.; Tong, Q.; Zhou, F.; et al. Four decades of full-scale nitrous oxide emission inventory in China. Natl. Sci. Rev. 2024, 11, nwad285. [Google Scholar] [CrossRef] [PubMed]
- Tian, H.Q.; Xu, R.T.; Canadell, J.G.; Thompson, R.L.; Winiwarter, W.; Suntharalingam, P.; Davidson, E.A.; Ciais, P.; Jackson, R.B.; Janssens-Maenhout, G.; et al. A comprehensive quantification of global nitrous oxide sources and sinks. Nature 2020, 586, 248–256. [Google Scholar] [CrossRef]
- Smith, P.; Bustamante, M.; Ahammad, H.; Clark, H.; Dong, H.; Elsiddig, E.A.; Haberl, H.; Harper, R.; House, J.; Jafari, M.; et al. Agriculture, Forestry and Other Land Use (AFOLU). In Climate Change 2014: Mitigation of Climate Change; Edenhofer, O., Pichs-Madruga, R., Sokona, Y., Farahani, E., Kadner, S., Seyboth, K., Adler, A., Baum, I., Brunner, S., Eickemeier, P., et al., Eds.; Contribution of Working Group III to the Fifth Assessment Report of the Intergovernmental Panel on Climate Change; Cambridge University Press: Cambridge, UK; New York, NY, USA, 2014; pp. 811–922. [Google Scholar]
- Gao, Y.; Li, Z.; Hong, S.; Yu, L.; Li, S.; Wei, J.; Chang, J.; Zhang, Y.; Zhang, W.; Yuan, W.; et al. Recent stabilization of agricultural non-CO2 greenhouse gas emissions in China. Natl. Sci. Rev. 2025, 12, nwaf040. [Google Scholar] [CrossRef]
- Liu, X.; Zhang, F. Nitrogen fertilizer induced greenhouse gas emissions in China. Curr. Opin. Environ. Sustain. 2011, 3, 407–413. [Google Scholar] [CrossRef]
- National Bureau of Statistics of China (NBSC). National Bureau of Statistics of China. Available online: http://data.stats.gov.cn/easyquery.htm?cn=C01 (accessed on 15 March 2024).
- Cross, L.; Gruère, A. Public Summary-Medium-Term Fertilizer Outlook 2023–2027. In Proceedings of the IFA Annual Conference, Prague, Czech Republic, 22–24 May 2023. [Google Scholar]
- Yu, Z.; Liu, J.; Kattel, G. Historical nitrogen fertilizer use in China from 1952 to 2018. Earth Syst. Sci. Data 2022, 14, 5179–5194. [Google Scholar] [CrossRef]
- Zheng, X.; Han, S.; Huang, Y.; Wang, Y.; Wang, M. Re-quantifying the emission factors based on field measurements and estimating the direct N2O emission from Chinese croplands. Glob. Biogeochem. Cycles 2004, 18, GB2008. [Google Scholar] [CrossRef]
- Zhou, F.; Shang, Z.; Ciais, P.; Tao, S.; Piao, S.; Raymond, P.; He, C.; Li, B.; Wang, R.; Wang, X.; et al. A new high-resolution N2O emission inventory for China in 2008. Environ. Sci. Technol. 2014, 48, 8538–8547. [Google Scholar] [CrossRef]
- Cui, X.; Zhou, F.; Ciais, P.; Davidson, E.A.; Tubiello, F.N.; Niu, X.; Ju, X.; Canadell, J.G.; Bouwman, A.F.; Jackson, R.B.; et al. Global mapping of crop-specific emission factors highlights hotspots of nitrous oxide mitigation. Nat. Food 2021, 2, 886–893. [Google Scholar] [CrossRef] [PubMed]
- Gunst, R.F.; Mason, R.L. Regression Analysis and Its Application: A Data-Oriented Approach; CRC Press: Boca Raton, FL, USA, 2018. [Google Scholar]
- Zhong, S.; Zhang, K.; Bagheri, M.; Burken, J.G.; Gu, A.; Li, B.; Ma, X.; Marrone, B.L.; Ren, Z.J.; Schrier, J.; et al. Machine learning: New ideas and tools in environmental science and engineering. Environ. Sci. Technol. 2021, 55, 12741–12754. [Google Scholar] [CrossRef] [PubMed]
- China Meteorological Administration (CMA). China Meteorological Administration Official Website. Available online: https://data.cma.cn/ (accessed on 31 March 2025).
- FAO; IIASA; ISRIC; ISSCAS; JRC. Harmonized World Soil Database Version 2.0; FAO: Rome, Italy; IIASA: Laxenburg, Austria, 2023; p. 50. [Google Scholar] [CrossRef]
- Eggleston, H.; Buendia, L.; Miwa, K.; Ngara, T.; Tanabe, K. 2006 IPCC Guidelines for National Greenhouse Gas Inventories; Institute for Global Environmental Strategies (IGES): Hayama, Japan, 2006; Available online: https://www.ipcc-nggip.iges.or.jp/public/2006gl/ (accessed on 31 March 2025).
- Tian, Y. Study on the industrial promotion policy of crop straw comprehensive utilization in China. Chin. J. Agric. Resour. Reg. Plan. 2020, 41, 28–36. (In Chinese) [Google Scholar]
- Kelley, L.A.; Zhang, Z.; Tamagno, S.; Lundy, M.E.; Mitchell, J.P.; Gaudin, A.C.; Pittelkow, C.M. Changes in soil N2O emissions and nitrogen use efficiency following long-term soil carbon storage: Evidence from a mesocosm experiment. Agric. Ecosyst. Environ. 2024, 370, 109054. [Google Scholar] [CrossRef]
- Yin, Y.; Wang, Z.; Tian, X.; Wang, Y.; Cong, J.; Cui, Z. Evaluation of variation in background nitrous oxide emissions: A new global synthesis integrating the impacts of climate, soil, and management conditions. Glob. Change Biol. 2022, 28, 480–492. [Google Scholar] [CrossRef]
- Wang, J.; Sha, Z.; Zhang, J.; Qin, W.; Xu, W.; Goulding, K.; Liu, X. Improving nitrogen fertilizer use efficiency and minimizing losses and global warming potential by optimizing applications and using nitrogen synergists in a maize-wheat rotation. Agric. Ecosyst. Environ. 2023, 353, 108538. [Google Scholar] [CrossRef]
- Qiu, Y.; Zhang, Y.; Zhang, K.; Xu, X.; Zhao, Y.; Bai, T.; Zhao, Y.; Wang, H.; Sheng, X.; Bloszies, S.; et al. Intermediate soil acidification induces highest nitrous oxide emissions. Nat. Commun. 2024, 15, 46931. [Google Scholar] [CrossRef]
- Gao, P.; Yan, X.; Xia, X.; Liu, D.; Guo, S.; Ma, R.; Lou, Y.; Yang, Z.; Wang, H.; Yang, Q.; et al. Effects of the three amendments on NH3 volatilization, N2O emissions, and nitrification at four salinity levels: An indoor experiment. J. Environ. Manag. 2024, 354, 120399. [Google Scholar] [CrossRef] [PubMed]
- Liu, B.; Mørkved, P.T.; Frostegård, Å.; Bakken, L.R. Denitrification gene pools, transcription and kinetics of NO, N2O and N2 production as affected by soil pH. FEMS Microbiol. Ecol. 2010, 72, 407–417. [Google Scholar] [CrossRef] [PubMed]
- Jin, S.; Zhou, F. Zero Growth of Chemical Fertilizer and Pesticide Use: China’s Objectives, Progress and Challenges. J. Resour. Ecol. 2018, 9, 50–58. [Google Scholar] [CrossRef]
- Zhang, W.F.; Dou, Z.X.; He, P.; Ju, X.T.; Powlson, D.; Chadwick, D.; Norse, D.; Lu, Y.L.; Zhang, Y.; Wu, L.; et al. New technologies reduce greenhouse gas emissions from nitrogenous fertilizer in China. Proc. Natl. Acad. Sci. USA 2013, 110, 8375–8380. [Google Scholar] [CrossRef]
- Chen, Y.; Zhang, L.; Zhao, Y.; Zhang, L.; Zhang, J.; Liu, M.; Zhou, M.; Luo, B. High-resolution ammonia emissions from nitrogen fertilizer application in China during 2005–2020. Atmosphere 2022, 13, 1297. [Google Scholar] [CrossRef]
- Yuan, Y.; Chen, H.; Zhang, L.; Ren, B.; Xing, S.; Tong, J. Prediction of spatial distribution of soil organic carbon in farmland based on multi-variables and random forest algorithm—A case study of a subtropical complex geomorphic region in Fujian. Acta Pedol. Sin. 2021, 58, 887–899. (In Chinese) [Google Scholar]
- Hu, Y.; Deng, Q.; Kätterer, T.; Olesen, J.E.; Ying, S.C.; Ochoa-Hueso, R.; Mueller, C.W.; Weintraub, M.N.; Chen, J. Depth-dependent responses of soil organic carbon under nitrogen deposition. Glob. Change Biol. 2024, 30, e17247. [Google Scholar] [CrossRef]
- Badagliacca, G.; Benítez, E.; Amato, G.; Badalucco, L.; Giambalvo, D.; Laudicina, V.A.; Ruisi, P. Long-term effects of contrasting tillage on soil organic carbon, nitrous oxide and ammonia emissions in a Mediterranean Vertisol under different crop sequences. Sci. Total Environ. 2018, 619–620, 18–27. [Google Scholar] [CrossRef] [PubMed]
- Shan, J.; Yan, X. Effects of crop residue returning on nitrous oxide emissions in agricultural soils. Atmos. Environ. 2013, 71, 170–175. [Google Scholar] [CrossRef]
- Bateman, E.J.; Baggs, E.M. Contributions of nitrification and denitrification to N2O emissions from soils at different water-filled pore space. Biol. Fertil. Soils 2005, 41, 379–388. [Google Scholar] [CrossRef]
- Hu, H.-W.; Macdonald, C.A.; Trivedi, P.; Holmes, B.; Bodrossy, L.; He, J.-Z.; Singh, B.K. Water addition regulates the metabolic activity of ammonia oxidizers responding to environmental perturbations in dry subhumid ecosystems. Environ. Microbiol. 2015, 17, 444–461. [Google Scholar] [CrossRef] [PubMed]
- Richardson, D.; Felgate, H.; Watmough, N.; Thomson, A.; Baggs, E. Mitigating release of the potent greenhouse gas N2O from the nitrogen cycle—Could enzymic regulation hold the key? Trends Biotechnol. 2009, 27, 388–397. [Google Scholar] [CrossRef]
- Ash, R.F. The agricultural sector in China: Performance and policy dilemmas during the 1990s. China Q. 1992, 131, 545–576. [Google Scholar] [CrossRef]
- Ministry of Agriculture and Rural Affairs of the People’s Republic of China. Two Actions That Seek to Achieve Zero Growth in the Use of Chemical Fertilizer and Pesticides by 2020. Available online: http://www.moa.gov.cn/nybgb/2015/san/201711/t20171129_5923401.htm (accessed on 20 February 2025). (In Chinese)
- Li, Z.; Hong, S.; Sun, Z.; Cong, N.; Yan, Y.; Li, F.; Gao, Y.; Sun, Y.; Chen, Y.; Chen, Y.; et al. Turning point of direct N2O emissions in China’s croplands dominated by reduced fertilizer usage since 2015. Agric. Ecosyst. Environ. 2025, 388, 109655. [Google Scholar] [CrossRef]
- Shang, Z.; Zhou, F.; Smith, P.; Saikawa, E.; Ciais, P.; Chang, J.; Tian, H.; Del Grosso, S.J.; Ito, A.; Chen, M.; et al. Weakened growth of cropland-N2O emissions in China associated with nationwide policy interventions. Glob. Change Biol. 2019, 25, 3706–3719. [Google Scholar] [CrossRef] [PubMed]
- Xu, P.; Houlton, B.Z.; Zheng, Y.; Zhou, F.; Ma, L.; Li, B.; Liu, X.; Li, G.; Lu, H.; Quan, F.; et al. Policy-enabled stabilization of nitrous oxide emissions from livestock production in China over 1978–2017. Nat. Food 2022, 3, 356–366. [Google Scholar] [CrossRef]
- Zhang, Y.; Fang, S.; Chen, J.; Lin, Y.; Chen, Y.; Liang, R.; Jiang, K.; Parker, R.J.; Boesch, H.; Steinbacher, M.; et al. Observed changes in China’s methane emissions linked to policy drivers. Proc. Natl. Acad. Sci. USA 2022, 119, e2202742119. [Google Scholar] [CrossRef]
- Nelson, D.A. European Environment Agency. Colo. J. Int. Environ. Law Policy 1999, 10, 153. [Google Scholar]
- Gale, F. China’s Agricultural Trade: Issues and Prospects; Economic Research Service, USDA: Washington, DC, USA, 2007; p. 65. [Google Scholar]
- Yue, Q.; Cheng, K.; Ogle, S.; Hillier, J.; Smith, P.; Abdalla, M.; Ledo, A.; Sun, J.; Pan, G. Evaluation of four modelling approaches to estimate nitrous oxide emissions in China’s cropland. Sci. Total Environ. 2019, 652, 1279–1289. [Google Scholar] [CrossRef]
- Recio, J.; Vallejo, A.; Le-Noë, J.; Garnier, J.; García-Marco, S.; Álvarez, J.M.; Sanz-Cobena, A. The effect of nitrification inhibitors on NH3 and N2O emissions in highly N fertilized irrigated Mediterranean cropping systems. Sci. Total Environ. 2018, 636, 427–436. [Google Scholar] [CrossRef] [PubMed]
- Singh, B.; Craswell, E. Fertilizers and nitrate pollution of surface and ground water: An increasingly pervasive global problem. SN Appl. Sci. 2021, 3, 518. [Google Scholar] [CrossRef]
- Imam, T.; Hidetaka, N.; Yoshitaka, G. An Optimization of the Autoregressive Model Using the Grid Search Method. Int. J. Eng. Technol. 2018, 7, 12739. [Google Scholar] [CrossRef][Green Version]
- Bai, Z.; Ma, W.; Ma, L.; Velthof, G.L.; Wei, Z.; Havlík, P.; Oenema, O.; Lee, M.R.F.; Zhang, F. China’s livestock transition: Driving forces, impacts, and consequences. Sci. Adv. 2018, 4, eaar8534. [Google Scholar] [CrossRef]
- Chen, G.Q.; Zhang, B. Greenhouse gas emissions in China 2007: Inventory and input–output analysis. Energy Policy 2010, 38, 6180–6193. [Google Scholar] [CrossRef]
- Luo, Z.; Lam, S.K.; Fu, H.; Hu, S.; Chen, D. Temporal and spatial evolution of nitrous oxide emissions in China: Assessment, strategy and recommendation. J. Clean. Prod. 2019, 223, 360–367. [Google Scholar] [CrossRef]
- Wang, C.; Shen, Y.; Fang, X.; Xiao, S.; Liu, G.; Wang, L.; Gu, B.; Zhou, F.; Chen, D.; Tian, H.; et al. Reducing soil nitrogen losses from fertilizer use in global maize and wheat production. Nat. Geosci. 2024, 17, 1008–1015. [Google Scholar] [CrossRef]
- Zhang, Y.; Mu, Y.; Zhou, Y.; Liu, J.; Zhang, C. Nitrous oxide emissions from maize–wheat field during 4 successive years in the North China Plain. Biogeosciences 2014, 11, 1717–1726. [Google Scholar] [CrossRef]


Disclaimer/Publisher’s Note: The statements, opinions and data contained in all publications are solely those of the individual author(s) and contributor(s) and not of MDPI and/or the editor(s). MDPI and/or the editor(s) disclaim responsibility for any injury to people or property resulting from any ideas, methods, instructions or products referred to in the content. |
© 2025 by the authors. Licensee MDPI, Basel, Switzerland. This article is an open access article distributed under the terms and conditions of the Creative Commons Attribution (CC BY) license (https://creativecommons.org/licenses/by/4.0/).