Abstract
It is well known that the aerosol distribution in Asia is complex due to both the increasing emissions of the anthropogenic aerosols associated with economic growth and the behavior of natural dusts. Therefore, detailed observations of atmospheric particles in Asian urban cities are important. In this work, we focus on the spatial and temporal variations of atmospheric particles around Higashi-Osaka in Japan. Higashi-Osaka is located in the eastern part of Osaka, the second-largest city in Japan, and is famous for small- and medium-sized manufacturing enterprises. For this study, we placed various ground measurement devices around the Higashi-Osaka campus of Kinki University including a Cimel sunphotometer supported by NASA/AERONET (Aerosol robotics network), suspended particulate matter (SPM) sampler and LIDAR (light detection and ranging). Individual particle analyses with a SEM (scanning electron microscope)/EDX (energy-dispersive X-ray analyzer) show the temporal variations of particle properties, such as size, shape and components, during a dust event on 21 March 2010. The simultaneous measurement using a portable sun photometer with AERONET was conducted from April to November 2011. A comparison of the data at each site and the combination of the observed LIDAR data and model simulations indicate the difference in the transportation processes between dust and anthropogenic particles. We suppose this difference is attributed to the differences in the vertical aerosol profiles, where one aerosol is transported over Mount Ikoma and the other is blocked by it.
1. Introduction
The atmospheric aerosol distributions in East Asia urban areas are complex due to both natural factors and human activities. Small anthropogenic aerosols dominate the air over urban areas because of local emissions by diesel vehicles and industrial activity. In East Asia, the distribution is known to be heavily affected by the increasing emissions of sulphuric, nitric, carbonaceous and other aerosols associated with economic growth [1]. The aerosol distribution varies seasonally due to various factors, such as emissions, photochemical reactions and wind direction [2,3]. Dust events, which are some of the most dynamic natural phenomena to produce atmospheric aerosols, can increase particulate matter concentrations and can even cause serious atmospheric turbidity [4]. A noticeable change in aerosol characteristics was observed during a dust event in Higashi-Osaka, Japan, (135.59°E, 34.65°N) at 10 m above sea level [5]. Knowing the variation of aerosol characteristics on a local scale of space and time is needed to accurately estimate the effect of atmospheric aerosols on the climate because these aerosols play an important role in the global climate and environmental change [6]. Aerosols also play an important role in meteorology [7]. Observing aerosol characteristics, such as amount, size, composition and shape, and the variation of these characteristics with time and place from space- [8] and/or ground-based [9] measurements is still important.
In this work, we focus on the spatial and temporal variations of atmospheric particles around Higashi-Osaka during dust events. Higashi-Osaka is located on the east side of Osaka, the second-largest city in Japan, and is famous for its manufacturing technologies for small and medium enterprises. In this study, we use simultaneous observations on the Kinki University campus in Higashi-Osaka. The radiometric data supplied by a Cimel photometer were analyzed using a standard AERONET (Aerosol Robotics Network) [10,11,12] processing system. We installed a standard NIES (National Institute for Environmental Studies)/LIDAR (light detection and ranging) network [13] with an SPM (suspended particulate matter) sampler attached to our AERONET site on the roof of a building at Kinki University. We compared the AERONET and SPM observations in Higashi-Osaka. The results show that a linear correlation definitely exists between the aerosol optical thickness (AOT) and suspended particulate matter and the value of correlation coefficient for the whole dataset was less than that for separately considering the two cases of anthropogenic and dust aerosols. This result indicates that the atmospheric situation during dust events may be different from that normally [14,15]. In 2011, we introduced a portable sun photometer named Microtops-2, which is easy to carry and adds mobility to our observations. Furthermore, a scanning electron microscope (SEM) coupled with an energy-dispersive X-ray analyzer (EDX) was introduced to determine particle properties, such as size, shape and composition. To study the variations of aerosol properties in detail, we performed the individual particle analysis with the SEM/EDX and the simultaneous measurements using multiple portable sun photometers.
This paper is organized as follows. The instruments are described in Section 2. In Section 3, we introduce the temporal variations of the aerosol characteristics in Higashi-Osaka during the dust event of 21 March 2010. In Section 4, the spatial variations of the aerosol characteristics are shown using sun photometers measurements at several sites around Higashi-Osaka. By comparing the measurements at each site during ordinary days and dust days in 2011, we study the transport mechanisms of the natural and anthropogenic aerosols in the Higashi-Osaka area. Section 5 summarizes this work.
2. Description of Instruments
2.1. AERONET and Portable Sun Photometer
The worldwide NASA/AERONET data are mostly available as ground-based sun-photometric products. In 2002, an AERONET station was set up at Kinki University in Higashi-Osaka. It provides the aerosol optical thickness (AOT) and the Ångström exponent (α). The accuracy of the AOT is better than 0.01 at visible and infrared wavelengths, and the obtained data were cloud screened before aerosol retrieval [16]. The accuracy of α depends strongly on the AOT values because α is derived from the ratio of spectral AOT. AOT is the basic parameter describing atmospheric aerosols. Some aerosol events show the characteristic features of dust events, a high AOT and a low α, but the detection of high α values almost always indicates contamination by small anthropogenic particles. Omar et al. proposed the use of a clustering method to classify observations of AERONET automatically [17]. Using examples from their work, the aerosol properties at Higashi-Osaka were classified by applying a standard statistics software package (SPSS; Statistical Package for the Social Sciences) to the AERONET data [5]. The clustering results show that the aerosol properties at the Higashi-Osaka site are roughly divided into two classes. The first class, with large AOT and small α values, can be attributed to a dust event. The other class contains days without a dust event, called ordinary days. From these results, the data are divided into two groups, ordinary days and dust days, using AOT (0.675 m) = 0.4 and α (0.440–0.870 m) = 0.5 as criterion values. AERONET is used in both Section 3 and Section 4. The Microtops-2 portable sun photometer is easy to carry and adds mobility to our observations. The photometer provides the aerosol optical thickness at five wavelengths chosen from the eight possible standard wavelengths 0.340, 0.380, 0.440, 0.500, 0.675, 0.870, 0.936, and 1.020 m. Our instruments use 0.380, 0.440, 0.675, 0.870 and 0.500 or 0.936 m. It enabled simultaneous measurements with the main AERONET Higashi-Osaka site, as shown in Section 4.
2.2. SPM Sampler and SEM/EDX
Particulate matter is a typical indicator of anthropogenic particles in the atmosphere [18]; therefore, an accurate estimation of particulate matter is urgently needed [19]. An SPM sampler (SPM-613D, Kimoto Electric, Japan) was installed at the same AERONET site on the roof of a building at Kinki University at 50 m above sea level. The SPM-613D collects suspended particulate matters on its Teflon filter and measures the weight of those particles by the absorbance of a beta-ray. The SPM sampler provides particle information on the concentrations of PM2.5, PM10 and OBC (optical black carbon) separately. The PMC (defined as the difference between PM10 and PM2.5) is generally a better indicator of dust events than PM2.5 because the soil dust particles are large [20]. We analyzed the particulate matter with the SEM/EDX. We used sampling data from the SPM sampler attached to our AERONET station in Higashi-Osaka. The SEM/EDX can detect the elements in a sample through the X-rays emanating from the sample’s surface, and it can provide the mass concentration (%) of each component. The accelerating voltage is 20 kV and working distance ranges from 8 mm to 15 mm in the SEM. We select Point & ID mode for EDX. The detected elements are Na, Mg, Al, Si, S, Cl, K, Ca and Fe. The SEM/EDX analysis is shown in Section 3.
2.3. Model Simulation
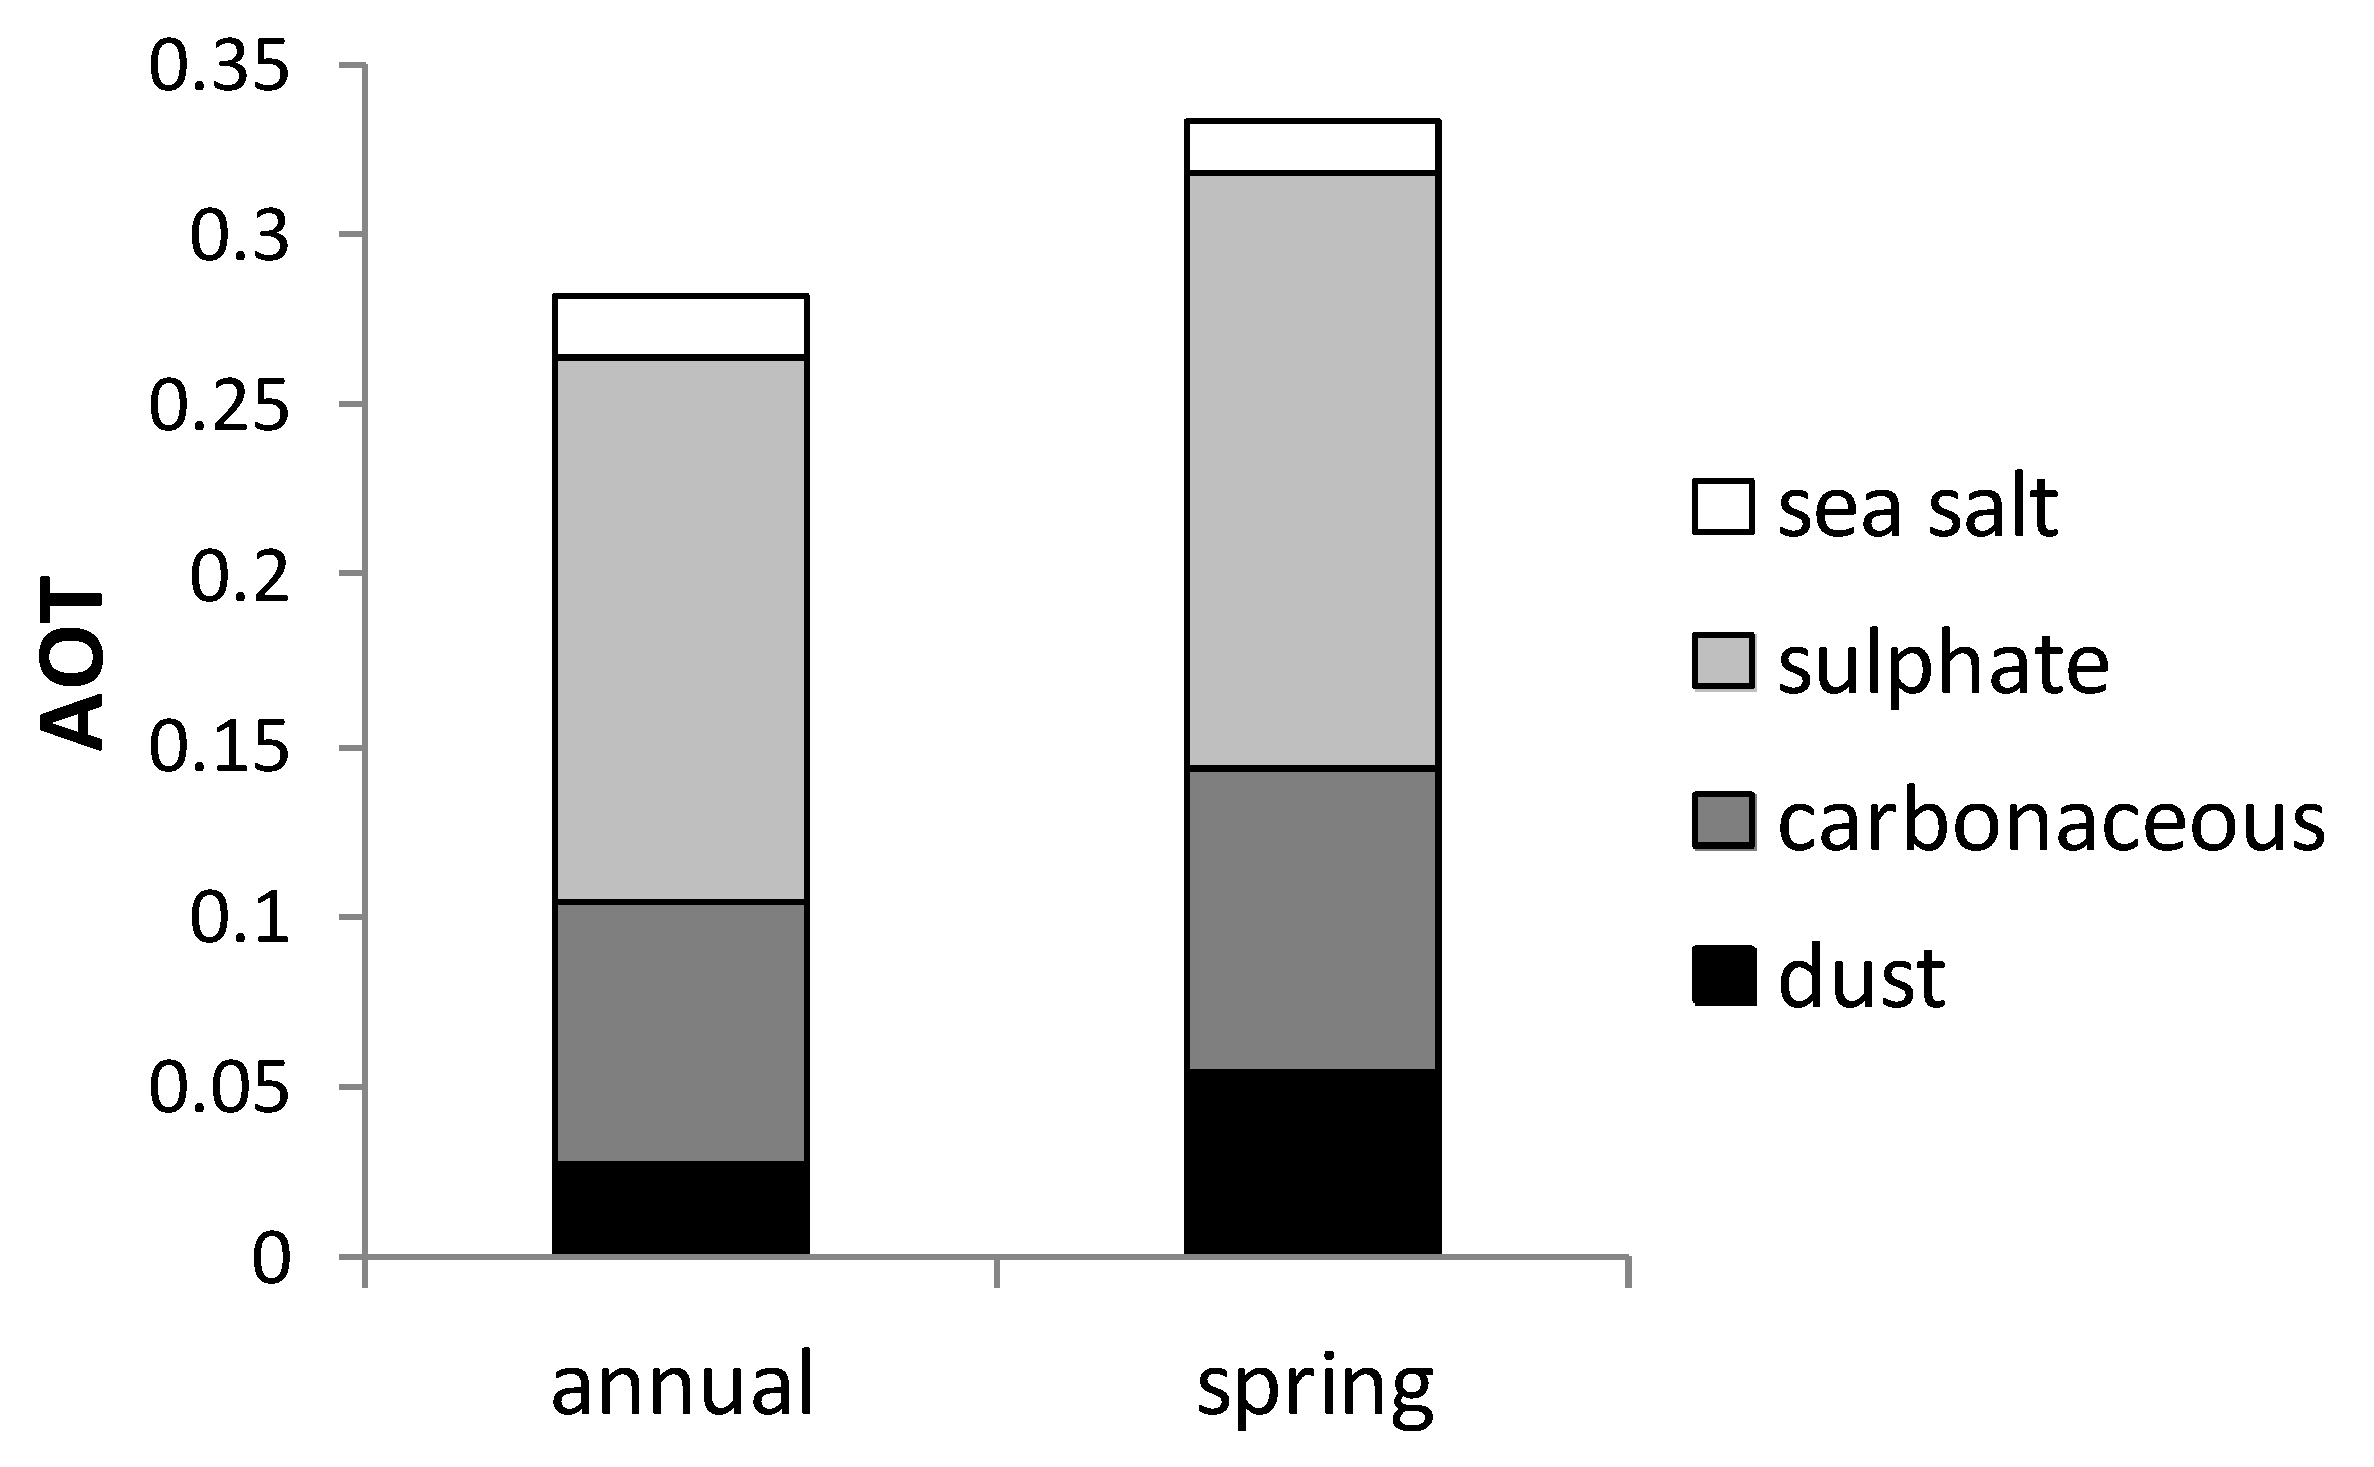
Figure 1 presents the contribution of aerosol type to the simulated AOT around Higashi-Osaka. We used the three-dimensional aerosol-transport-radiation model SPRINTARS [21], which is driven by a GCM (general circulation model) of AORI (Atmosphere Ocean Research Institute)/NIES/FRCGC (Frontier Research Center for Global Change), Japan. The horizontal and vertical resolutions of the triangular truncation were set at T42 (approximately 2.8 by 2.8 degrees in latitude and longitude) and 20 layers, respectively. The model treats carbonaceous, sulphate, dust, and sea salt aerosols. The aerosol transport process includes emission, advection, diffusion, wet deposition, dry deposition and gravitational settling. The emission inventory data of fossil fuel consumption, fuel wood consumption and forest fires are used for carbonaceous aerosol and sulphate aerosol sources. The dust aerosol emission process is calculated by vegetation, near surface wind speed, soil wetness and snow depth. The simulated AOT are compared with the AOT measured by AERONET at dozens of locations, accounting for seasonal variations. The mean difference between the simulation and observations is found to be less than 30% [22]. A comparison between the simulated and observed daily aerosol mass concentration shows that the model reproduces the magnitude and peak features well [23]. Figure 1 shows the simulated contributions of the aerosol type to the annual mean and spring (March–April–May) mean AOT in 2000. The contributions show that the sulphate and carbonaceous aerosols, many of which are supposedly of anthropogenic origin, account for 85% of the whole distribution. The large ratio is consistent with our observational results utilizing the clustering method; the anthropogenic aerosols are dominant on ordinary days in Higashi-Osaka. The percentage of days that anthropogenic aerosols are dominant relative to all observable days is approximately 98% [5]. Because dust events frequently occur in the spring [23], the ratio of dust tends to be higher, even though the anthropogenic aerosols are still dominant at the Higashi-Osaka site. The model simulation result is used in Section 4.
2.4. LIDAR
A Mie scattering LIDAR instrument, which is a part of the LIDAR network governed with NIES, has been installed since April 2008 at the Higashi-Osaka site. The NIES/LIDAR uses the second harmonics (0.532 m) of a flashlamp-pumped Nd:YAG laser as a light source. Interestingly the LIDAR provides the vertical distribution of atmospheric aerosols and the total depolarisation ratio of the perpendicular component to the parallel component of the backscattering intensity. A depolarisation ratio that is larger than 0.1 means that the non-spherical particles are dominant. LIDAR observations are used in Section 3.
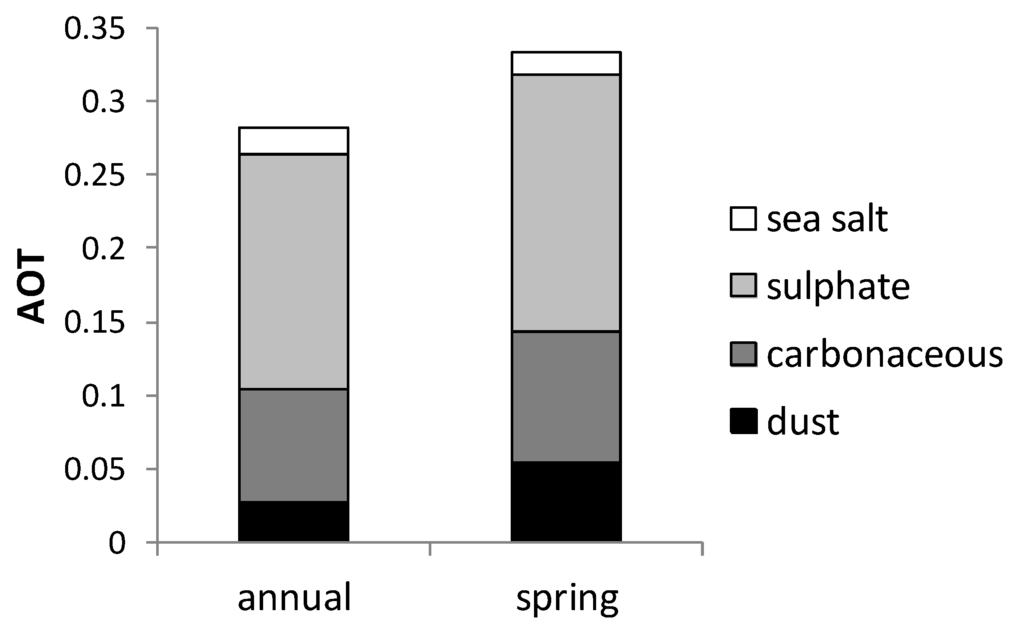
Figure 1.
Contribution of aerosol type to simulated annual mean and spring (March, April and May) aerosol optical thickness (AOT) at a wavelength of 0.55 m around Higashi-Osaka.
Figure 1.
Contribution of aerosol type to simulated annual mean and spring (March, April and May) aerosol optical thickness (AOT) at a wavelength of 0.55 m around Higashi-Osaka.
3. Temporal Variations of Aerosol Characteristics on a Local Scale
Aerosol properties such as the amount, size, shape and composition in Higashi-Osaka change during dust events. To investigate the changes of the aerosol properties before and after a dust event, we analyzed the particulate matter collected by the SPM sampler with the SEM/EDX. The upper and middle panels in Figure 2 show the AERONET measurements of the AOT at 0.675 m and α in March 2010. A high AOT and a low α are the characteristic features of the dust event on 21 March. The amount of SPMs measured with the SPM sampler increased on 21 March, as shown in the bottom panel in Figure 2. The PMC value, an indicator of dust events, is also high. Ordinarily the PMC value is approximately 10 g/m3, which is the third part of the total PM. However the PMC increased to 36 g/m3, which is half of the total PM at the peak of the dust event on 21 March. We look closely at the points preceding, during and following the dust event on 21 March 2010, which are denoted by A (3:00JST), B (8:00JST) and C (15:00JST), respectively. Japan standard time (JST) is 9 h ahead of universal time (UT). The measurements with a Mie scattering LIDAR instrument attached to the AERONET site in Higashi-Osaka provided the depolarization ratios. A depolarization ratio greater than 0.1 indicates that the non-spherical particles are dominant [13]. The depolarization ratio was greater than 0.3 in the middle of the dust event at B. Furthermore, we can see from the MODIS satellite image (not shown here) that the dust storm occurred at an arid region in China and that dust was transported to Japan. From these measurements, we determined that the dust event happened on 21 March 2010. Then, we analyzed the particulate matter with the SEM/EDX using particles sampled by an SPM sampler at Higashi-Osaka at A (3:00JST), B (8:00JST) and C (15:00JST) on 21 March 2010.
We show the results of the individual particle analysis by SEM/EDX using the PM10 from the SPM sampler. We measured the particle size using a SEM image of more than 100 particles for the samples corresponding to points A, B and C. The average particle radius and the ratios of the major and minor axis are shown in Table 1. At the peak of the dust event, large and non-spherical particles became dominant.
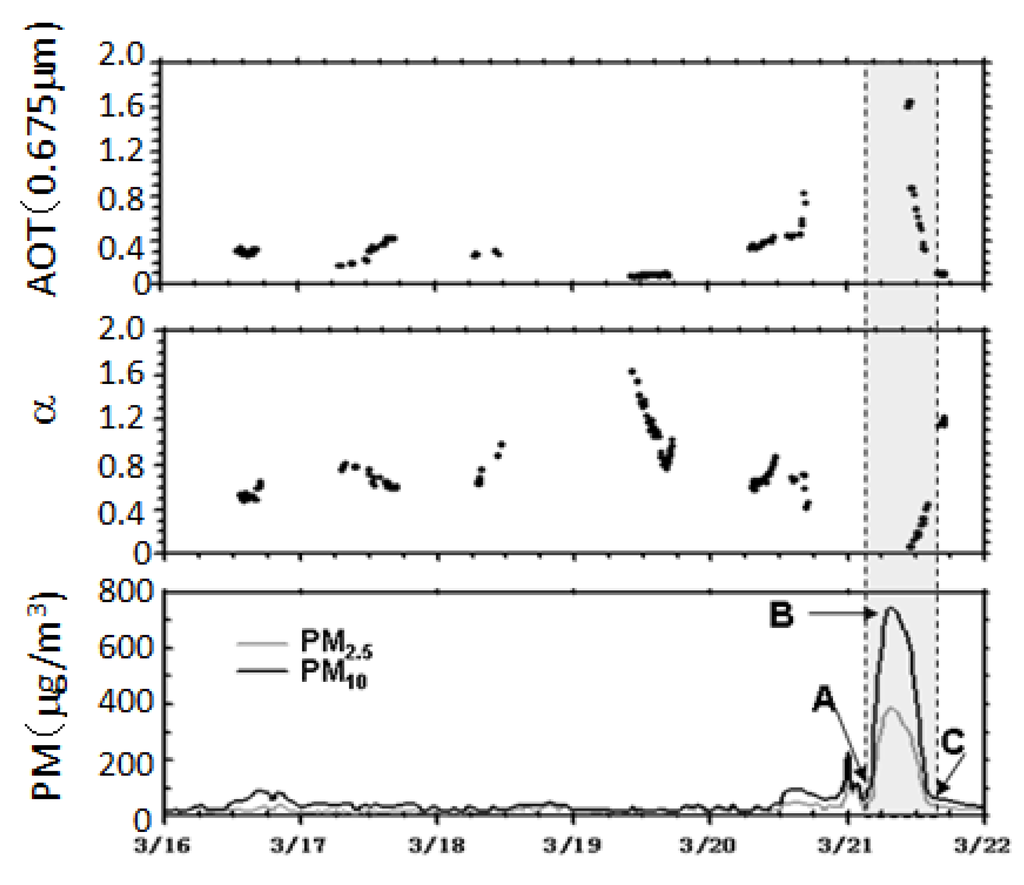
Figure 2.
Ground measurements of atmospheric particles in March 2010, where the upper, middle and bottom panels represent the AOT at 0.675 m, αmeasure with (aerosol robotics network (AERONET) and the PM measured with the suspended particulate matter (SPM) sampler, respectively. A, B and C denote the values before, at the peak of and after the dust event, respectively.


Table 1.
Average and standard deviation of particle sizes and ratios of the major and minor axis. A (3:00 JST), B (8:00 JST) and C (15:00 JST) on 21 March 2010. Japan standard time (JST) is universal time (UT) + 09:00.
| Radius | Ratio | |||
|---|---|---|---|---|
| Average | Standard Deviation | Average | Standard Deviation | |
| A (3:00 JST) | 0.83 | 0.65 | 1.29 | 0.30 |
| B (8:00 JST) | 1.6 | 0.92 | 2.32 | 2.51 |
| C (15:00 JST) | 1.2 | 0.83 | 1.91 | 1.52 |
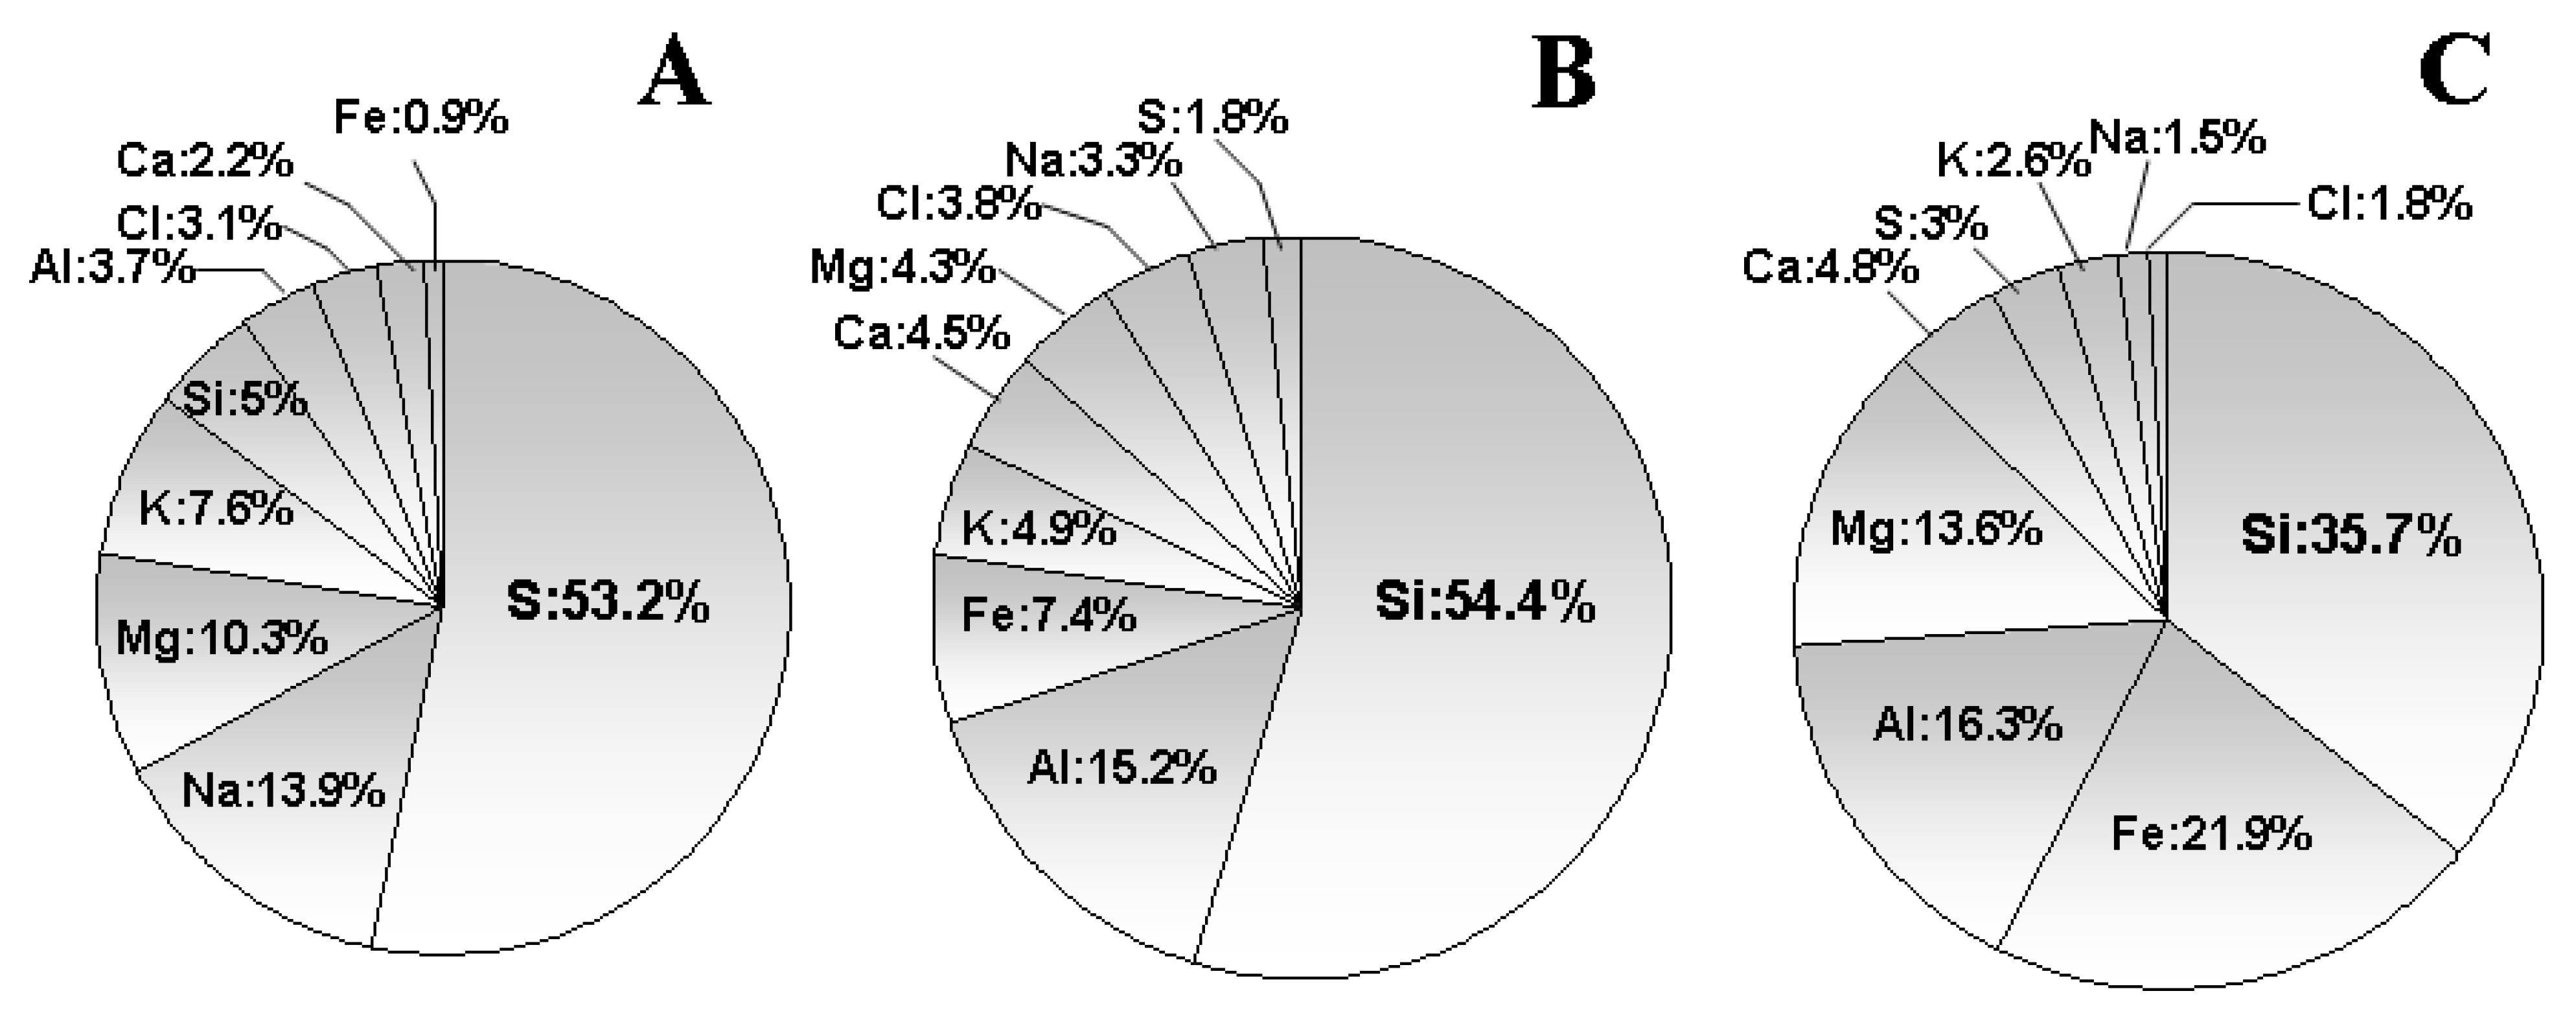
Figure 3 shows the contribution of each component to the mass concentration averaged over 100 particles at each point A, B and C analyzed with EDX. Ordinarily, the ratio of silicon is approximately 10% at Higashi-Osaka. It is clear that silicon, which is possibly from soil particles, became dominant at the peak of the dust event and remained high following the dust event. In contrast, the sulphur from fossil fuel burning was dominant before the dust event. The ratio of sulphur increased at point A compared to the ratio in ordinary days, which was approximately 25%. We consider the small peak before point A in Figure 2 to represent the arrival of anthropogenic pollutants. We confirmed that anthropogenic pollutant was transported to Higashi-Osaka before peak of dust event based on model simulation [24]. The change in the particle ratio suggests that a certain amount of natural and anthropogenic particles was transported to Higashi-Osaka, because the natural particles were mainly observed prior to the event and the anthropogenic pollutants were observed during and following the dust event.
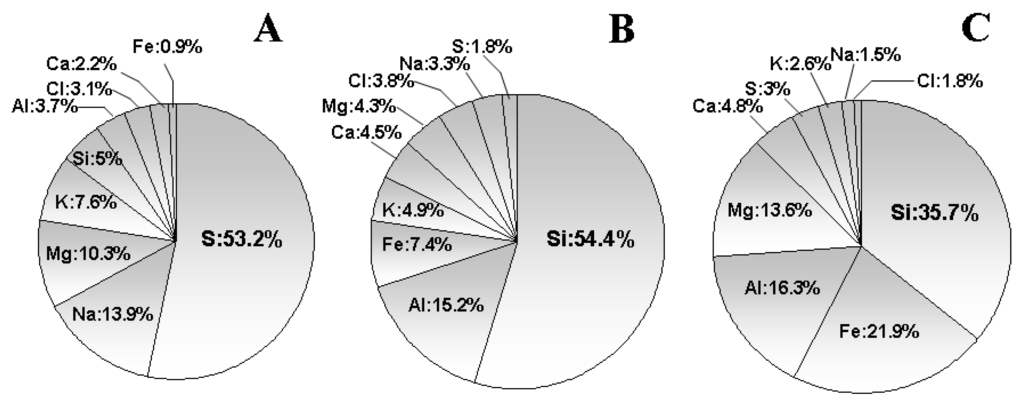
Figure 3.
The mass concentration (%) of each component for particles averaged over 100 particles derived from an energy-dispersive X-ray analyzer (EDX).
Figure 3.
The mass concentration (%) of each component for particles averaged over 100 particles derived from an energy-dispersive X-ray analyzer (EDX).
4. Spatial Variations of the Aerosol Characteristics on a Local Scale
The Microtops-2 portable sun photometer, which is easy to carry and added mobility to our observations, enabled simultaneous measurements with the main AERONET Higashi-Osaka site. We compared the distributions at the two sites of Izumi (135.25°E, 34.28°N) at 10 m above sea level and Nara (135.68°E, 34.67°N) at 200 m above sea level. Figure 4 shows the location of each site. Izumi is located southwest of Higashi-Osaka and is near the industrial zone surrounding the Osaka Bay, and the Nara site is located east of Higashi-Osaka. Simultaneous measurements with the AERONET Higashi-Osaka site using the two portable sun photometers at Izumi and Nara sites were conducted from April to November 2011. We used the portable sun photometer data whose time lag from AERONET is less than 3 min. The data were cloud screened prior to the aerosol retrieval, and the data were calibrated with AERONET. Figure 5 shows the typical AOT values at each site averaged over the observation period. The bars, from left to right, represent Izumi, Osaka and Nara. The Izumi site is located near an industrial area, in which the aerosol concentration is higher than that at Higashi-Osaka. In contrast, the AOT at the Nara site is less than at the other sites. The polluted air emitted from industries is brought by westerlies from Osaka to Nara, but the air is blocked by Mount Ikoma, which is approximately 640 m high above sea level and lies between Higashi-Osaka and Nara as shown in Figure 4. We conclude that the decrease in air pollution at the Nara site is due not only to the larger distance to Osaka but also to the blocking by Mount Ikoma.
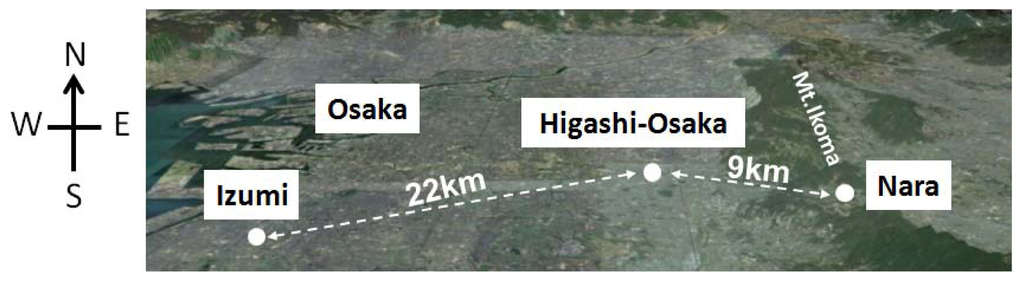
Figure 4.
Map of observation sites. Higashi-Osaka is located at 135.59E, 34.65N.
Figure 4.
Map of observation sites. Higashi-Osaka is located at 135.59E, 34.65N.

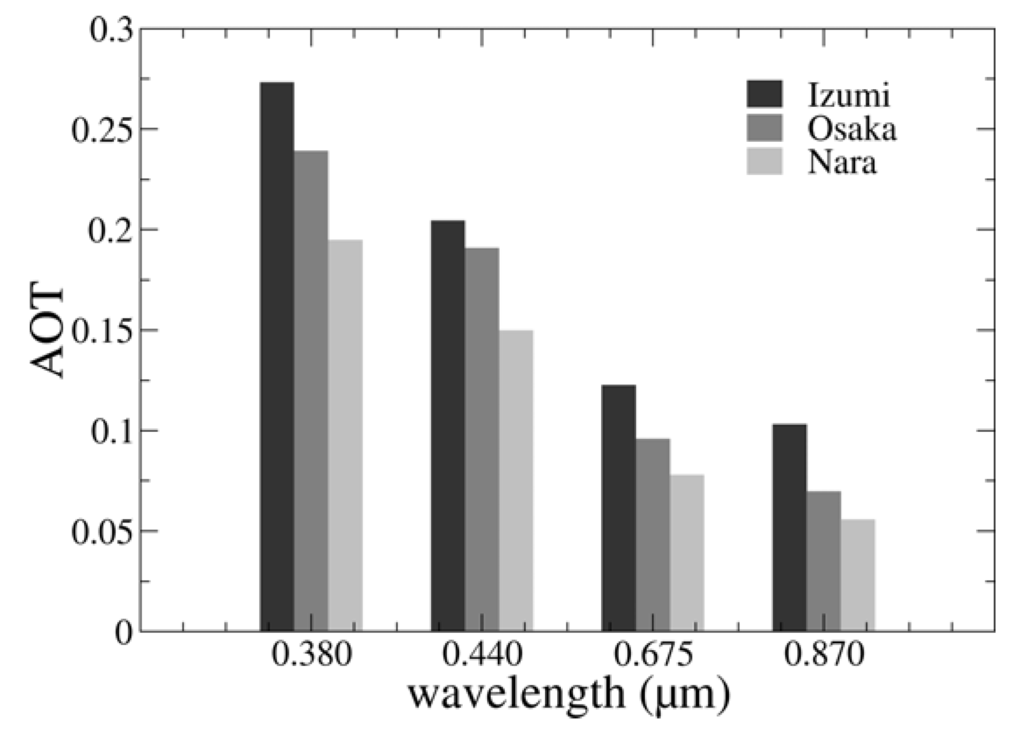
Figure 5.
AOT averaged from April to November 2011 at the Izumi, Higashi-Osaka and Nara sites.
Figure 5.
AOT averaged from April to November 2011 at the Izumi, Higashi-Osaka and Nara sites.

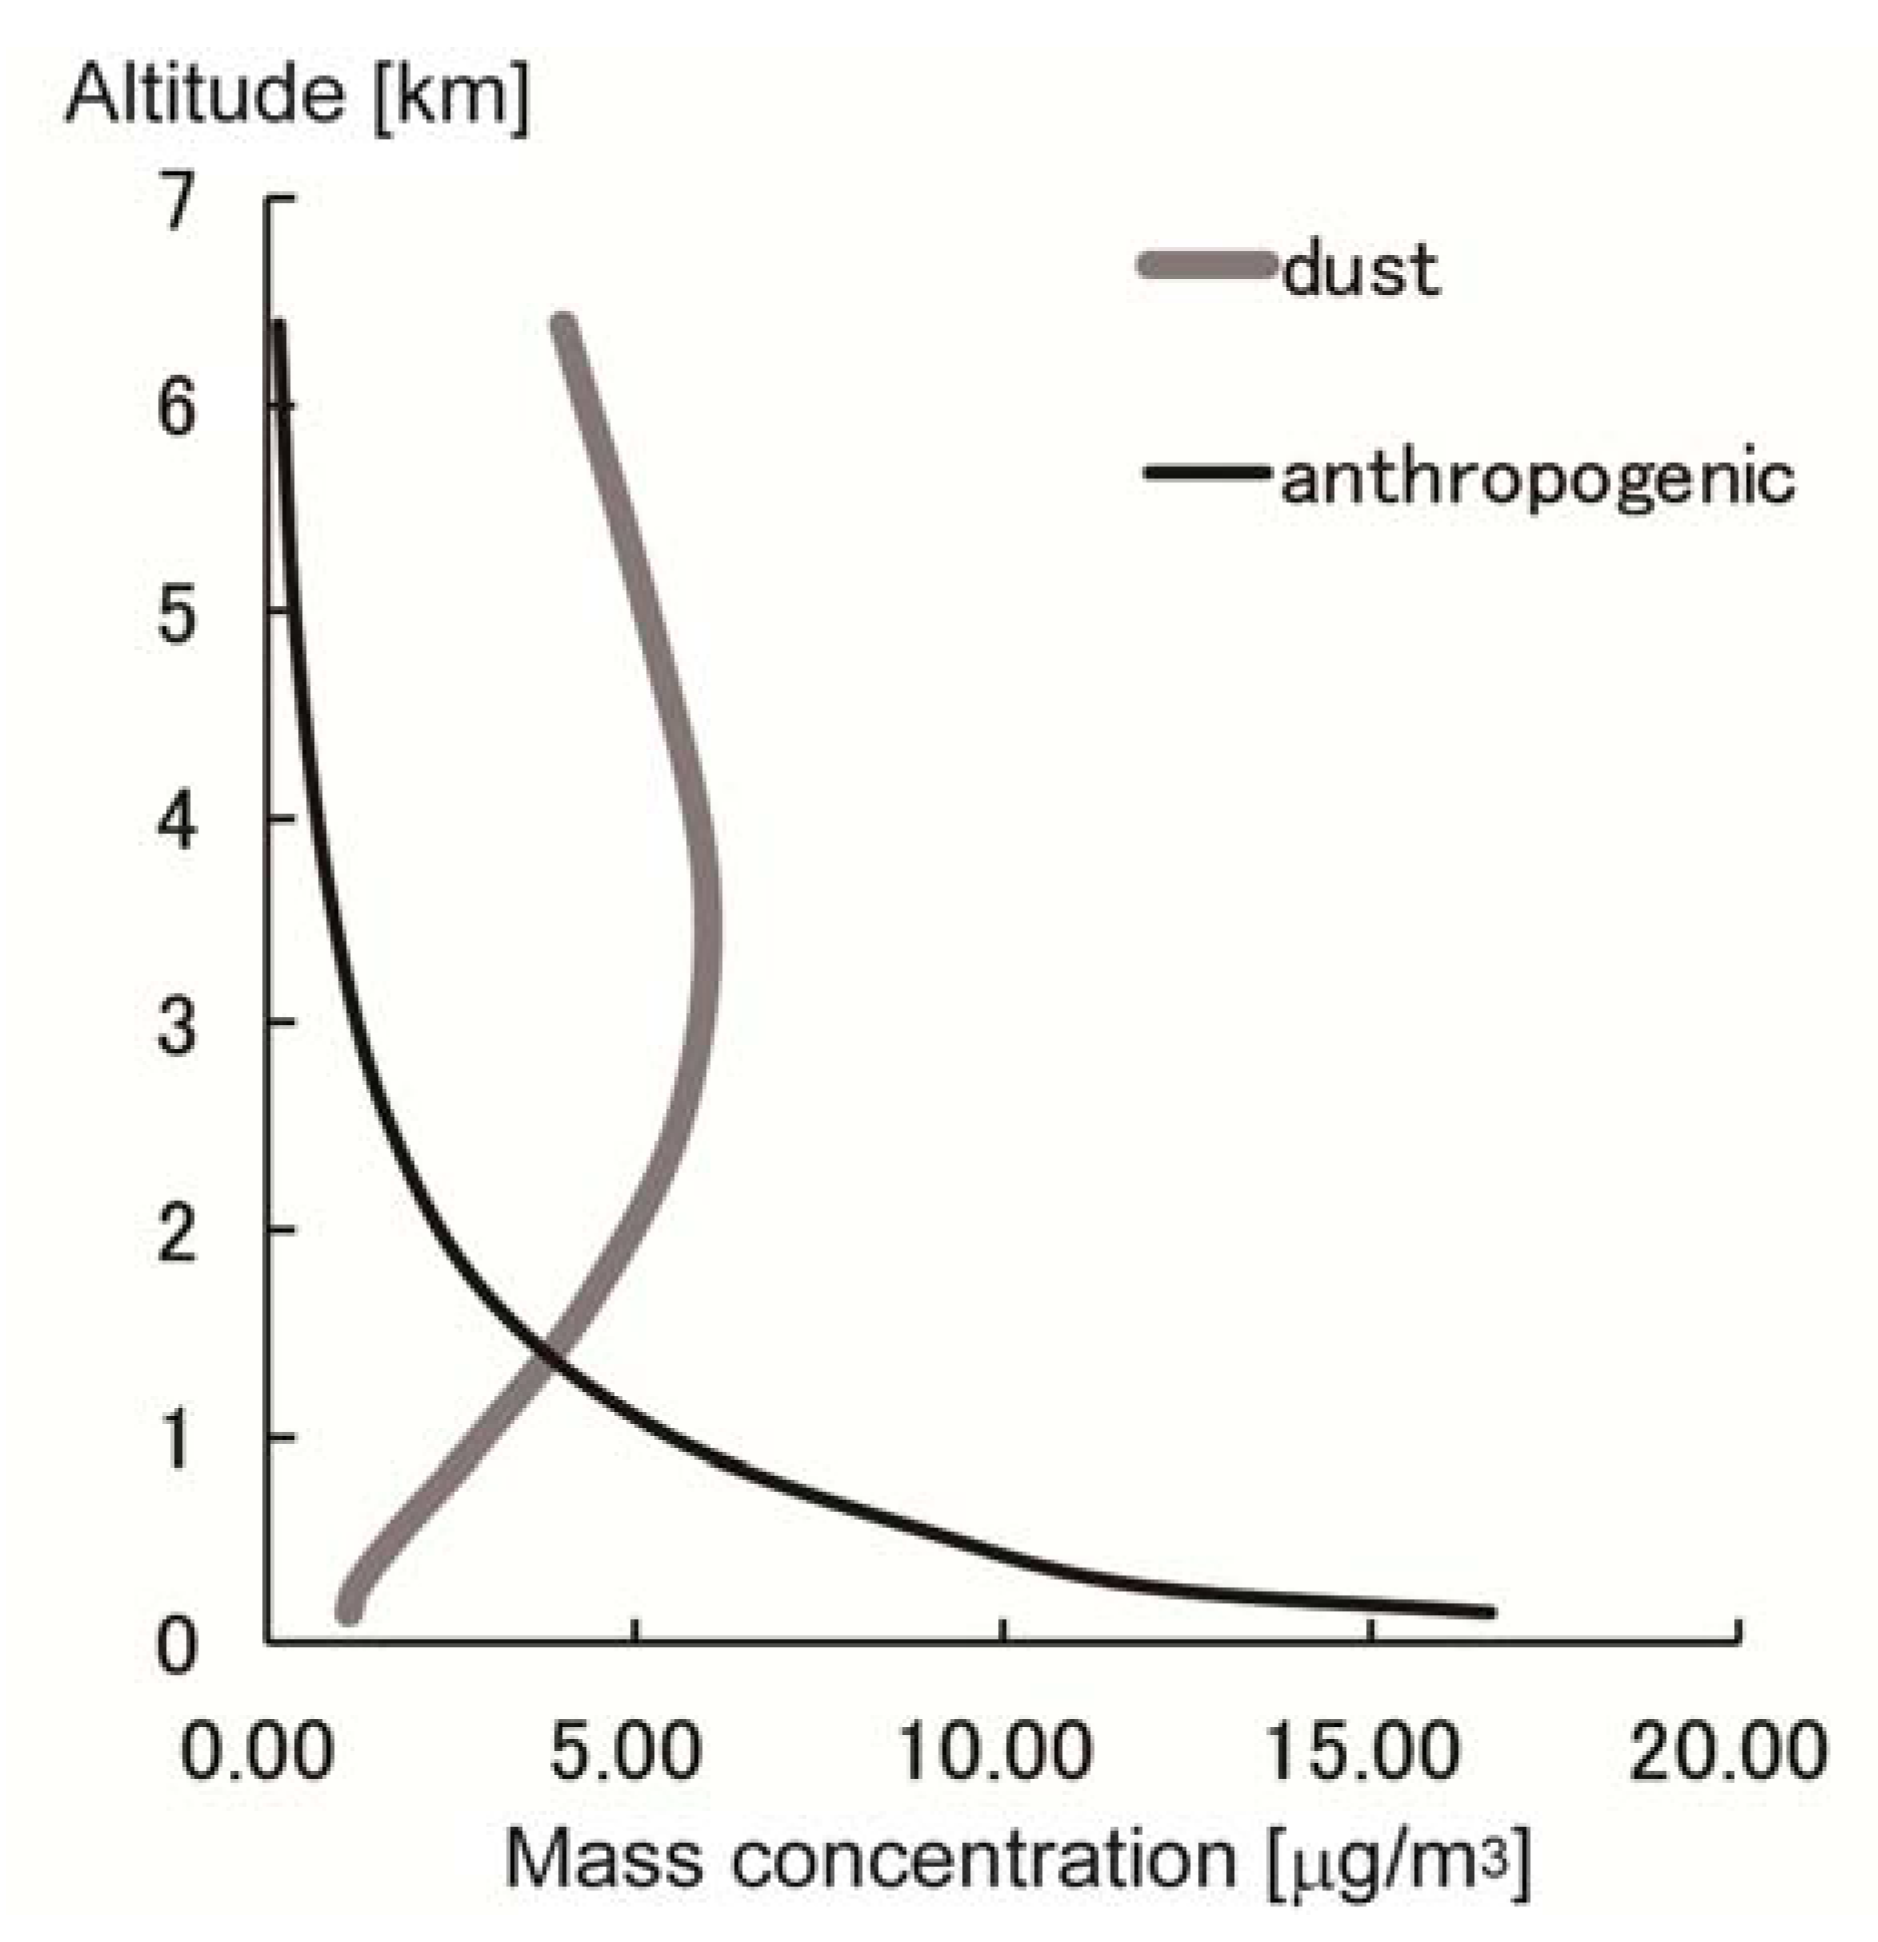
Figure 6 shows a scatter diagram of (0.440–0.870 m) versus AOT at 0.675 m in Higashi-Osaka, Izumi and Nara. The data are divided into two groups using AOT (0.675 m) = 0.4 and α (0.440–0.870 m) = 0.5 as criterion values. Hence, the data within the region (AOT (0.675 µm) ≥ 0.4, α (0.440–0.870 m) ≤ 0.5) represent a dust day and elsewhere, the data represent an ordinary day. Note that we did not observe at the Izumi site on dust days. Usually, the AOT at the Nara site is less than that at the Higashi-Osaka site. However, the AOT at Nara is as large as the AOT at Higashi-Osaka during dust days. The relative ratio of the AOT at Nara to that at Higashi-Osaka is 0.8 on ordinary days and 0.9 on dust days during the observation period, and the ratio appears to have been unaffected by Mount Ikoma during those periods. We conclude that the results are related to the differences in the vertical aerosol profiles [19]. Figure 7 shows the spring (March–April–May) mean simulated vertical profiles of the aerosol total mass concentration using SPRINTARS in 2000. It is confirmed that the observed mass concentration during the dust event of 21 March 2010, as shown in Figure 2, reached a high concentration compared with the simulated mass concentration. The model is provided only to enable a simple comparison of the dust aerosols and anthropogenic (carbonaceous plus sulphate) aerosols. The profiles suggest that the concentration of anthropogenic aerosols is high at the surface but decreases sharply with altitude. The extinction coefficients measured by LIDAR also show that the dust and anthropogenic aerosols concentrate around the high and low altitude, respectively [24]. A certain amount of anthropogenic aerosols is naturally blocked by Mount Ikoma, which is approximately 650 m high. However, as the vertical profiles of the dust aerosols have a peak at a height of 3–4 km, many of these aerosols are unaffected by Mount Ikoma and are transported over it. A relationship exists between the total column aerosol optical thickness and PM mass concentration [20,25,26]. Our previous work showed that a linear correlation definitely exists between the AOT and PM2.5, and the value of the correlation coefficient for all the data was lower than that for anthropogenic and dust aerosols separately [19]. This result indicates that the atmospheric situation during dust events may be different from the usual, because the vertical profile of the aerosols is different. In this work, we confirm that dust aerosols are transported at a higher altitude over Higashi-Osaka.
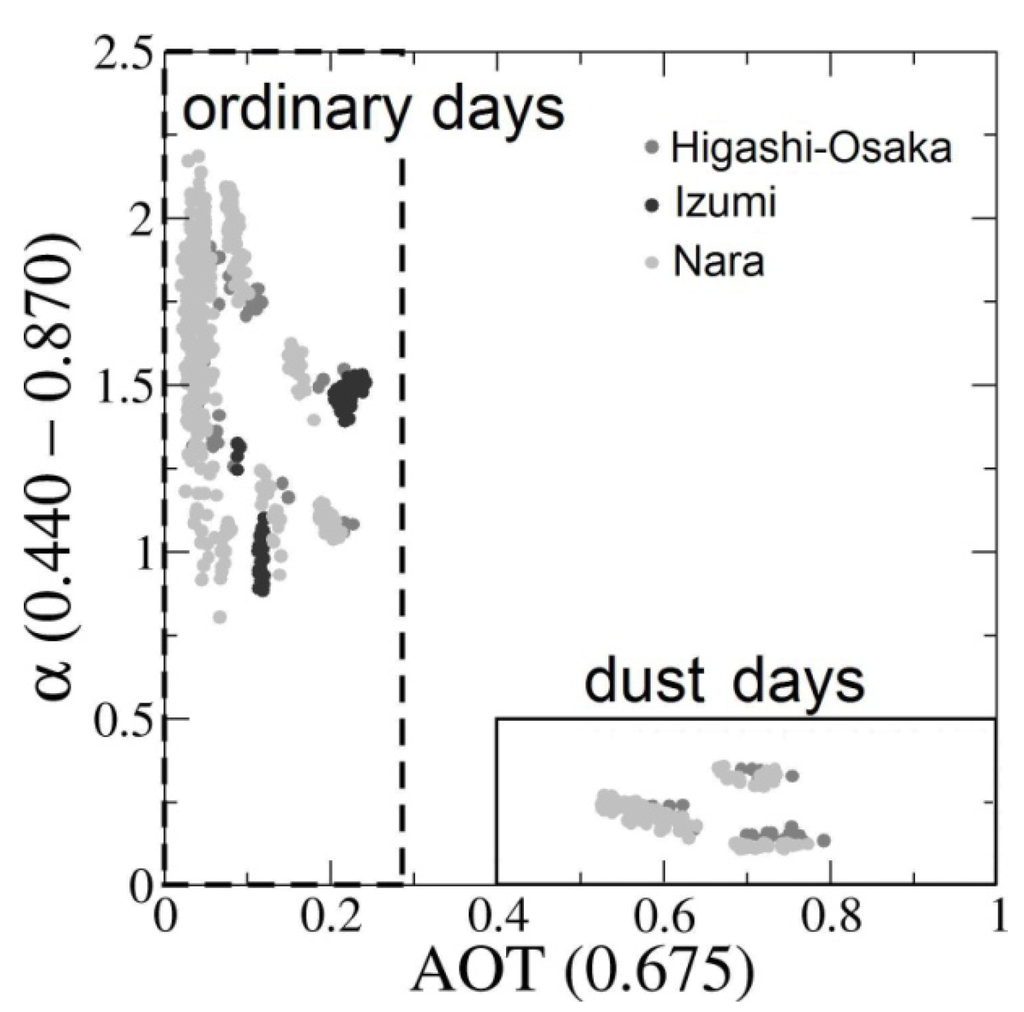
Figure 6.
Scatter diagram of (0.440–0.870 m) against the AOT (0.675 m) at Higashi-Osaka, Izumi and Nara from April to November 2011.
Figure 6.
Scatter diagram of (0.440–0.870 m) against the AOT (0.675 m) at Higashi-Osaka, Izumi and Nara from April to November 2011.
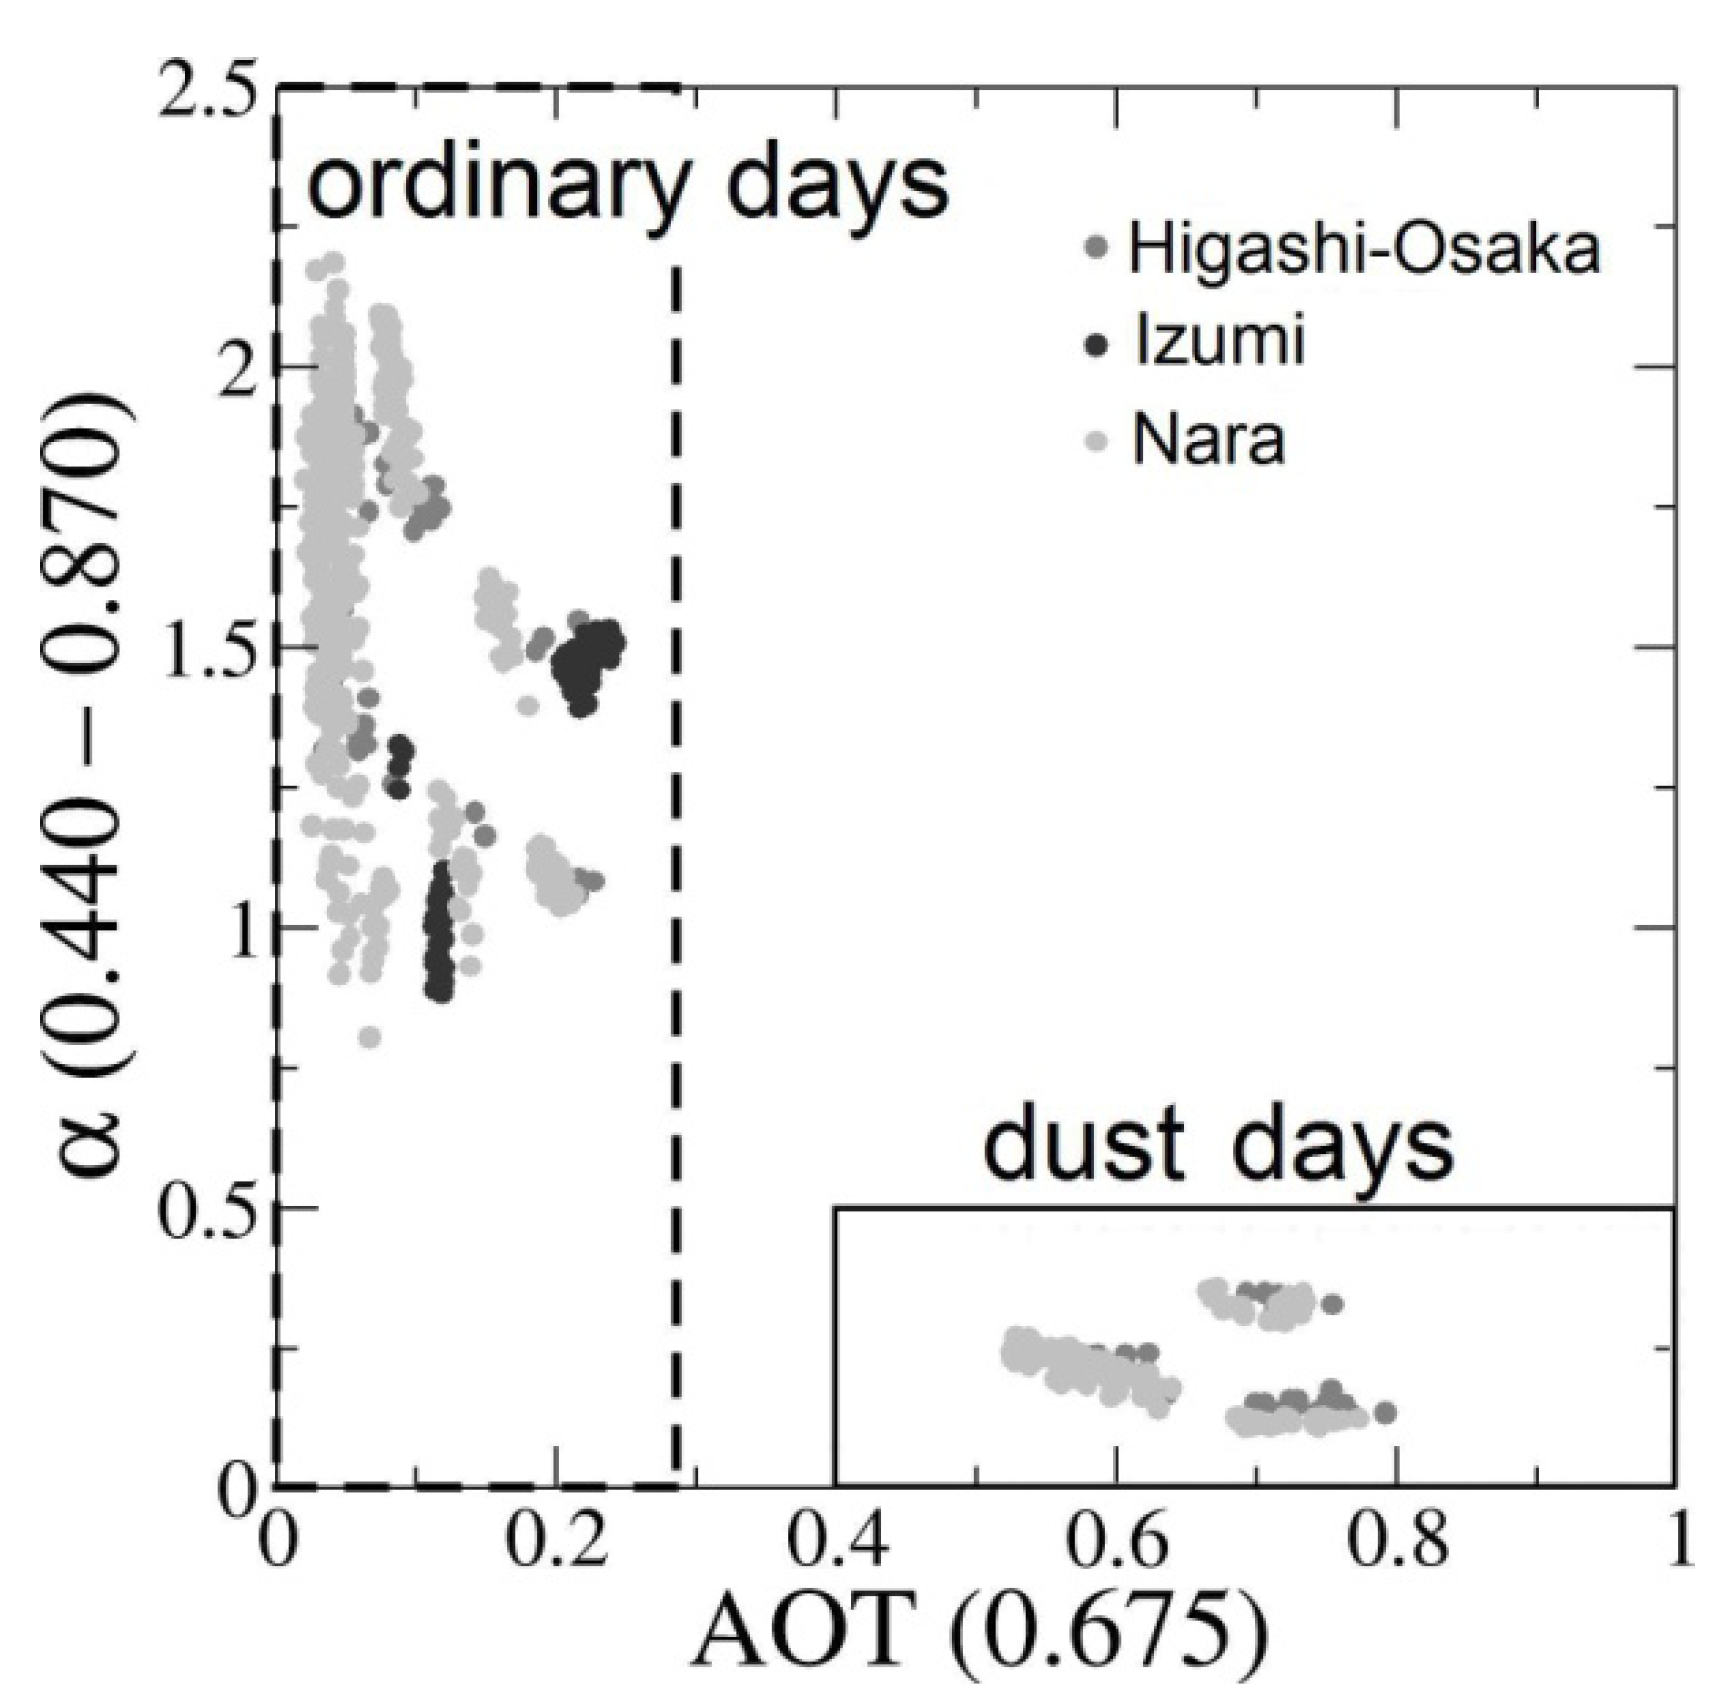
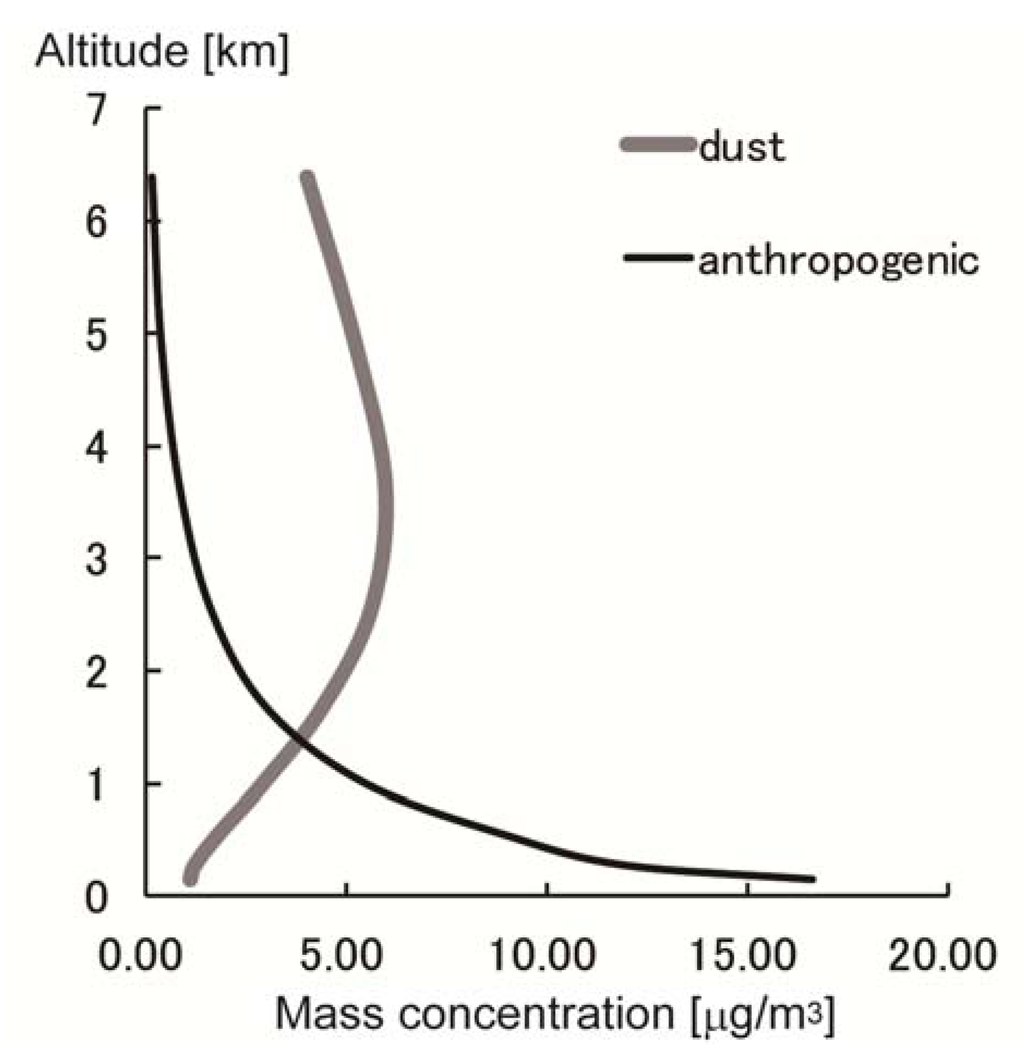
Figure 7.
Simulated vertical profiles of mean aerosol total mass concentration around Osaka in spring, i.e., March, April and May. The altitude represents above sea level.
Figure 7.
Simulated vertical profiles of mean aerosol total mass concentration around Osaka in spring, i.e., March, April and May. The altitude represents above sea level.
5. Summary
In this work, we investigated the spatial and temporal variations of atmospheric particles around Higashi-Osaka, where various ground measurement devices were placed. The individual particle analysis using SEM/EDX showed the temporal variations of particles properties such as size, shape and composition during a dust event. We selected three cases, namely, before the dust reached Higashi-Osaka on 21 March 2010, during the peak of the dust event and after the dust event passed. The results of the analyses for each case indicated that the non-spherical particles with large particle sizes were dominant, that the main component was silicon derived from soil particles at the peak of the dust event and that the soil particles remained after the dust event. Our new instruments, the Microtops-2 portable sun photometers, enable simultaneous measurements of aerosols at multiple sites and locations. The photometers captured the spatial variations of the aerosols on a local scale around Higashi-Osaka. The AOT at the Nara site is less than at the Higashi-Osaka site on ordinary days because the polluted air is blocked by Mount Ikoma. However, the AOT at Nara is as large as the AOT at Higashi-Osaka during the dust days. The simulated aerosol profiles suggest that the concentration of anthropogenic aerosols is high at the surface but decreases sharply with altitude. A certain amount of anthropogenic aerosols is naturally blocked by Mount Ikoma. However, as the vertical profiles of the dust aerosols have a peak at a height of 3–4 km, many of these aerosols are transported over it.
It is known that local spatially and temporally resolved measurements of atmospheric aerosols in an Asian urban city are meaningful because the aerosol distribution in East Asia is complicated due to the increasing emissions of anthropogenic aerosols and because dust varies significantly with the seasons. The DRAGON (Distributed Regional Aerosol Gridded Observation Networks)-Asia campaign deployed sun/sky radiometers in Japan and South Korea from 15 February to 31 May 2012. This campaign intended to establish a mesoscale network of sun photometers in Osaka, Japan, and Seoul, South Korea, and supplement the mesoscale networks with distributed sites to capture the aerosol variability including aerosol transport from the Asian continent. This work can be used to analyze the data observed during DRAGON-Asia.
Acknowledgments
The authors thank NASA/AERONET team for data processing. This work was supported in part by a Grant-in-Aid for Scientific Research from the Japan Society for the Promotion of Science (No. 23120708) and by Global Change Observation Mission-Climate (GCOM-C) by JAXA (No. JX-PSPC-308878).
Conflict of Interest
The authors declare no conflict of interest.
References
- Kahn, R.; Anderson, J.; Anderson, T.L.; Bates, T.; Brechtel, F.; Carrico, C.M.; Clarke, A.; Doherty, S.J.; Dutton, E.; Flagan, R.; et al. Environmental snapshots from ACE-Asia. J. Geophys. Res. 2004, 109, D19S14. [Google Scholar] [CrossRef]
- Kinne, S.; Lohmann, U.; Feichter, J.; Schulz, M.; Timmreck, C.; Ghan, S.; Easter, R.; Chin, M.; Ginoux, P.; Takemura, T.; et al. Monthly averages of aerosol properties: A global comparison among models, satellite data, and AERONET ground data. J. Geophys. Res. 2003, 108, D20. [Google Scholar] [CrossRef]
- Littmann, T. Dust storm frequency in Asia: Climatic control and variability. Int. J. Climatol. 1991, 11, 393–412. [Google Scholar] [CrossRef]
- Takemura, T.; Uno, I.; Nakajima, T.; Higurashi, A.; Sano, I. Modeling study of long-range transport of Asian dust and anthropogenic aerosols from Asia. Geophys. Res. Lett. 2002, 29, 2158. [Google Scholar] [CrossRef]
- Nakata, M.; Yokomae, T.; Fujito, T.; Sano, I.; Mukai, S. Characterization of Aerosols Based on the Simultaneous Measurements. In Proceedings of 2011 IEEE International Geosciences and Remote Sensing Symposium (IGARSS), Vancouver, BC, Canada, 24–29 July 2011; pp. 4026–4029.
- Mukai, M.; Nakajima, T.; Takemura, T. A study of anthropogenic impacts of the radiation budget and the cloud field in East Asia based on model simulations with GCM. J. Geophys. Res. 2008, 113, D12211. [Google Scholar] [CrossRef]
- Pérez, C.; Nickovic, S.; Pejanovic, G.; Baldasano, J.M.; Özsoy, E. Interactive dust-radiation modeling: A step to improve weather forecast. J. Geophys Res. 2006, 111, D16206. [Google Scholar]
- Mukai, S.; Sano, I.; Masuda, K.; Takashima, T. Atmospheric correction for ocean color remote sensing: Optical properties of aerosols derived from CZCS imagery. IEEE Trans. Geosci. Remote Sens. 1992, 30, 818–824. [Google Scholar] [CrossRef]
- Sano, I.; Mukai, S.; Okada, Y.; Holben, B.N.; Ohta, S.; Takamura, T. Optical properties of aerosols during APEX and ACE-Asia experiments. J. Geophys Res. 2003, 108, 8649. [Google Scholar]
- Dubovik, O.; Smirnov, A.; Holben, B.N.; King, M.D.; Kaufman, Y.J.; Eck, T.F.; Slutsker, I. Accuracy assessments of aerosol optical properties retrieved from AERONET sun and sky-radiaometric measurements. J. Geophys. Res. 2000, 105, 9791–9806. [Google Scholar]
- Dubovik, O.; King, M.D. A flexible inversion algorithm for retrieval of aerosols optical properties from sun and sky radiance measurements. J. Geophys. Res. 2000, 105, 20673–20696. [Google Scholar] [CrossRef]
- Holben, B.N.; Eck, T.F.; Slutsker, I.; Tanre, D.; Buis, J.P.; Setzer, A.; Vermote, E.; Reagan, J.A.; Kaufman, Y.; Nakajima, T.; et al. ARONET—A federated instrument network and data archive for aerosol characterization. Rem. Sens. Environ. 1998, 66, 1–16. [Google Scholar]
- Shimizu, A.; Sugimoto, N.; Matsui, I.; Arao, K.; Uno, I.; Murayama, T.; Kagawa, N.; Aoki, K.; Uchiyama, A.; Yamazaki, A. Continuous observations of Asian dust and other aerosols by polarization lidars in China and Japan during ACE-Asia. J. Geophys. Res. 2004, 109, 1–14. [Google Scholar]
- Mukai, S.; Sano, I.; Satoh, M.; Holben, B.N. Aerosol properties and air pollutants over an urban area. Atmos. Res. 2006, 82, 643–651. [Google Scholar]
- Mukai, S.; Nishina, M.; Sano, I.; Mukai, M.; Iguchi, N.; Mizobuchi, S. Suspended particulate matter sampling at an urban AERONET site in Japan part 1: Clustering analysis of aerosols. J. Appl. Remote Sens. 2007, 1. [Google Scholar] [CrossRef]
- Smirnov, A.; Holben, B.N.; Eck, T.F.; Dubovik, O.; Slutsker, I. Cloud screening and quality control algorithms for the AERONET database. Remote Sens. Environ. 2000, 73, 337–349. [Google Scholar] [CrossRef]
- Omar, A.H.; Won, J.-G.; Winker, D.M.; Yoon, S.-C.; Dubovik, O.; McCormick, M.P. Development of global aerosol models using cluster analysis of Aerosol Robotic Network (AERONET) measurements. J. Geophys. Res. 2005, 110. [Google Scholar] [CrossRef]
- Guputa, P.; Christopher, S.A.; Wang, J.; Gehring, R.; Lee, Y.; Kumar, N. Satellite remote sensing of particulate matter and air quality assessment over global cities. Atmos. Environ. 2006, 40, 5880–5892. [Google Scholar]
- Sano, I.; Mukai, M.; Iguchi, N.; Mukai, S. Suspended particulate matter sampling at an urban AERONET site in Japan, part 2: Relationship between column aerosol optical thickness and PM2.5 mass concentration. J. Appl. Remote Sens. 2010, 40. [Google Scholar] [CrossRef]
- Smirnov, A.; Holben, B.N.; Savoie, D.; Prospero, J.M.; Kaufmann, Y.J.; Tanré, D.; Eck, T.F.; Slutsker, I. Relationship between column aerosol optical thickness and in situ ground based dust concentrations over Barbados. Geophys. Res. Lett. 2000, 27, 1643–1646. [Google Scholar] [CrossRef]
- Takemura, T.; Nozawa, T.; Emori, S.; Nakajima, T.Y.; Nakajima, T. Simulation of climate response to aerosol direct and indirect effects with aerosol transport-radiation model. J. Geophys. Res. 2005, 110. [Google Scholar] [CrossRef]
- Takemura, T.; Nakajima, T.; Dubovik, O.; Holben, B.N.; Kinne, S. Single-scattering albedo and radiative forcing of various aerosol species with a global three-dimensional model. J. Climate 2002, 15, 333–352. [Google Scholar] [CrossRef]
- Mukai, M.; Nakajima, T.; Takemura, T. A studyof long-term trends in mineral dust aerosol distributions in Asia using a general circulation model. J. Geophys. Res. 2004, 109, D19204. [Google Scholar]
- Nakata, M.; Nakano, T.; Okuhara, T.; Mukai, S. Spatial-Temporal Variation of Atmospheric Particles in Local Scale. In Proceedings of 2012 IEEE International Geosciences and Remote Sensing Symposium (IGARSS), Munich, Germany, 22–27 July 2012; pp. 2554–2555.
- Park, R.S; Song, C.H.; Han, K.M.; Park, M.E.; Lee, S.-S.; Kim, S.-B.; Shimizu, A. A study on the aerosol optical properties over East Asia using a combination of CMAQ-simulated aerosol optical properties and remote-sensing data via a data assimilation technique. Atmos. Chem. Phys. Discuss. 2011, 11, 23801–23858. [Google Scholar]
- Wang, J.; Christopher, S.A. Intercomparison between satellite-derived aerosol optical thickness and PM2.5 mass: Implications for air quality studies. Geophys. Res. Lett. 2003, 30, 2095. [Google Scholar] [CrossRef]
© 2013 by the authors; licensee MDPI, Basel, Switzerland. This article is an open access article distributed under the terms and conditions of the Creative Commons Attribution license (http://creativecommons.org/licenses/by/3.0/).