4.1.1. Optimal WLA Results in Districts
The population, GDP, and land area data of each town in the Xian-jiang watershed were obtained from the Towns Agency of Statistics of Ningbo City (2015) [
46], while the in situ discharges of pollutants (2015) for each town in the basin were calculated (
Table 3). The EGC for each criterion under the constraints was optimized, and the sum of all criteria’s EGCs was minimized to obtain an optimal solution vector; namely, the reduced waste loads of the five towns considered.
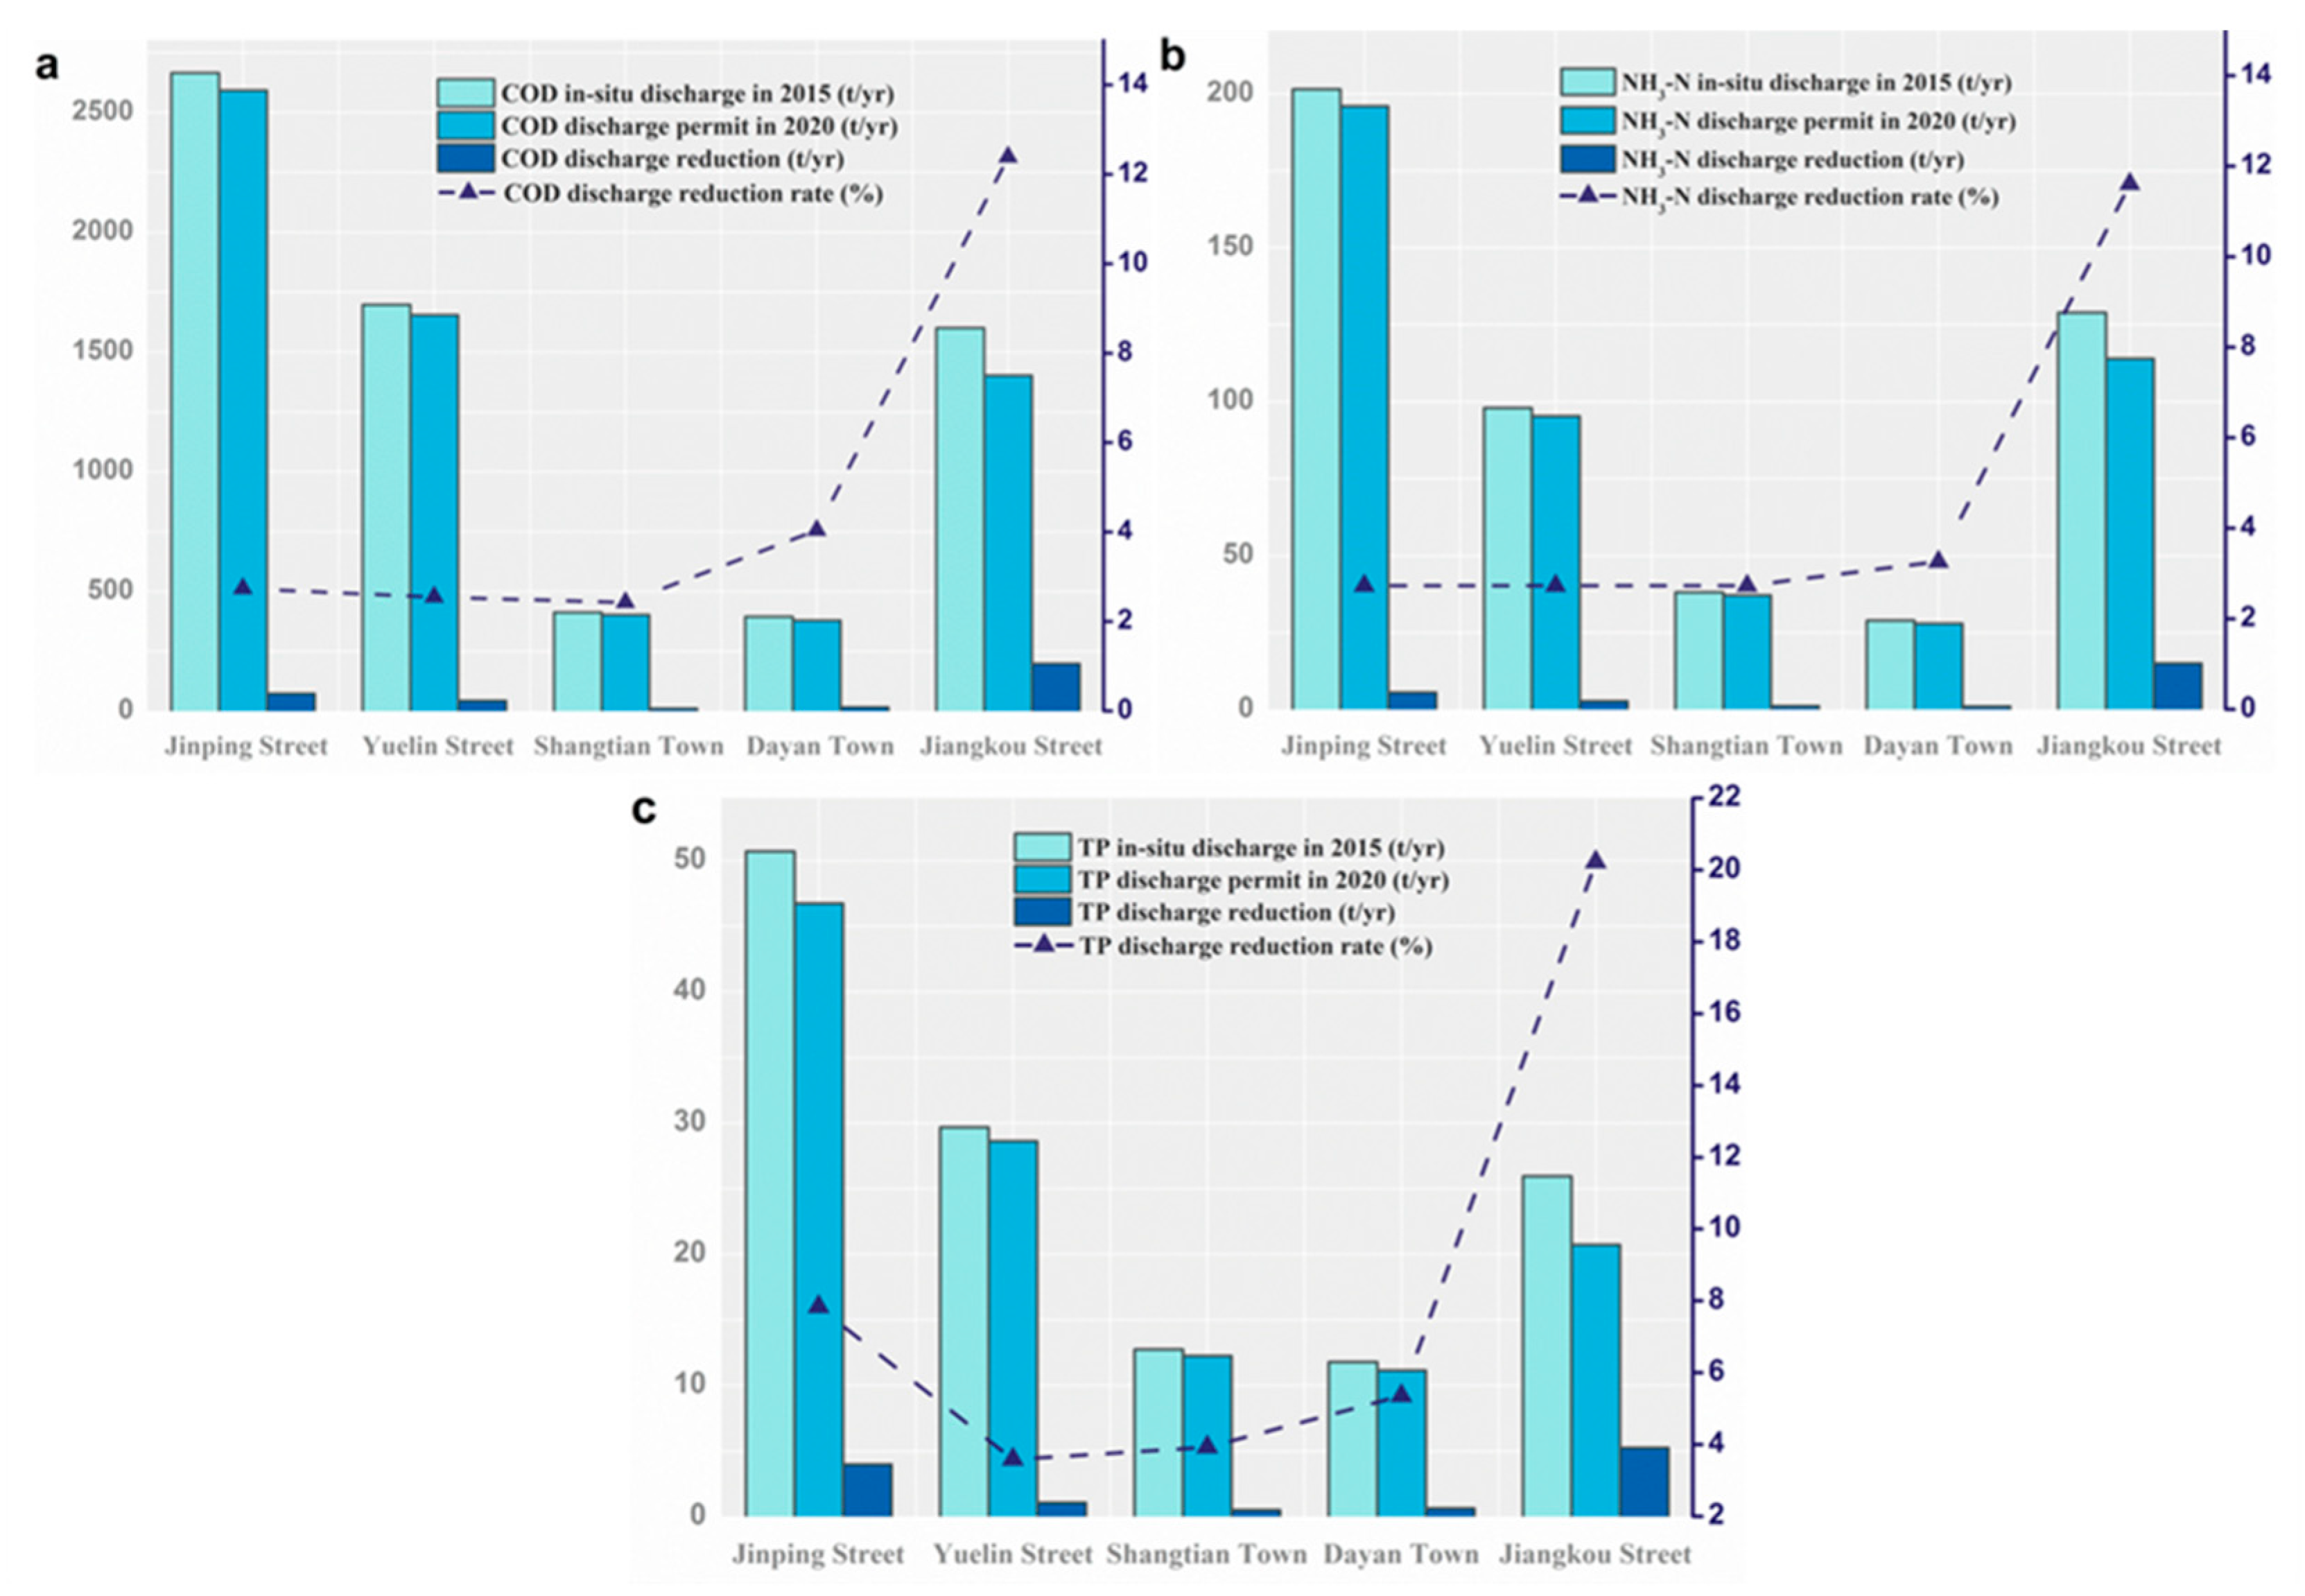
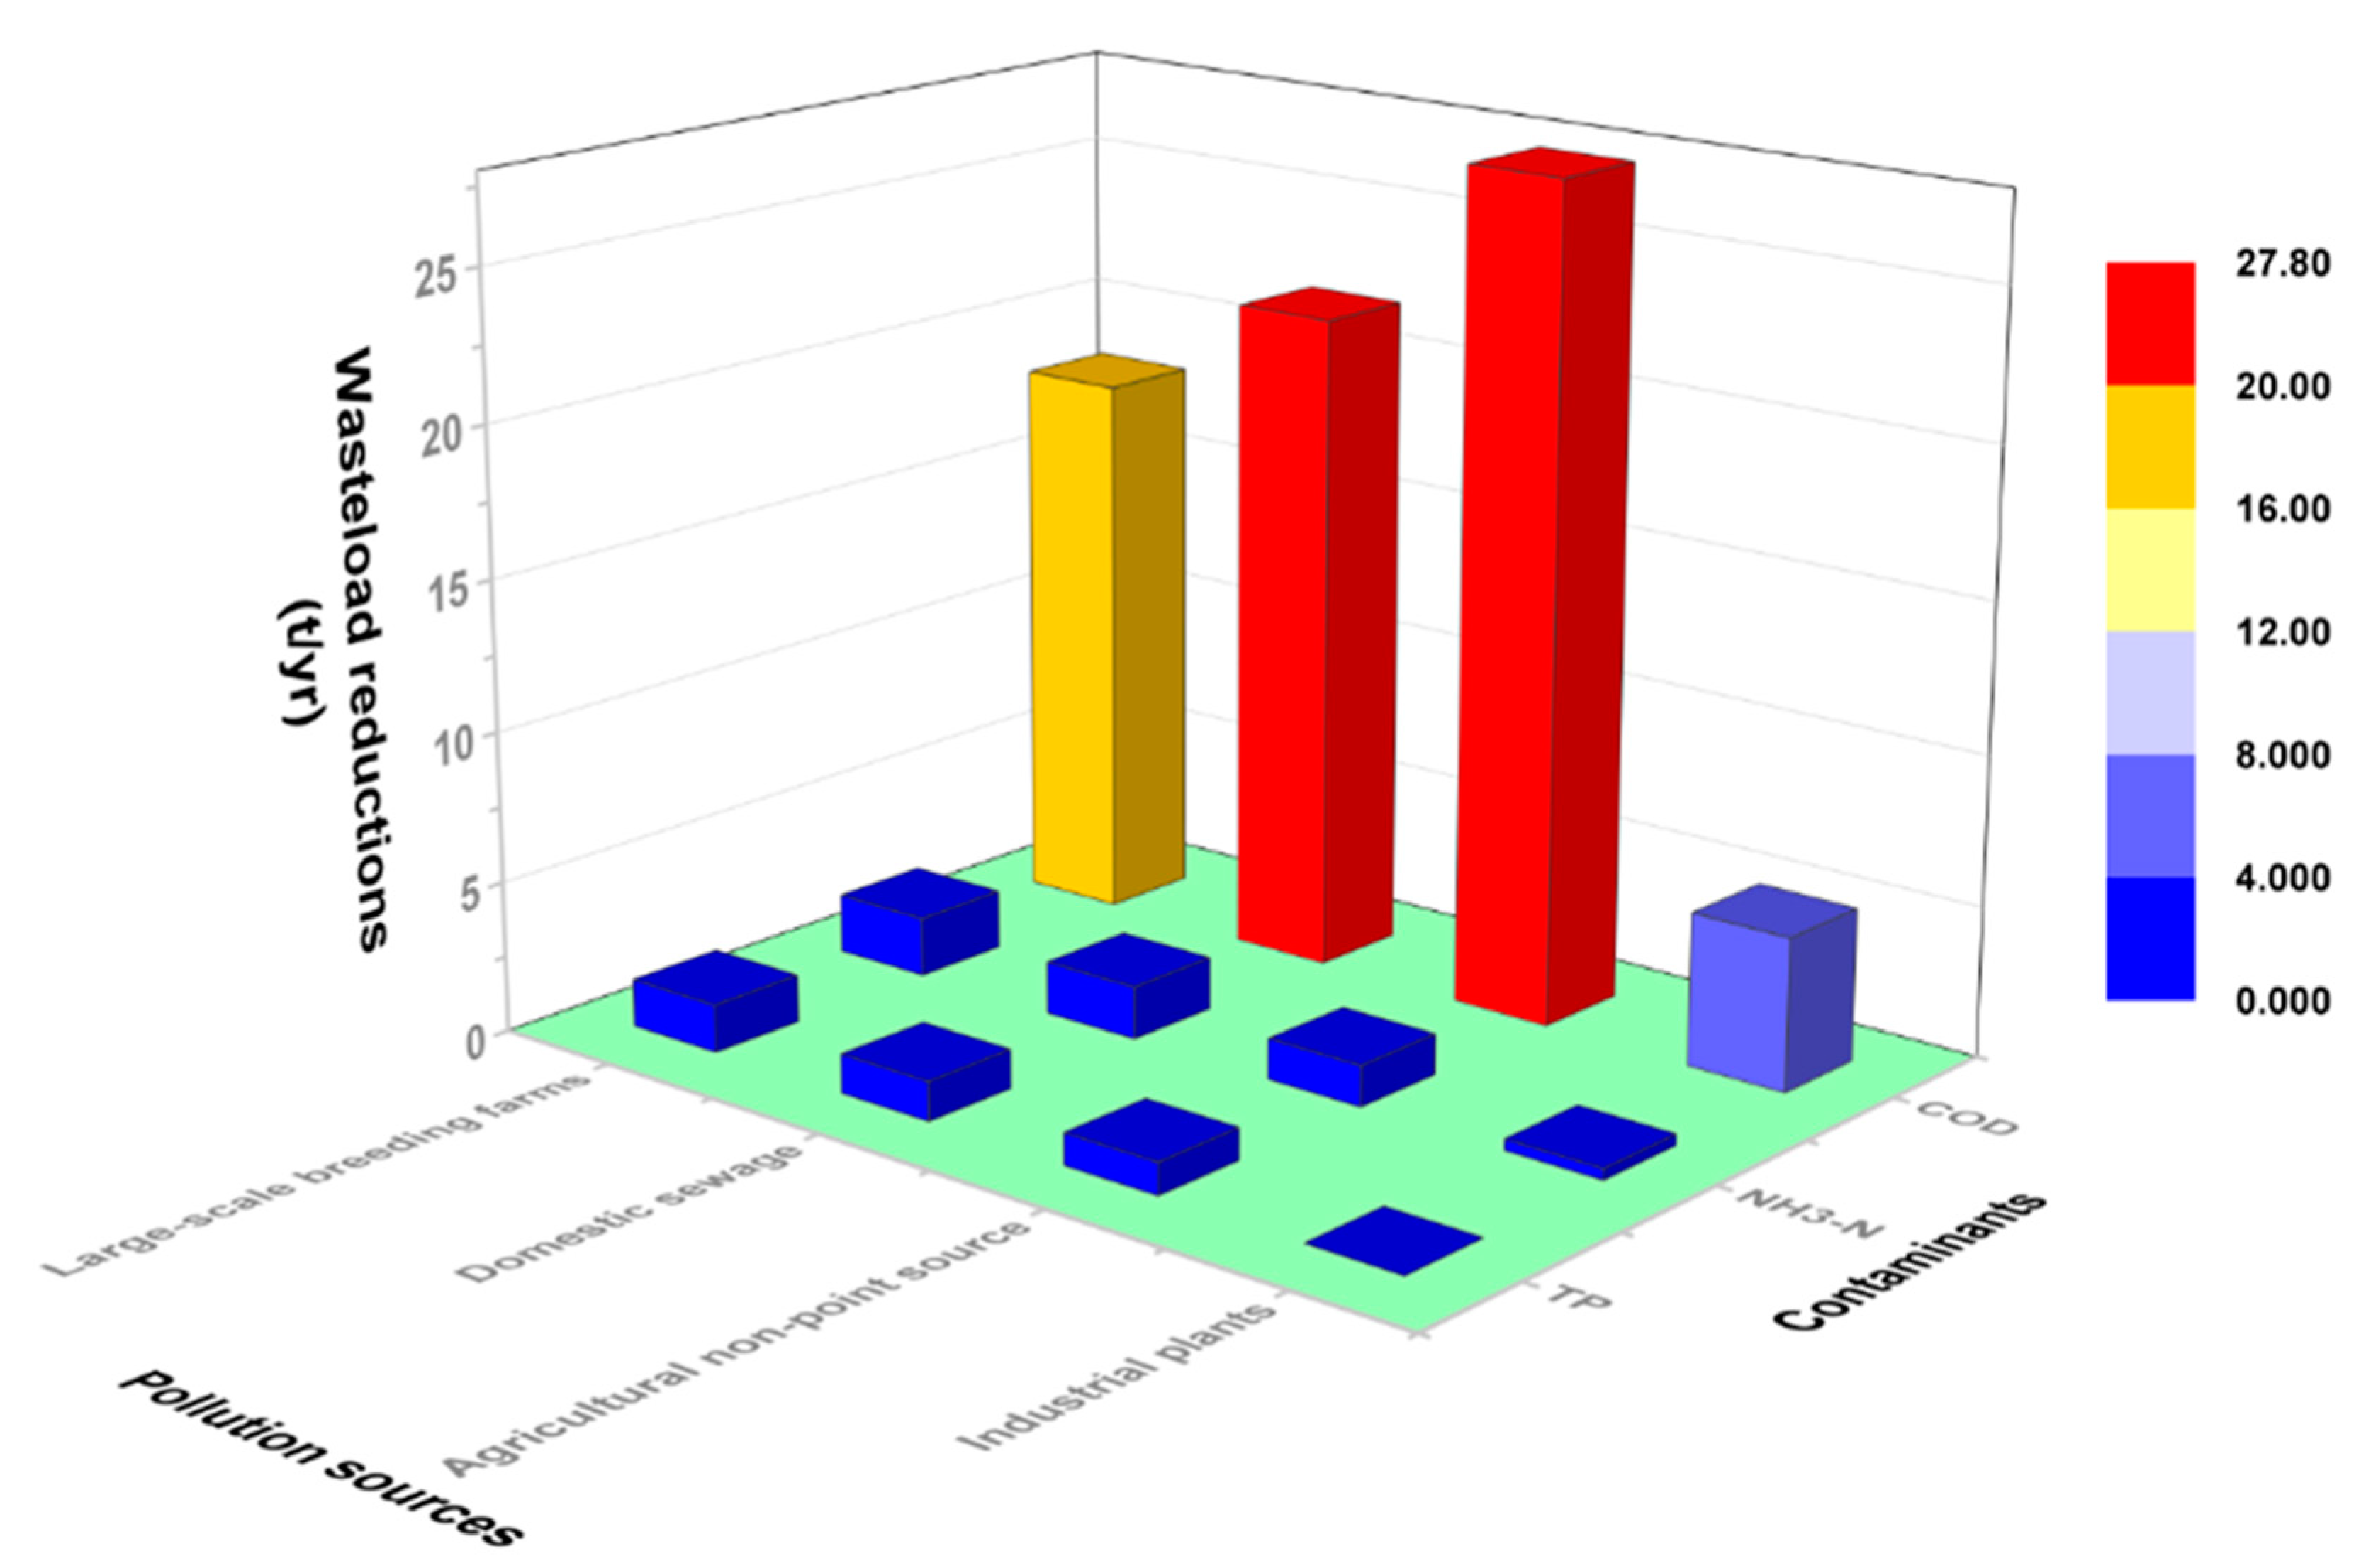
As shown in
Figure 5, the targeted pollutant removals and proportion of COD discharge in Jiangkou, Jinping, Yuelin, Dayan, and Shangtian were 198.09 t (12.39%), >72.91 t (2.74%), >43.25 t (2.55%), >15.91 t (4.04%), and >10.00 t (2.43%), respectively. Jiangkou (14.96 t) and Jinping (5.49 t) were the two districts with the largest NH
3-N reduction loads, which accounted for 11.61% and 2.73% of the total removal rates, respectively. A total of 11.41 t of TP pollutants needed to be reduced, of which the largest removal (proportion) was in Jiangkou, with 5.24 t and 20.22%, followed by Jinping and Dayan with 3.97 t (7.84%) and 0.63 t (5.36%), respectively. The removal rate of the remaining districts (Shangtian and Yuelin) were relatively low, and were both less than 4.00%, with removals of 0.50 t and 1.06 t, respectively.
The regional allocation results revealed that Jiangkou was significantly higher than other districts in terms of both load removals and proportion of the three pollutants. Part of the reason was the high in situ pollutant discharges in the district and part was the modes of social economic developments. Conversely, as the town with the lowest pollutant discharge per unit of GDP and population, Shangtian was granted a lesser quota both in removal and rate, as predicted by the model.
Interestingly, the towns with the largest pollutant discharges were not necessarily those with the highest proportions of removal quota because the allocation of a pollutant discharge quota at the regional scale considered all factors, including the region’s economic efficiency and social equality, not just the magnitude of the in situ discharge of pollutants. For example, although Jinping and Yuelin exceeded the in situ COD discharges of Jiangkou, it was assigned a lesser pollutant removal and proportion. This is probably due to the backward modes of social economic development in Jiangkou, such as less-developed domestic sewage networks and large areas of extensive agriculture, which resulted in higher discharges of pollutants per unit of GDP and population, compared with the other two towns.
4.1.2. EGCs Before and After Optimization
The EGC optimization models were used to calculate the EGC of each criterion among the districts (
Table 4) and draw the Lorenz curves before and after the optimization for the three pollutants.
Take the COD as an example, the EGC of population vs. COD in situ discharge is the smallest, at 0.162, and is within the reasonable range in WLA equity at the regional scale, indicating that the current distribution of COD discharge among districts is balanced according to population. The GDP-based EGC for COD in situ discharge among districts is 0.215, which keeps the COD discharge to the districts relatively reasonable in relation to local economy, but still has the potential for optimization. In particular, the greatest distribution inequity of COD discharge at regional scale occurs in the land area, with an EGC of up to 0.583, exceeding the warning sign of equity (0.400) [
6], suggesting that the current COD load discharge in the five districts does not match well with the land area indicator.
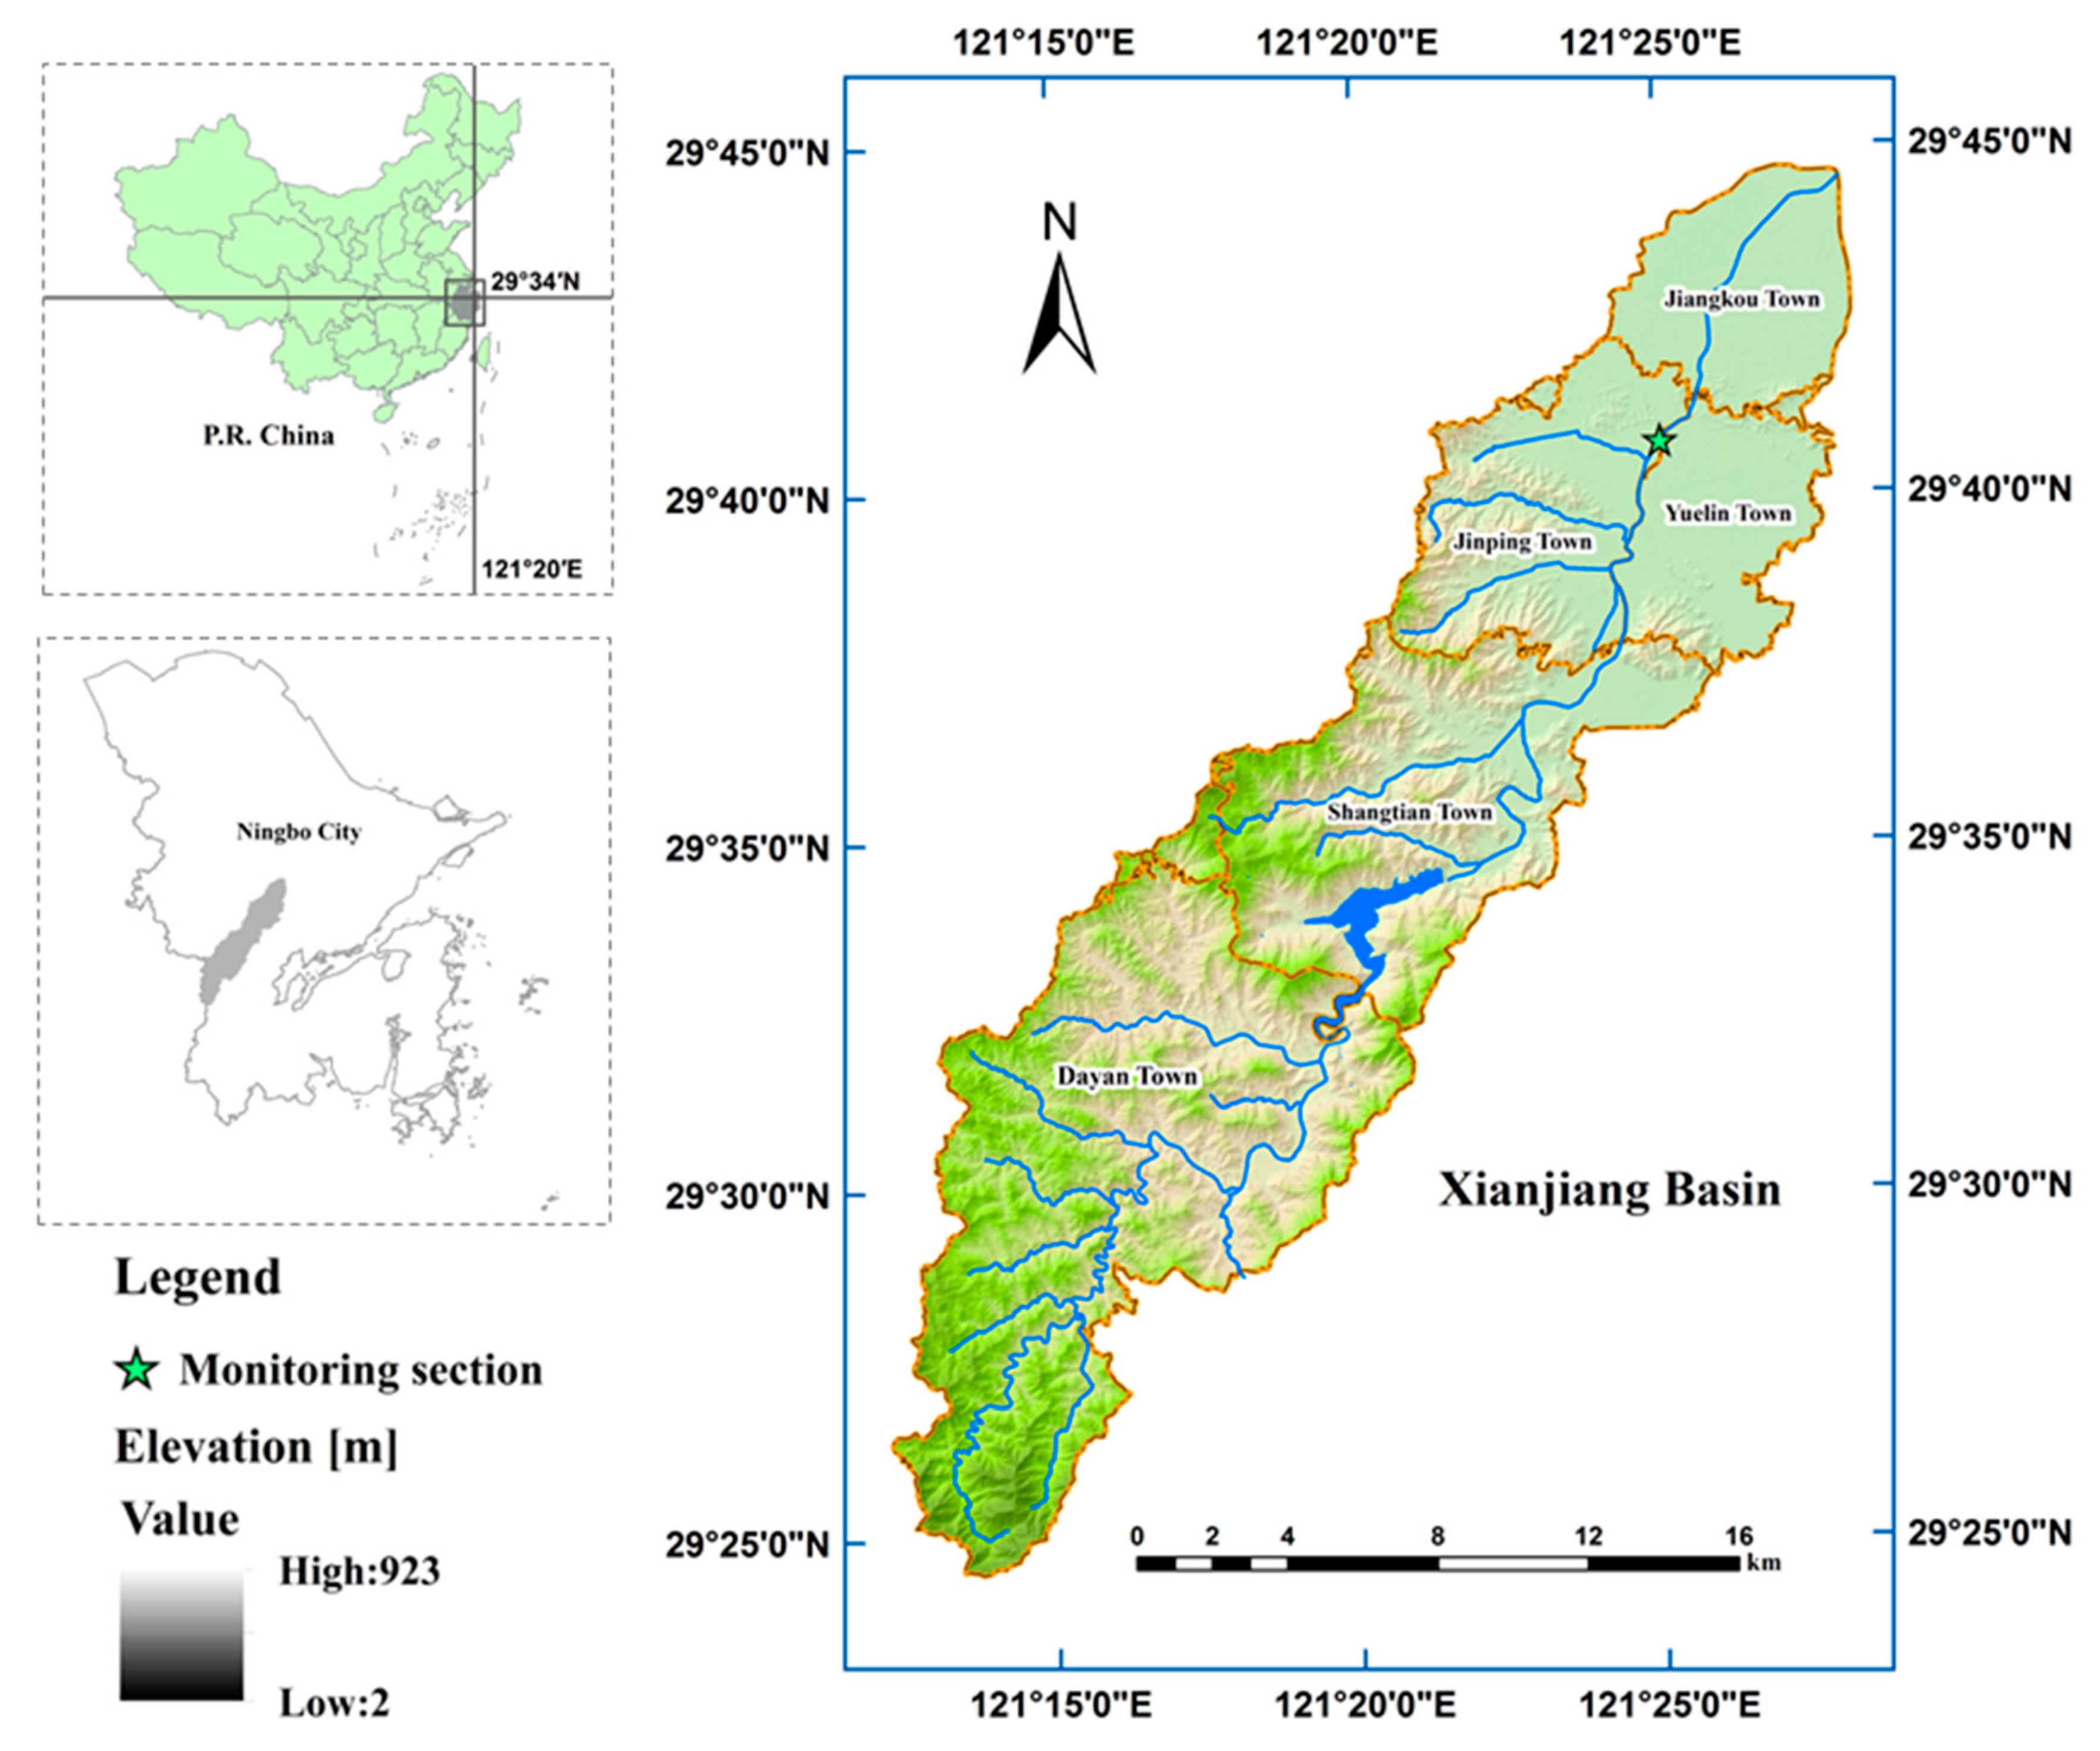
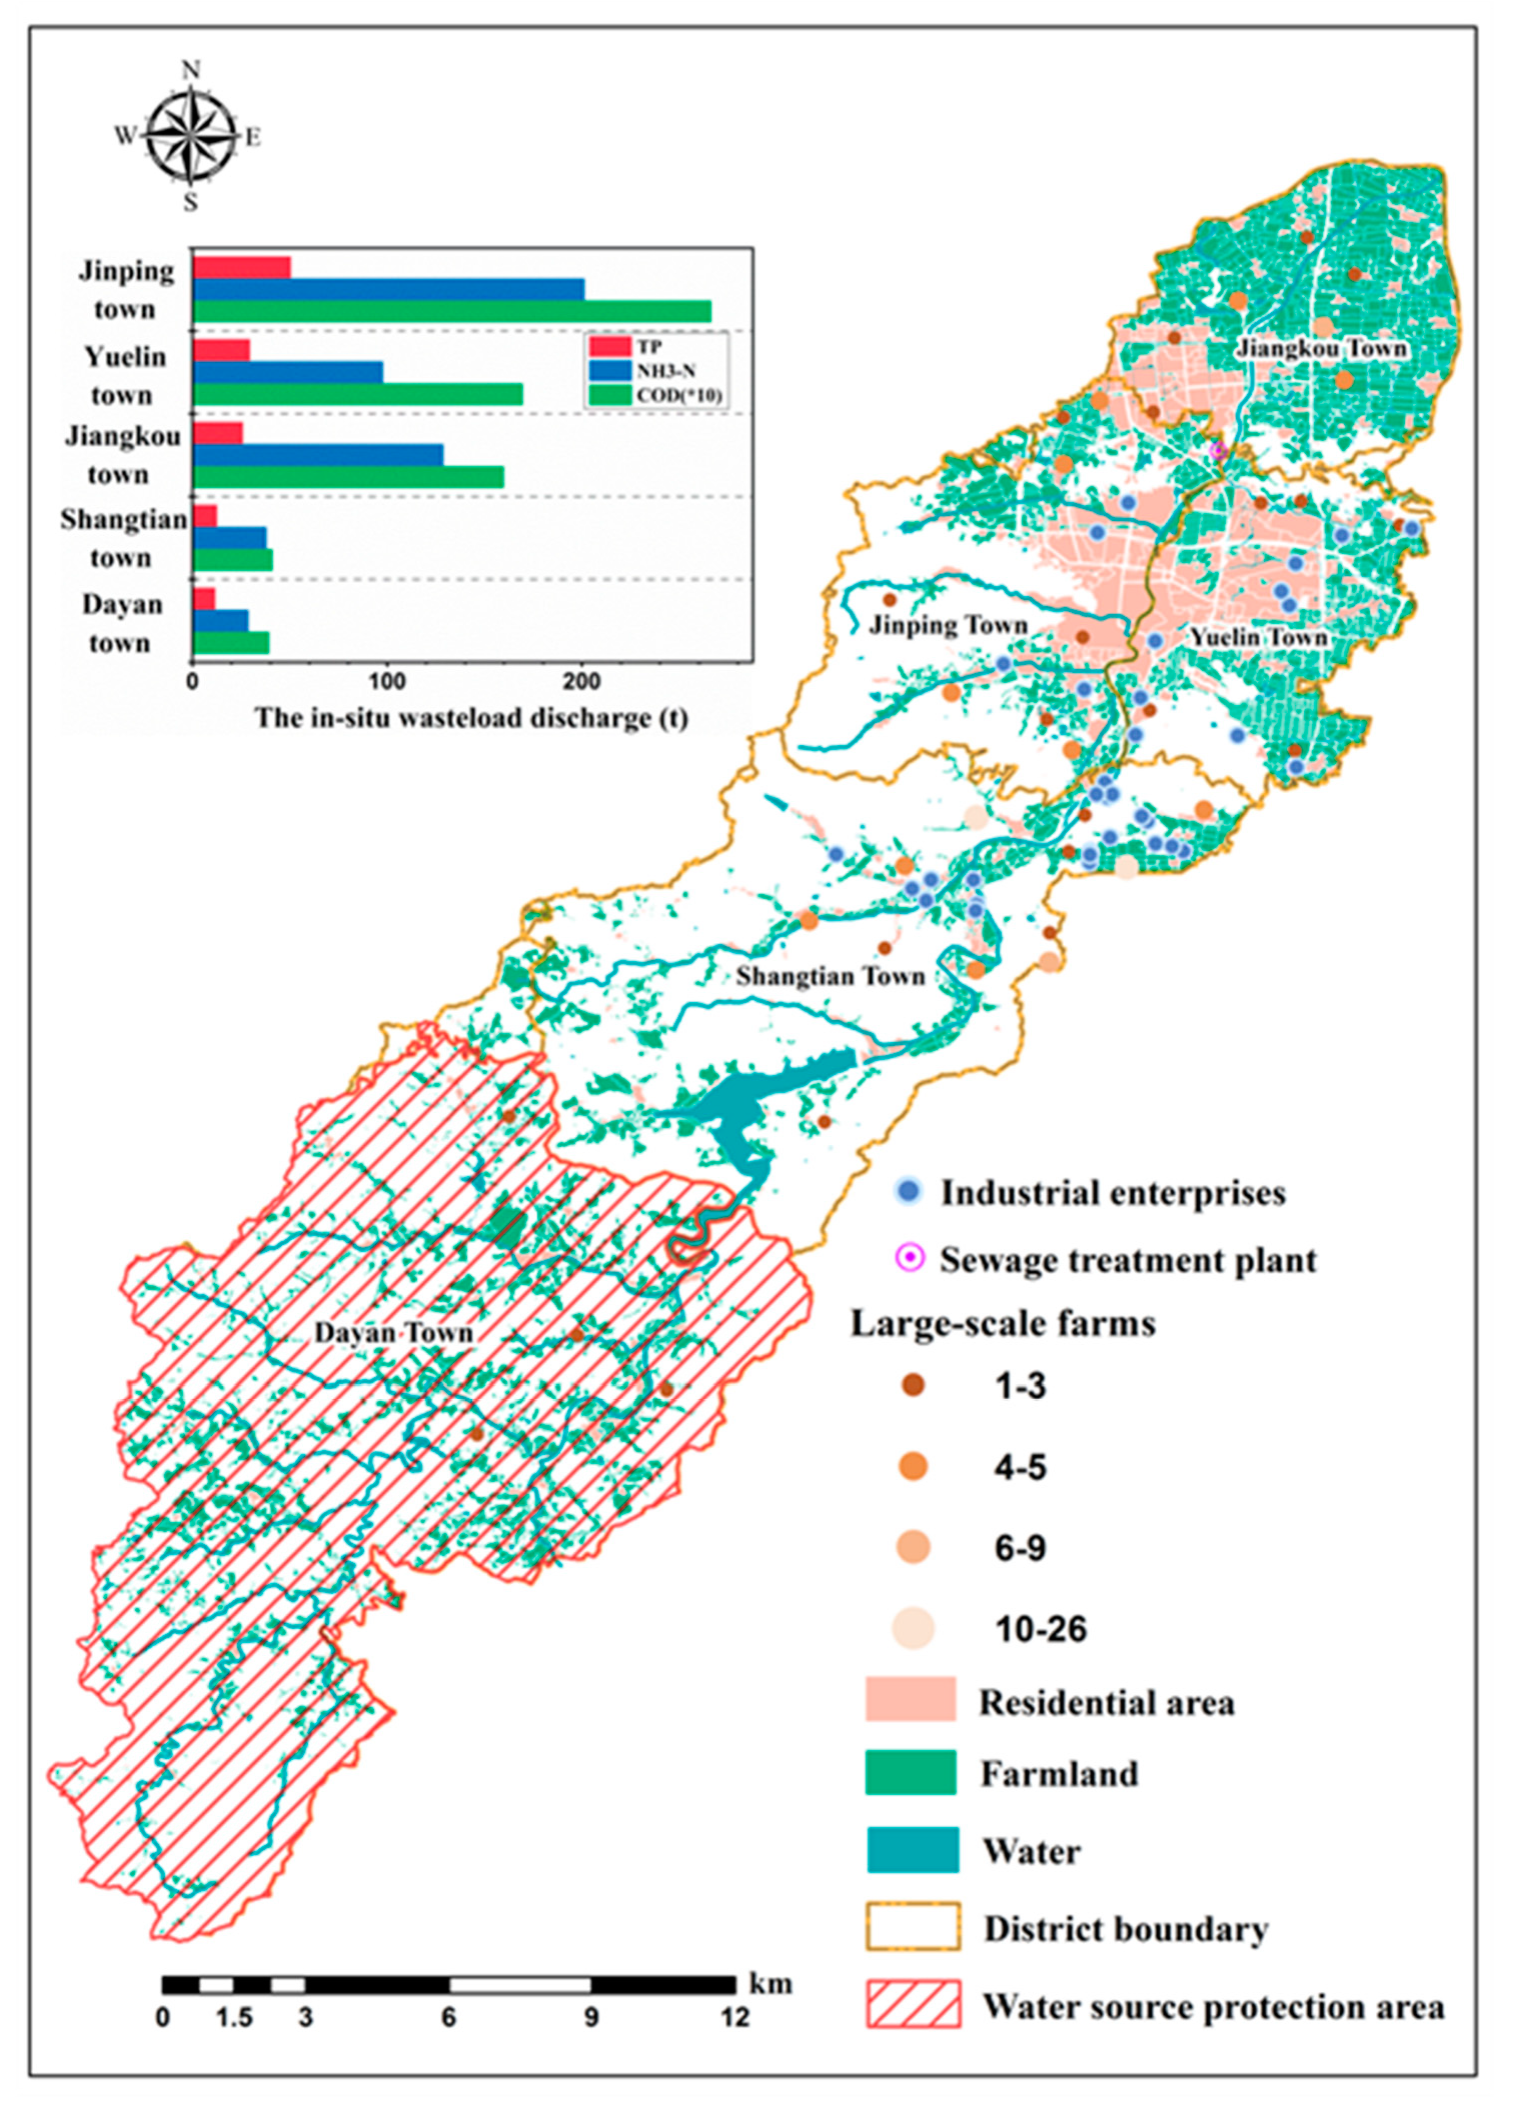
Interestingly, considering the geographical pattern of pollution sources and function regionalization in the watershed using ArcGIS (ver. 10.2) (
Figure 6), it can be further inferred that the high EGCs corresponding to land area are mainly imputed to Dayan town. This accounts for nearly half of the total land area (41.95%), but accommodates only little pollution discharge from pollution sources, making up only 5.82% (COD), 5.82% (NH
3-N), and 8.99% (TP) of the total pollutant discharges in the entire watershed. The situations of the other pollutants are similar to that of COD, having the same distribution pattern of EGCs for the equivalent criteria (
Table 4).
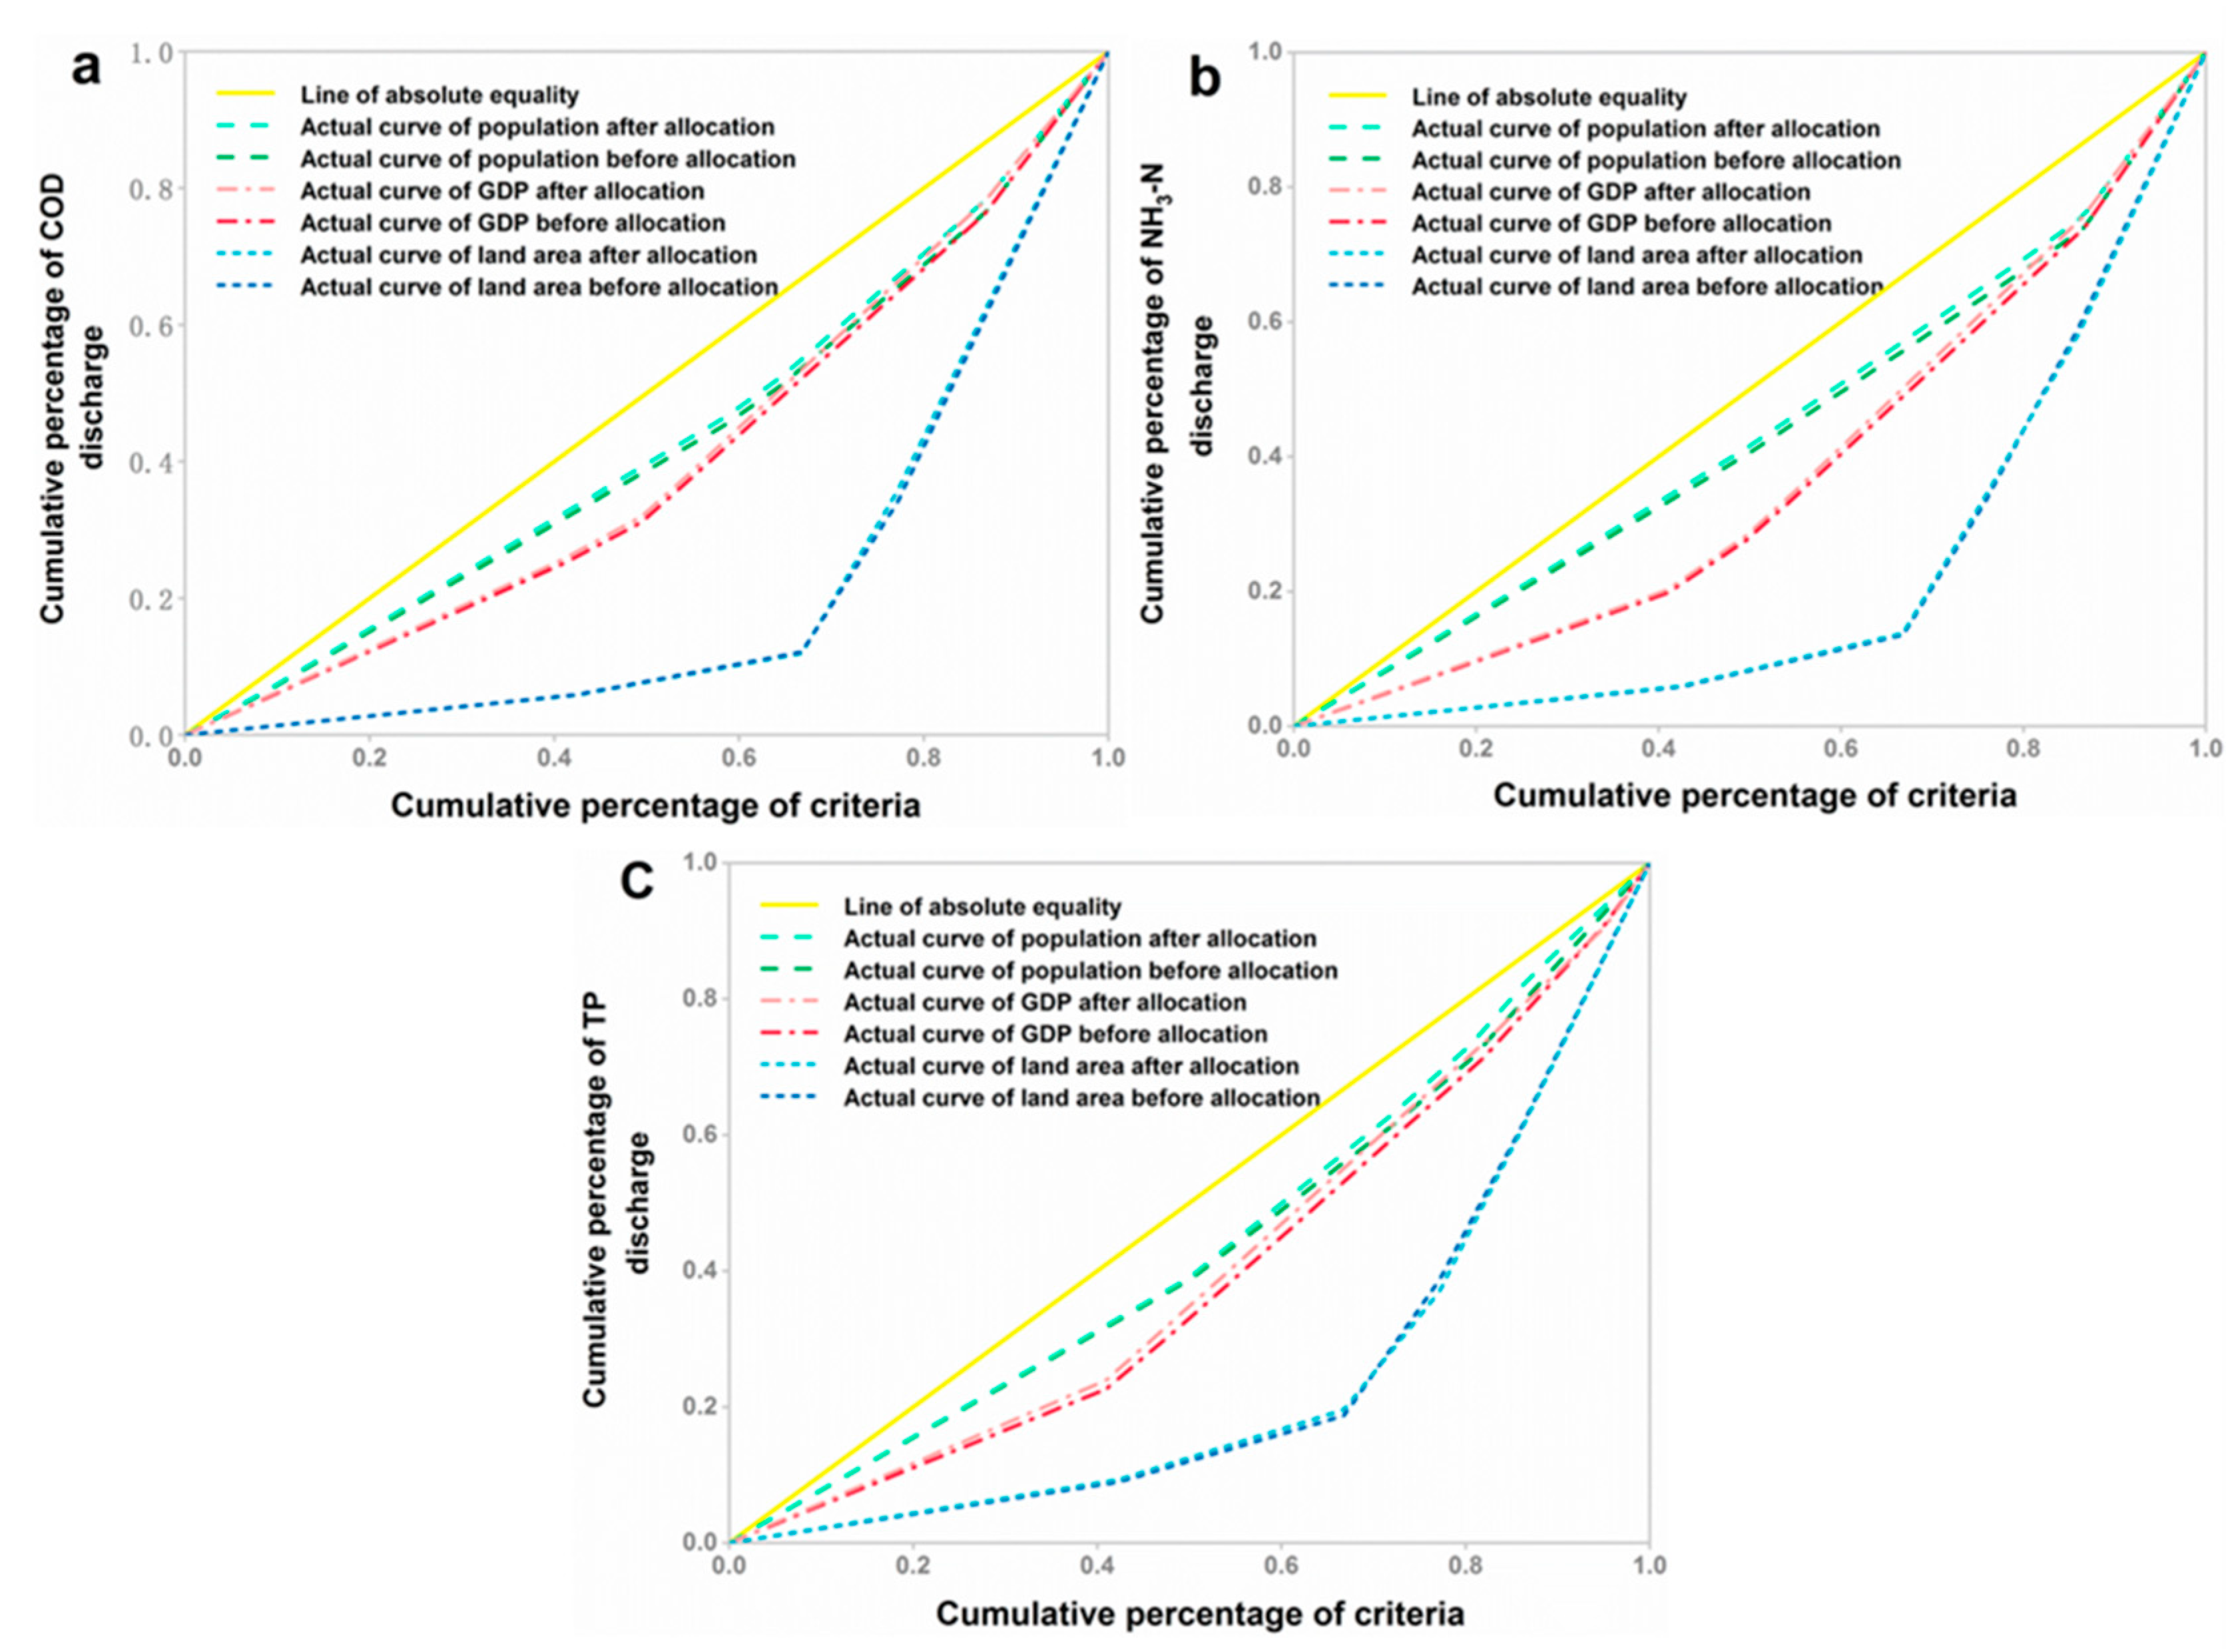
Table 4 and
Figure 7 highlight the decrement and amplitude of EGCs corresponding to the three criteria after optimization. Note that the EGCs of COD, NH
3-N, and TP after optimal WLA at the regional scale were all less than those of initial pollutant discharge, and the Lorenz curves after optimal allocation were closer to approaching the line of absolute equality. The results revealed that the optimal allocation of the removals at the regional scale brought more accordant and equitable responsibilities in relation to the districts’ respective shares of socioeconomic development, and the optimal allocation coordinated the pollutant discharge quota with the natural environment. In other words, a more equitable pollutant discharge quota at the regional scale was achieved after WLA optimization using the EGC models.
In view of the overall trends, as depicted in
Figure 7, it is noteworthy that the EGCs and the Lorenz curves do not change very much after the optimization. Two reasons can be identified as the cause, as follows: (1) The pollution discharge had been distributed to each district relatively equally according to the criteria, i.e., population and GDP, before optimization; and (2) there are upper and lower limits on the allocation of pollution removal to each district in order to be compatible with the local socioeconomic conditions. Considering the constraints in the EGC optimization models, the shape of the Lorentz curve can only be adjusted gradually to avoid an out-of-range affordability of removals for local managers, due to the tenacious struggle to decrease EGCs.
4.1.3. Factor Analysis
A contribution coefficient method was used to further determine the regional inequality factors referring to waste load in situ discharge vs. the criteria. The contribution coefficient, taking 1 as the threshold, is the contribution ratio of regional evaluation criteria to in situ pollutant discharge in a certain district, expressed as Equation (15) [
47], as follows:
where
represents the population contribution coefficient (PCC), the green contribution coefficient (GCC), and the land area contribution coefficient (LACC) with respect to the criteria
of population, GDP, and land area, respectively;
is the magnitude of criterion
in the
th district, and
is the sum of criteria
in the watershed;
is the pollutant in situ discharge of the
th district; and
is the total pollutant discharges in the watershed.
Table 5 provides the CCs of the three criteria at each district in the watershed. As shown, in 2015, the PCCs of COD, NH
3-N, and TP pollutants for Jiangkou were lowest in the region, with 0.56, 0.51, and 0.67, respectively. This is possibly due to the relatively undeveloped economic and living conditions, with some deficiencies in domestic sewage treatment systems. Moreover, the district with well-developed river systems and fairly fertile soil, an area in the plain river network of the lower Xian-jiang watershed, is the primary rice-growing area in the watershed (
Figure 6). Paddy fields make up as high as 83.2% of the whole area, leading to serious agricultural NPS pollution. In short, all these factors produced an increasingly incisive contradiction between the local population and the water environment, making this an unfair-factor district in terms of EGCs vs. population.
Yuelin town, with the highest economic level in the basin, contributed 41% to the total GDP and received the largest GCCs for COD (1.64), NH3-N (2.07), and TP (1.81). This indicated that the contribution rate of GDP to the entire region was more than that of pollution discharge in this district. It further revealed the advancements in the cleanliness of production processes and sewage treatment efficiency in this district. Although Yuelin exceeded two-fold the in situ pollutant discharges of Shangtian and Dayan towns, it was assigned to a lesser pollutant removal. In addition, the GCCs of Shangtian for COD and NH3-N also surpassed the threshold of the green contribution factor (1.00). Moreover, the GCCs of COD and NH3-N in Jiangkou, and TP in Dayan, both belonging to the less-developed areas, were less than the green contribution standard, with low values of 0.56, 0.51, and 0.54, respectively. It could be speculated that GDP output in these regions is characterized by high pollution and low efficiency, which are the main factors leading to the unfairness of WLA at the regional scale based on the GDP index.
Dayan town, referring to the criterion of land area, presented the largest LACCs among the districts for COD (7.28), NH
3-N (7.28), and TP (4.71), owing to its unique geographical location. In spite of vast expanses and richness in natural resources, the district is completely subject to the water source conservation area, leading to strict restrictions on local resident size and density, industrial development, and agricultural scale for the protection of drinking water security (
Figure 6). In contrast, the LACCs of the three pollutants in Jinping and Yuelin towns were all below the value of 0.50, revealing a heavy discharge of pollutants into the river per unit of land area in these districts.
Different from the PCC and GCC, the LACC is not as high as it could be when there is a low utilization of land resources. Thus, the high LACCs of Dayan town should be lowered accordingly. However, our results found that its specific geographical location (water source conversation area) makes it hard for the area to be adjusted by human intervention, such as demographic migration, industrial distribution adjustment, and land use and land cover conversion. The human-induced adjustment may result in the destruction of the original ecological environment and directly threaten the safety of drinking water, which would instead lead to an ‘inequity’ in WLA. Consequently, the high LACCs are acceptable in this particular water function division. At the same time, we urge the optimal allocation of removals at the regional scale with the assistance of geographic information system (GIS) technology.
Furthermore, to mitigate the polluted water more efficiently, targeting a specific area instead of a whole watershed has been recommended as a cost-effective method in many previous studies [
48,
49,
50,
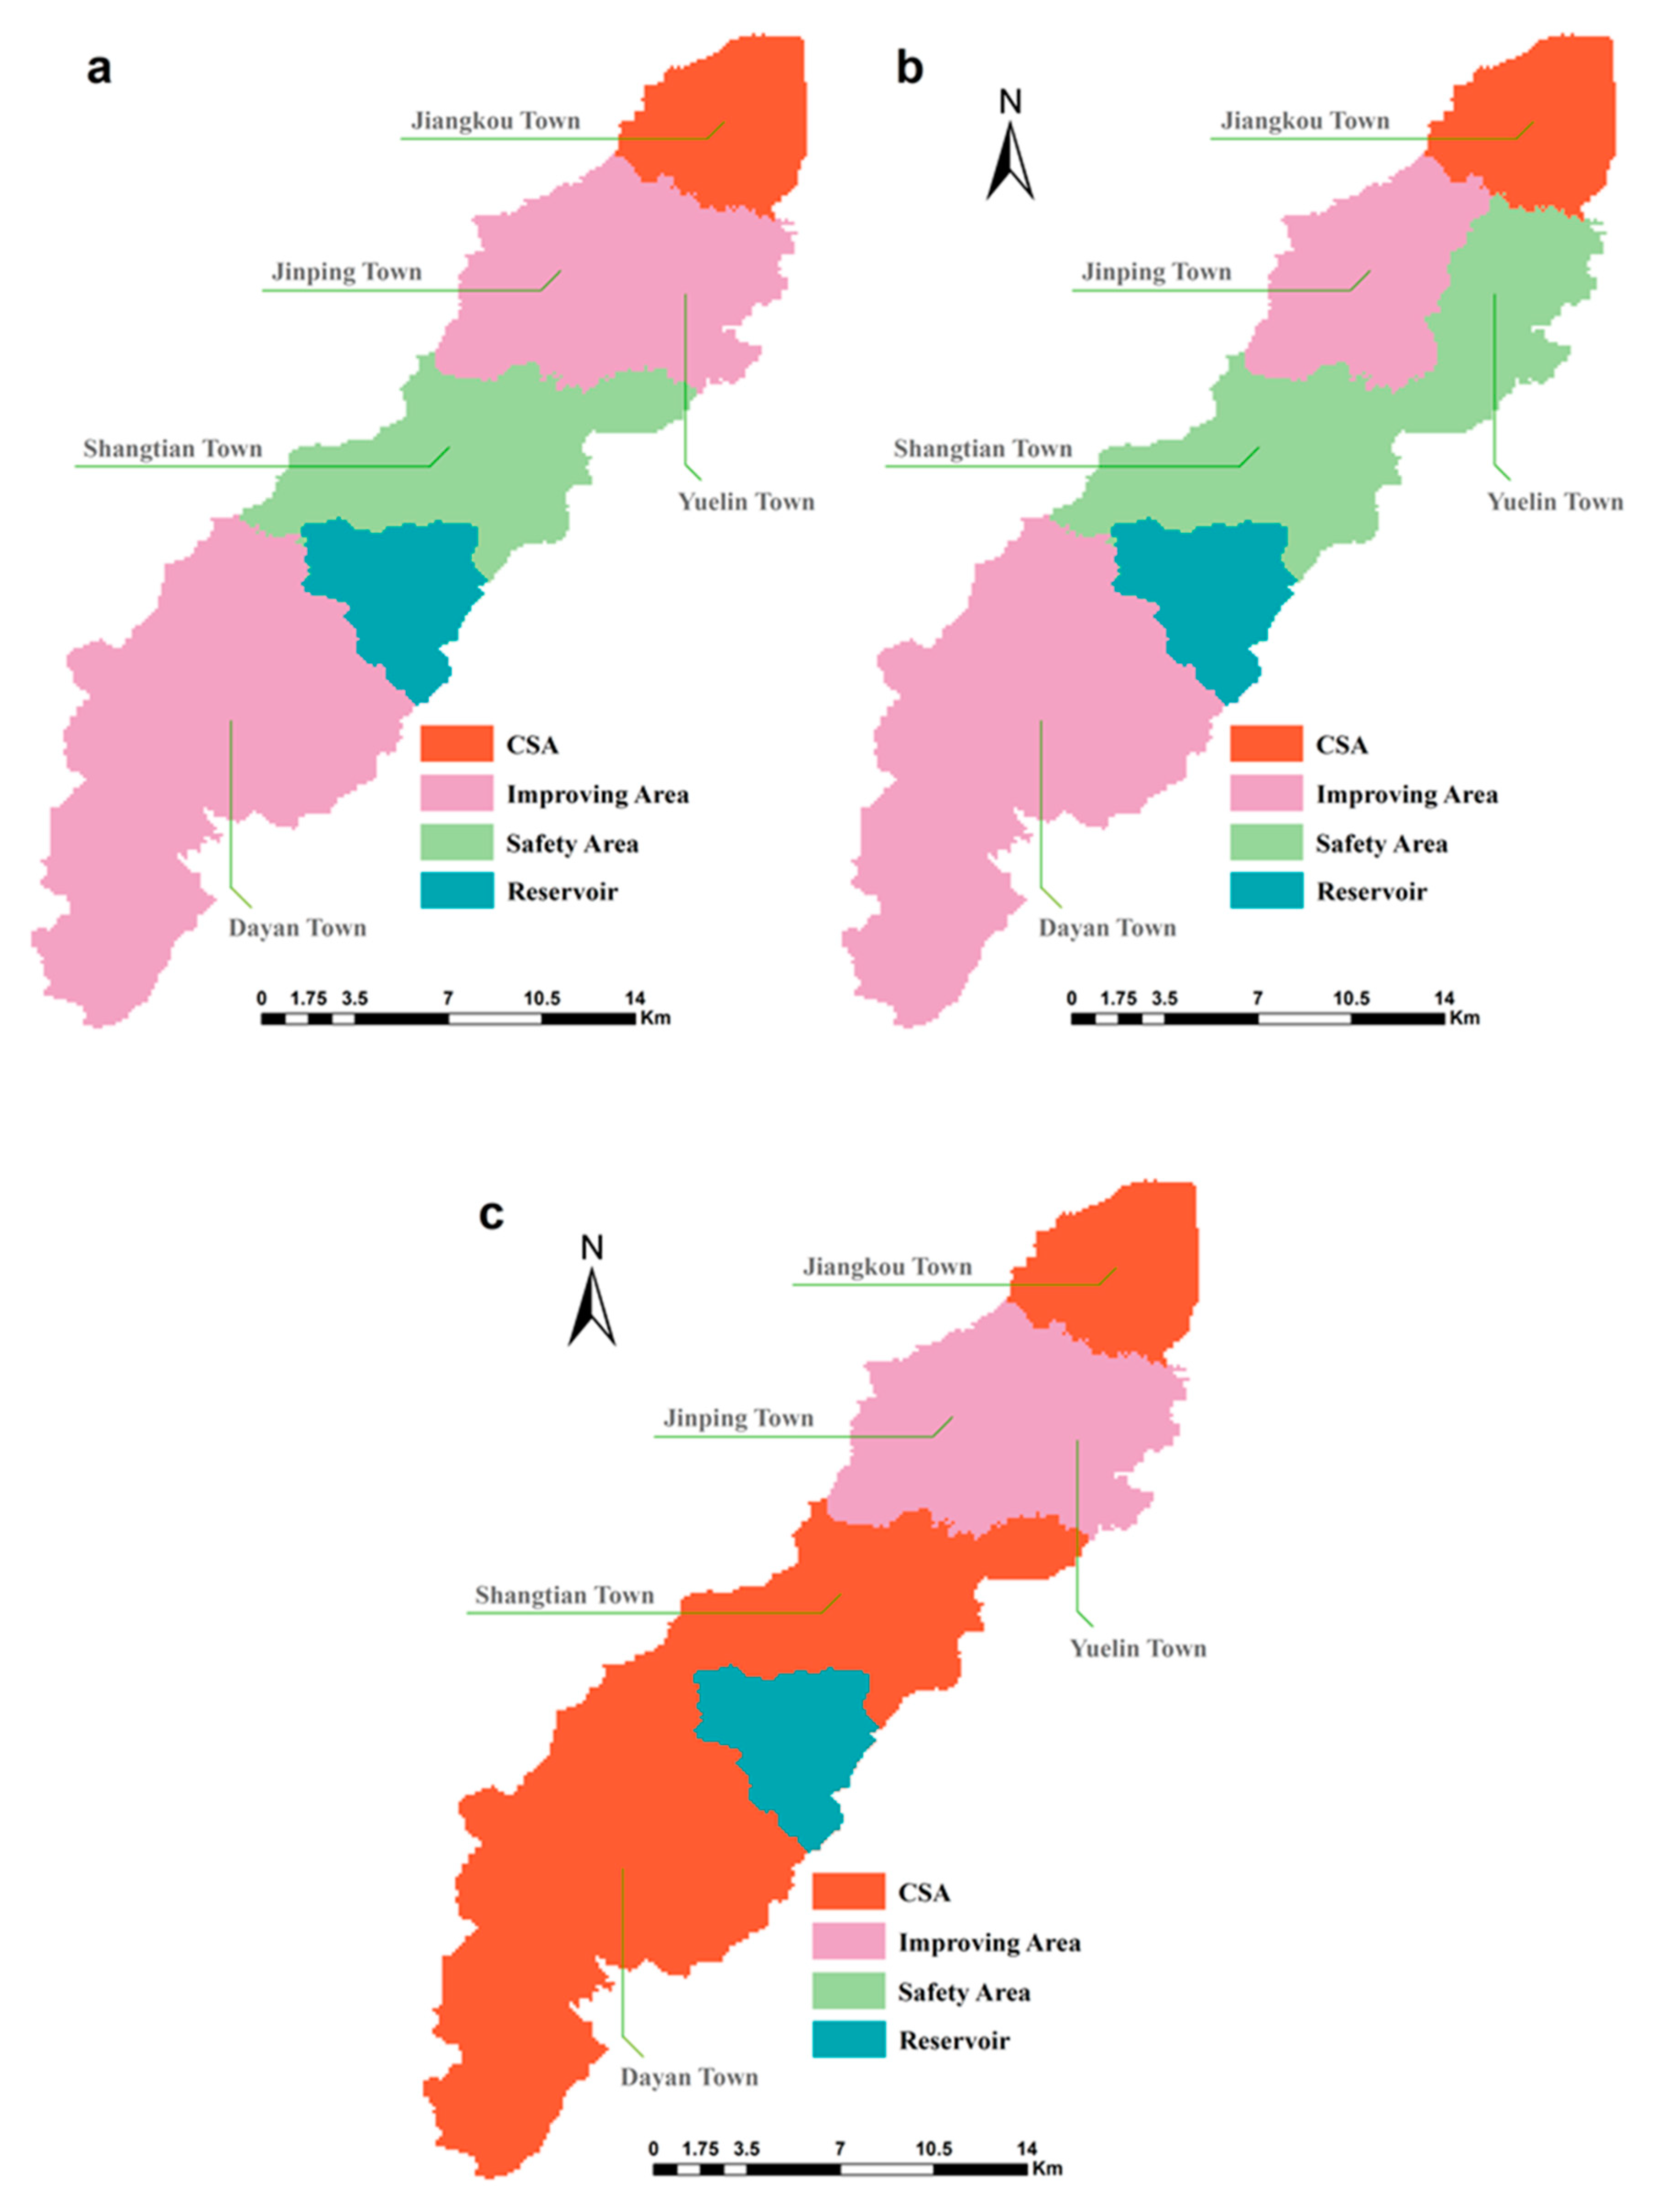
51]. Hence, the spatial zonation, in which the PCC and GCC were synthetically considered, into critical source areas (CSA) (PCC < 1, GCC < 1), improving areas (PCC < 1, GCC > 1 or GCC < 1, PCC > 1), and safety areas (PCC > 1, GCC > 1) among the five districts was performed by ArcGIS (ver. 10.2) (
Figure 8).
As seen in
Figure 8, both COD and NH
3-N have a similar pattern of unfair-factor districts, except Yuelin town. Among them, only Jiangkou town was identified as a CSA of unfair factors in the watershed, revealing that this area faces an acute contradiction between population, economic profit, as well as the water environment under per-unit pollutant discharges, and should be managed and controlled preferentially for the two pollutants. Hence, the EGC optimal models handed out the most discharge removals and highest proportions of the three pollutants to this district. Meanwhile, the fairness of the optimization allocation results of using EGCs models at regional level was further verified. Conversely, Shangtian town was characterized by having both PCC and GCC values of more than 1.00, and therefore belongs to the safety area, which exhibited a high-efficiency economic output with low consumption of WEC, while there was less impact of population scale on the water environment. In other words, with limited funds and manpower, environmental protection agencies can directly skip these regions in the total pollutant control process. Water environmental management in improving areas, which either have a high level of economic development but a sharp conflict between population and environment or are under a less stressful environment from per-unit population but have low environmental and economic benefits, should improve their deficiencies while maintaining the status level of superior contribution coefficients.
In particular, for TP, a significant difference was found for the grade distribution of unfair-factor districts compared with COD and NH3-N, in that all the five districts were identified as CSAs or improving areas, and CSAs accounted for a higher proportion of administrative units than with the other two pollutants, suggesting that the in situ allocation of the TP discharge quota at the regional scale should preferentially be improved.


