1. Introduction
The sustainability of a way of life is directly linked to the availability of water in many places around the world, especially in arid and semi-arid regions [
1]. Agriculture and, therefore, food production is a major user of water, and represents an opportunity for reducing consumption [
2]. The combination and interrelated environmental elements such as increasing population, climate change, land use change, and pollution have resulted in the scarcity of high quality water for human use and ecosystem sustainability [
3,
4]. Increasing urban demand for water is not only due to increasing urban population, but also to aging and inadequate infrastructure that can be addressed to some extent by management strategies, public policy, and infrastructure improvement for the distribution system, water treatment, and recycling of water [
5].
In agriculture, more efficient irrigation technologies would reduce water extraction and use, but could influence return flows and aquifer recharge [
6]. Xu [
7] reported on the influence of irrigated agriculture on food security, water security, and human well-being in Asia, as well as the importance of water footprint, water scarcity in specific geographic areas, and crop water productivity as indicators of sustainability. Pellicer-Martinez and Martínez-Paz [
8] reported that the 2016 rate of water use from aquifers in the Segura River Basin in Spain was not sustainable and neither was surface water pollution. They stated that the primary pollutant in their study was phosphate, which is supported by other studies [
9].
The importance of water availability and the need for increasingly effective water management strategies for nursery and greenhouse crops has been documented [
10]. A U.S. nursery industry survey found that producers face many challenges related to water availability, water quality, and potential governmental regulations [
11]. Container-grown ornamental crops require large inputs of nutrients and irrigation to produce an aesthetically acceptable product for consumers. Containers provide a relatively small reservoir for water, and substrates are designed to drain rapidly. Irrigation is commonly applied through overhead irrigation systems where over 80% of the applied irrigation could fall in inter-container spaces or leach out of containers and become subject to runoff [
12,
13,
14]. Due to these factors and other factors, efficient use of irrigation water in container-grown landscape plant production and the reduction or elimination of nutrients in water potentially leaving the property are important to nursery managers. Water scarcity footprint (WSF) is the weighted volume of water used from ground, surface, and/or any municipal sources to meet water requirements for the crop. Water scarcity is determined on a monthly basis for specific river basins. Methods for calculating monthly scarcity index (WSI) have evolved over the last decade [
15,
16]. These methods have been based on a water withdrawal-to-availability ratio or consumption-to-availability ratio [
17,
18,
19]. Pfister [
20] further asserted that water footprint does not have to reflect environmental impact, but that a spatially varying WSI should weight water consumption. Functionally, water withdrawal refers to the total amount of water withdrawn from a source, whereas water consumption refers to withdrawn water permanently lost from its source. The water footprint as part of a comprehensive life cycle assessment for a field-grown, 5 cm caliper redbud tree (
Cercis canadensis ‘Forest Pansy’) was calculated to be 0.642 m
3 using the Hoekstra method, 0.356 m
3 using the Pfister method, and 0.137 m
3 using the Boulay method [
21]. A comprehensive review of water scarcity footprint research by Quinteiro et al. [
19] indicated that there are still researchable questions related to methodologies of water footprint determinations.
The sustainability of water for nursery crop production can also be influenced by water quality and, more specifically, nutrients in irrigation return flow from container nursery surfaces. Phosphate and nitrate loss from systems through surface runoff after irrigation of container-grown plants have been reported [
22,
23,
24] Improving irrigation practices is one of the most effective methods for reducing runoff volume and associated nutrient movement [
22,
23,
24,
25]. Additionally, various methods have been shown to reduce nutrient contaminants in irrigation runoff from these systems [
14,
26,
27,
28,
29,
30,
31,
32]. However, few of these remediation practices have been implemented [
10], and thus it is important to be able to communicate the impact of nutrients on water resources to improve adoption of such practices. Water scarcity footprint analysis is an ideal method for this purpose.
The objective of this research was to determine the WSF as affected by different irrigation practices and their effects on the water dilution factor (WD) for the two components of irrigation return flow: surface runoff and subsurface infiltration through production surfaces in a nursery. Reducing the amount of irrigation applied can limit the water required in the system, while concomitantly limiting the amount of contaminated water exiting the system that requires treatment. Assessing the water footprint of different irrigation practices can allow water resources to be managed more judiciously, as nursery growers are tasked with improving their water use efficiency.
2. Materials and Methods
Experiments were conducted in 2017 and 2018 to assess the impact of irrigation delivery method and management protocols on several production parameters, including consumptive water use (CWU), WD, and, consequently, WSF. Superimposed across the irrigation regimens in the 2017 experiment were two fertilizer treatments varying in phosphorus content. In the 2018 experiment, the impact of a different set of irrigation regimens, but including the control treatment from the previous year, were assessed. Two substrate treatments were included across the irrigation regimens in 2018.
2.1. Experimental Nursery
The experimental nursery was constructed at the Michigan State University Horticulture and Teaching Research Center (HTRC) in Holt, MI (Latitude 42.67 N, Longitude −84.48). The experimental raised beds were arranged in two parallel rectangular blocks measuring 61 × 7.62 m each, with the long sides running north to south and separated by a 1.8 m alley (
Figure S1). Each rectangular block was divided into eight individual 7.62 × 7.62 × 0.6 m (length × width × height) beds for a total of 16 experimental beds.
Native soil inside the raised bed walls was graded to achieve a 2% slope towards a center swale, funneling water to the outer eastern or western edge, respectively, of the individual beds in the two rectangular blocks. After the soil base was graded, a 9.1 × 9.1 m impermeable ethylene propylene diene monomer pondliner (Firestone Pondgard 45Mil (1.14 mm) Nashville, TN, USA) was placed over each bed. Over the top of the pond liner, 0.3 m of washed natural sand, free of clay, with a particle size range of 0.75–9.5 mm was placed and graded in the same manner as the soil sub-base and covered with a black woven polypropylene landscape fabric (De Witt SBLT6300, Sikeston, MO, USA). Bulkhead fittings were installed at the low points of the soil sub-base/pond liner and sand/fabric, respectively, and piped to 378 L polyethylene tanks (Duracast, manufacturer number 900100-1.2, Lake Wales, FL, USA) via 4.03 cm inside diameter (i.d.) schedule 40 PVC for the collection of surface runoff and infiltration water. Collection tanks were buried 15.2 cm below the soil level and anchored in place with concrete.
2.2. Irrigation Installation
Each of the raised beds was fitted with a 150 mesh inline filter (Toro T-ALFS75150-L, Bloomington, MN, USA), a 30 psi pressure regulator (Senninger PRL303F3F, Clermont, FL, USA), a flow meter (Badger Meter 62585-001 model 25, Milwaukee, WI, USA), and two solenoid valves (Rainbird CP075, Asuza, CA, USA). Irrigation was applied via either overhead sprinklers (Toro 961 P-120 in 2017, K-Rain RN300-Adj (Riviera Beach, FL, USA) in 2018, or individual container spray stakes (Netafim 22500-002030, flow rate 12 Lph, Tel Aviv-Yafo, Israel). Overhead sprinklers were located at the corners of beds to irrigate a 6.1 × 6.1 m section within the larger 9.1 × 9.1 m area, whereas spray stake irrigated beds had a manifold consisting of four 6.1 m sections of polyethylene tubing adjacent to plant rows, providing water for the spray stakes for individual containers.
2.3. Irrigation Control and Sensor Installation
Irrigation was managed with a wireless sensor and control network using Sensorweb software (Mayim LLC, Pittsburgh, PA, USA), with the computer and communication devices installed in the main building of the HTRC. Solenoid valves were controlled via direct current (DC battery) powered control nodes (model NC24, Decagon Devices, Inc., Pullman, WA, USA), with each node controlling four beds. Nodes were installed on the western raised beds and oriented towards the communication devices in the HTRC building. Substrate moisture content was monitored using moisture sensors connected to monitoring nodes (model 10HS and model EM50R, respectively, Decagon Devices, Inc.), where each bed had one monitoring node and four moisture sensors set to take measurements at 5 min intervals. Sensors were randomly assigned to one plant per taxa per bed and placed halfway between the top and bottom of the container.
2.4. Plant Material and Substrate
Each individual raised bed (replicate) had a total of 81 plants, split between four taxa, and produced in 10.2 L containers. Common nursery plants with similar irrigation requirements were chosen as representative plants [
22,
23,
33]. In 2017,
Cornus obliqua ‘Red Rover’,
Hydrangea paniculata ‘Limelight’,
Physocarpus opulifolius ‘Summer Wine’, and
Weigela florida ‘Midnight Wine’ were used; whereas, in 2018
Cornus sericea ‘Farrow’,
Hydrangea paniculata ‘Limelight’,
Rosa x ‘Meipeporia’, and
Spiraea japonica ‘SMNSJMFP’ were used (Spring Meadow Nursery, Grand Haven, MI, USA). Plants were grouped by species, and the order in which they were placed on the beds was randomly assigned. One substrate was used for all plants in 2017, a pine bark:peat moss blend (85:15 v/v); whereas in 2018, that same substrate was compared with a pine bark:coconut coir mix (80:20 v/v) (Renewed Earth, Otsego, MI, USA). The three control replications in 2018 used the pine bark:peat moss substrate, whereas three of the six daily water use replacement (DWU) and spray stake replications were randomly assigned either the pine bark:peat moss or the pine bark:coconut coir substrate, respectively.
2.5. Irrigation Treatments
Three irrigation regimens were used in the 2017 study (17 May to 22 September)—a control of 19 mm applied daily via overhead irrigation, spray stakes applying 2 L per container daily, and spray stakes applying water on the basis of substrate moisture content (0–2.4 L per container per day) in order to return to container capacity. Container capacity refers to the percentage of water in a substrate after free drainage has occurred [
34]. Container capacity for pine bark-based substrates have typically been reported between 45% and 65% by volume [
35]. Irrigating on the basis of substrate moisture content is a management practice that may allow for improved water use efficiency through applying water on an as-needed basis determined by measured volumetric water content in substrates and precluding over irrigation [
21,
24,
26].
Irrigation commenced daily at 8:00, with the overhead irrigated beds active for 1.5 h to apply the 19 mm. Following overhead irrigation, the daily spray stake treatment was active for 10 min from 9:30 to 9:40. For the beds irrigated using substrate moisture content, water was only applied in the event that the average of the four 10HS sensors in a given bed were below 35% volumetric water content (estimated container capacity −10%). The window for irrigation for sensor-controlled beds to be irrigated was from 9:45 to 10:15, with up to three alternating intervals of 4 min of active irrigation and 6 min off to allow substrate moisture readings to occur. Irrigation treatments were randomly assigned to each bed, with three beds serving as the control, six beds being used for the daily spray stake treatment, and six beds for the sensor-based treatment. One bed was left to serve as a blank, where 19 mm d−1 of overhead irrigation was applied to a bed without plants.
In the 2018 study (11 June to 11 October), a control of 19 mm applied daily via overhead irrigation was again used, as well as two treatments irrigating on the basis of substrate moisture content, one applying water via overhead application and the other using spray stakes. Container capacity was assessed for each of the beds prior to treatment initiation in 2018, with beds irrigated via overhead sprinkler intended to reach container capacity −5%, and beds irrigated via spray stakes to return to 100% of container capacity. Measured container capacities of the pine bark:peat moss (85:15 v/v) substrate was 38%, whereas it was 37% for the pine bark:coconut coir (80:20). For the overhead irrigated beds based on container capacity, up to 19 mm was applied over three 6.33 mm cycles, with 5 minutes elapsing between each cycle to allow for moisture sensor readings. Similarly, the spray stake beds irrigated on the basis of container capacity would irrigate up to three 1 L cycles, with five minutes between each cycle for moisture sensor readings. Irrigation commenced at 9:00 for control treatments, with both container capacity treatments beginning at 10:00. In 2018, the sensor in the Hydrangea paniculata was used as the sole basis for the DWU and spray stake treatments. Irrigation treatments were randomly assigned to each bed, with three beds serving as the control, six beds being used for the overhead DWU treatment, and six beds for the spray stake sensor-based treatment. Again, one bed was left to serve as a blank, where 19 mm d−1 of overhead irrigation was applied to a bed without plants.
2.6. Fertilizer
For the 2017 season, fertilizer was applied the preceding fall on 27 September 2016. Each bed for either the daily spray stake or sensor-based spray stake treatment was randomly assigned one of two controlled release fertilizers with micronutrients (5–6 months release at 26.7 or 21.1 °C, Polyon Reactive Layers Coating, Harrell’s Inc., Lakeland, FL, USA), receiving either 38 g per container of a 19% N – 2.16% P – 6.64% K or a 19% N – 1.62% P – 6.64% K. The three control irrigated beds all received 19% N – 2.16% P – 6.64% K fertilizer, whereas three of the six beds for both the daily and sensor-based spray stake treatments received either the 19% N – 2.16% P – 6.64% K or the 19% N – 1.62% P – 6.64% K fertilizer. Fertilizer was uniformly applied to each of the 81 containers per bed via topdressing for a per-bed application rate of 3078 g.
The 2018 season utilized one fertilizer rate for all beds, a 17% N – 3.24% P – 9.96% K formulation with micronutrients (5–6 month release, as above). Each of the 81 plants per bed received 61.4 g of fertilizer applied via top-dressing for a per-bed application rate of 4973 g. Fertilizer was applied on 11 June 2018.
2.7. Sampling Events and Calculations
Samples used in the assessment of grey water footprint occurred on days with less than 12 mm of precipitation. The number of sample events used in assessing the runoff volume, infiltration volume, and nutrient concentrations is displayed in
Table 1. Sample data were not available for October 2018.
2.8. Sampling Protocol
Collection tanks were emptied 24 h prior to collection dates to allow the accumulation of infiltration water over a full day, and for runoff generated in response to an irrigation event. The height of the water in the collection tanks was measured using a meter stick and converted to liters on the basis of tank dimensions in order to quantify the amount of runoff and infiltration water per bed. A sump pump with a hose attachment was inserted into the tank and allowed to run for 10 sec prior to sample collection in a 950 mL glass amber bottle (Qorpak GLC02164, Clinton, PA, USA). An 8 mL sample was then drawn into a 10 mL leur lock disposable polypropylene/polyethylene syringe, plunged through a 0.2 μm polyvinylidene fluoride filter into a 10 mL polystyrene Dionex vial (Thermo Fisher Scientific, Waltham, MA, USA), and stored at −18 °C until analysis. The same process for nutrient sampling was implemented in the second study; however, the addition of 5 µL of anhydrous acetic acid was added to acidify the sample to reduce precipitate formation.
The 8 mL samples were thawed and analyzed for ammonium (), nitrate (), nitrite (), phosphate (), potassium (), calcium (), and magnesium () concentrations using dual ion chromatography. Anion concentrations were determined at 30 °C using an ICS-2100 gradient ion chromatograph (IC) system equipped with a hydroxide eluent generator cartridge, MFC-1 trap column, AG19 guard column, and an AS19 4 × 250 mm (i.d. × length) anion-exchange column (Thermo Fisher Scientific, Waltham, MA). Cation concentrations were determined via ICS-1600 at 35 °C using a CG12A guard column and CS12A 4 × 250 mm (i.d. × length) cation-exchange column with sulfuric acid eluent (Thermo Fisher Scientific, Waltham, MA, USA). Each system received the sample from an autosampler (Dionex model AS – AP) to a 25-µL sample loop driven by an isocratic pump. Nutrients were analyzed with a minimum detection limit of 0.19 mg L−1.
2.9. Calculating Water Scarcity Footprint
This water footprint assessment was conducted as a non-comprehensive determination as defined by ISO+14046-2014 [
36] as a WSF. The volume of water pumped to the crop through the irrigation system during production from streams, municipal sources, and underground stores was measured empirically in this study and referred to as monthly irrigation water applied (IWA) for each set of treatments. The concentration of nutrients leaving the system must meet certain standards. If the concentration of the runoff is above these standards and released, this represents a demand on water resources. The volume of water being demanded to bring this runoff to water quality standards is water dilution factor (WD). Therefore, monthly consumptive water use (CWU) was defined in this study with two components, CWU for irrigation water applied (CWU
iwa) and CWU to meet dilution requirements (CWU
wd). WSF was the total volumetric CWU required to produce a landscape plant weighted temporally and geospatially by the water scarcity indices calculated using monthly withdrawal-to-availability scarcity index for this river basin [
37]. The index is calculated on a monthly basis, as water withdrawal and availability change throughout the year due to seasonality of precipitation and demand [
38]. The research reported here was conducted in Holt, MI (latitude 42.67 and longitude 84.48), which is within the St. Lawrence River watershed. To determine the WSF of irrigation water applied (WSF
iwa) the unweighted CWU
iwa was calculated as the total irrigation water applied in the production system each month for the modeled length of production. The fertilization treatments in the 2017 study and the substrate treatments in the 2018 study would not affect CWU, and these data were clasped into the irrigation treatments for CWU calculations. The CWU
wd was calculated on the basis of the concentration of
and
in the runoff and infiltration water for each month, and reflected the dilution requirements to lower their concentrations to limits for tap water, which were set as 10 mg L
−1 [
39] and 0.05 mg L
−1 . The WSF of water requirements for dilution (WSF
wd) was calculated using the unweighted CWU
dw each month of the modeled length of production. There is no U.S. national standard for
in tap water, however, 22 states in the United States have set standards and guidelines that generally range from 0.05 to 0.1 mg L
−1 [
40]. The dilution requirements would be established by the nutrient requiring the greatest dilution to meet standards. The monthly WSF was determined by weighting monthly CWU
iwa and CWU
wd for treatments in each year using withdrawal-to-availability water scarcity indexes to yield WSF
iwa and WSF
wd [
16].
3. Results and Discussion
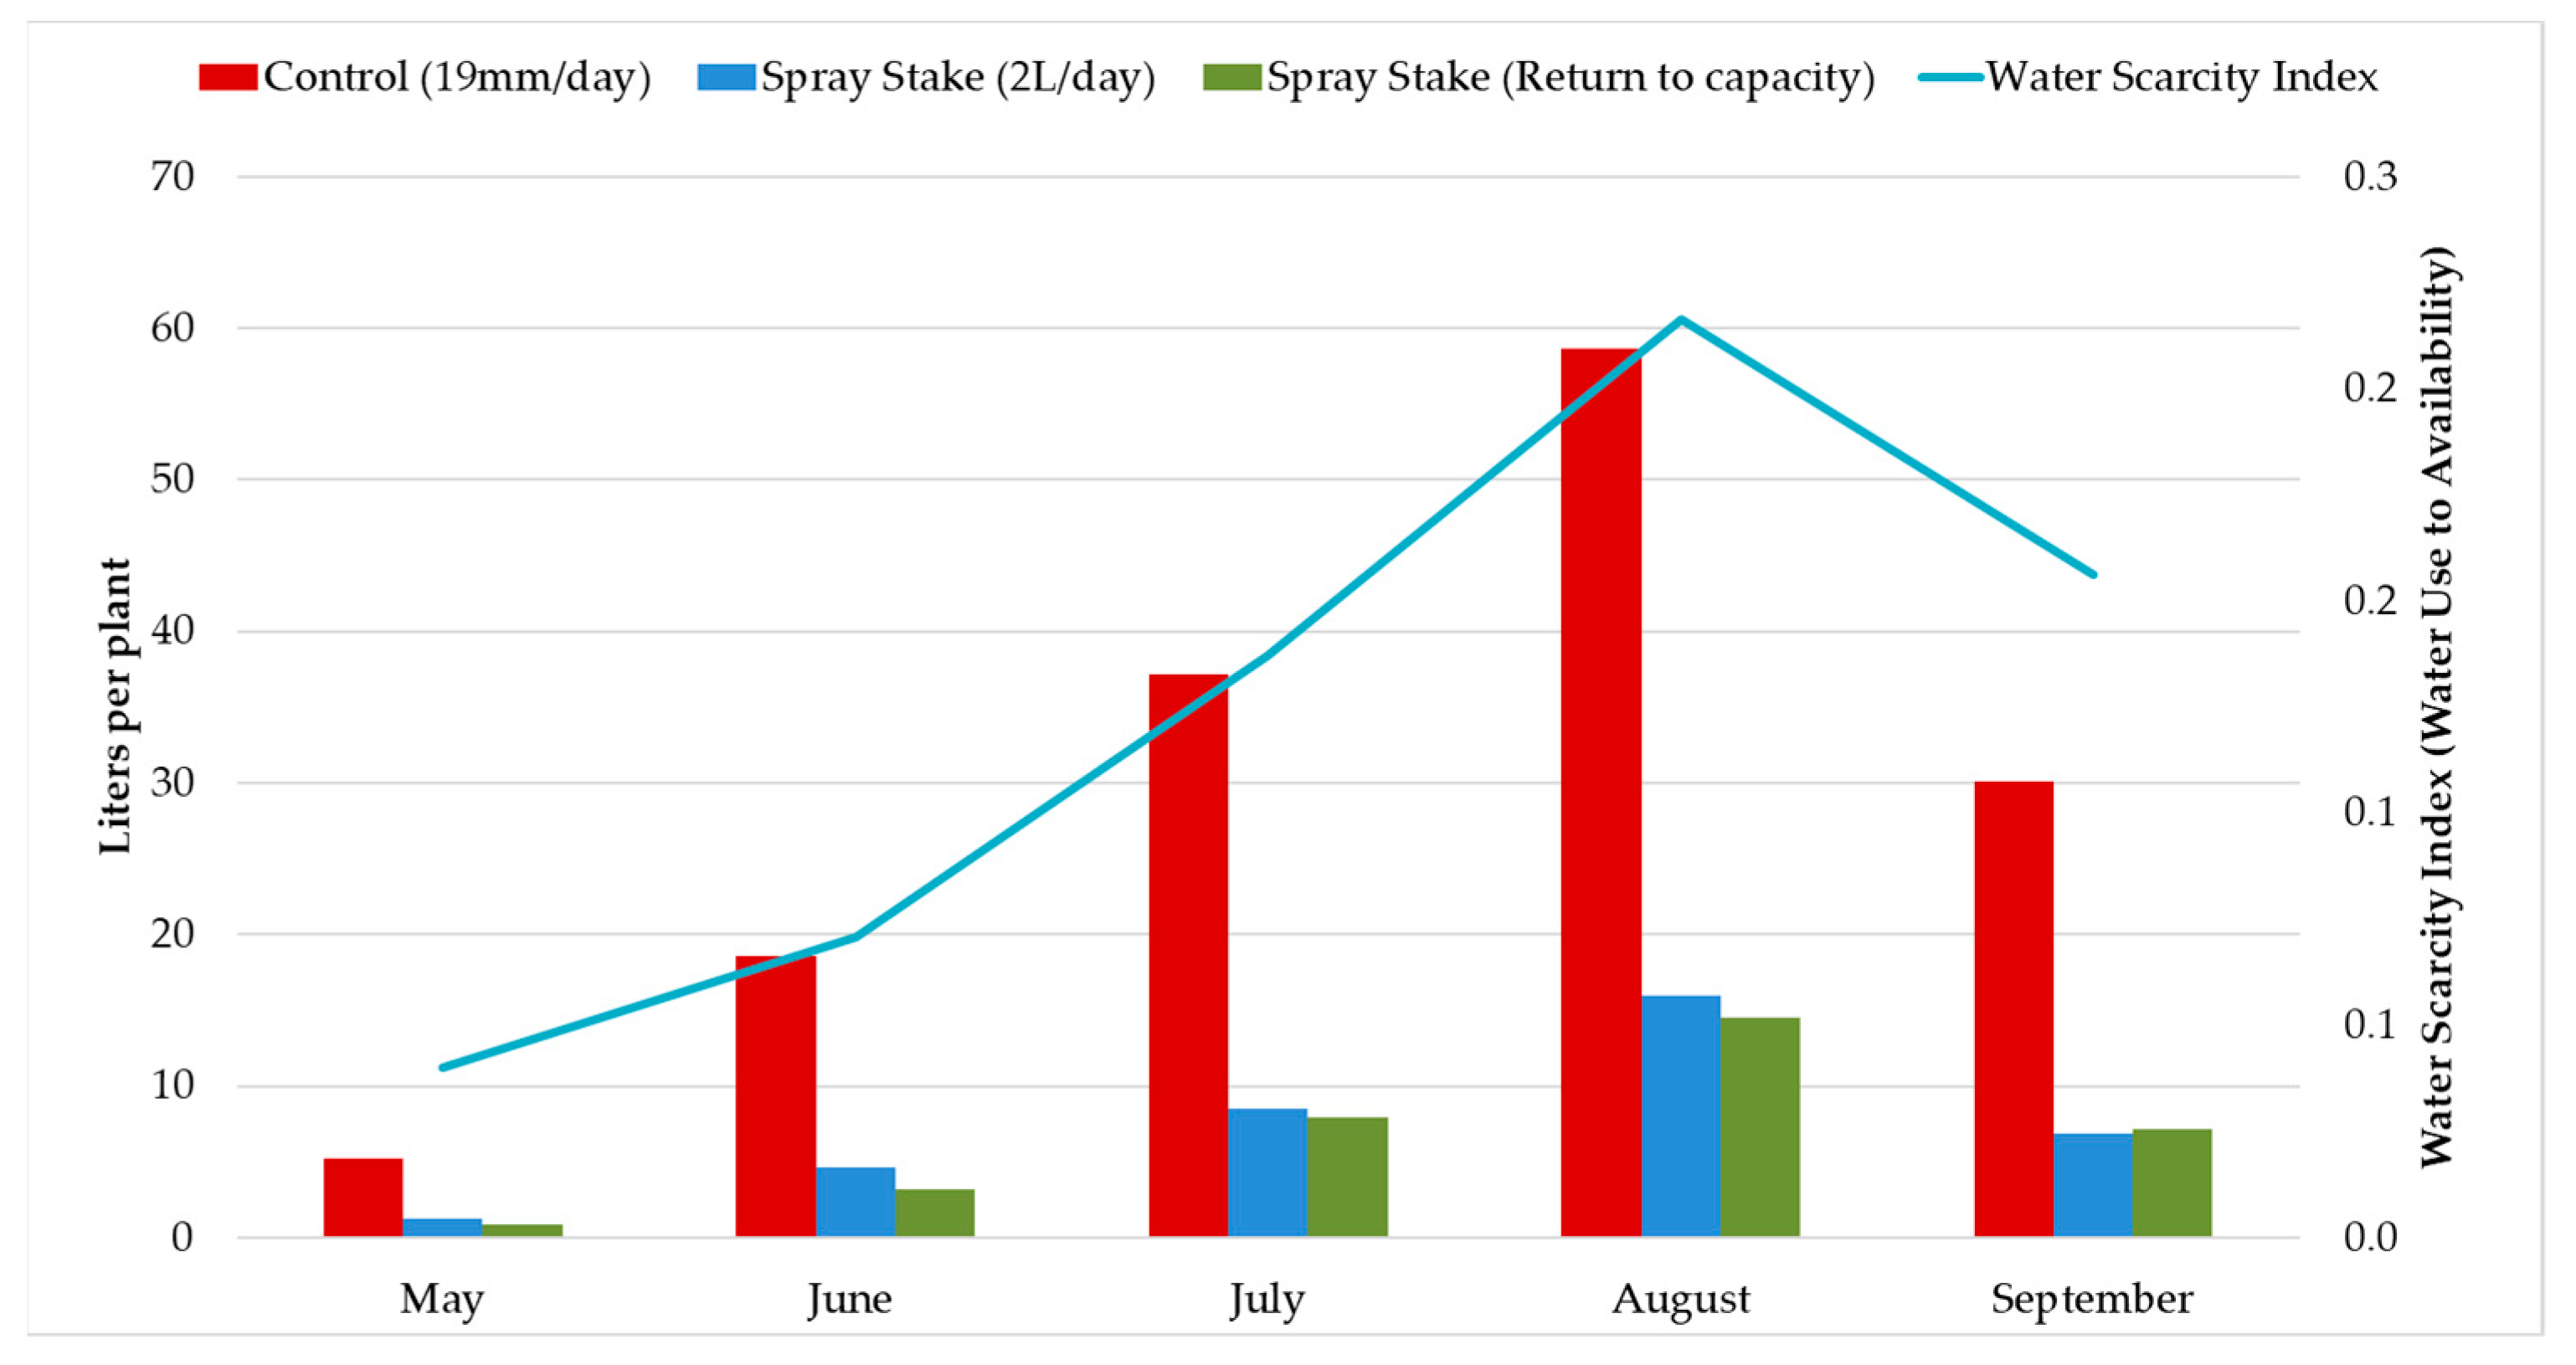
In 2017, the monthly WSF
iwa for plants receiving 2 L per day through spray stakes and plants that were returned to container capacity daily were similar but ranged from 16% to 25% of the monthly WSF
iwa for control plants receiving 19 mm per day through overhead irrigation (
Figure 1).
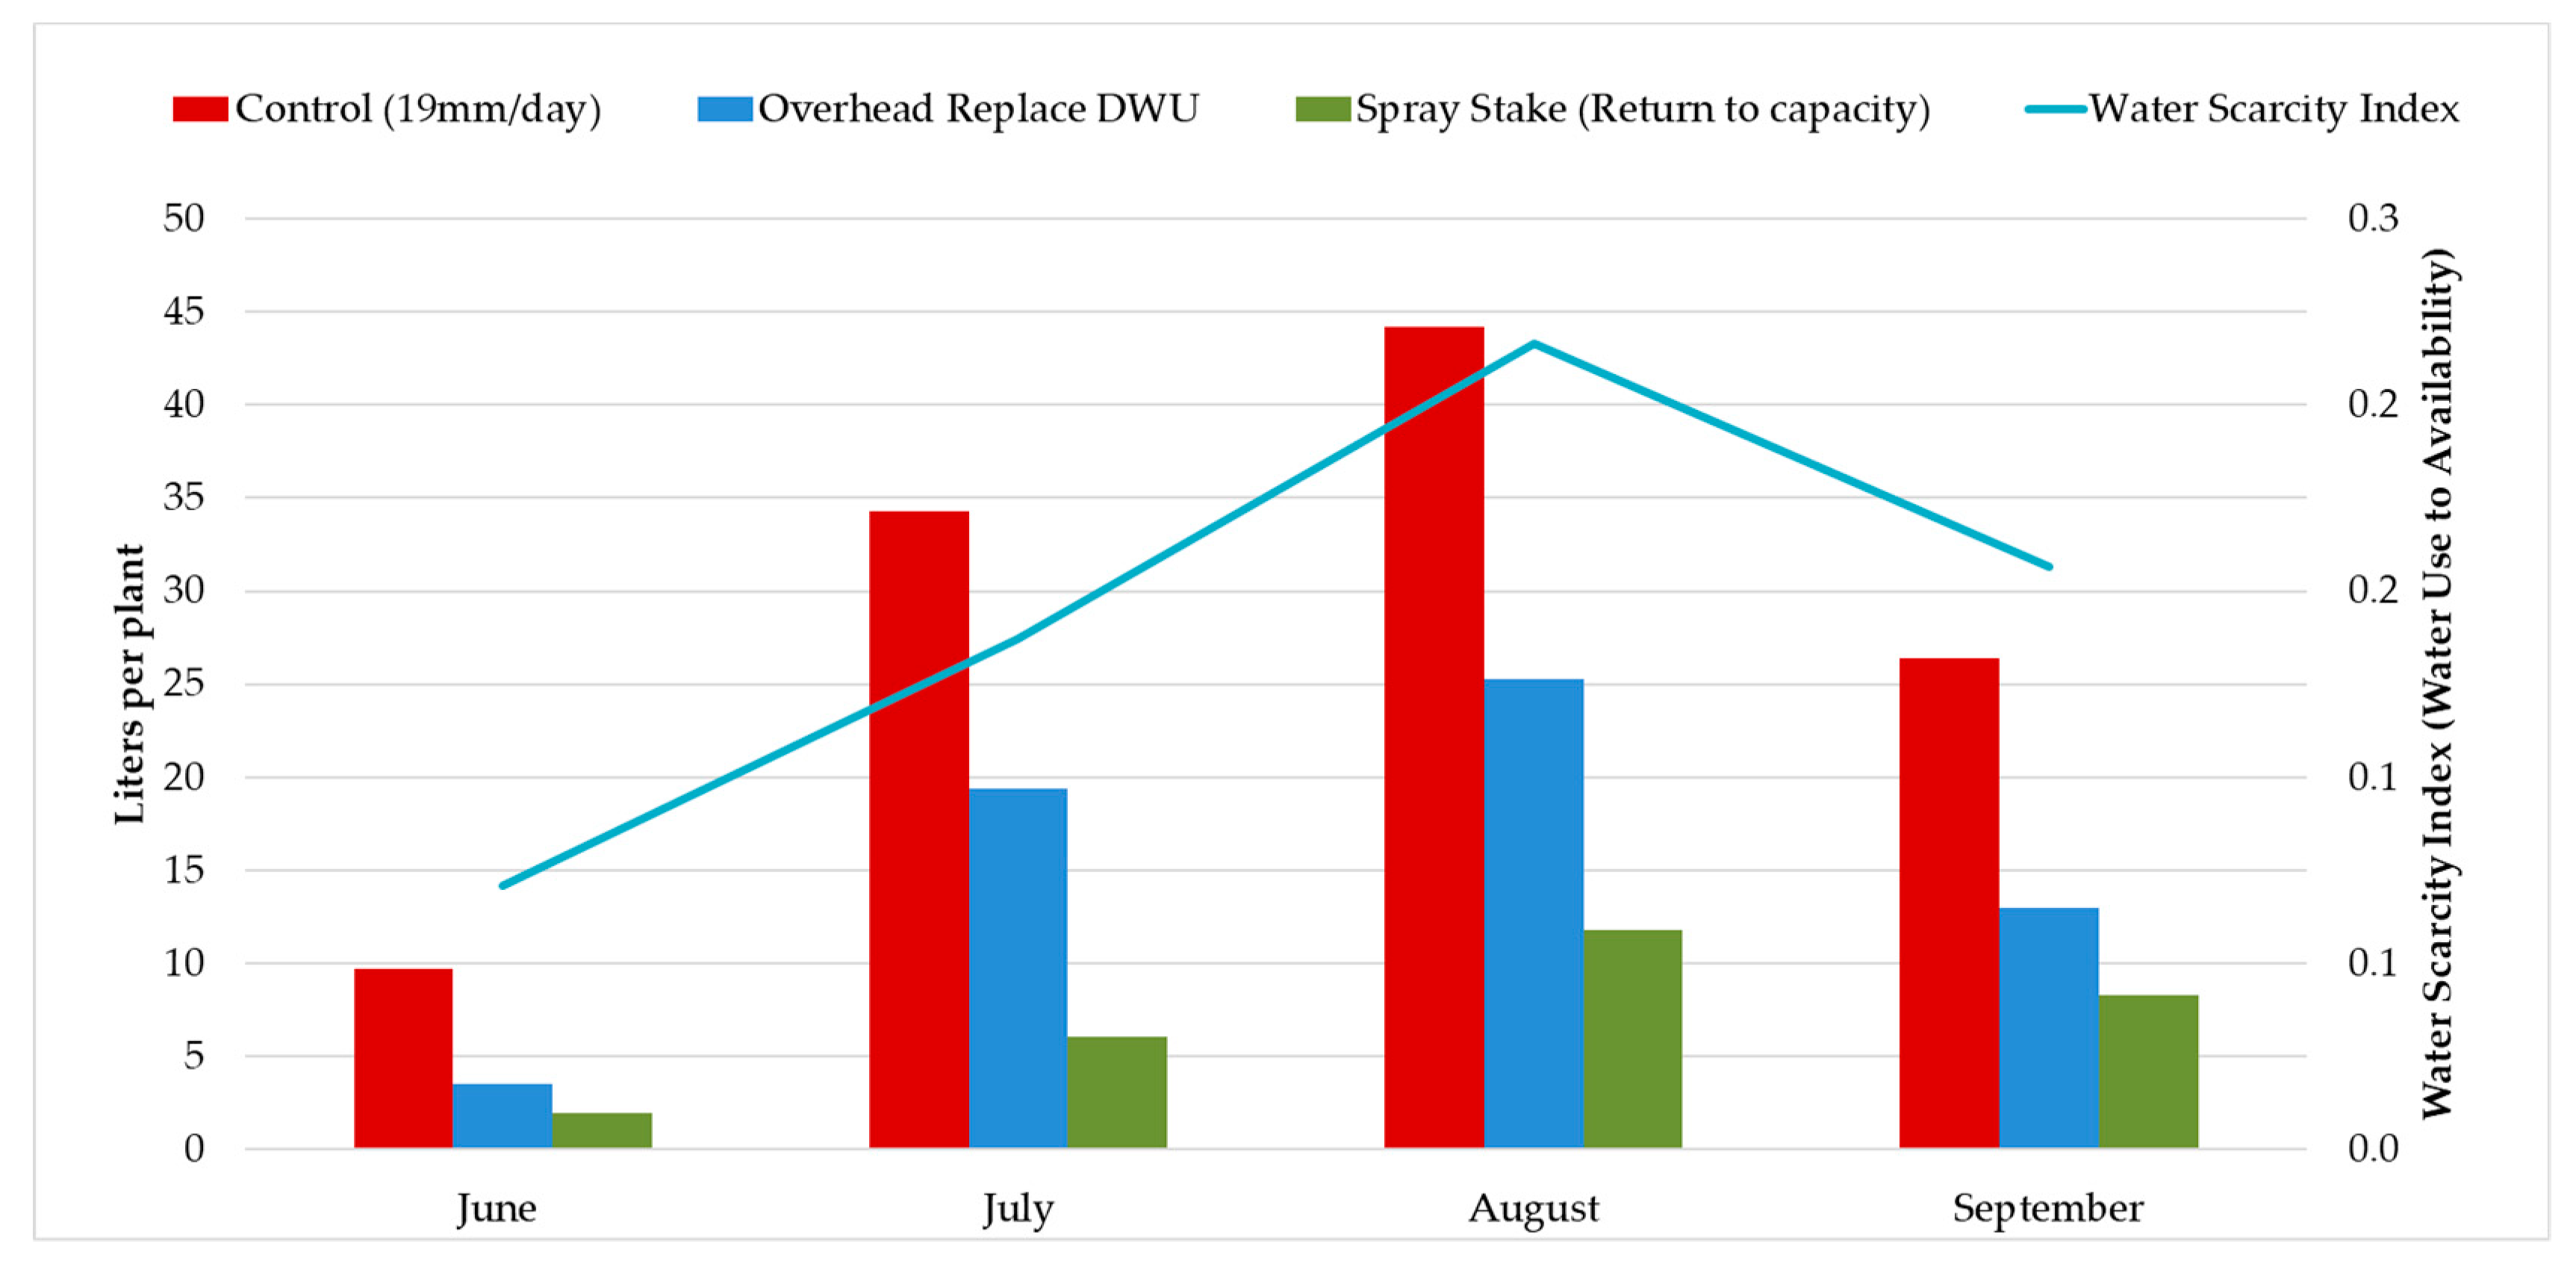
In 2018, the monthly WSF
iwa for plants that were irrigated daily to return the substrate to container capacity ranged from 31% to 64% of the WSF
iwa for plants that were irrigated to replace DWU (
Figure 2). The monthly WSF
iwa of plants irrigated daily to replace DWU ranged from 36% to 56% of the WSF
iwa for control plants receiving 19 mm daily.
IWA during the entire 2017 experiment (17 May through 22 September; 128 days) was 1127, 276, and 236 L per plant for control plants, those receiving 2 L per day, and those returned to container capacity daily, respectively. For the entire 2018 experiment (1 June through 31 September; 123 days), IWA totaled 769, 392, and 181 L per plant for the control plants, those receiving DWU replacement, and those returned to container capacity daily, respectively.
Total irrigation water per plant captured as runoff in 2017 was 279, 37, and 46 L and water captured as infiltration was 317, 237, and 210 L for control plants, those receiving 2 L per day, and those returned to container capacity, respectively. Total irrigation water captured per plant as runoff in 2018 was 301, 85, and 31 L and as infiltration was 50, 77, and 136 L for control plants, those receiving DWU replacement from overhead sprinklers, and those returned to container capacity with spray stakes, respectively. As would be expected, the control treatment in both experiments (19 mm of irrigation daily broadcast over the bed through overhead sprinklers) resulted in a higher volume of runoff than treatments with spray stakes in individual containers as a higher volume of water was applied. In 2017, the runoff in the control plants throughout the experiment was 7.5 and 6 times greater than the spray stakes in individual containers receiving 2 L per day and those returned to container capacity daily, respectively. The difference in infiltration volumes in the two years could have been due to physical changes in the sand base over time. None of the runoff water in this study was recycled; therefore, the WSFiwa would be expected to be higher than for systems employing water recycling.
The WSFiwa for plants in 2017 was calculated as 150, 37, and 34 L per plant for control plants, those receiving 2 L per day, and those returned to container capacity, respectively. In 2018, the WSFiwa for control plants, those receiving DWU replacement, and those returned to container capacity daily were calculated to be 116, 61, and 28 L, respectively.
The published WSF for a multiple-year production cycle model for
Ilex crenata ‘Bennett’s Compacta’ in a 10.2 L container on the U.S. East Coast with runoff and rainfall capture and recycling was recalculated from original data using the consumption-to-availability index as 681 L [
41]. The WSF for a multiple-year production cycle model for
Buxus microphylla var.
japonica in a 10.2 L container in the U.S. Pacific Northwest with runoff and rainfall capture and recycling was recalculated from original data to be 227 L [
42]. For comparison, WSF for a 120 day period in mid-summer was calculated from the original data of those studies as 24 and 87 L per plant, and the IWA was 300 and 375 L for the West Coast and East Coast model systems, respectively. Approximately 48% and 67% of IWA was recycled water for the East Coast and West Coast models, respectively, which reduced the potential WSF
iwa. Data for calculating WSF
wd were not available for these case studies.
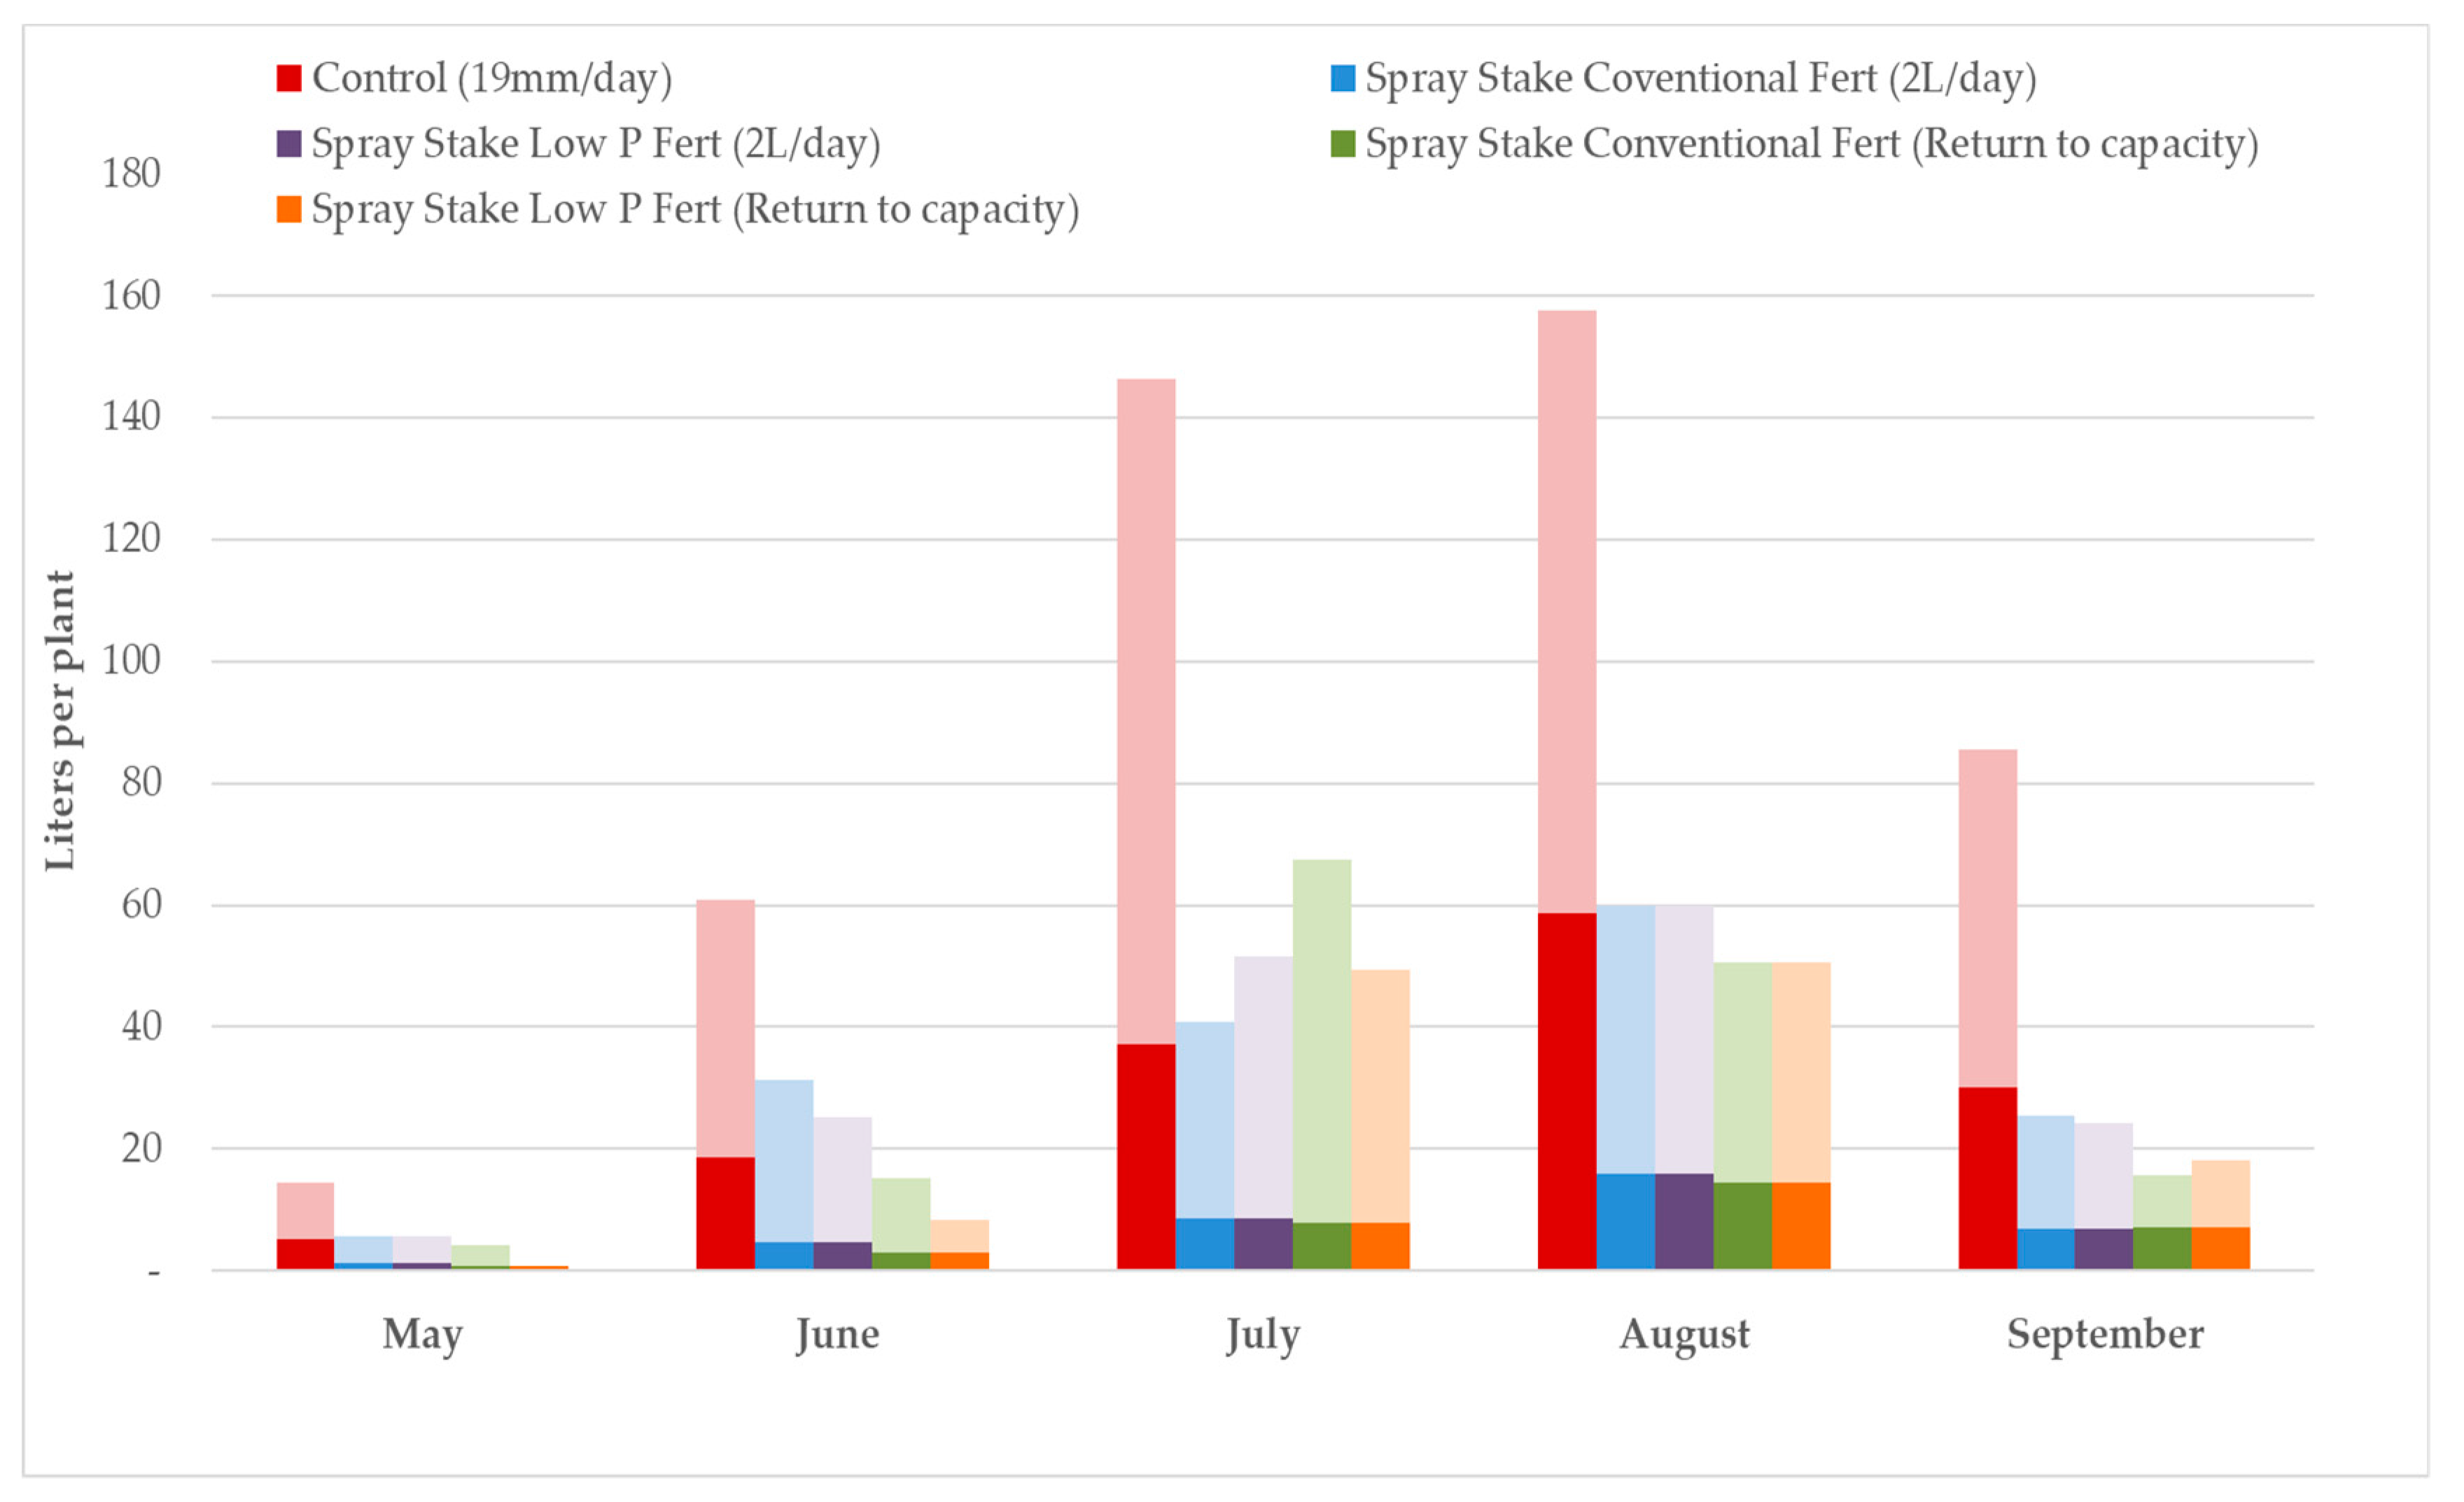
The WSF
wd was determined on the basis of the
and
in the runoff and infiltration water per month. In almost all cases in this study, the dilution ratio to result in concentrations at or below the identified threshold was dictated by the
concentration in the runoff and infiltration water, not
. In 2017, the control treatment resulted in the greatest WSF
wd among treatments, with at least half of the control WSF
wd contributed by runoff compared to infiltration each month (
Figure 3). This also corresponds to the higher water volume captured as runoff from control plants. The vast majority of monthly WSF
wd was contributed by infiltration for the other treatments. There was a trend for a higher WSF
wd in treatments with conventional fertilizer compared to low-P fertilizer, but this was inconsistent across months.
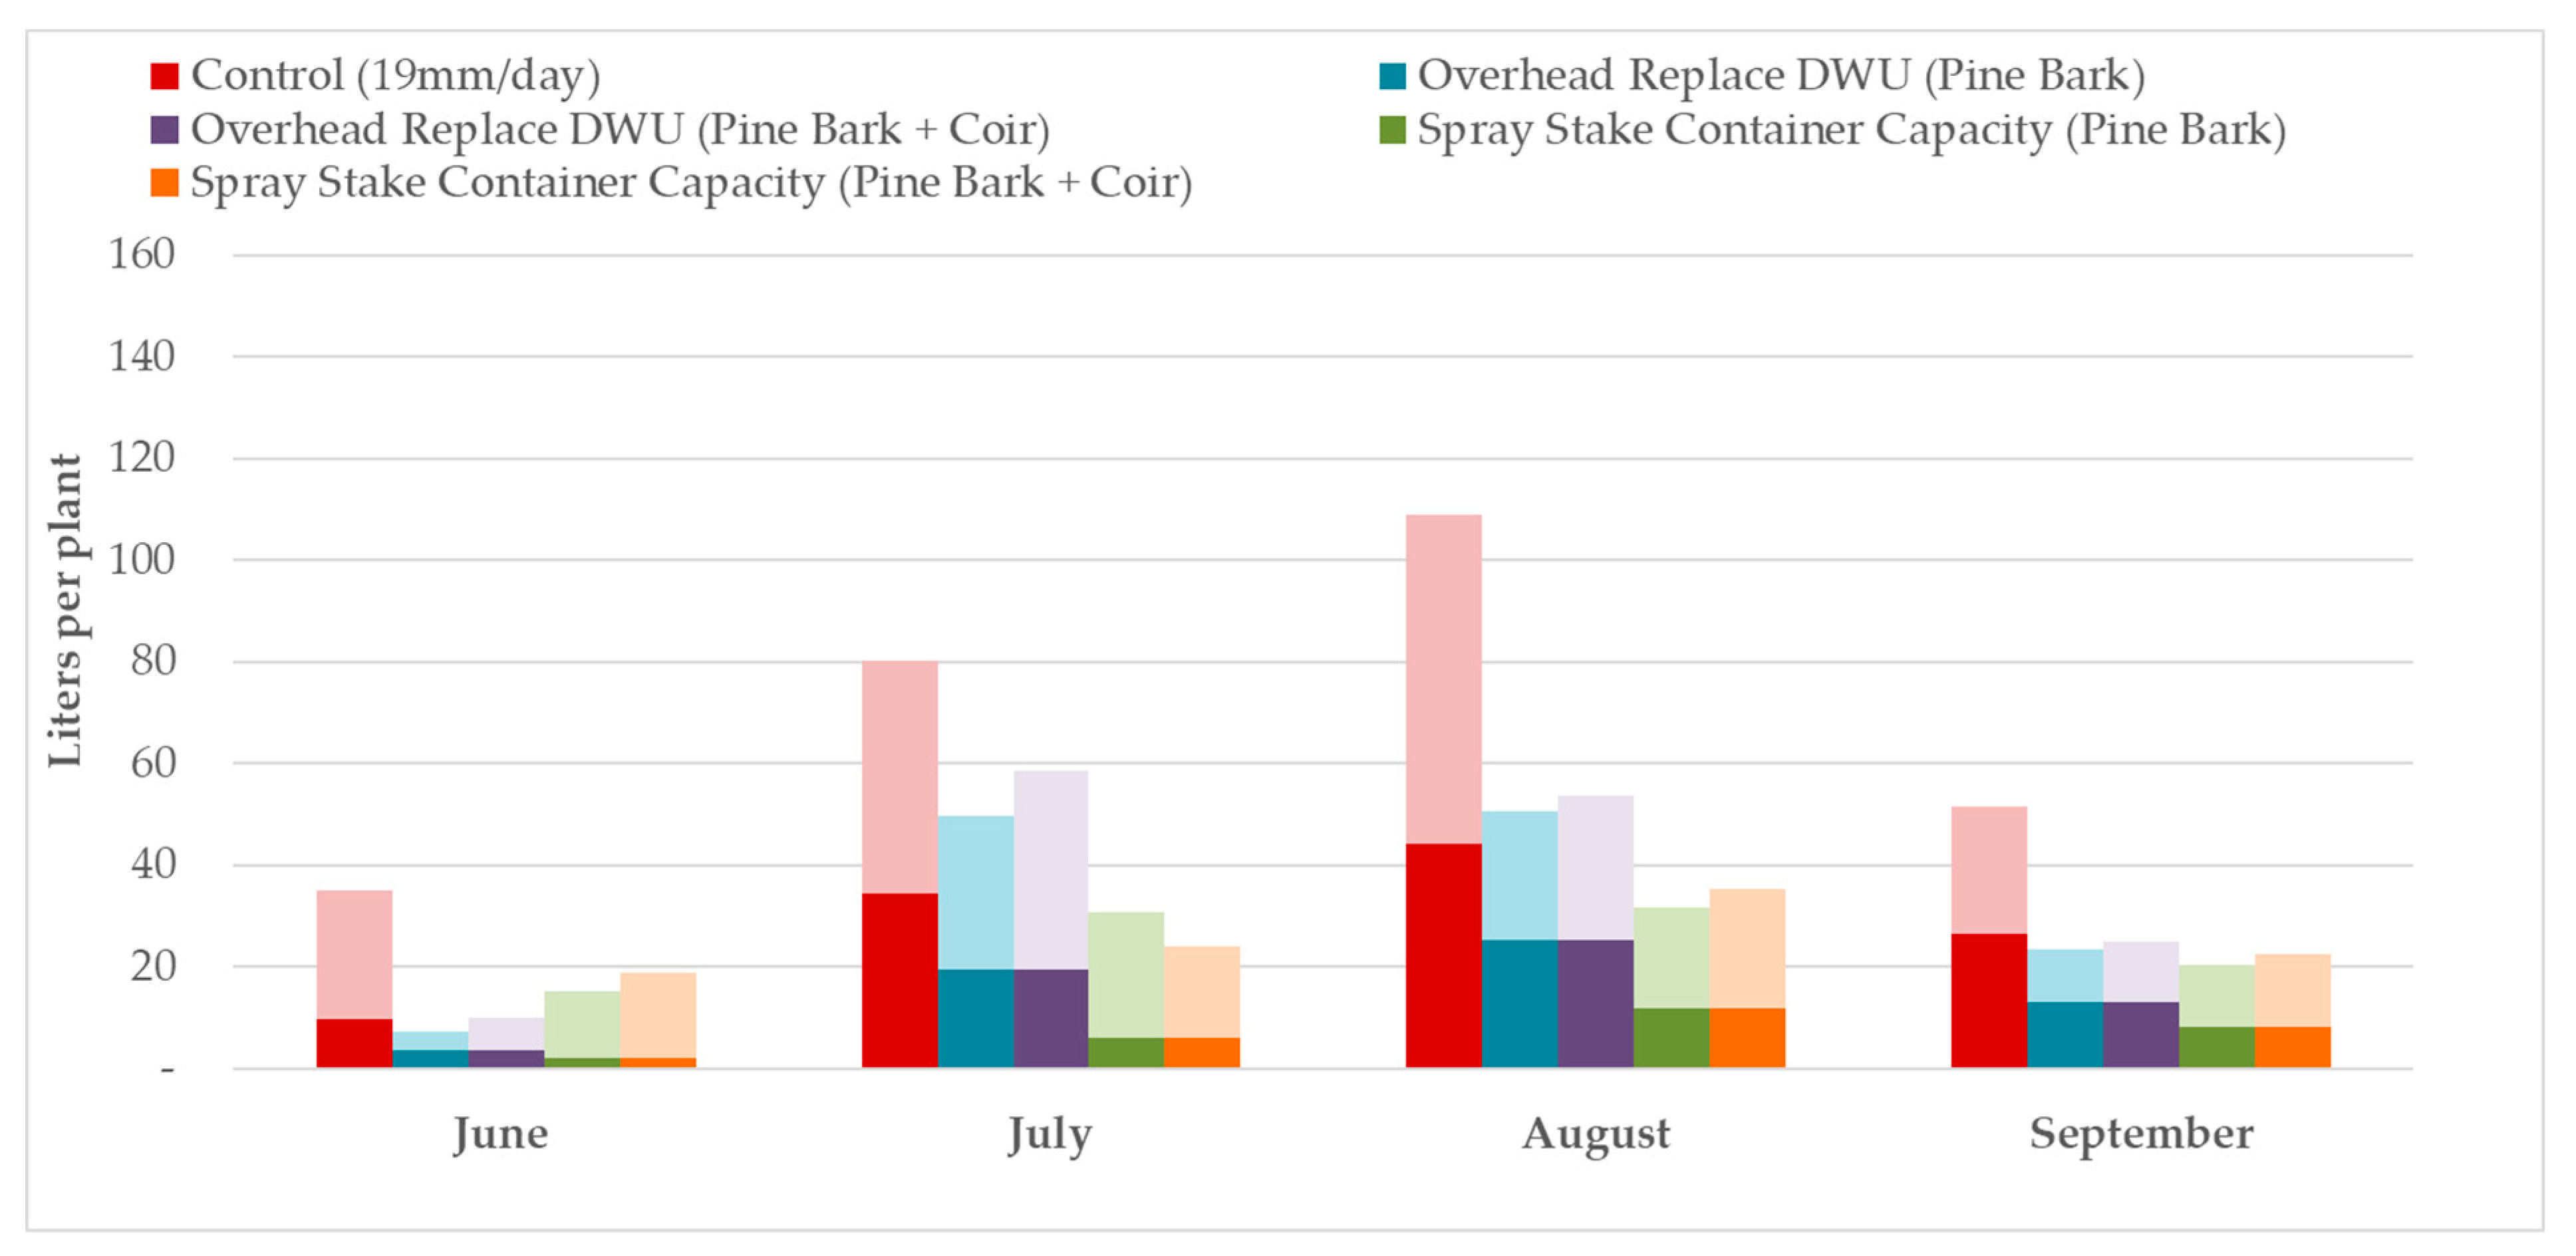
Runoff contributed the vast majority of monthly WSF
wd for the control treatment in 2018 (
Figure 4). Infiltration water was the primary contributor to WSF
wd for the treatment supplying enough irrigation to replenish container capacity, but runoff had a greater impact (22% to 28%) on monthly WSF
wd for the irrigation treatment that replaced DWU through overhead sprinklers. Substrate composition had a limited and inconsistent impact on WSF
wd.
WSF
iwa and WSF
wd were combined to yield a WSF in both experiments. The mean WSF for plants under the control treatment was two to three times higher than the WSF for the other treatments in 2017, with the greatest separation in July, August, and September (
Figure 5). WSF
wd was the primary contributor to WSF, ranging from 62% to 88% of the WSF across treatment and month. Generally, larger percentages of the WSF contributed by WSF
wd were observed each month. Substrate composition had limited and inconsistent effects on WSF and its components. Similarly, WSF
wd was the more important contributor to WSF in 2018 (
Figure 6). On average, WSF
iwa contributed 19%, 17%, 30%, and 35% of WSF in June, July, August, and September, respectively.
Another perspective can be seen when comparing the relative impact of WSF
iwa, WSF
wd from runoff, and WSF
wd from infiltration for treatments for the entirety of each experiment (
Figure 7 and
Figure 8). Although WSF for the control plants was 2.8 to 3.6 times greater than the other treatments in 2017, WSF
iwa contributed 32% of the combined WSF, whereas WSF
wd from infiltration and runoff were equal and totaled 68% of WSF (
Figure 7). WSF
wd from infiltration was 65% to 73% of the WSF for the other treatments. WSF
wd from runoff was much less important for these treatments. For the low-P fertilizer treatment, WSF
wd from runoff was only 1% of WSF compared to 12% for the conventional fertilizer. In 2018, the WSF was generally smaller than in 2017, but the combined WSF of plants in the control treatment were still 1.9 to 2.8 times greater than for plants from the other treatments (
Figure 8). In this experiment, WSF
wd from runoff constituted 50% of the combined WSF
wd in the control plants, whereas WSF
wd from infiltration contributed only 8%. The WSF
iwa for plants receiving daily replacement of DWU was 2.3 times greater than for plants returned to container capacity daily. WSF
wd from runoff averaged 5% and 6% of the WSF for plants returned daily to container capacity with spray stakes for the pine bark and pine bark + coir, respectively. However, that is much less than for plants in pine bark (29%) and pine bark + coir (31%) and receiving replacement of DWU from overhead sprinklers. The most striking difference between those sets of treatments was the higher percentage of the combined WSF from WSF
wd due to infiltration in the plants returned to container capacity with spray stakes (66%) compared to plants receiving DWU replacement daily from overhead sprinklers (31%).


