Abstract
There is a strong inter-annual and inter-decadal variability in time series of flood-related variables, such as intense precipitation, high river discharge, flood magnitude, and flood loss at a range of spatial scales. Perhaps part of this variability is random or chaotic, but it is quite natural to seek driving factors, in a statistical sense. It is likely that climate variability (atmosphere–ocean oscillation) track plays an important role in the interpretation of the variability of flood-related characteristics, globally and, even more so, in several regions. The aim of this review paper is to create an inventory of information on spatially and temporally organized links of various climate-variability drivers with variability of characteristics of water abundance reported in scientific literature for a range of scales, from global to local. The climate variability indices examined in this paper are: El Niño-Southern Oscillations (ENSO), North Atlantic Oscillations (NAO), Atlantic Multi-decadal Oscillation (AMO), and Pacific Decadal Oscillations (PDO). A meta-analysis of results from many studies reported in scientific literature was carried out. The published results were collected and classified into categories after regions, climate variability modes, as well as flood-related variables: precipitation, river flow, and flood losses.
1. Introduction
Floods are major weather-related events that continue to cause high economic and human losses all over the Globe, reaching, on average, tens of billions of $US and thousands of fatalities per year. Hence, an understanding of mechanisms of temporal change and variability of floods and flood-related variables (such as precipitation, river discharge, flood loss) is of vast theoretical and practical interest and importance.
The search for ubiquitous, spatially coherent trends in long time-series of hydro-climatic observation records has been very successful for temperature, less successful for precipitation (including intense precipitation), and even less so for river flow. Actually, no persuading, spatially-organized long-term trends could be detected in records of maximum river discharge.
Analyses of the time series of annual maximum (or peak-over-threshold) values of river discharge at a given station (cross-section) and of flood indices do not show a convincing ubiquitous upward trend. In the absence of a gradual trend, the structure of the time series is dominated by strong, and seemingly rather irregular, inter-annual and inter-decadal variability. An intriguing question emerges—what is the mechanism of variability of flood-related variables? Perhaps there exist some links with recognized climate variability and its indices. Therefore, it is quite natural to examine whether the climate variability expressed via atmosphere–ocean oscillation indices can drive the variability of flood-related indices.
Better understanding of spatially- and temporally-organized links between climate variability patterns and flood hazard and flood risk at a range of spatial and temporal scales would be a considerable asset. Anticipating regional predisposition to river floods in a particular phase of oscillation in the atmosphere–ocean system, measured by a range of climate variability indices, could help in improving preparedness to emergency.
The aim of this review paper is to assemble a selective summary of the existing information on links of various climate-variability drivers with variability of characteristics of destructive water abundance at a range of scales. We discuss the modes of climatic variability that may have links to flood-related variables. We review publications reporting on links between variability of intense precipitation, high river discharge and flood indices and natural oscillations in the ocean–atmosphere system, starting from global scale to continental, river-basin, national, regional, to local scale.
2. Modes of Climate Variability
Many indices of inter-annual and inter-decadal climate variability have been proposed in the scientific literature in order to quantify oscillation in the atmosphere–ocean system. Some of them have been studied in the context of links with hydrological variables. Time series of characteristics of climate variability indices of concern may reflect volcanic eruptions and indices of solar irradiance, illustrated by sunspot numbers, as well as various classes of ocean–atmosphere oscillations. The first two indices from the above list are likely the drivers of climate variability. In contrast, ocean–atmosphere oscillations, being manifestations of climate variability, are likely the drivers of climate impact variability, that are the focus of this paper.
Accounting for the heat and mass exchange between the Earth’s atmosphere and the oceans is absolutely necessary to understand large-scale meteorological processes and to interpret the climate variability. The latter consists of quasi-periodic oscillations in the climate system, i.e., the alternating occurrence of positive and negative anomalies of meteorological variables such as temperature or air pressure in a specific reference location, or of differences between values of these variables in two specific reference locations. These spatially defined oscillations in the ocean–atmosphere system have been found to affect the climate and various climate impact variables over large areas, including remote regions, via teleconnections.
There are four principal modes of climate variability that, according to a plethora of references, are of particular relevance for links with abundance of water—i.e., with characteristics of intense precipitation, high river discharge, and floods. They are oscillations of quasi-periodicity of several years: ENSO (El Niño-Southern Oscillation) and NAO (North Atlantic Oscillation), as well as of several decades: AMO (Atlantic Multi-decadal Oscillation) and PDO (Pacific Decadal Oscillation). Brief information about these four modes of climate variability is given below.
The ENSO is the sea surface temperature oscillation over the tropical Pacific Ocean. During the warm phase, El Niño, water off the South American coast is warmer than average (in the absence of cold upwelling), while during the cold phase, La Niña, with increased cold upwelling, warm water is further west off the South American coast than usual. Between the warm phase, El Niño, and the cold phase, La Niña, there is a neutral phase. The Southern Oscillation is the accompanying atmospheric (air pressure) component, coupled with the sea surface temperature (SST) change. Many relevant indices have been proposed and some of them were used in references reviewed in this paper. Among the indices are: ONI (Oceanic Niño Index, 3-month running mean of SST anomalies in the Niño 3.4 region, stretching from the 120° W to 170° W astride the equator, five degrees of latitude on either side; for declaration of El Niño or La Niña, the anomalies must exceed ±0.5 °C for at least five consecutive months), Niño 3.4 (5-month running mean, and SSTs must exceed ±0.4 °C for a period of six months at least), Niño 1 + 2 (0–10° S, 90° W–80° W), Niño 3 (5° N–5° S, 150° W–90° W), Niño 4 (5° N–5° S, 160° E–150° W), and the Trans-Niño Index (TNI), which is defined as the difference in normalized SST anomalies between the Niño 1 + 2 and Niño 4 regions and the event is classified as a “central Pacific El Niño” or “El Niño Modoki”. Also, the Southern Oscillation Index (SOI, https://www.ncdc.noaa.gov/teleconnections/enso/indicators/soi/) has been used, expressing fluctuations in air pressure between the western and the eastern tropical Pacific, calculated based on the differences in air pressure anomaly between Tahiti and Darwin, Australia, [1,2].
The term NAO refers to cyclic air pressure changes in the Icelandic Low and Azores High as well as cyclic displacements of the center of the Azores High. If the (seasonal or monthly) value of the NAO index is positive, there is a stronger air pressure contrast between the Icelandic Low and the Azores High, i.e., the pressure value in the Azores Region is higher than the long-term average, while the corresponding pressure in the Icelandic Low is lower than the long-term average. Several indices were proposed to measure the strength of NAO, related to air pressure in various stations, such as: the Hurrell index—between Lisbon (Portugal) and Stykkishólmur (Iceland), the Rogers index—between Ponta Delgada (Azores) and Akureyri (Iceland), and the Jones index—between Gibraltar and Stykkishólmur. More detailed information on the concept and studies of NAO can be found in Wanner et al. [3].
The PDO is the decadal-scale temperature oscillation of the Pacific Ocean. Sometimes it is called a long-lived ENSO-like Pacific climate oscillation pattern. Two quasi-periodicities have been determined: of 15–25 and 50–70 years. Temperature anomalies (departures from average) in the East Pacific (off the west coast of North America) have an opposite sign to those in the West Pacific, therefore there is some compensation effect and the impact on the global temperature is small [4,5].
The term AMO refers to a coherent pattern of oscillatory changes in the North Atlantic sea-surface temperature (SST) with a period of about 60–90 years. Traditionally, indices of the AMO have been based on average annual SST anomalies in the North Atlantic. Temperature anomalies in the North Atlantic have an opposite sign to those in the South Atlantic, therefore there is a kind of compensation effect and the impact on the global temperature is small. The nature and origin of the AMO is uncertain, and it remains unknown whether it represents a persistent, quasi-periodic driver in the climate system, or merely a transient feature. A deterministic mechanism relying on atmosphere–ocean–sea ice interactions for the AMO was proposed by Dima and Lohmann [6].
There are several data sets of climate variability indices that have been collected at various sources and made publicly available (e.g., Table 1).

Table 1.
Data sets of climate variability indices (monthly values) available at the US NOAA (National Oceanic and Atmospheric Administration) ESRL (Earth System Research Laboratory), under the GCOS (Global Climate Observing System) umbrella (https://www.esrl.noaa.gov/psd/gcos_wgsp/Timeseries/SOI/ or https://www.esrl.noaa.gov/psd/gcos_wgsp/Timeseries/Nino34/ or https://www.esrl.noaa.gov/psd/gcos_wgsp/Timeseries/NAO/ or https://www.esrl.noaa.gov/psd/gcos_wgsp/Timeseries/PDO/ or https://www.esrl.noaa.gov/psd/gcos_wgsp/Timeseries/AMO/).
3. In Search for Links between Variability of Flood-Related Variables and Climate Oscillations
The structure of the time series of annual maximum river discharge and flood damage worldwide, does not show a persuading ubiquitous upward trend [7], even if the Clausius–Clapeyron law demonstrates that more water vapor can be stored in the warmer atmosphere, suggesting the increase of the potential for more intense precipitation (that may lead to floods) in the warmer climate. What the time series of annual maximum river discharge shows is a dominating inter-annual and inter-decadal variability that may overshadow gradual (if any) trends. High river discharges tend to be clustered in time [8].
There is a strong multi-annual and multi-decadal variability in flood-related variables. Perhaps part of this variability is random or chaotic, but there are serious arguments supporting the thesis that climate variability plays, generally, an important role in driving flood hazard over many areas of the world. Prudhomme et al. [9] examined whether the same few circulation types are systematically associated with floods at the European scale. Their results showed that, indeed, at the river basin scale and at the continental, European scale, some circulation types have significant positive frequency anomalies with flood occurrence, i.e., they are associated with a predisposition to floods. However, the results were not robust—they were shown to depend on various technicalities. Burn and Arnell [10] investigated the spatial and temporal pattern of high river flow, globally, using annual maximum discharge data for 200 gauging stations. The results of the investigation revealed that diverse regions of the world exhibit synchronous flood responses which can be related to various global climatic conditions, such as atmosphere–ocean oscillations. They also examined global temporal patterns in flooding and identified distinct periods corresponding to increased global flooding activity.
Many research works have been undertaken and reported in literature, aimed at identification of links between the climate variability and various variables related to floods. Climate variability indices can quantify some climate phenomena which can be considered as drivers of variability of such flood-related characteristics, as intense precipitation, high river discharge, flood severity and magnitude (in the sense of Brakenridge, see explanation in [11,12]), as well as flood loss (material damage, population, number of fatalities, and a combined index). Clearly, there are several climatic and non-climatic factors influencing flood risk (understood as probability times consequences, that can be disaggregated into three driving factors: hazard, exposure, and vulnerability). Non-climatic drivers are of terrestrial/hydrological (e.g., land-use and land-cover change, river regulation, and structural flood defenses), as well as social/economic nature. For instance, changes in rivers and their drainage basins, and changes in flood damage potential depend on the socio-economy (demography, wealth, development, GDP). However, the climate variability track is likely to play an important role in the interpretation of the variability in the time series of flood-related characteristics globally and, even more so, in many regions. Hence, it seems opportune to examine variability in recorded time series of flood-related characteristics and climate variability indices and seek spatially and temporally organized links between them. Improved understanding of climate-variability impacts on variability of flood-related characteristics would be of considerable value.
The expectation of discovery of absolute deterministic rules would be naïve, yet existence of probabilistic, frequency-type rules of spatially-organized validity is likely. The global spatial scale can be used, but particular focus can be put on areas where links have been found to be strong and where robust regional laws can be formulated. In many papers, authors claim to have unveiled new teleconnections (i.e., co-variability of variables at distant locations), possibly in asynchronous (e.g., lagged) mode, and/or to have found an important original interpretation.
This paper aims at building an inventory of selected information on links between climate variability indices and variability of flood-related characteristics. It is virtually impossible to embrace all the many thousands of related references. Search for the logical sum of “ENSO” and “flood” gives 32,500 hits in Google Scholar, and 733 hits in Web of Science. Search for “NAO” and “flood” gives 24,200 hits in Google Scholar, and 147 hits in Web of Science, while search for “PDO” and “flood” gives 8,020 hits in Google Scholar, and 94 hits in Web of Science. Search for “AMO” and “flood” gives 19,900 hits in Google Scholar, and 36 hits in Web of Science (updated on 13 May 2019). The gross orientation numbers given above are clearly overestimating the count, for several reasons, e.g., in some entries, Flood is an author’s name, while Nao and Amo refer to geographic names and NAO—to National Audit Office. Nevertheless, the number of relevant source items is very high. In brief, the audience is inundated by information on the links between climate variability and variables related to floods, of varying strength and trustworthiness. Hence, some transparent rules of selection of entries to be included in this paper are needed. We give priority to reviewing papers that have gathered many citations, according to bibliometric indices (related to citations count) reported in Web of Science. However, we also include several papers that have not gathered numerous citations yet (some of them being quite recent), but deserve being considered. In result, bibliography contains 120 source items. In this review paper, there is usually reference to one or two papers authored by a single scientist or co-authored by a group of scientists, even if the same authors may have possibly published many other papers in the field. An attempt was made to select the appropriate paper(s) out of a larger set.
Meta-analysis (analysis of analyses) of results from selected studies reported in scientific literature is offered. The bibliography is collected and classified into categories (after regions, climate variability modes, and flood-related variables: precipitation, river flow, and flood losses). Reported results are assessed and a synthesis of findings is presented. It could improve understanding of the links of four variability modes with abundance of water and inform further studies in the area. Information is given on who studied what and whether approaches turned out to be successes or failures (though, definitely, the latter are less likely to be well represented in the scientific literature).
From the viewpoint of flood variability, the dominating mode of inter-annual climate oscillation is undoubtedly the El Niño-Southern Oscillation (ENSO), with impacts felt most strongly in the Pacific region but also in much of the world via teleconnections. Colloquially speaking, once the occurrence of a strong El Niño is declared, a range of extreme weather events worldwide, including floods, are blamed on this phenomenon in the media. Other, possibly relevant, climate variability indices examined in many references are: AMO (Atlantic Multi-decadal Oscillation), PDO (Pacific Decadal Oscillation), and NAO (North Atlantic Oscillation). Some papers tackle other variability indices, such as Northern Hemispheric Teleconnection Indices (Arctic Oscillation—AO, Polar/Eurasia Pattern, Siberian High-Intensity, Scandinavia Pattern, East Atlantic/Western Russia Pattern, East Atlantic Pattern, Pacific/North American Pattern—PNA, and Northern Hemispheric Circum-global Teleconnection—CGT), as well as Monsoon Indices (Webster–Yang Monsoon Index, South Asian Monsoon Index, East Asian–Western North Pacific Monsoon Index), see [13], Indian Ocean Dipole, see [14], and AAO (Antarctic Oscillation), see [15].
Some studies show that the overall impact of climate variability modes (e.g., ENSO and PDO) depends on the combination of ENSO and PDO. For instance, Wang et al. [16] investigated the inter-decadal modulation of the PDO upon the impact of ENSO on the EAWM (East Asian Winter Monsoon). No robust relationship was found between ENSO and EAWM on the inter-annual timescale, when the PDO is in its high phase. However, when the PDO is in its low phase, ENSO was found to exert a strong impact on the EAWM. Chan and Zhou [17] found that inter-decadal variations in the early (May–June) summer monsoon rainfall over South China are linked to the ENSO and the PDO (Pacific Decadal Oscillation), with wetter monsoon years during the periods of low PDO index.
Statistical relationships have been established between some quasi-periodic ocean–atmosphere oscillations (e.g., ENSO, NAO) and general wetness (e.g., river runoff) indices in various regions of the world (cf. [18,19]). Some research studies [19,20] reviewed connections between high river flow (in winter and spring) and the NAO index in winter over many areas. This could be particularly important e.g., in regions with snowmelt as the dominating flood generation mechanism [21].
4. Review of Links between Climate Oscillations and Flood-Related Variables—Global Studies
The El Niño-Southern Oscillation (ENSO) is perhaps the most commonly studied mode of inter-annual climate variability that was found to have an impact on river flow and flooding. Indeed, many dramatic floods have occurred in some areas during strong warm phases of ENSO (El Niño) and in other areas during strong cold phases of ENSO (La Niña). This climate variability mode largely influences the Pacific region, but its impacts can also be felt in much of the world via teleconnections, possibly of asynchronous (lagged) nature. Chiew and McMahon [18] examined global teleconnections between ENSO and river flow. They found strong and regionally consistent ENSO-streamflow teleconnections in Australia and New Zealand, South and Central America, and weaker signals in some parts of Africa and North America. They also proposed a hypothesis that the streamflow–ENSO relationship can be stronger than the rainfall–ENSO relationship (so that an amplification effect takes place), due to integrative properties of the streamflow process.
It can be stated that the occurrence of a specific stage of climate variability (e.g., El Niño) can open the door to a visit of abundant water, yet floods may or may not come. In fact, floods can happen any time, regardless of the climate variability phase. However, in the area of interest, they can be much more likely during one phase (e.g., El Niño) and perhaps more unlikely during another phase (e.g., La Niña). Sun et al. [22] postulated that the effect of ENSO on extreme precipitation is asymmetric, in the sense that a strong, significant effect is only for a single ENSO stage, and much weaker (or none) for another.
There is no doubt that the random component of climate variability as well as of variability of flood-related variables is strong. Nevertheless, Ward et al. [23,24] examined statistical links between ENSO and flooding and arrived at interesting and promising frequency-type results globally. They demonstrated that the ENSO quasi-cycle of natural variability likely has serious impacts on flood hazard in many regions of the world and called for further research to reduce uncertainty. In contrast, more recently, Emerton et al. [25] showed that the interpretation of likelihood of ENSO-driven flood hazard is more complex than perceived and reported in literature.
Ward et al. [23,24] arrived at an updated global map of prevalence of wetness (intense precipitation, flooding) for particular phases of the ENSO oscillation. It is clear that various flood-related variables may react differently to climate variability indices in different areas. The behavior of the time series of river discharge may largely differ from the time series of intense precipitation, as per suggestion of integrative properties due to Chiew and McMahon [18]. Large rivers have basins covered by multiple grid cells and the transformation of rainfall into river runoff modulates the signal and introduces a transport lag, not to forget human influence (anthropogenic effects in drainage basins and river beds) that can be substantial. However, it is not only the scale problem. In many river basins, the flow regime of the main stream differs from the regime of tributaries (e.g., pluvial versus glacial, snowmelt, or rain on snow).
There is a rich body of research aimed at connecting floods with climatic variability at the continental scale. Many relevant studies have been undertaken in Asia, North America, South America, Australia, and Europe, using ENSO, NAO, AMO, and PDO indices. Hodgkins et al. [26] examined climate-driven variability in the occurrence of major floods across two continents (North America and Europe), only in minimally altered catchments, to focus on climate-driven changes rather than changes due to catchment alterations. Temporal changes in the occurrence of major floods were shown to be dominated by multi-decadal variability (AMO) rather than by long-term trends.
The question whether one individual flood event (or a train of floods in a flood season) can be meaningfully associated with the occurrence of a particular phase of climate variability is not properly posed. A more appropriate question is whether the occurrence of a particular phase of climate variability can cause the risk of experiencing floods (predisposition to abundance of wetness) to be significantly higher or lower than average. The reported strength of correlation may vary with time (strengthening or weakening over various periods), with possible asymmetry [22]. Even the sign of correlations may change with time. This is the meaning of the so called “epochal behavior” recognized for the Mekong by Räsänen and Kummu [27]. Ward et al. [23,24] speculated that climate change may possibly be modifying the strengths of teleconnections.
Table 2 presents the essential information extracted from selected references, about the links between climate variability and floods, resulting from global studies.
Table 2.
Review of links between climate oscillations and floods, reported in global studies. Aspects of reference in the rightmost column read: P—precipitation, R—runoff (or river discharge), F—flood.
5. Review of Links between Climate Oscillations and Flood-Related Variables—Continental, Regional, and Local Studies
Table 3, Table 4, Table 5, Table 6, Table 7 and Table 8 present the most essential information extracted about the links between climate variability and floods, resulting from continental (and bi-continental) as well as regional or local studies, as reported in scientific literature. The tables are organized according to continental coverage of studies. Table 3 refers to Asia, Table 4—to North America, Table 5—to South America, Table 6—to Australia, Table 7—to Europe, and Table 8—to Africa. Large regions within continents are placed first, then large river basins.
Table 3.
Review of links between climate oscillations and floods for Asia, as reported in literature. Aspects of reference in the rightmost column—as in Table 2.
Table 4.
Review of links between climate oscillation and floods for North America, as reported in the literature. Aspects of reference in the rightmost column—as in Table 2.
Table 5.
Review of links between climate oscillation and floods for South America, as reported in the literature. Aspects of reference in the rightmost column—as in Table 2.
Table 6.
Review of links between climate oscillation and floods for Australia, as reported in the literature. Aspects of reference in the rightmost column—as in Table 2.
Table 7.
Review of links between climate oscillation and floods for Europe, as reported in the literature. Aspects of reference in the rightmost column—as in Table 2.
Table 8.
Review of links between climate oscillation and floods for Africa, as reported in the literature. Aspects of reference in the rightmost column—as in Table 2.
A few studies examine more than one mode of climate variability. This is explicitly noted in the tables. If a study refers to more than one continent, but does not cover the Globe, it is mentioned in several tables.
Figure 1 illustrates regional predisposition to abundance of water for various phases of four modes of climatic variability. The map in Figure 1 summarizes the findings of continental, regional, to local studies reported in Table 3, Table 4, Table 5, Table 6, Table 7 and Table 8 of this section.
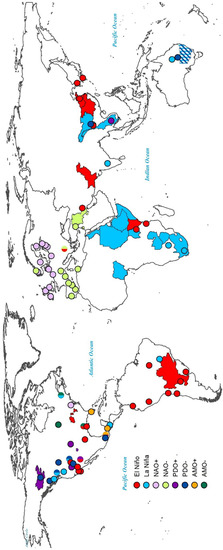
Figure 1.
Map of regional predisposition to abundance of water.
6. Concluding Remarks
No persuading, and spatially-coherent, trend could be detected in long time series of flood-related variables, such as high river discharge, flood severity and magnitude, as well as flood loss. The structure of time series of river discharge is dominated by strong, and seemingly rather irregular, inter-annual and inter-decadal variability. Perhaps part of this variability can be random or chaotic, but there are serious arguments supporting the thesis that climate variability (quasi-periodic oscillations in the atmosphere–ocean system) plays, generally, an important role in driving variables related to floods over many areas of the world. Therefore, it is quite natural to examine whether there are links between the climate variability expressed via atmosphere–ocean oscillation indices and the variability of flood-related indices.
Spatially-defined oscillations in the ocean–atmosphere system have been found to affect the climate and various climate impacts over large areas, covering the oceans and adjacent continents, but also more remote (sometimes—very remote) regions, via so-called teleconnections. The strength of the link can vary from region to region and one can identify zones of influence where a climate variability mode (e.g., ENSO, PDO, NAO, or AMO) affects variables related to floods.
Many research works have been undertaken, with results reported in the literature, aimed at identification of links between the climate variability and various variables related to floods. Studying variability of properties of high river flows (e.g., timing, intensity, volume, duration, frequency) and their links with climate variability is a cutting-edge research activity, attracting broad attention due to scientific interests and practical importance. Anticipating regional predisposition to river floods in a particular phase of oscillation in the atmosphere–ocean system, measured by a range of climate variability indices, could help in improving the system of early preparedness to emergency.
The present paper reviewed published results of studies indicating links between climate variability indices and characteristics of abundant wetness (precipitation, river runoff, and flood indices) in different areas. Many studies have been found that report on the existence of such links, at a range of scales—from global (for ENSO and PDO) to local. Some references indicate the necessity to consider a combination of oscillation modes, e.g., one oscillation mode can modulate another one. Some studies combine analysis of change and variability, or seek for change points in system behavior. The list of references considered in this paper consists of 120 source items. The continents ordered after the number of source items, from highest to lowest, are: North America, Asia, Europe, Africa, South America, and Australia. Some reports on the existence of links are of a rather speculative nature, as a signal is sought among strong noise. Some findings are too complex and do not fit into the simple story of this paper.
As shown in Figure 1, the reviewed references found predisposition to abundance of water during a particular phase of one or more modes of climate variability. More consistent results are reported for South America and El Niño signals wetness there. In Africa, also ENSO is found important, while predisposition to abundance of water is related to La Niña for most areas and El Niño for some. In Europe, it is mostly NAO+ in the Northern and Western parts and NAO- in the Southern part. In Asia, links with ENSO (El Niño for some areas and La Niña for other areas) and PDO were reported. In Australia, it is La Niña and PDO-.
The situation in North and Central America looks most complex (Figure 1), because all modes: ENSO, NAO, AMO, and PDO may play a role. However, Jiang et al. [118] showed that no single index of those four, derived from the Pacific and Atlantic oceans, can explain the multi-scale temporal variability and spatial distribution of heavy precipitation in the western USA. Yet, characterization of their integrated effect, including modulation and reflecting the combined physical oceanic-atmospheric processes, allows useful links to be deciphered.
Reported links have spatial, temporal, and seasonal validity. As expected, different source items may give differing representation of links between climate variability and variables related to floods, for instance due to different definitions of indices, or due to different data windows (start-year and end-year) being considered. In brief, there are still considerable uncertainties in the understanding of the climate variability modes and their impact mechanisms on flood hazard and flood risk. This adds to the recognized general uncertainty of climate impacts on water resources [119].
Reviewed references follow various methodologies to investigate the relationship between climate oscillations and flood-related variables. Correlation and cross-correlation techniques (including time lags) are commonly used. Many papers use principal component or empirical orthogonal function (EOF) analysis (e.g., [107,118]), as well as wavelet power spectrum analysis (e.g., [107]).
Some publications report on convincing physical explanations of mechanisms behind the relationships. One of examples is in the study for North America, by Gershunov and Barnett [120], who found that the North Pacific oscillation (NPO) modulates the consistency and strength of El Niño anomalies. They hypothesized that a deeper Aleutian low (manifestation of the NPO) shifts the storm track southward while El Niño provides an enhanced eastern tropical Pacific moisture source for the storms to tap. They also demonstrated that seasonal climate anomalies over North America exhibit rather large variability between years characterized by the same ENSO phase. Interdecadal climatic anomalies in the North Pacific (the North Pacific oscillation, NPO) were shown to exert a modulating effect on ENSO teleconnections. Typical El Niño patterns (e.g., low pressure over the northeastern Pacific, dry northwest, and wet southwest, etc.) are strong and consistent only during the high phase of the NPO, which is associated with an anomalously cold northwestern Pacific.
It is hoped that the present review paper could play an important and useful role, if only because of the systematization of scattered knowledge. It could improve understanding of the links of four climate variability modes with abundance of water and inform further studies in the area.
Author Contributions
The work was conceived by Z.W.K., who drafted the initial outline and preliminary and incomplete text. Z.W.K., M.S. and I.P. analyzed the rich pool of references and provided input to the tables and offered several rounds of amendments to the text. Z.W.K. provided final refinements to the manuscript.
Funding
All authors wish to acknowledge financial support from the project: “Interpretation of Change in Flood-Related Indices based on Climate Variability” (FloVar) funded by the National Science Centre of Poland (project number 2017/27/B/ST10/00924).
Conflicts of Interest
The authors declare no conflict of interest.
References
- Trenberth, K.E.; Stepaniak, D.P. Indices of El Niño evolution. J. Clim. 2001, 14, 1697–1701. [Google Scholar] [CrossRef]
- Trenberth, K. (Ed.) The Climate Data Guide: Nino SST Indices (Nino 1+2, 3, 3.4, 4; ONI and TNI); National Center for Atmospheric Research Staff: Boulder, CO, USA, 2019. Available online: https://climatedataguide. ucar.edu/climate-data/nino-sst-indices-nino-12-3-34-4-oni-and-tni (accessed on 13 May 2019). [CrossRef]
- Wanner, H.; Brönnimann, S.; Casty, C.; Gyalistras, D.; Luterbacher, J.; Schmutz, C.; Stephenson, D.B.; Xoplaki, E. North Atlantic Oscillation–concepts and studies. Surv. Geophys. 2001, 22, 321–382. [Google Scholar] [CrossRef]
- Mantua, N.J.; Hare, S.R. The Pacific Decadal Oscillation. J. Oceanogr. 2002, 58, 35–44. [Google Scholar] [CrossRef]
- Fei-Fei, J. A theory of interdecadal climate variability of the North Pacific ocean–Atmosphere system. J. Clim. 1997, 10, 1821–1835. [Google Scholar]
- Dima, M.; Lohmann, G. A hemispheric mechanism for the Atlantic Multidecadal Oscillation. J. Clim. 2007, 20, 2706–2719. [Google Scholar] [CrossRef]
- Kundzewicz, Z.W.; Graczyk, D.; Maurer, T.; Pińskwar, I.; Radziejewski, M.; Svensson, C.; Szwed, M. Trend detection in river flow time series: 1. Annual maximum flow. Hydrol. Sci. J. 2005, 50, 797–810. [Google Scholar] [CrossRef]
- Kundzewicz, Z.W.; Kanae, S.; Seneviratne, S.I.; Handmer, J.; Nicholls, N.; Peduzzi, P.; Mechler, R.; Bouwer, L.M.; Arnell, N.; Mach, K.; et al. Flood risk and climate change: Global and regional perspectives. Hydrol. Sci. J. 2014, 59, 1–28. [Google Scholar] [CrossRef]
- Prudhomme, C.; Genevier, M. Can atmospheric circulation be linked to flooding in Europe? Hydrol. Proc. 2011, 25, 1180–1190. [Google Scholar] [CrossRef]
- Burn, D.H.; Arnell, N.W. Synchronicity in global flood responses. J. Hydrol. 1993, 144, 381–404. [Google Scholar] [CrossRef]
- Kundzewicz, Z.W.; Pińskwar, I.; Brakenridge, G.R. Large floods in Europe, 1985–2009. Hydrol. Sci. J. 2013, 58, 1–7. [Google Scholar] [CrossRef]
- Kundzewicz, Z.W.; Pińskwar, I.; Brakenridge, G.R. Changes in river flood hazard in Europe–a review. Hydrol. Res. 2018, 49, 294–302. [Google Scholar] [CrossRef]
- Hartmann, H.; Snow, J.A.; Stein, S.; Su, B.; Zhai, J.; Jiang, T.; Krysanova, V.; Kundzewicz, Z.W. Predictors of precipitation for improved water resources management in the Tarim river basin: Creating a seasonal forecast model. J. Arid Environ. 2016, 125, 31–42. [Google Scholar] [CrossRef]
- Lee, J.H.; Ramirez, J.A.; Kim, T.W.; Julien, P.Y. Variability, teleconnection, and predictability of Korean precipitation in relation to large scale climate indices. J. Hydrol. 2019, 568, 12–25. [Google Scholar] [CrossRef]
- Quagraine, K.A.; Hewitson, B.; Jack, C.; Pinto, I.; Lennard, C. A methodological approach to assess the co-behavior of climate processes over Southern Africa. J. Clim. 2019, 32, 2483–2495. [Google Scholar] [CrossRef]
- Wang, L.; Chen, W.; Huang, R. Interdecadal modulation of PDO on the impact of ENSO on the east Asian winter monsoon. Geophys. Res. Lett. 2008, 35, L20702. [Google Scholar] [CrossRef]
- Chan, J.C.L.; Zhou, W. PDO, ENSO and the early summer monsoon rainfall over south China. Geophys. Res. Lett. 2005, 32, L08810. [Google Scholar] [CrossRef]
- Chiew, F.H.S.; McMahon, T.A. Global ENSO-streamflow teleconnection, streamflow forecasting and interannual variability. Hydrol. Sci. J. 2002, 47, 505–522. [Google Scholar] [CrossRef]
- Pociask-Karteczka, J. River hydrology and the North Atlantic Oscillation: A general review. Ambio 2006, 35, 312–314. [Google Scholar] [CrossRef]
- Wrzesiński, D.; Paluszkiewicz, R. Spatial differences in the impact of the North Atlantic Oscillation on the flow of rivers in Europe. Hydrol. Res. 2011, 42, 30–39. [Google Scholar] [CrossRef]
- Ruiz-Villanueva, V.; Stoffel, M.; Wyżga, B.; Kundzewicz, Z.W.; Czajka, B.; Niedźwiedź, T. Decadal variability of floods in the northern foreland of the Tatra Mountains. Reg. Environ. Chang. 2016, 16, 603–615. [Google Scholar] [CrossRef]
- Sun, X.; Renard, B.; Thyer, M.; Westra, S.; Lang, M. A global analysis of the asymmetric effect of ENSO on extreme precipitation. J. Hydrol. 2015, 530, 51–65. [Google Scholar] [CrossRef]
- Ward, P.J.; Eisner, S.; Flörke, M.; Dettinger, M.D.; Kummu, M. Annual flood sensitivities to El Niño–Southern Oscillation at the global scale. Hydrol. Earth Sys. Sci. 2014, 18, 47–66. [Google Scholar] [CrossRef]
- Ward, P.J.; Jongman, B.; Kummu, M.; Dettinger, M.D.; Sperna Weiland, F.C.; Winsemius, H.C. Strong influence of El Niño Southern Oscillation on flood risk around the world. PNAS 2014, 111, 15659–15664. [Google Scholar] [CrossRef] [PubMed]
- Emerton, R.; Cloke, H.L.; Stephens, E.M.; Zsoter, E.; Woolnough, S.J.; Pappenberger, F. Complex picture for likelihood of ENSO-driven flood hazard. Nat. Comm. 2017, 8, 14796. [Google Scholar] [CrossRef] [PubMed]
- Hodgkins, G.A.; Whitfield, P.H.; Burn, D.H.; Hannaford, J.; Renard, B.; Stahl, K.; Fleig, A.K.; Madsen, H.; Mediero, L.; Korhonen, J.; et al. Climate-driven variability in the occurrence of major floods across North America and Europe. J. Hydrol. 2017, 552, 704–717. [Google Scholar] [CrossRef]
- Räsänen, T.A.; Kummu, M. Spatiotemporal influences of ENSO on precipitation and flood pulse in the Mekong River Basin. J. Hydrol. 2013, 476, 154–168. [Google Scholar] [CrossRef]
- Ward, P.J.; Kummu, M.; Lall, U. Flood frequencies and durations and their response to El Niño Southern Oscillation: Global analysis. J. Hydrol. 2016, 539, 358–378. [Google Scholar] [CrossRef]
- Najibi, N.; Devineni, N. Recent trends in the frequency and duration of global floods. Earth Sys. Dyn. 2018, 9, 757–783. [Google Scholar] [CrossRef]
- Dong, B.; Dai, A. The influence of the Interdecadal Pacific Oscillation on temperature and precipitation over the globe. Clim. Dyn. 2015, 45, 2667. [Google Scholar] [CrossRef]
- Lau, K.M.; Weng, H.Y. Recurrent teleconnection patterns linking summertime precipitation variability over East Asia and North America. J. Meteorol. Soc. Jpn. 2002, 80, 1309–1324. [Google Scholar] [CrossRef]
- Kripalani, R.H.; Kulkarni, A. Climatic impact of El Niño/La Niña on the Indian monsoon: A new perspective. Weather 1997, 52, 39–46. [Google Scholar] [CrossRef]
- Lv, A.F.; Qu, B.; Jia, S.F.; Zhu, W.B. Influence of three phases of El Nino-Southern Oscillation on daily precipitation regimes in China. Hydrol. Earth Sys. Sci. 2019, 23, 883–896. [Google Scholar] [CrossRef]
- Cheng, Q.P.; Gao, L.; Zuo, X.A.; Zhong, F.L. Statistical analyses of spatial and temporal variabilities in total, daytime, and nighttime precipitation indices and of extreme dry/wet association with large-scale circulations of Southwest China, 1961–2016. Atmos. Res. 2019, 219, 166–182. [Google Scholar] [CrossRef]
- Wang, S.; Yuan, X. Extending seasonal predictability of Yangtze River summer floods. Hydrol. Earth Sys. Sci. Discuss. 2018, 22, 4201–4211. [Google Scholar] [CrossRef]
- Zhang, Q.; Xu, C.; Jiang, T.; Wu, Y. Possible influence of ENSO on annual maximum streamflow of the Yangtze River, China. J. Hydrol. 2007, 333, 265–274. [Google Scholar] [CrossRef]
- Tong, J.; Qiang, Z.; Deming, Z.; Yijin, W. Yangtze floods and droughts (China) and teleconnections with ENSO activities (1470–2003). Quat. Int. 2006, 144, 29–37. [Google Scholar] [CrossRef]
- Ye, X.C.; Wu, Z.W. Contrasting impacts of ENSO on the interannual variations of summer runoff between the upper and mid-lower reaches of the Yangtze River. Atmosphere 2018, 9, 478. [Google Scholar] [CrossRef]
- Iqbal, A.; Hassan, S.A. ENSO and IOD analysis on the occurrence of floods in Pakistan. Nat. Haz. 2018, 91, 879–890. [Google Scholar] [CrossRef]
- Higashino, M.; Stefan, H.G. Variability and change of precipitation and flood discharge in a Japanese river basin. J. Hydrol. Reg. Stud. 2019, 21, 68–79. [Google Scholar] [CrossRef]
- Chowdhury, M.R. The El Niño-Southern Oscillation (ENSO) and seasonal flooding–Bangladesh. Theor. Appl. Climatol. 2003, 76, 105–124. [Google Scholar] [CrossRef]
- Zhang, Q.; Wanga, Y.; Singh, V.P.; Gu, X.; Kong, D.; Xiao, M. Impacts of ENSO and ENSO Modoki + A regimes on seasonal precipitation variations and possible underlying causes in the Huai River basin, China. J. Hydrol. 2016, 533, 308–319. [Google Scholar] [CrossRef]
- Liu, J.; Zhang, Q.; Singh, V.P.; Gu, X.; Shi, P. Nonstationarity and clustering of flood characteristics and relations with the climate indices in the Poyang Lake basin, China. Hydrol. Sci. J. 2017, 11. [Google Scholar] [CrossRef]
- Cao, Q.; Hao, Z.; Yuan, F.; Su, Z.; Berndtsson, R.; Hao, J.; Nyima, T. Impact of ENSO regimes on developing- and decaying-phase precipitation during rainy season in China. Hydrol. Earth Sys. Sci. 2017, 21, 5415–5426. [Google Scholar] [CrossRef]
- Saghafian, B.; Haghnegahdar, A.; Dehghani, M. Effect of ENSO on annual maximum floods and volume over threshold in the southwestern region of Iran. Hydrol. Sci. J. 2017, 62, 1039–1049. [Google Scholar] [CrossRef]
- Delgado, J.M.; Merz, B.; Apel, H. A climate-flood link for the lower Mekong River. Hydrol. Earth Sys. Sci. 2012, 16, 1533–1541. [Google Scholar] [CrossRef]
- Zhang, Q.; Gu, X.; Singh, V.P.; Xiao, M.; Chen, X. Evaluation of flood frequency under non-stationarity resulting from climate indices and reservoir indices in the East River basin, China. J. Hydrol. 2015, 527, 565–575. [Google Scholar] [CrossRef]
- Deng, Y.; Jiang, W.; He, B.; Chen, Z.; Jia, K. Change in intensity and frequency of extreme precipitation and its possible teleconnection with large-scale climate index over the China from 1960 to 2015. J. Geophys. Res. Atmos. 2018, 123, 2068–2081. [Google Scholar] [CrossRef]
- Xiao, M.; Zhang, Q.; Singh, V.P. Influences of ENSO, NAO, IOD and PDO on seasonal precipitation regimes in the Yangtze River basin, China. Int. J. Climatol. 2015, 35, 3556–3567. [Google Scholar] [CrossRef]
- Cullen, H.M.; Kaplan, A.; Arkin, P.A.; Demenocal, P.B. Impact of the North Atlantic Oscillation on Middle Eastern climate and streamflow. Clim. Chang. 2002, 55, 315–338. [Google Scholar] [CrossRef]
- Cayan, D.R.; Redmond, K.T.; Riddle, L.G. ENSO and hydrologic extremes in the western United States. J. Clim. 1999, 12, 2881–2893. [Google Scholar] [CrossRef]
- Corringham, T.W.; Cayan, D.R. The effect of El Niño on flood damages in the Western United States. Weather Clim. Soc. 2019, 11, 489–504. [Google Scholar] [CrossRef]
- Wang, S.-Y.S.; Huang, W.-R.; Hsu, H.-H.; Gillies, R.R. Role of the strengthened El Niño teleconnection in the May 2015 floods over the southern Great Plains. Geophys. Res. Lett. 2015, 42, 8140–8146. [Google Scholar] [CrossRef]
- Munoz, S.E.; Dee, S.G. El Nino increases the risk of lower Mississippi River flooding. Sci. Rep. 2017, 7, 1772. [Google Scholar] [CrossRef] [PubMed]
- Nakamura, J.; Lall, U.; Kushnir, Y.; Robertson, A.W.; Seager, R. Dynamical structure of extreme floods in the U.S. Midwest and the United Kingdom. J. Hydrometeorol. 2013, 14, 485–504. [Google Scholar] [CrossRef]
- Andrews, E.D.; Antweiler, R.C.; Neiman, P.J.; Ralph, F.M. Influence of ENSO on flood frequency along the California Coast. J. Clim. 2004, 17, 337–348. [Google Scholar] [CrossRef]
- Whan, K.; Zwiers, F. The impact of ENSO and the NAO on extreme winter precipitation in North America in observations and regional climate models. Clim. Dyn. 2017, 48, 1401–1411. [Google Scholar] [CrossRef]
- Wang, S.-Y.; Hakala, K.; Gillies, R.R.; Capehart, W.J. The Pacific Quasi-decadal Oscillation (QDO): An important precursor toward anticipating major flood events in the Missouri River Basin? Geophys. Res. Lett. 2014, 41, 991–997. [Google Scholar] [CrossRef]
- Nasser, N.; Devineni, N.; Lu, M. Hydroclimate drivers and atmospheric teleconnections of long duration floods: An application to large reservoirs in the Missouri River Basin. Adv. Water Resour. 2017, 100, 153–167. [Google Scholar]
- Villarini, G.; Goska, R.; Smith, J.A.; Vecchi, G.A. North Atlantic tropical cyclones and U.S. flooding. Bull. Am. Meteorol. Soc. (BAMS) 2014, 95, 1381–1388. [Google Scholar] [CrossRef]
- Dai, A.G. The influence of the inter-decadal Pacific Oscillation on US precipitation during 1923-2010. Clim. Dyn. 2013, 41, 633–646. [Google Scholar] [CrossRef]
- Gurrapu, S.; St. Jacques, J.-M.; Sauchyn, D.J.; Hodder, K.R. The influence of the Pacific Decadal Oscillation on annual floods in the rivers of western Canada. J. Am. Water Resour. Assoc. 2016, 52, 1031–1045. [Google Scholar] [CrossRef]
- Burn, D.H.; Cunderlik, J.M.; Pietroniro, A. Hydrological trends and variability in the Liard River basin. Hydrol. Sci. J. 2004, 49, 53–67. [Google Scholar] [CrossRef]
- Beebee, R.A.; Manga, M. Variation in the relationship between snowmelt runoff in Oregon and ENSO and PDO. J. Am. Water Resour. Assoc. 2004, 40, 1011–1024. [Google Scholar] [CrossRef]
- Whited, D.C.; Lorang, M.S.; Harner, M.J.; Hauer, F.R.; Kimball, J.S.; Stanford, J.A. Climate, hydrologic disturbance, and succession: Drivers of floodplain pattern. Ecology 2007, 88, 940–953. [Google Scholar] [CrossRef] [PubMed]
- Enfield, D.B.; Mestas-Nunez, A.M.; Trimble, P.J. The Atlantic Multidecadal Oscillation and its relation to rainfall and river flows in the continental U.S. Geophys. Res. Lett. 2001, 28, 2077–2080. [Google Scholar] [CrossRef]
- Fortier, C.; Assani, A.; Mesfioui, M.; Roy, A.G. Comparison of the interannual and interdecadal variability of heavy flood characteristics upstream and downstream from dams in inversed hydrologic regime: Case study of Matawin River (Québec, Canada). River Res. Appl. 2011, 27, 1277–1289. [Google Scholar] [CrossRef]
- Valdes-Manzanilla, A. Historical floods in Tabasco and Chiapas during sixteenth–twentieth centuries. Nat. Hazards 2016, 80, 1563–1577. [Google Scholar] [CrossRef]
- Munoz, S.E.; Giosan, L.; Therrell, M.D.; Remo, J.W.F.; Shen, Z.; Sullivan, R.M.; Wiman, C.; O’Donnell, M.; Donnelly, J.P. Climatic control of Mississippi River flood hazard amplified by river engineering. Nature 2018, 556, 95–98. [Google Scholar] [CrossRef]
- Assani, A.A.; Charron, S.; Matteau, M.; Mesfioui, M.; Quessy, J.-F. Temporal variability modes of floods for catchments in the St. Lawrence watershed (Quebec, Canada). J. Hydrol. 2010, 385, 292–299. [Google Scholar] [CrossRef]
- Hamlet, A.F.; Lettenmaier, D.P. Effects of 20th century warming and climate variability on flood risk in the western U.S. Water Resour. Res. 2007, 43, W06427. [Google Scholar] [CrossRef]
- McCabe, G.J., Jr.; Dettinger, M.D. Decadal variations in the strength of ENSO teleconnections with precipitation in the western United States. Int. J. Climatol. 1999, 19, 1399–1410. [Google Scholar] [CrossRef]
- Gobena, A.K.; Gan, T.Y. Low-frequency variability in southwestern Canadian streamflow: Links to large-scale climate anomalies. Int. J. Climatol. 2006, 26, 1843–1869. [Google Scholar] [CrossRef]
- Jain, S.; Lall, U. Floods in a changing climate: Does the past represent the future? Water Resour. Res. 2001, 37, 3193–3205. [Google Scholar] [CrossRef]
- Jain, S.; Lall, U. Magnitude and timing of annual maximum floods: Trends and large-scale climatic associations for the Blacksmith Fork River, Utah. Water Resour. Res. 2000, 36, 3641–3651. [Google Scholar] [CrossRef]
- Méndez, M.; Magaña, V. Regional aspects of prolonged meteorological droughts over Mexico and Central America. J. Clim. 2010, 23, 1175–1188. [Google Scholar] [CrossRef]
- Pascolini-Campbella, M.; Seagerb, R.; Pinsonc, A.; Cook, B.I. Covariability of climate and streamflow in the Upper Rio Grande from interannual to interdecadal timescales. J. Hydrol. Reg. Stud. 2017, 13, 58–71. [Google Scholar] [CrossRef]
- Valdes-Manzanilla, A. Effect of climatic oscillations on flood occurrence on Papaloapan river, México, during the 1550–2000 period. Nat. Haz. 2016, 94, 167–180. [Google Scholar] [CrossRef]
- Mazouz, R.; Assani, A.A.; Quessy, J.-F.; Légaré, G. Comparison of the interannual variability of spring heavy floods characteristics of tributaries of the St. Lawrence river in Quebec (Canada). Adv. Water Resour. 2012, 35, 110–120. [Google Scholar] [CrossRef]
- Archfield, S.A.; Hirsch, R.M.; Viglione, A.; Blöschl, G. Fragmented patterns of flood change across the United States. Geophys. Res. Lett. 2016, 43. [Google Scholar] [CrossRef]
- Mallakpour, I.; Villarini, G. Investigating the relationship between the frequency of flooding over the central United States and large-scale climate. Adv. Water Resour. 2016, 92, 159–171. [Google Scholar] [CrossRef]
- Isla, F.I. ENSO-triggered floods in South America: Correlation between maximum monthly discharges during strong events. Hydrol. Earth Syst. Sci. Discuss. 2018, 1–13. [Google Scholar] [CrossRef]
- Isla, F.I.; Toldo Junior, E.E. ENSO impacts on Atlantic watersheds of South America. Quat. Environ. Geosci. 2013, 4, 34–41. [Google Scholar] [CrossRef]
- Guevara-Murua, A.; Williams, C.A.; Hendy, E.J.; Imbach, P. 300 years of hydrological records and societal responses to droughts and floods on the Pacific coast of Central America. Clim. Past 2018, 14, 175–191. [Google Scholar] [CrossRef]
- Depetris, P.J. The Parana River under extreme flooding: A hydrological and hydro-geochemical insight. Interciencia 2007, 32, 656–662. [Google Scholar]
- Prieto, M.R. ENSO signals in South America: Rains and floods in the Paraná River region during colonial times. Clim. Chang. 2007, 83, 39–54. [Google Scholar] [CrossRef]
- Arteaga, K.; Tutasi, P.; Jiménez, R. Climatic variability related to El Niño in Ecuador–a historical background. Adv. Geosci. 2006, 6, 237–241. [Google Scholar] [CrossRef]
- Houston, J. Variability of precipitation in the Atacama Desert: Its causes and hydrological impact. Int. J. Climatol. 2006, 26, 2181–2198. [Google Scholar] [CrossRef]
- Borges, P.D.; Bernhofer, C.; Rodrigues, R. Extreme rainfall indices in Distrito Federal, Brazil: Trends and links with El Nino Southern Oscillation and Madden-Julian Oscillation. Int. J. Climatol. 2018, 38, 4550–4567. [Google Scholar] [CrossRef]
- Micevski, T.; Franks, S.W.; Kuczera, G. Multidecadal variability in coastal eastern Australian flood data. J. Hydrol. 2006, 327, 219–225. [Google Scholar] [CrossRef]
- Franks, S.W. Identification of a change in climate state using regional flood data. Hydrol. Earth Sys. Sci. 2002, 6, 11–16. [Google Scholar] [CrossRef]
- Franks, S.W.; Kuczera, G. Flood frequency analysis: Evidence and implications of secular climate variability, New South Wales. Water Resour. Res. 2002, 38, 1062. [Google Scholar] [CrossRef]
- Verdon, D.C.; Wyatt, A.M.; Kiem, A.S.; Franks, S.W. Multidecadal variability of rainfall and streamflow: Eastern Australia. Water Resour. Res. 2004, 40, W10201. [Google Scholar] [CrossRef]
- Cai, W.; van Rensch, P. The 2011 southeast Queensland extreme summer rainfall: A confirmation of a negative Pacific Decadal Oscillation phase? Geophys. Res. Lett. 2012, 39, L08702. [Google Scholar] [CrossRef]
- Kiem, A.S.; Franks, S.W.; Kuczera, G. Multi-decadal variability of flood risk. Geophys. Res. Lett. 2003, 30, 1035. [Google Scholar] [CrossRef]
- Zanardo, S.; Nicotina, L.; Hilberts, A.G.J.; Jewson, S.P. Modulation of economic losses from European floods by the North Atlantic Oscillation. Geophys. Res. Lett. 2019, 46, 2563–2572. [Google Scholar] [CrossRef]
- Benito, G.; Macklin, M.G.; Panin, A.; Rossato, S.; Fontana, A.; Jones, A.F.; Machado, M.J.; Matlakhova, E.; Mozzi, P.; Zielhofer, C. Recurring flood distribution patterns related to short-term Holocene climatic variability. Sci. Rep. 2015, 5, 16398. [Google Scholar] [CrossRef] [PubMed]
- Benito, G.; Macklin, M.G.; Zielhofer, C.; Jones, A.F.; Machado, M.J. Holocene flooding and climate change in the Mediterranean. Catena 2015, 130, 13–33. [Google Scholar] [CrossRef]
- Moreno, A.; Valero-Garcés, B.L.; González-Sampériz, P.; Rico, M. Flood response to rainfall variability during the last 2000 years inferred from the Taravilla Lake record (Central Iberian Range, Spain). J. Paleolimnol. 2008, 40, 943–961. [Google Scholar] [CrossRef]
- Huntingford, C.; Marsh, T.; Scaife, A.A.; Kendon, E.J.; Hannaford, J.; Kay, A.L.; Lockwood, M.; Prudhomme, C.; Reynard, N.S.; Parry, S.; et al. Potential influences on the United Kingdom’s floods of winter 2013/14. Nat. Clim. Chang. 2014, 4, 769–777. [Google Scholar] [CrossRef]
- Hannaford, J.; Marsh, T.J. High-flow and flood trends in a network of undisturbed catchments in the UK. Int. J. Climatol. 2008, 28, 1325–1338. [Google Scholar] [CrossRef]
- Toonen, W.H.J.; Middelkoop, H.; Konijnendijk, T.Y.M.; Macklin, M.G.; Cohen, K.M. The influence of hydroclimatic variability on flood frequency in the Lower Rhine. Earth Surf. Processes Landf. 2016, 41, 1266–1275. [Google Scholar] [CrossRef]
- Schulte, L.; Pena, J.C.; Carvalho, F.; Schmidt, T.; Julia, R.; Llorca, J.; Veit, H. A 2600 year history of floods in the Bernese Alps, Switzerland: Frequencies, mechanisms and climate forcing. Hydrol. Earth Sys. Sci. Discuss. 2015, 12, 3391–3448. [Google Scholar] [CrossRef]
- Wirth, S.B.; Glur, L.; Gilli, A.; Anselmetti, F.S. Holocene flood frequency across the Central Alps–solar forcing and evidence for variations in North Atlantic atmospheric circulation. Quat. Sci. Rev. 2013, 80, 112–128. [Google Scholar] [CrossRef]
- Nobre, G.G.; Jongman, B.; Aerts, J.; Ward, P.J. The role of climate variability in extreme floods in Europe. Environ. Res. Lett. 2017, 12, 084012. [Google Scholar] [CrossRef]
- Rimbu, N.; Dima, M.; Lohmann, G.; Stefan, S. Impacts of the North Atlantic Oscillation and the El Niño–Southern Oscillation on Danube river flow variability. Geophys. Res. Lett. 2004, 31, 1035. [Google Scholar] [CrossRef]
- Ionita, M.; Lohmann, G.; Rimbu, N.; Chelcea, S. Interannual variability of Rhine River streamflow and its relationship with large-scale anomaly patterns in spring and autumn. J. Hydrometeorol. 2012, 13, 172–188. [Google Scholar] [CrossRef]
- Ionita, M.; Rimbu, N.; Lohmann, G. Decadal variability of the Elbe River streamflow. Int. J. Climatol. 2011, 31, 22–30. [Google Scholar] [CrossRef]
- Nicholson, S.E.; Kim, J. The relationship of the El Niño–Southern Oscillation to African rainfall. Int. J. Climatol. 1997, 17, 117–135. [Google Scholar] [CrossRef]
- Li, C.; Chai, Y.; Yang, L.; Li, H. Spatio-temporal distribution of flood disasters and analysis of influencing factors in Africa. Nat. Haz. 2016, 82, 721–731. [Google Scholar] [CrossRef]
- Siderius, C.; Gannon, K.E.; Ndiyoi, M.; Opere, A.; Batisani, N.; Olago, D.; Pardoe, J.; Conway, D. Hydrological response and complex impact pathways of the 2015/2016 El Niño in Eastern and Southern Africa. Earth’s Futur. 2018, 6, 2–22. [Google Scholar] [CrossRef]
- Weldon, D.; Reason, C.J.C. Variability of rainfall characteristics over the South Coast region of South Africa. Theor. Appl. Climatol. 2014, 115, 177–185. [Google Scholar] [CrossRef]
- Alemaw, B.F.; Chaoka, T.R. The 1950-1998 warm ENSO events and regional implications to river flow variability in Southern Africa. Water 2006, 32, 459–464. [Google Scholar]
- Siam, M.S.; Eltahir, E.A.B. Explaining and forecasting interannual variability in the flow of the Nile River. Hydrol. Earth Syst. Sci. 2015, 19, 1181–1192. Available online: www.hydrol-earth-syst-sci.net/19/1181/2015 (accessed on 13 May 2019). [CrossRef]
- Brigadier, L.; Ogwang, B.A.; Ongoma, V.; Ngonga, C.; Nyasa, L. Diagnosis of the 2010 DJF flood over Zambia. Nat. Hazards 2016, 81, 189–201. [Google Scholar] [CrossRef]
- Gamoyo, M.; Reason, C.; Obura, D. Rainfall variability over the East African coast. Theor. Appl. Climatol. 2015, 120, 311–322. [Google Scholar] [CrossRef]
- Mamombe, V.; Kim, W.M.; Choi, Y.S. Rainfall variability over Zimbabwe and its relation to large-scale atmosphere–ocean processes. Int. J. Climatol. 2017, 37, 963–971. [Google Scholar] [CrossRef]
- Jiang, P.; Yu, Z.; Gautam, M.R. Pacific and Atlantic Ocean influence on the spatiotemporal variability of heavy precipitation in the western United States. Glob. Planet. Change 2013, 109, 38–45. [Google Scholar]
- Kundzewicz, Z.W.; Krysanova, V.; Benestad, R.E.; Hov, Ø.; Piniewski, M.; Otto, I.M. Uncertainty in climate change impacts on water resources. Environ. Sci. Pol. 2018, 79, 1–8. [Google Scholar] [CrossRef]
- Gershunov, A.; Barnett, T.P. Interdecadal modulation of ENSO teleconnections. Bull. Am. Meteorol. Soc. 1998, 79, 2715–2726. [Google Scholar] [CrossRef]

© 2019 by the authors. Licensee MDPI, Basel, Switzerland. This article is an open access article distributed under the terms and conditions of the Creative Commons Attribution (CC BY) license (http://creativecommons.org/licenses/by/4.0/).