Article

Kinetics, Mechanism, and Toxicity of Amlodipine Degradation by the UV/Chlorine Process

1
School of Environmental & Safety Engineering, Changzhou University, Changzhou 213164, China
2
Jiangsu Lianfa Environmental Protection New Energy Co., LTD., Nantong 226600, China
*
Author to whom correspondence should be addressed.
Water 2020, 12(11), 3150; https://doi.org/10.3390/w12113150
Submission received: 19 October 2020 / Revised: 9 November 2020 / Accepted: 9 November 2020 / Published: 10 November 2020
(This article belongs to the Section Wastewater Treatment and Reuse)

Abstract

:
The UV/chlorine process, as a new type of AOP (Advanced Oxidation Process), was utilized to treat amlodipine (AML)-containing water. The influencing factors, including chlorine dose, UV intensity, solution initial pH value, and ammonia concentration, were investigated. The degradation of AML in real water and the relative contributions of OH• and Cl• were also studied. Finally, high-resolution mass spectrometry (HRMS) and GC-MS were used to identify the possible degradation products. The results demonstrated that the AML degradation process was fitted with apparent first-order kinetics. AML degradation had a positive correlation with UV intensity and chlorine dose, and a negative correlation with ammonia concentration. In the presence of ammonia nitrogen and DOM, the removal of AML from real water was reduced. OH• made a dominant percentage contribution of 55.7% to the degradation of AML. Sixteen intermediates were detected and identified. A possible degradation mechanism was also proposed. Acute toxicity tests and risk prediction both illustrated that the complete removal of AML does not guarantee the reduction of acute toxicity, but a prolonged degradation promoted the detoxification of toxic intermediates. The UV/chlorine process can be regarded to be an effective method to remove AML and reduce ecological risk.

Graphical Abstract

1. Introduction

It is well known that pharmaceutically active compounds (PhACs) are emerging trace organic contaminants, that are mainly used to diagnose, treat, or prevent diseases in humans and animals [1]. There are approximately 4000 active PhACs, such as sleeping drugs, antibiotics, antidiabetics, painkillers, and anti-inflammatory agents [2,3]. PhACs have entered the environment through human health care and animal disease treatment, and have attracted widespread attention [4]. Due to their widespread use and improper handling, a large amount of drugs can remain in the water environment. A wide variety of PhACs (up to mg·L−1) have been found in soil [5,6], surface water [7], drinking water sources [8], and aquatic organisms [9] all over the world, including Asia, Europe, and USA [10,11,12,13]. Many studies have shown that PhACs can lead to numerous undesirable symptoms, such as developmental, endocrine, and reproductive disorders [14]. Therefore, the determination and regulation of PhACs in water has become a pressing problem to be resolved in many countries and regions.
As a chlorine-derivate treatment technology, the UV/chlorine process can inactivate water-borne pathogens, and degrade trace organic contaminants, thereby achieving multiple-barrier disinfection and reducing secondary pollution [15]. UV light has been used to irradiate free chlorine to generate two types of active radicals with high oxidation potential, including chlorine radicals (Cl•) and hydroxyl radicals (OH•) [16]. The UV/chlorine process has been shown to be able to remove typical PhAC pollutants such as ibuprofen, carbamazepine, and atrazine [15,17,18]. The UV/chlorine process has potential application prospects for water treatment.
Amlodipine (AML) is a kind of calcium channel blocker (CCB) that can inhibit the flow of calcium ions into cardiac muscles and vascular smooth muscles [19]. AML is widely utilized to treat angina, arrhythmias, high blood pressure, and other heart diseases [20]. Due to its incomplete removal by wastewater treatment plants (WWTPs) and final discharge, AML has been found in drinking water sources and WWTPs in recent years, with concentrations up to 510.0 ng·L−1 [21,22,23]. Research has illustrated that excessive AML in aqueous environments can cause ecological damage [24]. For example, AML in recycled water can be absorbed by aquatic organisms and gather in their bodies with a half-life of more than 117 h and a bioconcentration factor of over 16 [25], which means that AML has poses a potential ecological risk to the humans. However, few studies have investigated AML control and removal in water bodies; therefore, they need to be further investigated.
The objective of this study was to investigate the influencing parameters and mechanism of AML degradation by the UV/chlorine process. The main reaction parameters were evaluated, including chlorine dose, UV light intensity, solution initial pH value, and ammonia concentration. The degradation effect of AML in real water and the relative contributions of OH• and Cl• were also explored. The degradation products were analyzed using an HRMS Q-E Plus Orbitrap and GC-MS. Risk assessment during AML degradation was also performed.

2. Materials and Methods

2.1. Chemicals

Sodium hypochlorite solution (NaClO), nitrobenzene (NB), formic acid (HPLC grade), and derivative agent (BSTFA/TMCS, 99:1) were purchased from Aladdin Reagent Co, Ltd. (Shanghai, China). AML was purchased from Energy Chemical Reagent (Shanghai, China). Hydrogen peroxide (H2O2, 30%) was purchased from Lingfeng Reagent Co, Ltd. (Shanghai, China). Dichloromethane (DCM) was purchased from Yonghua Reagent Co, Ltd. (Suzhou, China). Analytical reagents, including Na2SO3, NaH2PO4·2H2O, Na2HPO4·12H2O, HCl, NaOH, were obtained from Sinopharm Reagent (Shanghai, China). Methanol (HPLC grade) was acquired from Sigma-Aldrich Corp (St. Louis, MO, USA). Enrichment and desalination of water samples were performed by solid phase extraction (SPE) using a Generik H2P cartridge (200 mg/6 cc, Sepax Technologies, China). The available chlorine content (620 mg·L−1 as Cl2) was detected according to the DPD/FAS test method [16]. The NaClO solution was kept away from light at 4 °C. The Na2SO3 solution (40 mM) was prepared periodically. The water for the reagent preparation was ultrapure Ultrapure water using a Milli-Q purifier (resistivity of 18.3 mΩ·cm).

2.2. UV Irradiation

A low-pressure mercury lamp (Philips, China, 75 W) was used in a photochemical device, which applied monochromatic UV radiation at 254 nm. The lamp was placed in the centerline of circular glassware containing reaction solutions (50 mL). A magnetic stirrer was used to ensure the homogeneity of the reaction. The UV intensity was controlled by changing the distance between the solution surface and the low-pressure mercury lamp. The light from the lamp could be viewed as parallel light. Each time the distance was changed, a UV radiometer (PIFBNU, Beijing, China) was used to determine at least 9 positions on the surface of the glass container. The final UV intensity was the average intensity of 9 positions. To stabilize the UV intensity, the UV lamp was turned on for at least 30 min before the experiment.

2.3. Kinetic Studies

Kinetic tests were carried out in the photoreactor described above. HCl, NaOH, and 10 mM phosphate buffer were used to maintain or adjust the pH value of the solution. A PHS-3C acidometer (REX, Shanghai, China) was used to determine the pH value.
A certain volume of the NaClO solution was added to AML water samples; then, the mercury lamp to start the experiments. At the different time intervals, one milliliter of an AML sample was collected, and immediately after collection, excessive Na2SO3 was added to quench the residual chlorine. Control tests of AML degradation by UV alone and dark chlorination were performed using a similar approach without chlorine and UV irradiation, respectively. Other tests, including NB degradation via the UV/chlorine process or the UV/H2O2 process, and AML degradation in real water, were also performed using the same procedure. Then, HPLC-MS/MS was used to determine the sample concentration. The experiment was repeated three times to obtain the average value.
AML water samples were determined by HPLC-MS/MS (Thermo UltiMate 3000, TSQ Quantum™ Access MAX) coupled to an RP column (Accucore C18, 3.0 × 50 mm). The following parameters were used: mobile phase of H2O (A) and methanol (B), column temperature of 25 °C, gradient elution, flow rate of 0.6 mL·min−1, precursor/product ion pairs 408.9/237.7 m/z, positive scan mode, and CE of 28 eV. The gradient profile is as follows: linear gradient 10% of B in 0–2 min, 95% B in 6 min, 95% B in 8 min, and re-equilibration of the column from 8 to 13 min with 10% of B.
Nitrobenzene water samples were detected using an Agilent 1260 HPLC equipped with a diode array detector at 262 nm. A Waters C18 column (4.6 mm × 100 mm) was used for separation at a flow rate of 0.4 mL·min−1. The mobile phase was a mixture of methanol/water at a 70/30 (v/v) ratio.

2.4. Identification of Intermediates (IMs)

AML degradation samples were prepared under the typical conditions of UV/chlorine process given in Section 3.1. The samples were collected in different degradation times, including 10, 20, 30, 40, 50, and 60 min to get all the products in the whole process. The collection was repeated for several times to obtain higher quantities of the products. Enrichment and desalination of degradation samples for LC-MS analysis were performed according to an SPE procedure based on the US EPA standard method 1694 [26]. AML degradation samples were collected at intervals and brought to a volume of 1.5 mL for MS analysis.
Meanwhile, 1.2 L treated water samples were collected and mixed together. The samples were pretreated for GC-MS analysis according to a rotary evaporation procedure. After silanization by BSTFA/TMCS, the AML degradation samples was concentrated to 1.5 mL for analysis of small-molecule acid intermediates.
HRMS Q ExactiveTM Plus QrbitrapTM mass spectrometry (Thermo Scientific., USA) was performed to explain the unknown structure of degradation products. A RP column (Waters T3, 2.1 × 50 mm) was used to separate the relevant components. MS analysis was performed in both positive and negative modes. The parameters for heating electrospray ionization (HESI) were as follows: sheath gas rate of 12 mL·min−1, capillary heat of 320 °C, and spray voltage of 4 kV. The other MS conditions included: a scan range of 70–600 m/z, dynamic exclusion of 5 s, HCD collision energy settings (CE%) 35, and a mass resolution of 70,000. Xcalibur 4.1 software was used for data analysis.
Small-molecule intermediates were identified using a GC-MS instrument (Thermo Trace 1300-ISQ LT) equipped with a C18 column (Thermo TG-624, 30 m × 0.25 mm × 1.4 μm). The helium flow rate was 1.0 mL·min−1, the injection volume was 1 μL, and the inlet temperature was set to 280 °C. The full scan mode was used with a scan range of 30–600 m/z. The following gradient was applied: hold the temperature for 5 min at 50 °C, increase the temperature from 50~180 °C (at a rate of 5 °C·min−1), 180~260 °C (slope of 15 °C·min−1), and finally hold the temperature for 8 min at 260 °C.

2.5. Toxicity Tests and Assessment

The acute toxicity tests were performed using Vibrio fischeri luminescent bacteria. Bioluminescence was detected and recorded to investigate toxicity changes in the AML water samples [27]. The luminescent intensity of Vibrio fischeri was detected using a biotoxicity analyzer (ATD-P1, J&Q Environmental Technologies, Beijing, China). Freeze-dried bacteria were also provided by the same company. The Na2SO3 solution was used as a blank sample. The inhibition rate of bioluminescence could be determined by Equation (1):
I = L 0 L t L 0 × 100 % ,
where I represents the inhibition rate (100%) and L0 and Lt represent the luminescence intensity of the blank, and AML samples, respectively.
ECOSAR (v1.1, EPA) software [28,29] is usually applied to assess the acute toxicity of a target substance. Therefore, the acute toxicity of AML and its degradation products during the process was achieved.

3. Results and Discussion

3.1. AML Degradation by the UV/Chlorine Process

The degradation of AML under three process conditions was compared, including UV irradiation alone (254 nm), dark chlorination, and the UV/chlorine process. As shown in Figure 1, only 8.8% of AML was removed by UV irradiation alone and 41.2% AML was removed by dark chlorination. However, the removal of AML reached 96.8% by the UV/chlorine process after 38 min. It is obvious that the UV/chlorine process evidently improved AML degradation efficiency compared with UV alone and dark chlorination. All the fitted curves between ln(ct/c0) and time retained linear relationship which means that these degradation reactions are suitable for pseudo-first-order kinetics (Equations (2) and (3)), with degradation rate constants ( k app ) of 0.0159, 0.0207, and 0.0680 min1, respectively:
d [ AML ] t d t = k app [ AML ] t ,
k app = ln [ AML ] t [ AML ] 0 t ,
where [AML]0 and [AML]t stand for the AML concentration at 0 s and t s, respectively, μM. k app is the pseudo-first-order apparent rate constant, min−1:
OCl + H 2 O     HOCl + OH ,
HOCl / OCl + AML   products ,
HOCl / OCl h ν   OH / O + Cl .
As mentioned above, it was difficult for AML to be directly photolyzed by UV irradiation alone. During chlorination, moderate degradation of AML occurred mainly because HOCl/OCl can partially react with AML (Equations (4) and (5)). However, during the UV/chlorine process, in addition to direct photolysis and the slight effects of HOCl/OCl, the degradation of AML was significantly increased mainly due to the generation of active species, such as OH• and Cl• (Equation (6)). Among them, OH• is a non-selective radical that can react rapidly with various trace organic contaminants. Cl• is a strong oxidation radical, that has high reactivity with electrophilic functional groups. Therefore, the UV/chlorine process can promote the degradation of AML more effectively than the other processes, due to attributed to the action of OH• and Cl• [15]. The superior degradation of carbamazepine [18] and atrazine [17] in the UV/chlorine process was also based on the same principle.

3.2. Effect of Chlorine Dose

The influences of different chlorine doses on AML degradation via the UV/chlorine process were investigated. As shown in Figure 2, the removal of AML increased from 47.5% to 97.5%; and the corresponding k app increased from 0.0155 to 0.0821 min−1 as the chlorine dose increased from 5 to 40 μM in 38 min. This result indicates that both the removal and the degradation rate constant of AML increased with increasing chlorine dose. With increasing chlorine dose, more radicals (such as OH• and Cl•) were generated under UV irradiation, thereby accelerating the reaction with contaminants [30]. Thus, the degradation of AML was improved.
Furthermore, Figure 2 shows that the chlorine dose and the degradation rate constant exhibited a significant linear relationship ( k app = 1.9 × 10 3 · oxidant , R2 = 0.9668). The effect of the chlorine dose was also similarly observed in diuron degradation by the UV/chlorine process [30].

3.3. Effect of UV Intensity

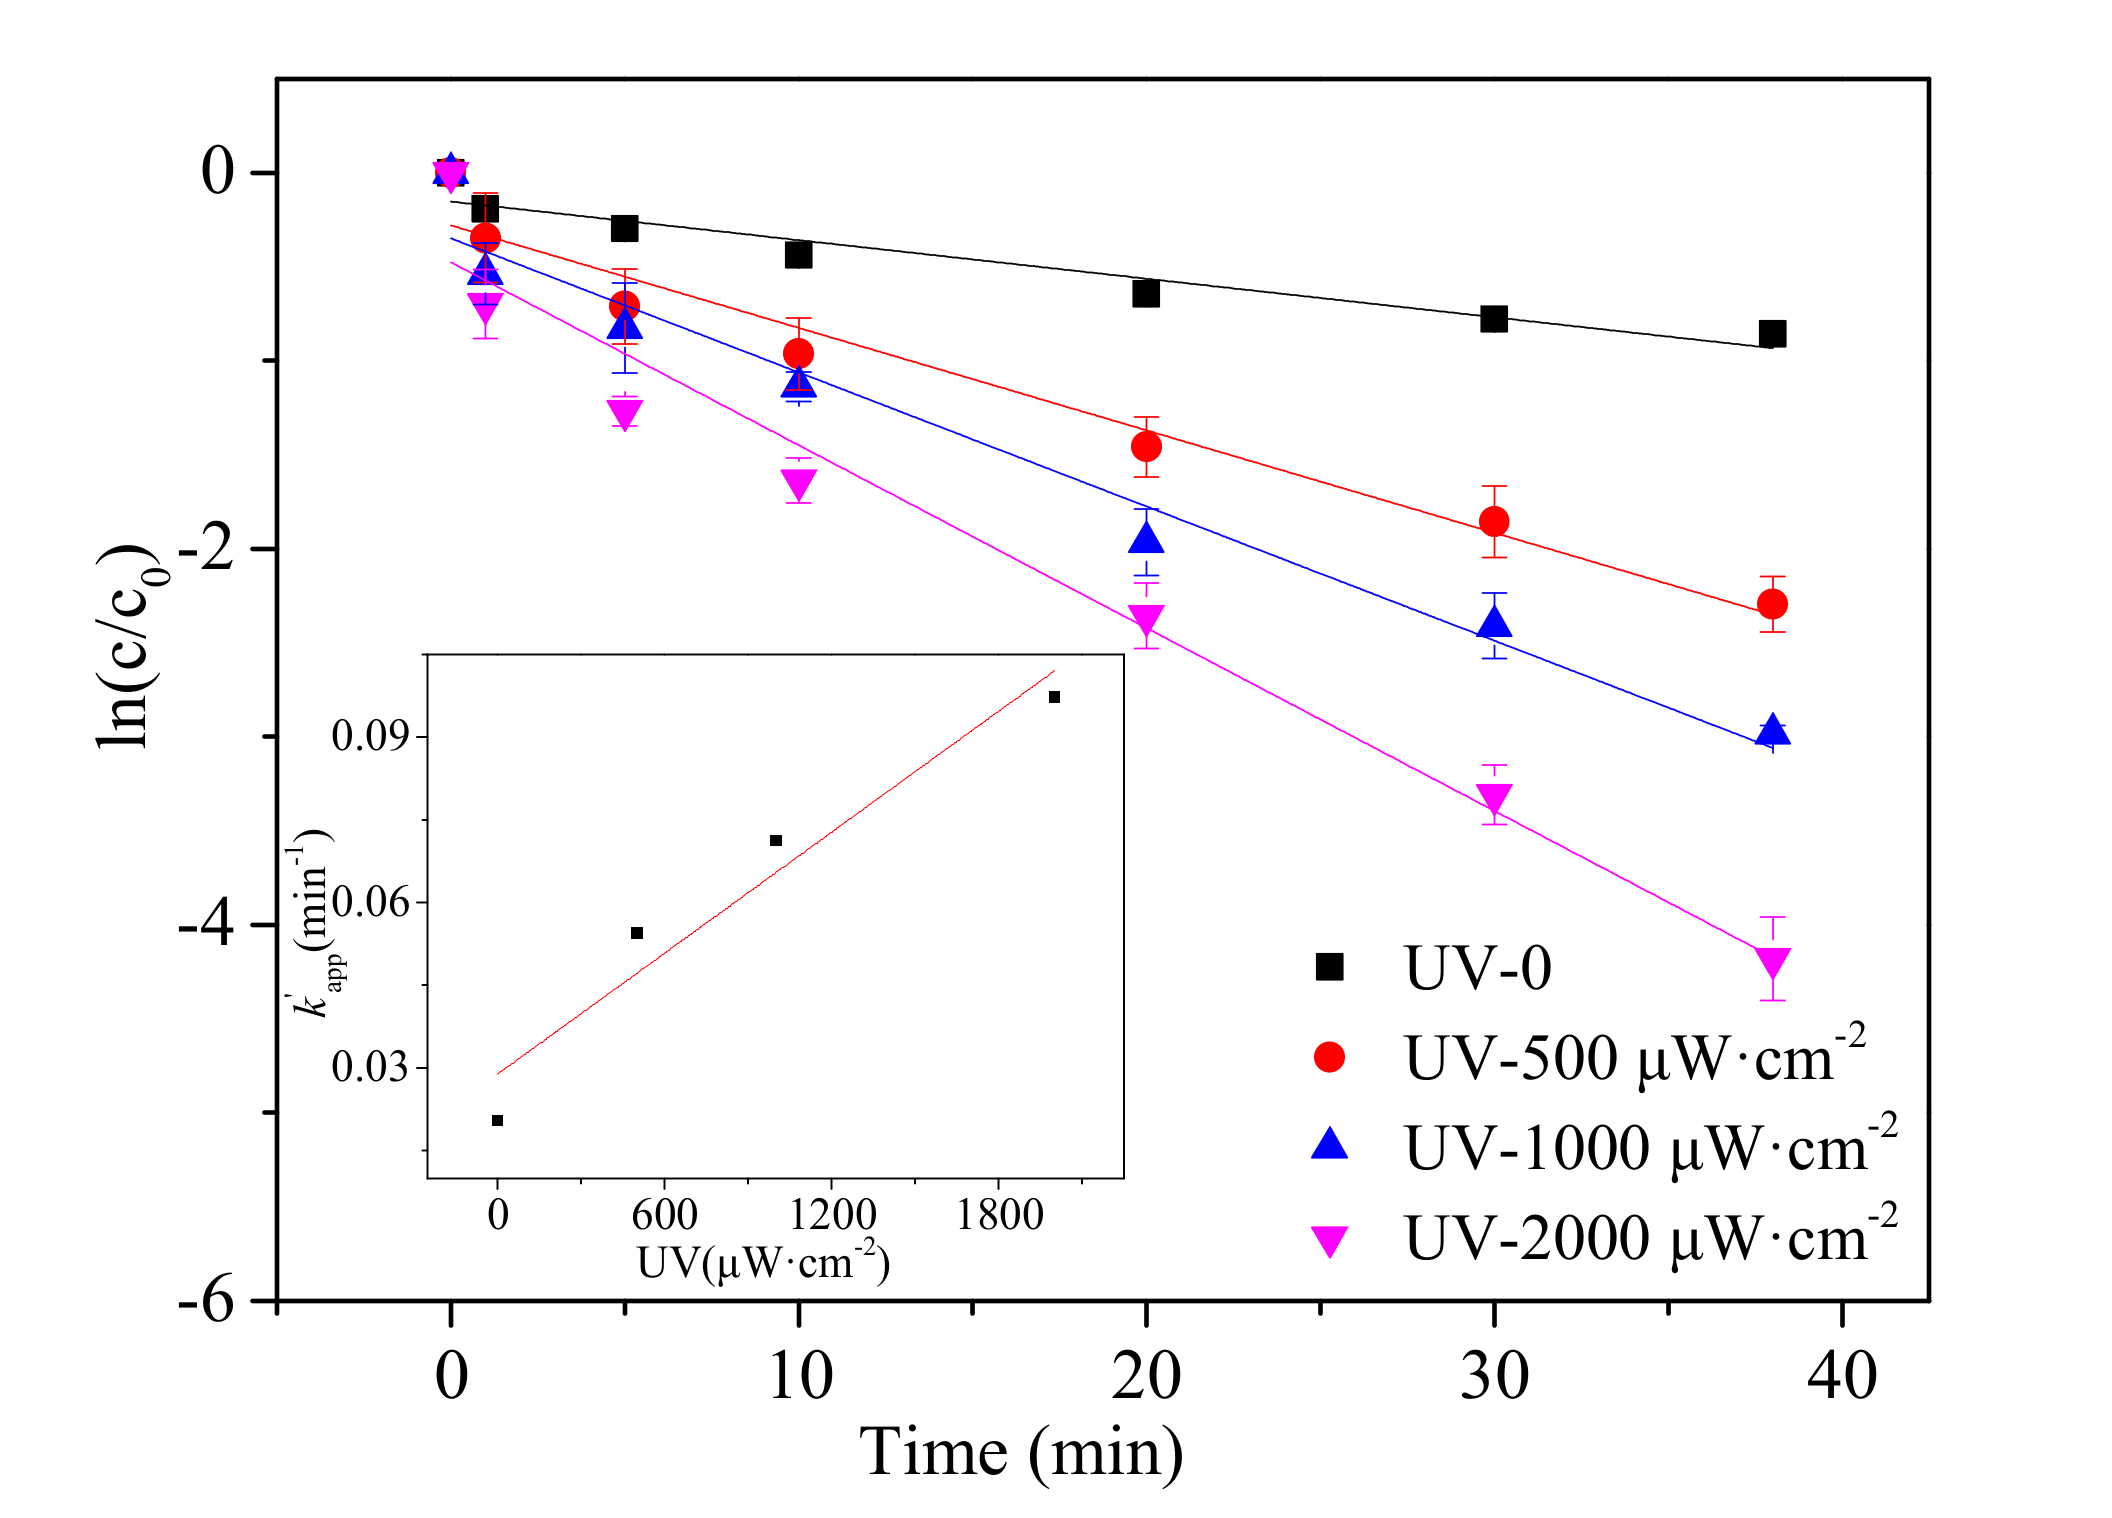
UV intensity is an essential factor in the UV/chlorine process [31]. At a pH value of 7, the influences of varying UV intensities on AML degradation were investigated with a 10 μM initial AML concentration and a 30 μM chlorine dose.
All the test results were successfully fitted with pseudo-first-order reaction kinetics (R2 > 0.93). As shown in Figure 3, as the UV intensity increased from 0 to 2000 µW·cm2, k app apparently improved from 0.0205 to 0.0973 min−1. According to Equation (7) [32,33], k app is related to the UV intensity (I) and quantum yields of AML, HOCl and OCl. However, AML was barely degraded by UV photolysis, so the quantum yield of AML was negligible. In addition, the quantum yields of HOCl and OCl remain constant under different UV intensities [17]. Therefore, AML degradation was directly affected by the UV intensity, and the degradation of AML was enhanced with increasing of UV intensity.
Figure 3 also illustrates the linear regression relationship of k app versus UV intensity ( k app = 4.0 × 10 5 I , R2 = 0.9419), which can be expressed in Equation (8) [34,35]. A similar relationship between the increase in the k app and UV light intensity was also observed in a study of atrazine degradation [17,36]. Therefore, the UV/chlorine process shows a superior degradation capability at a higher UV intensity:
k app =   I n · Φ AML +   Φ HOCl + Φ OCl ,
k app = k F I ,
where I stands for the UV intensity, mol photon min−1; Φ AML , Φ HOCl and Φ OCl are the quantum yields of AML, HOCl and OCl, respectively, mol photon−1; n is the number of photons, mol; and k F stands for the fluence based kinetic constant.

3.4. Effect of pH Value

The pH value of the AML solution is another important factor in the degradation process [37]. AML removal was investigated with pH values ranging from 3 to 11. The other conditions were as follows: 10 μM initial AML concentration, 30 μM chlorine dose, and 500 μW·cm−2 UV intensity.
As shown in Figure 4, the removal of AML over 38 min decreased from 95.2% to 76.6% while the pH value increased from 3 to 11. The reaction rate was high of 0.0723 min−1 at a pH value of 3, and low of 0.0378 min−1 at a pH value of 11. This phenomenon indicated that the degradation of AML was largely enhanced under acidic conditions and inhibited under alkaline conditions. The effect of the pH value was similar to those observed in earlier studies of trichloroethylene, 2-methylisoborneol and benzoic acid [16,38,39]. The different degradations at different pH values were ascribed to the effect of pH on the dissociation of HOCl/OCl [40,41]. HOCl became the dominant oxidant with the decreasing pH. HOCI oxidized AML more quickly than OCl due to its higher oxidation reduction potential. Furthermore, unlike chlorination, HOCl/OCl can generate active radicals under photolysis, and the quantum yield of OH• from HOCl photolysis (1.40) was much higher than that from ClO (0.28). In the present study, OH• is considered to play the most important role among all the radicals in AML degradation. As shown in Equations (11) and (12), the reaction between OCl and OH• was faster than that between HOCl, which indicates a higher radical scavenging effect of OCl [16,42]. Moreover, the whole degradation rate was also affected by the form of contaminants. The amino group in the AML structure has a pKa of 8.6, which means that dissociated amlodipine will be dominant in an acidic solution. Researches showed that higher reaction rate constants can be observed for dissociated species than those for non-dissociated species [14,18,43]. Therefore, acidic conditions will benefit AML degradation:
  Cl   +   OCl Cl   +   ClO                                           k 1 = 8.2 × 10 9   M 1 s 1 ,
Cl   +   HOCl Cl   +   ClO   +   H +                                       k 2 = 3.0 × 10 9   M 1 s 1 ,
OH   +   OCl OH   +   ClO                                             k 3 = 8.8 × 10 9   M 1 s 1 ,
OH   +   HOCl H 2 O   +   ClO                                             k 4 = 2.0 × 10 9   M 1 s 1 .

3.5. Effect of Ammonia Concentration

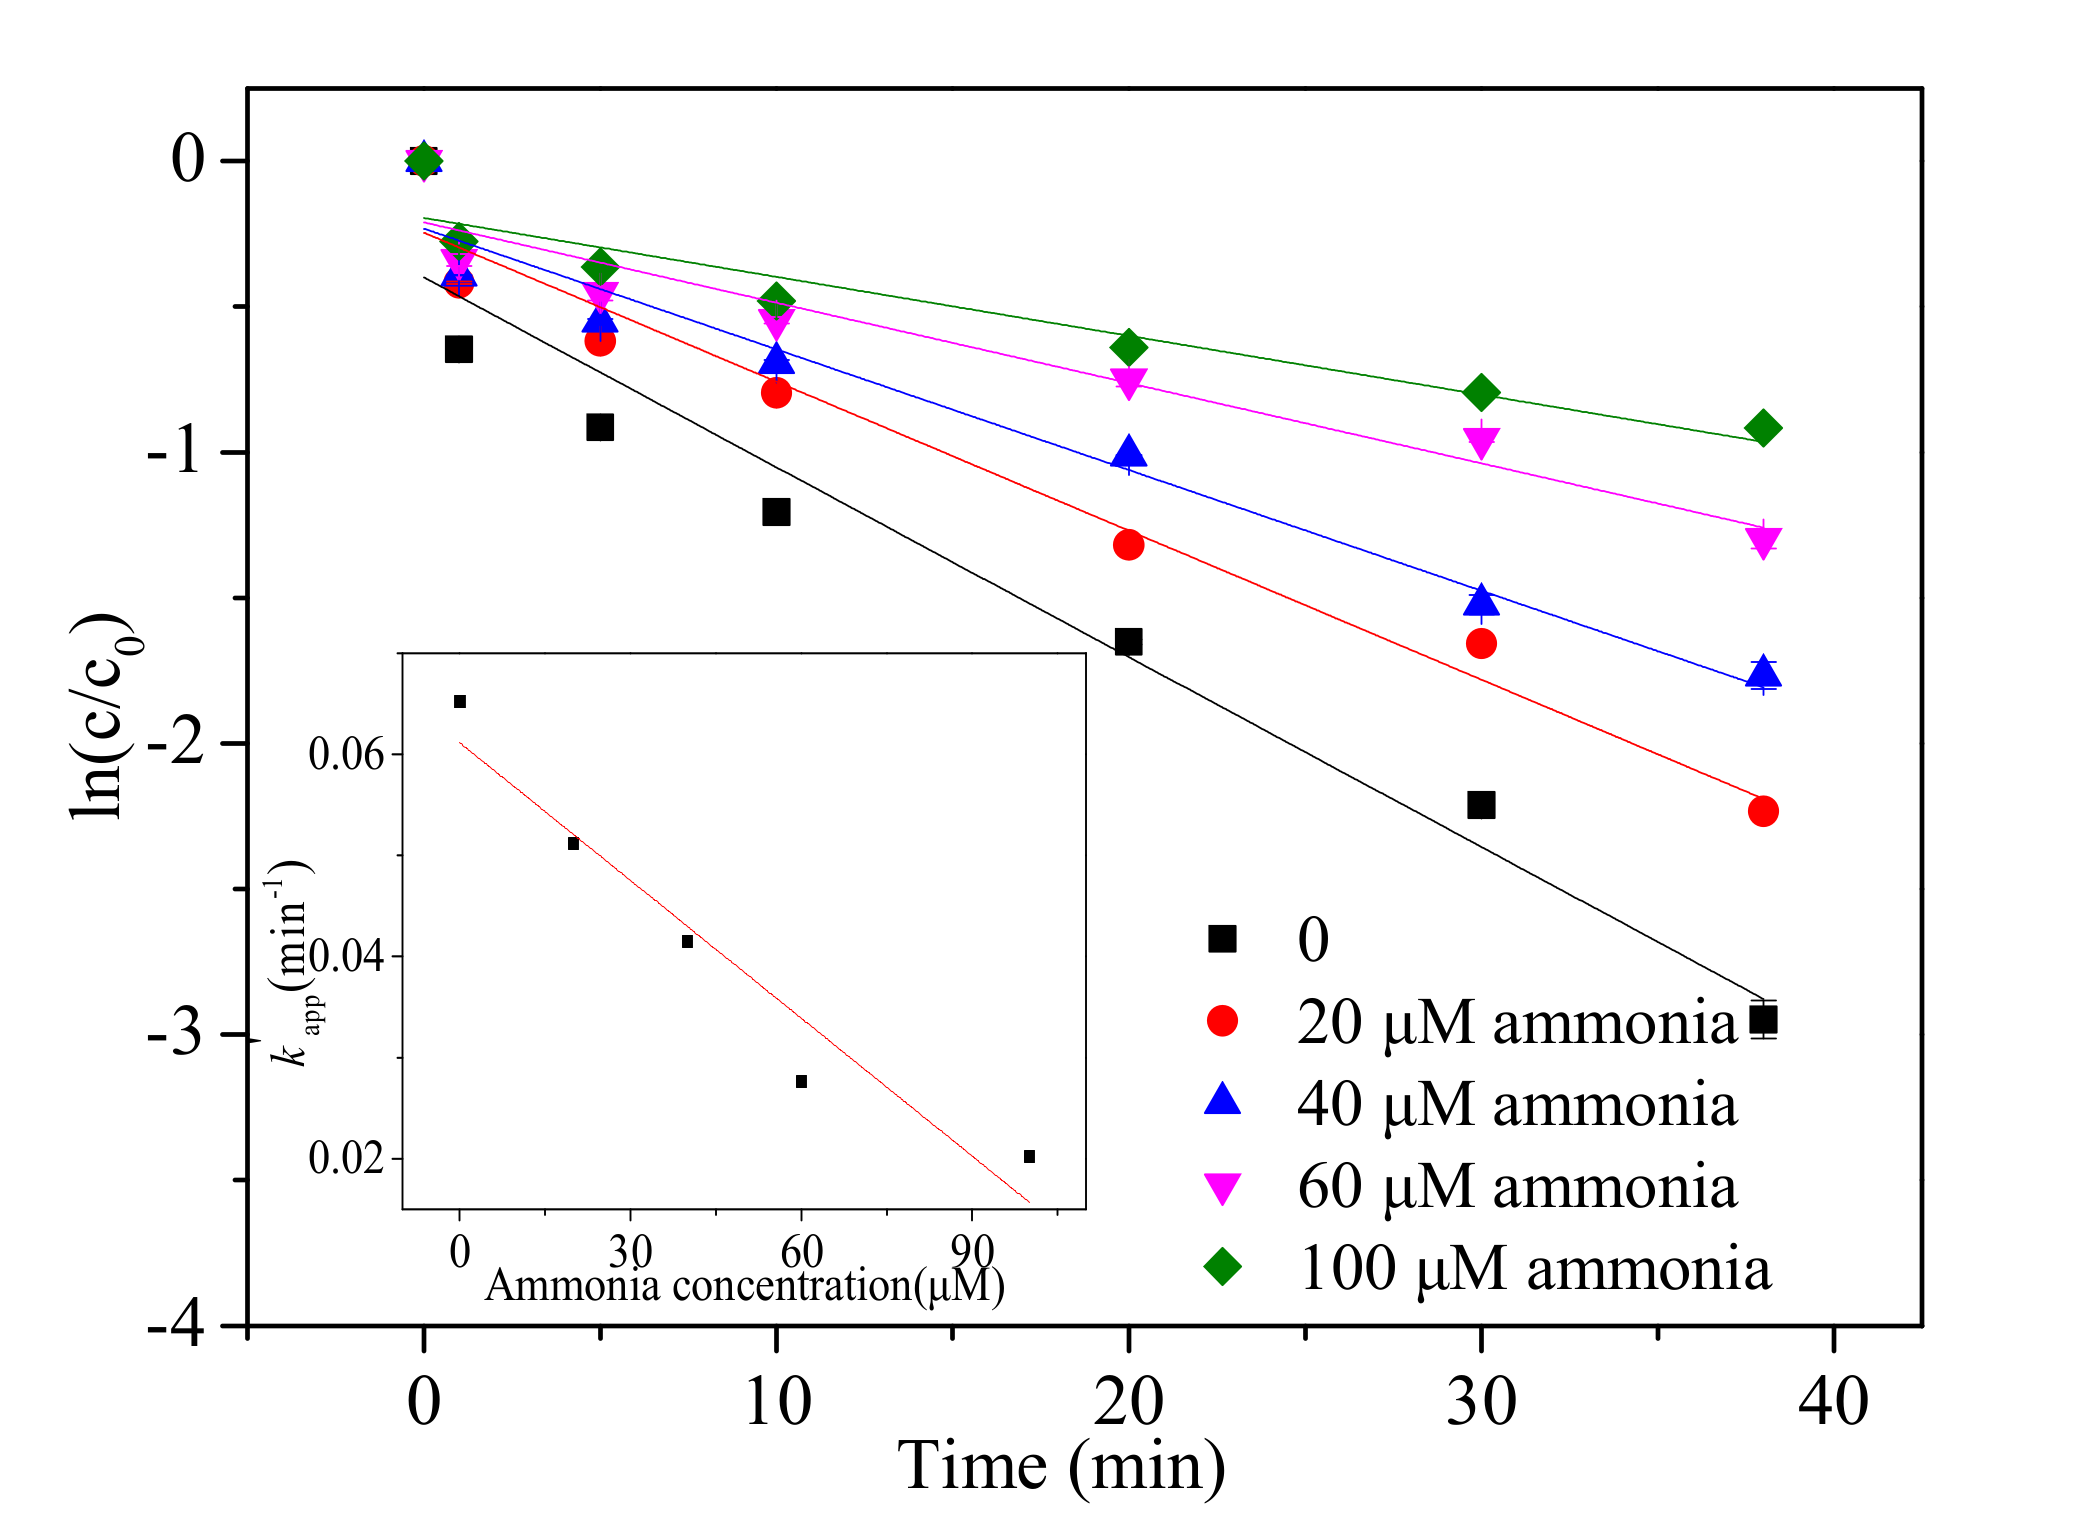
Ammonia (NH4+) is an important parameter that affects the water environment, so the effect of the ammonia concentration on AML degradation was also studied. The other conditions were as follows: 10 μM initial AML concentration, 30 μM chlorine dose, 500 μW·cm−2 UV light intensity, and a pH value of 7.
The reaction results were also in accordance with pseudo-first-order kinetics (Figure 5). However, ammonia in water samples has an unfavorable effect on AML degradation. The removal of AML was 94.7% without ammonia in solution. However, AML removal was reduced to 60.1% when the concentration of ammonia was increased to 100 µM. As the ammonia concentration increased from 0 to 100 μM, the k app decreased from 0.0652 to 0.0202 min−1. Ammonia rapidly reacted with chlorine to form two kinds of inorganic chloramines during the UV/chlorine process, monochloramine (NH2Cl), and dichloramine (NHCl2) [44]. Under neutral conditions, NHCl2 was mainly generated at molar ratios of Cl and N less than 1, which significantly affected the generation of radicals. In addition, compared with radicals, inorganic chloramines have a lower redox potential, which inhibits the degradation of AML [45,46].

3.6. AML Degradation in Real Water by the UV/Chlorine Process

AML degradation in real water was studied and compared with that in ultrapure water to evaluate the effect of background matter. The total phosphorus, COD, ammonia nitrogen and dissolved oxygen of real water were 0.39, 8.07, 0.62 and 5.89 mg·L−1, respectively (Table A1). The initial concentration of AML was 10 μM under both conditions.
As shown in Figure 6, the removal of AML was 85.0% in real water and 97.9% in ultrapure water within 38 min. Combined with the main characteristics of the above-mentioned real water (Table A1) and the effects of the water quality parameters on AML degradation, the relatively high ammonia nitrogen and dissolved organic matter (DOM) in real water were considered to be the main factors leading to the slight decreases in AML degradation and k app in comparison with those in the ultrapure water tests. Ammonia nitrogen increased the consumption of free residual chlorine, while DOM, as a radical scavenger, could consume large amounts of OH• and Cl• [16]. Therefore, the removal of AML was affected by the presence of ammonia nitrogen and DOM. The UV/chlorine process can be considered a better option for removing AML from real water than the other process, especially from water with lower DOM and ammonia nitrogen contents [15,47].

3.7. Relative Contributions of Active Ingredients

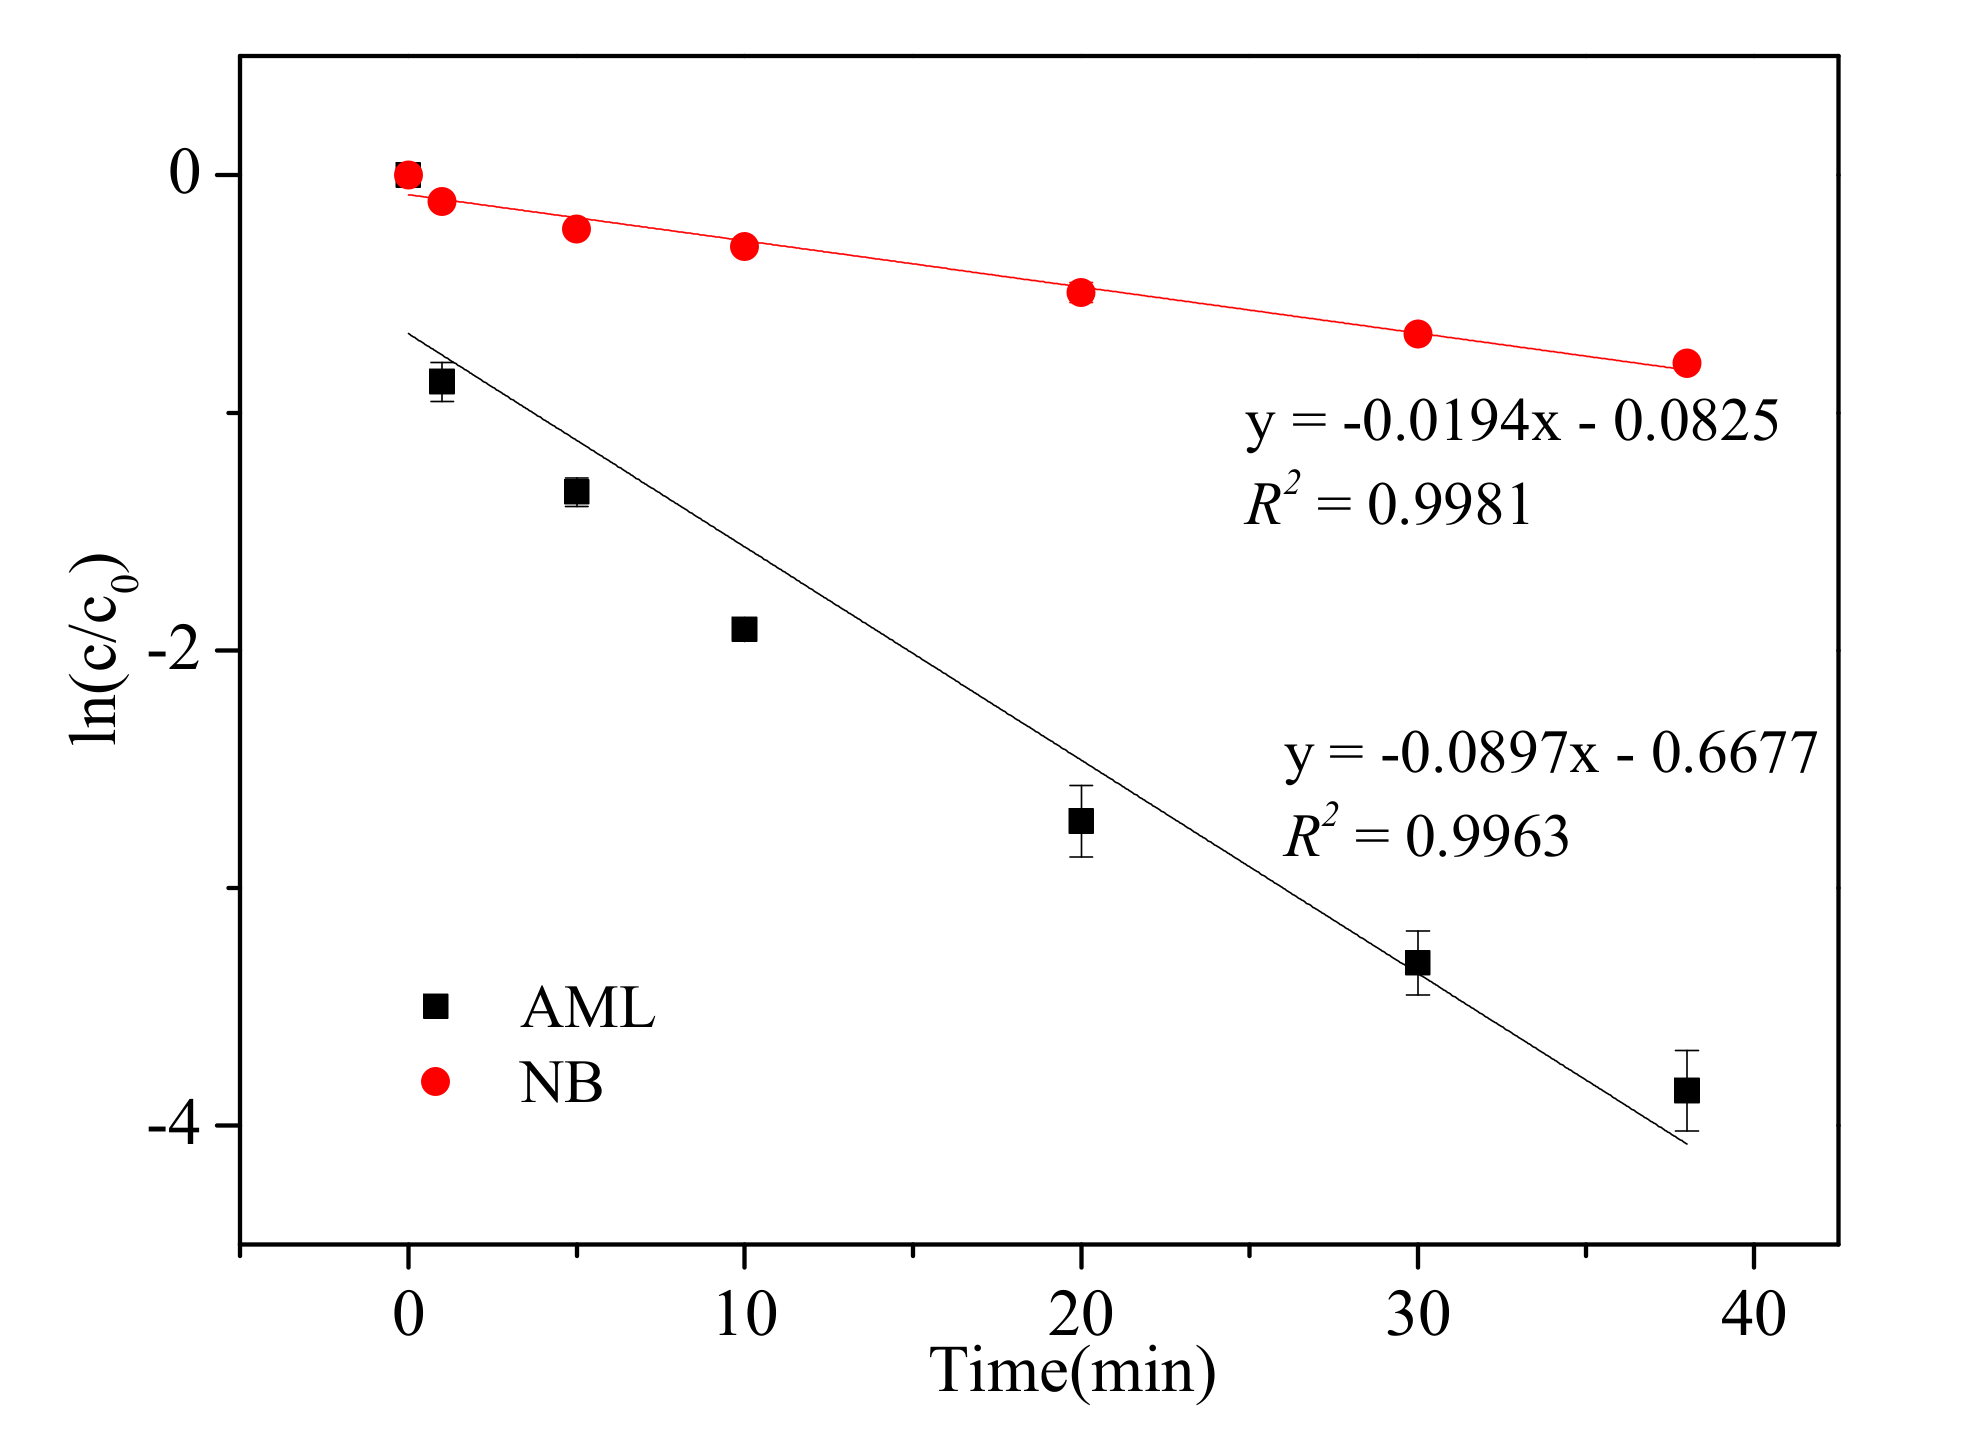
To evaluate the relative contributions of different radicals in the UV/chlorine process, under the same reaction conditions, the degradation of AML was investigated using nitrobenzene (NB) as the radical probe [15] Figure 7 showed the degradation process of AML and NB with the same raction parameters, respectively. As a selective scavenger of OH•, NB selectively reacted with OH• ( k OH - NB   = 3.90 × 10⁹ M−1s−1), and the reaction with Cl• was insignificant. In addition, NB can easily absorb UV light in water. This could further weaken the UV light and result in a decrease in the radical production [30,48]. Based on the steady-state variation in the radical concentrations, the contributions of OH•   ( k OH - AML ) and Cl• ( k Cl - AML )   can be calculated according to Equations (13)–(15):
k NB = k OH - NB [ OH ] SS ,
k OH - AML = k OH - AML [ OH ] SS ,
k Cl - AML = k AML k OH - AML k UV - AML k chlorine - AML k other   radicals - AML ,
where [OH•]ss represents the steady-state concentrations of OH•, k NB and k AML represent the pseudo-first-order rate constant of AML and NB in the UV/chlorine process, respectively. k OH · - AML ( 10.05 × 10 9 M 1 s 1 ) represents the second-order rate constant for the reaction of OH• with AML, which was obtained by competition kinetics (Figure A1). k UV - AML and k other   radicals - AML are the corresponding pseudo first-order rate constants of AML degradation via UV irradiation and other radicals, respectively, which can be ignored in this study due to less effect on AML [33]. k chlorine - AML represents the pseudo first-order rate constants of AML degradation by chlorination ( k chlorine - AML = 0.0152 min−1). Consequently, the calculated relative contributions of Cl•, OH• and chlorine to AML degradation were 27.4%, 55.7%, and 16.9%, respectively. These results illustrated that OH• makes a greater contribution to AML degradation than Cl•. Therefore, OH• plays the dominant role in the degradation of AML among all the radicals in the UV/chlorine process.

3.8. Intermediates Identification and Degradation Mechanism

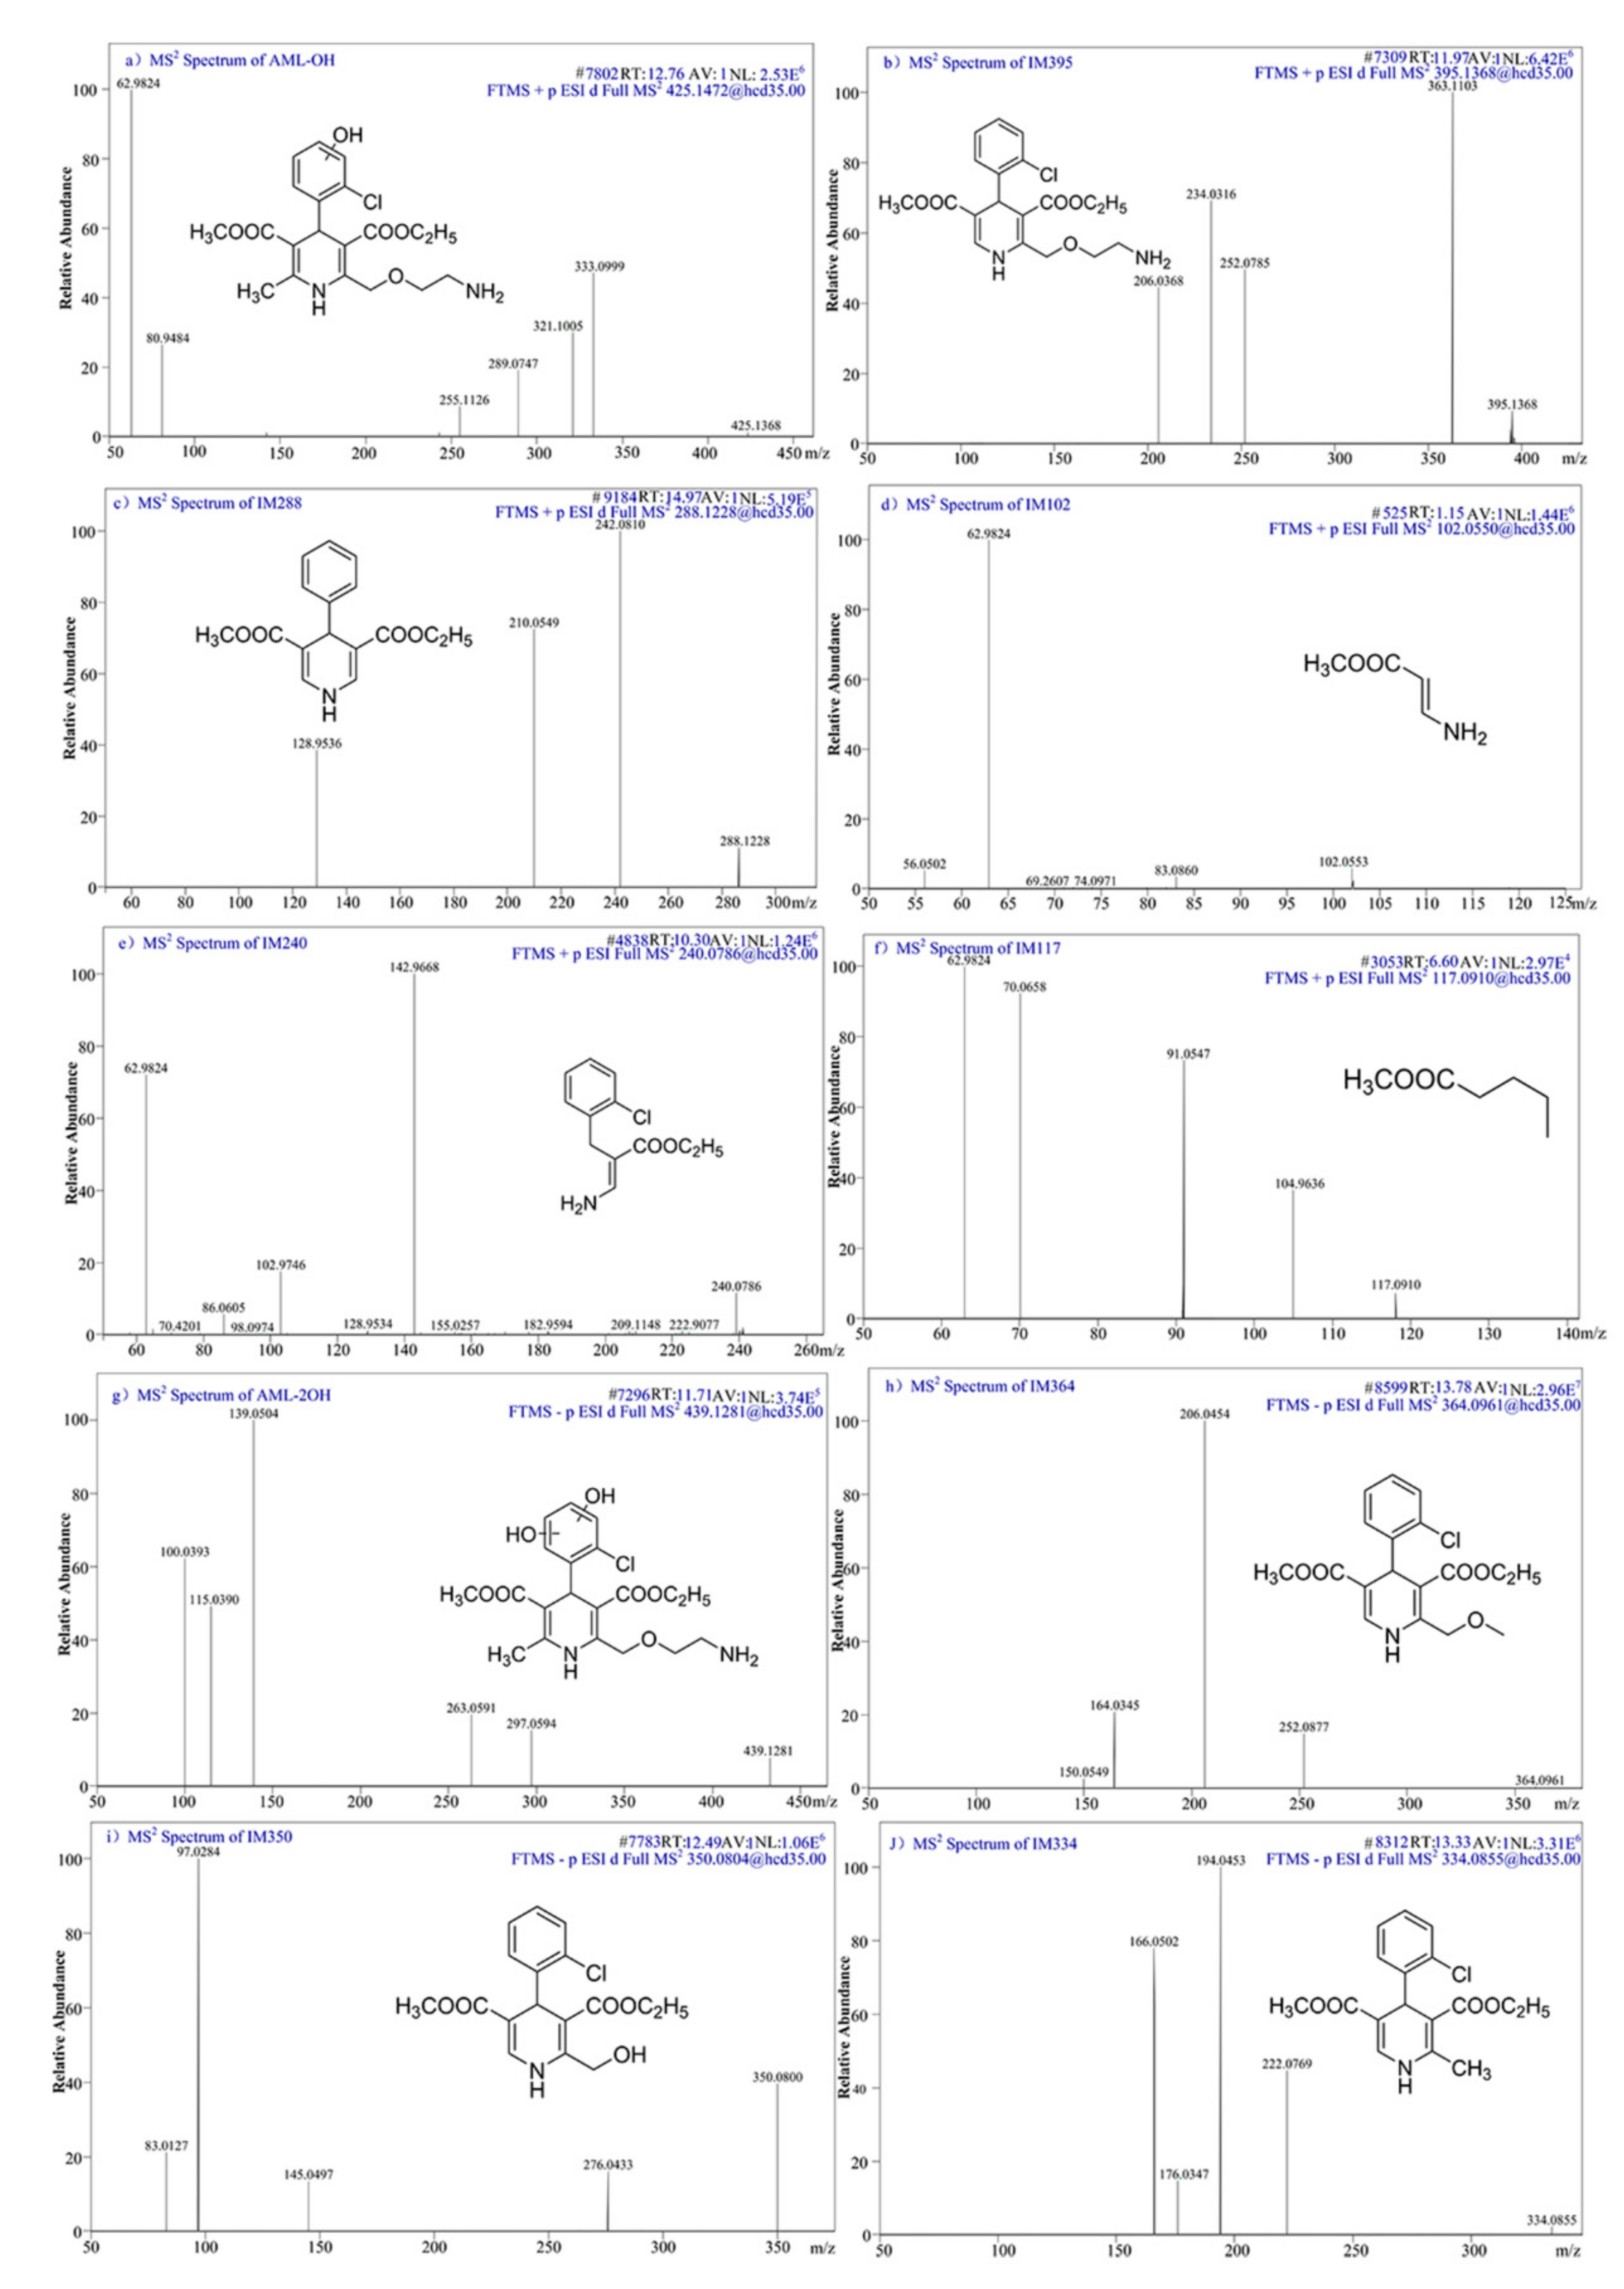
The degradation intermediates of AML in the UV/chlorine process were analyzed by HRMS Q-E Plus Orbitrap LC-MS. Based on the MS and MS2 spectra, twelve degradation intermediates were obtained in both the positive and negative ion modes. The isomeric structures were also determined under different retention times with the same m/z. In addition, four small-molecule acid intermediates in the late stage of AML degradation were also identified by GC-MS. The retention time, molecular formula, and other characteristics of the identified intermediates were summarized in Table 1, Table 2 and Table 3.
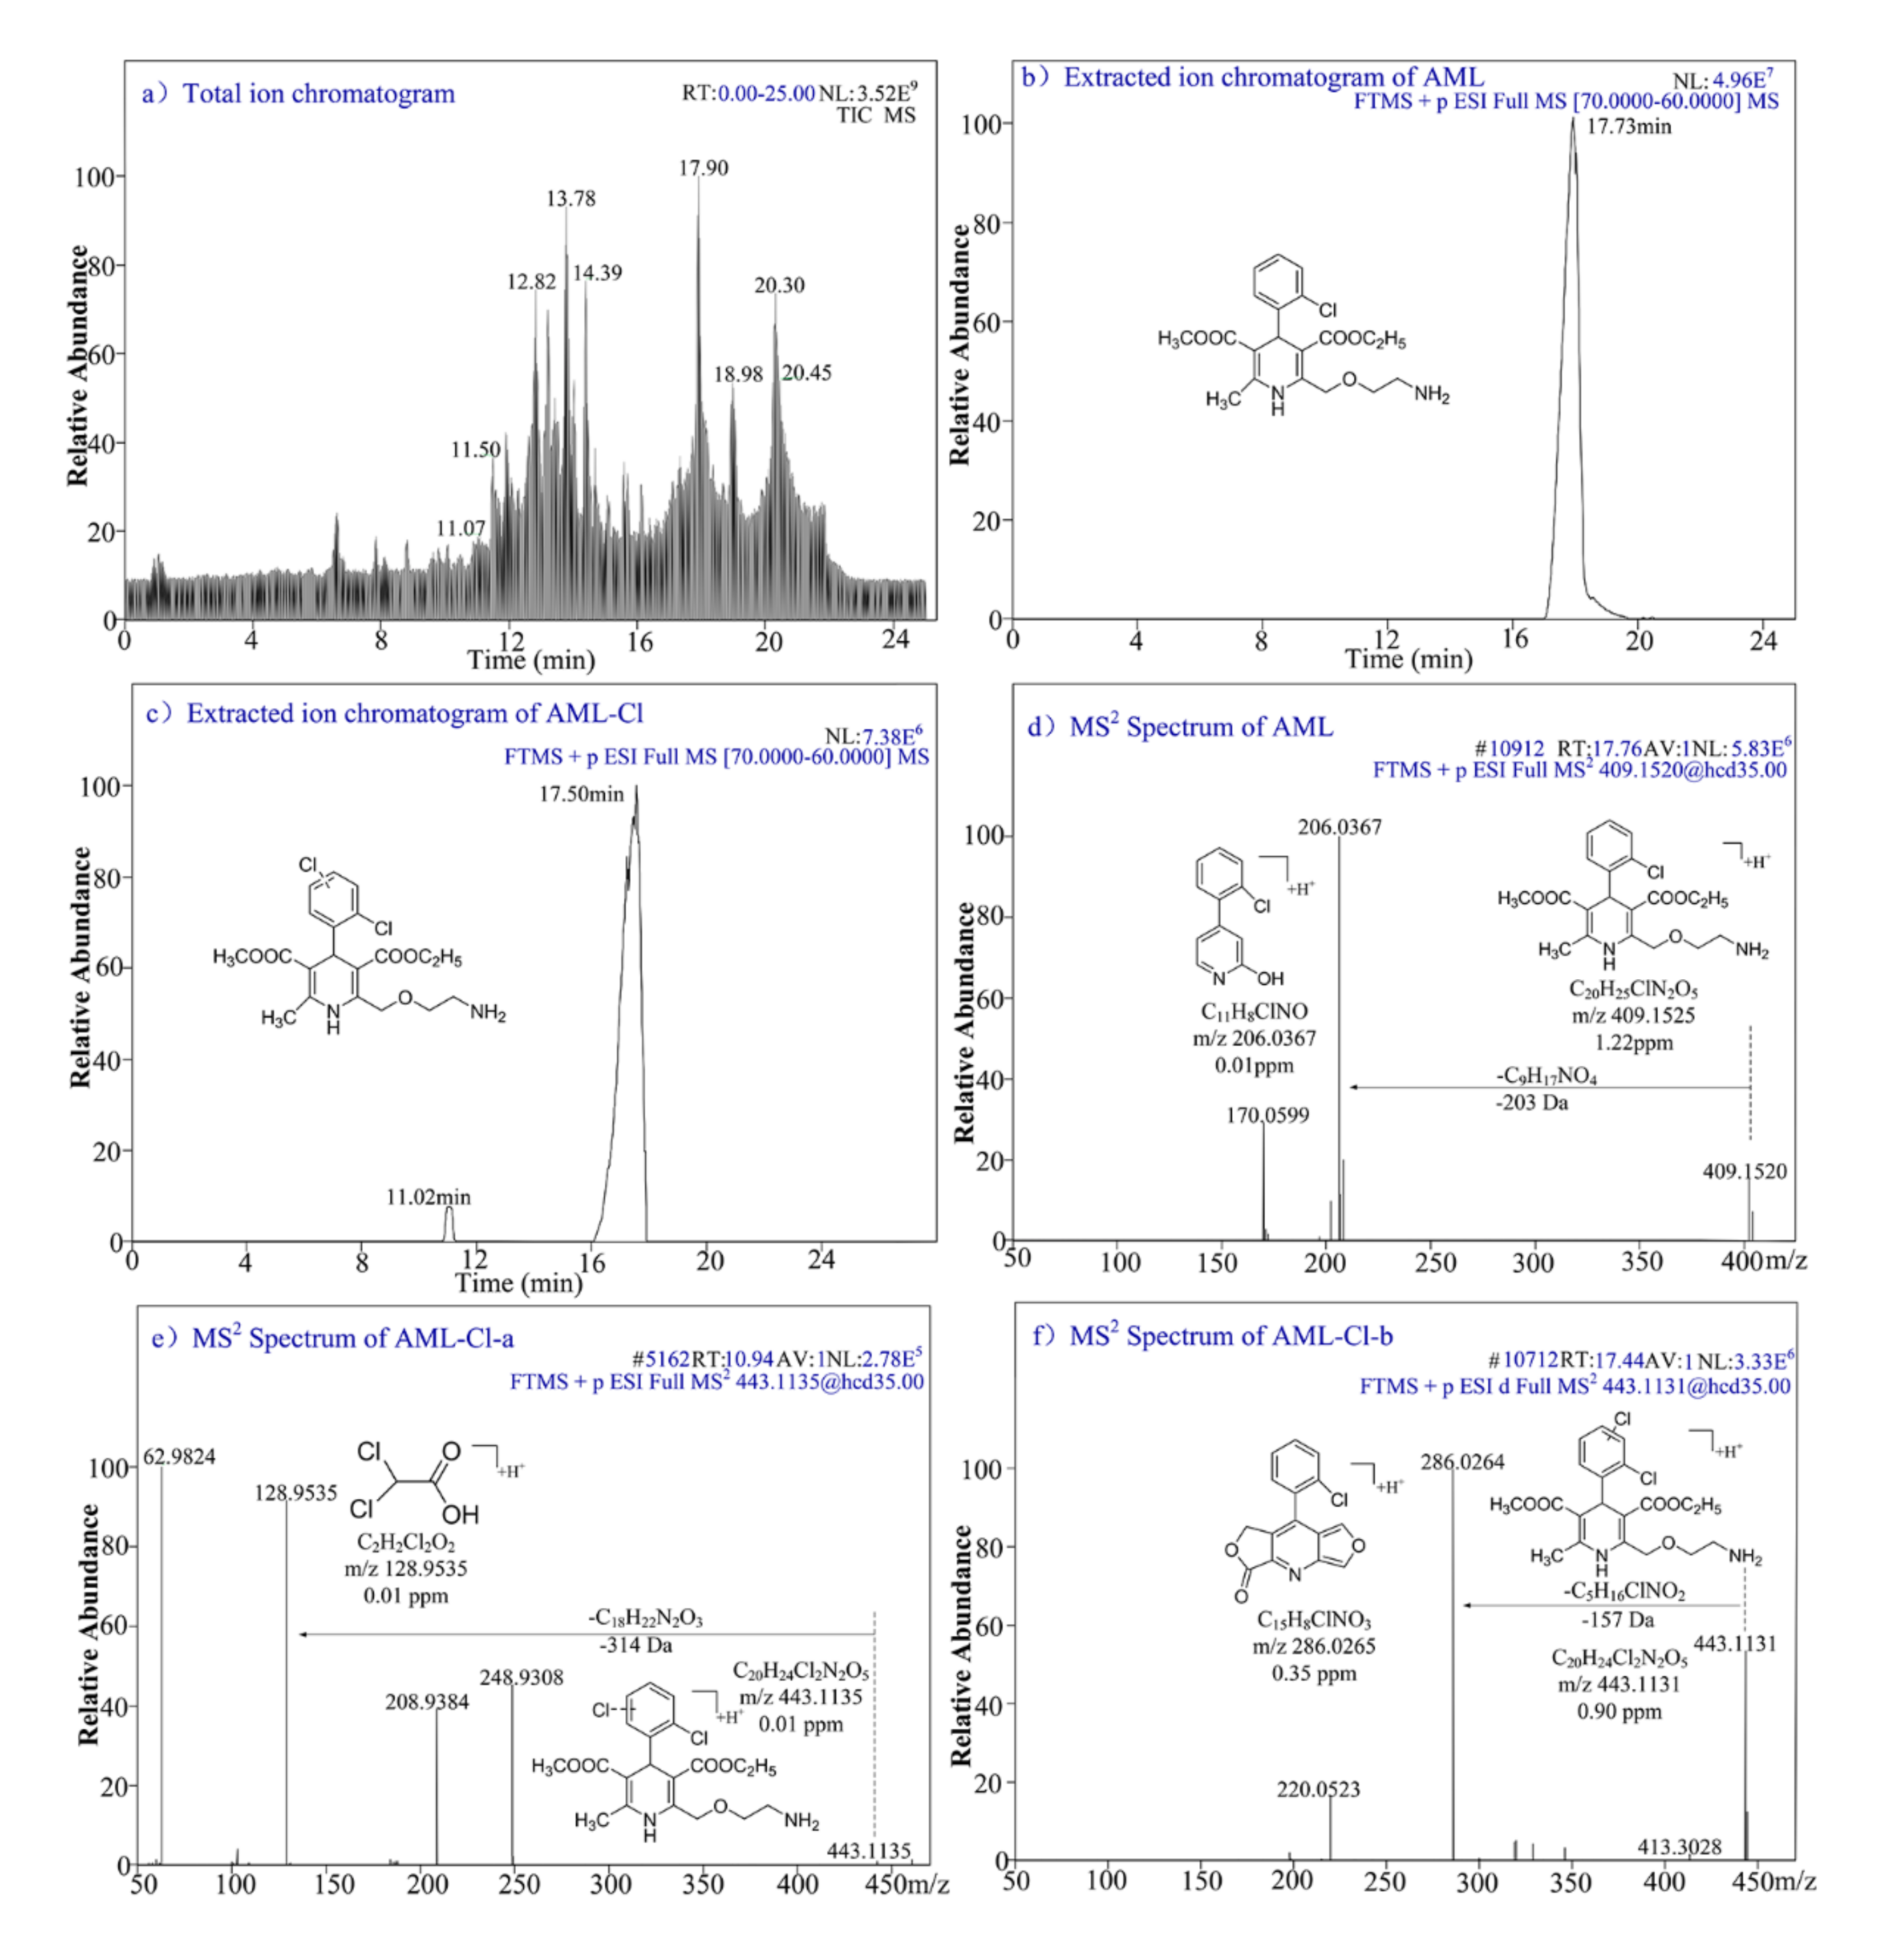
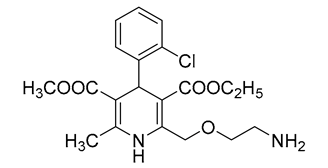
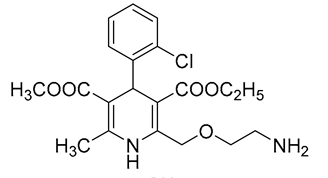
Different from UV alone and dark chlorine disinfection, AML degradation in the UV/chlorine process was mainly motivated by active species (OH• and Cl•) [34]. Chlorine substitution reactions always lead to the occurrence of mono-chlorine or bi-chlorine substitution product. The formation of these transformation products may be due to the structural dependence of the reaction of Cl• with compounds (electron transfer and hydrogen atom abstraction). Extracted ion chromatograms (EICs) of AML and AML-Cl obtained by HRMS and the corresponding MS2 spectra were shown in Figure 8. The characteristic ion peak of AML at 409.1522 m/z was detected at a retention time of 17.73 min (Figure 8a). Based on the MS2 spectrum analysis of AML(Figure 8c), the product ion at 206.0367 m/z (C11H8ClNO, 0.01 ppm) was produced due to aromatization of the dihydropyridine moiety and the loss of C9H17NO4 from the side chain of AML [49]. With the attack of Cl•, two mono-chlorine substitution products were produced with responsive characteristic peaks at retention times of 11.02 min (AML-Cl-a) and 17.50 min (AML-Cl-b) (Figure 8b). The fragment ion at 128.9535 m/z was observed in MS2 spectra of AML-Cl-a (Figure 8d) and was attributed to the cleavage of the phenyl ring (C18H22N2O3, −314 Da). However, the fragment ion at 286.0264 m/z observed in the MS2 spectrum of AML-Cl-b (Figure 8e) was produced in the same way as the product ion of AML.
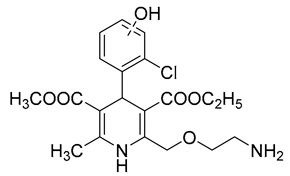
Moreover, the bi-chlorine substitution product is also a common intermediate in the UV/chlorine process [50]. However, this product was not observed in the current study. the hydroxylation reaction of AML with OH• could generate direct OH-adding products (AML-OH) (Table 1, Figure A2). In addition, OH• may further attack the benzene ring to produce dihydroxy addition product. As shown in Table 2 and Figure A2, the dihydroxy addition product at 439.1281 m/z was observed at 11.71 min (AML-2OH). Through the continuous reaction initiated by reactive species, AML and AML-Cl can further produce IM395 through de-chlorination and demethylation reactions (Table 1, Figure A2). The product of 395.1368 m/z was found at 11.97 min. Subsequently, the terminal methenamine entity on the side chain of IM395 was attacked and produced IM364 with the formula C18H20ClNO5 at 364.0961 m/z. IM364 possibly generated IM350 with the formula C17H18ClNO5 at 350.0804 m/z by O-demethylation of the side chain. Then, IM350 could produce IM334 with the formula C17H18ClNO4 at 334.0855 m/z by losing a hydroxyl group. After de-chlorination and demethylation reactions, IM334 could further produce IM288 with the formula C16H17NO4 at 288.1228 m/z. These intermediates were also detected in two AML degradation processes of UV photolysis and UV/H2O2, indicating that AML was transformed in different processes with similar degradation pathways [19,51].
During the later stage of the reaction process, the benzene ring was broken by active species to generate small molecular products, such as like IM102, IM117, and IM240. GC-MS analysis also showed that small-molecule acid intermediates existed, including acetic acid, oxalic acid, glycolic acid and lactic acid (Table 3). Based on the above analysis, the reaction pathways of AML degradation by the UV/chlorine process were posed, as shown in Figure 9.

3.9. Toxicity Assessment

The degradation of AML was investigated under the typical conditions of a 10 μM initial AML concentration, 500 μW·cm−2 UV intensity, 30 μM chlorine dose, and a pH value of 7. Toxicity analysis of the AML water samples after the UV/chlorine process was performed using Vibrio fischeri. Acute toxicity was evaluated by the inhibitory effects on the bioluminescence intensity of the Vibrio fischeri. Figure 10 shows that the inhibition rate of the initial AML water sample was 36.0%. The inhibition rate gradually increased from 36.0% to 88.4% while AML removal reached 84.7% in 50 min, implying that the removal of AML does not guarantee the reduction in ecological risk [52]. Thereafter, the inhibition rate gradually decreased and eventually dropped to 15.8% at 120 min, which indicates that the toxicity of intermediates produced in the later stage was less than that of AML. The similar conclusion was also found in the degradation of dodecyl-benzyl-dimethyl-ammonium chloride (DDBAC) [14] and carbamazepine (CBZ) [18] by the UV/chlorine process. Toxicity tests indicates that prolonged degradation would promote the detoxification of toxic intermediates. The UV/chlorine process was taken as an effective method to remove AML and reduce ecological risk [14].
The ECOSAR program (EPA, USA) was used to predict the acute toxicity (LC50 or EC50) of organic compounds to fish, Daphnia and green algae (Table 4) [28,29]. The LC50 and EC50 values of the degradation intermediates AML-Cl, IM240 and IM334 were all smaller than those of AML. For example, the LC50 (fish, 96 h) values of AML-Cl, IM240, and IM334 were only 82.9, 19.9, and 60.7 mg·L−1, respectively, which were obviously less than that of AML (290.0 mg·L−1). These results illustrated that the degradation intermediates had greater acute toxicity than their parent AML. In addition, the LC50 values of other intermediates were much higher than that of AML. Among them, the LC50 values of IM102, acetic acid and oxalic acid were 2 orders of magnitude higher than that of AML. In accordance with the luminescence test, intermediates with lower acute toxicity than AML were formed in the later stage of AML degradation.
Therefore, it is of great significance to further evaluate the environmental risks caused by AML degradation in the UV/chlorine process for water environmental safety in the future.

4. Conclusions

Degradation of AML in water by the UV/chlorine process was studied. The AML degradation reactions were all successfully fitted with pseudo-first-order kinetics. The combination of UV and chlorination processes significantly accelerated AML degradation compared to UV alone or dark chlorination. In addition, several factors could affect the degradation efficiency, including chlorine dose, UV light intensity, solution initial pH value, and ammonia concentration. Chlorine dose and UV intensity positively promoted AML degradation, whereas ammonia concentration had a negative effect. Strong acidic conditions were favorable for AML degradation. AML degradation was inhibited in real water and the inhibitory effect was correlated with the presence of ammonia nitrogen and DOM. Both OH• and Cl• contributed to the degradation of AML, while OH• was the dominant contributor. The calculated relative contribution of OH• to AML degradation was 55.7%.
Twelve AML degradation products in the process were detected by HRMS Q-E Plus Orbitrap LC-MS, including a chlorine substitution product (AML-Cl) and OH-adding products (AML-OH). Four small-molecule acid intermediates were also identified by GC-MS. Serial reactions initiated by active radicals, including chlorination, hydroxylation, demethylation, and ring breaking, led to the formation of intermediates.
Luminescent tests and ECOSAR prediction revealed that complete removal of AML does not guarantee a reduction in acute toxicity, but prolonged degradation promoted the detoxification of toxic products. It can be seen that the removal of the target substance does not represent an ecological risk reduction. However, longer treatment time will increase disposal costs. if the main goal of the pilot project is to control the ecological risk of the water, process parameters enhancement must be taken in consideration. The UV/chlorine process can be regarded as a promising method to remove AML and reduce ecological risk.

Author Contributions

Funding acquisition: Y.S.; E.D. and M.P. conceived and designed the experiments; J.X., S.Z., L.Z. and L.L. performed the experiments; E.D. analyzed the results and finished the manuscript. All authors have read and agreed to the published version of the manuscript.

Funding

This research was funded by the Key Special Program on the S&T for the Pollution Control and Treatment of Water Bodies (No. 2017ZX07202004); Technological Research and Development Cooperation Projects of Key Country Industries in Jiangsu Province (BZ2018019), Science and Technology Program of Changzhou (CE20185027), Research and Practice Innovation Program for Graduate Students of Jiangsu Province (SJCX18-0960, KYCX19-1789).

Acknowledgments

The authors would like to thank the anonymous reviewers for their valuable comments.

Conflicts of Interest

The authors declare no conflict of interest.

Appendix A

Table A1. General water quality parameters of the real water.
Total Phosphorus (mg·L−1)COD (mg·L−1)Ammonia Nitrogen (mg·L−1)Dissolve Oxygen (mg·L−1)Oxidation-Reduction Potential (mV)PH Value
0.398.070.625.89−277.2
Figure A1. AML and NB degradation in the UV/H2O2 process ([AML]0 = [NB]0 = 10μM, [H2O2]0 = 30 μM, UV intensity = 500 μW·cm−2, pH = 7).
Water 12 03150 g0a1
Figure A2. MS2 spectra of intermediates obtained by HRMS. (a) MS2 spectrum of AML-OH, (b) MS2 spectrum of IM395, (c) MS2 spectrum of IM288, (d) MS2 spectrum of IM102, (e) MS2 spectrum of IM240, (f) MS2 spectrum of IM117, (g) MS2 spectrum of AML-2OH, (h) MS2 spectrum of IM364, (i) MS2 spectrum of IM350, and (j) MS2 spectrum of IM334.
Water 12 03150 g0a2

References

  1. Enick, O.V.; Moore, M.M. Assessing the assessments: Pharmaceuticals in the environment. Environ. Impact Assess. Rev. 2007, 27, 707–729. [Google Scholar] [CrossRef]
  2. Delgado, L.F.; Charles, P.; Glucina, K.; Morlay, C. QSAR-like models: A potential tool for the selection of PhACs and EDCs for monitoring purposes in drinking water treatment systems—A review. Water Res. 2012, 46, 6196–6209. [Google Scholar] [CrossRef] [PubMed]
  3. Zheng, X.; Zhang, Y.; Bian, T.; Zhang, Y.; Zhang, F.; Yan, Y. Selective extraction of gadolinium using free-standing imprinted mesoporous carboxymethyl chitosan films with high capacity. Cellulose 2019, 26, 1209–1219. [Google Scholar] [CrossRef]
  4. Dong, H.; Qiang, Z.; Hu, J.; Qu, J. Degradation of chloramphenicol by UV/chlorine treatment: Kinetics, mechanism and enhanced formation of halonitromethanes. Water Res. 2017, 121, 178–185. [Google Scholar] [CrossRef] [PubMed]
  5. Guo, H.-G.; Gao, N.-Y.; Chu, W.-H.; Li, L.; Zhang, Y.-J.; Gu, J.-S.; Gu, Y.-L. Photochemical degradation of ciprofloxacin in UV and UV/H2O2 process: Kinetics, parameters, and products. Environ. Sci. Pollut. Res. 2013, 20, 3202–3213. [Google Scholar] [CrossRef] [PubMed]
  6. Zheng, X.; Zhang, Y.; Bian, T.; Wang, D.; Li, Z. One-step fabrication of imprinted mesoporous cellulose nanocrystals films for selective separation and recovery of Nd (III). Cellulose 2019, 26, 5571–5582. [Google Scholar] [CrossRef]
  7. Fernández, C.; González-Doncel, M.; Pro, J.; Carbonell, G.; Tarazona, J.V. Occurrence of pharmaceutically active compounds in surface waters of the Henares-Jarama-Tajo river system (Madrid, Spain) and a potential risk characterization. Sci. Total Environ. 2010, 408, 543–551. [Google Scholar] [CrossRef]
  8. Brausch, J.M.; Rand, G.M. A review of personal care products in the aquatic environment: Environmental concentrations and toxicity. Chemosphere 2011, 82, 1518–1532. [Google Scholar] [CrossRef]
  9. Álvarez-Muñoz, D.; Rodríguez-Mozaz, S.; Maulvault, A.L.; Tediosi, A.; Fernández-Tejedor, M.; Van den Heuvel, F.; Kotterman, M.; Marques, A.; Barceló, D. Occurrence of pharmaceuticals and endocrine disrupting compounds in macroalgaes, bivalves, and fish from coastal areas in Europe. Environ. Res. 2015, 143, 56–64. [Google Scholar] [CrossRef]
  10. Yu, C.-P.; Chu, K.-H. Occurrence of pharmaceuticals and personal care products along the West Prong Little Pigeon river in east Tennessee, USA. Chemosphere 2009, 75, 1281–1286. [Google Scholar] [CrossRef]
  11. Liu, J.-L.; Wong, M.-H. Pharmaceuticals and personal care products (PPCPs): A review on environmental contamination in China. Environ. Int. 2013, 59, 208–224. [Google Scholar] [CrossRef] [PubMed]
  12. Ortiz de García, S.; Pinto Pinto, G.; García Encina, P.; Irusta Mata, R. Consumption and occurrence of pharmaceutical and personal care products in the aquatic environment in Spain. Sci. Total Environ. 2013, 444, 451–465. [Google Scholar] [CrossRef] [PubMed]
  13. Zheng, X.; Zhang, Y.; Zhang, F.; Li, Z.; Yan, Y. Dual-template docking oriented ionic imprinted bilayer mesoporous films with efficient recovery of neodymium and dysprosium. J. Hazard. Mater. 2018, 353, 496–504. [Google Scholar] [CrossRef] [PubMed]
  14. Huang, N.; Wang, T.; Wang, W.-L.; Wu, Q.-Y.; Li, A.; Hu, H.-Y. UV/chlorine as an advanced oxidation process for the degradation of benzalkonium chloride: Synergistic effect, transformation products and toxicity evaluation. Water Res. 2017, 114, 246–253. [Google Scholar] [CrossRef]
  15. Xiang, Y.; Fang, J.; Shang, C. Kinetics and pathways of ibuprofen degradation by the UV/chlorine advanced oxidation process. Water Res. 2016, 90, 301–308. [Google Scholar] [CrossRef]
  16. Fang, J.; Fu, Y.; Shang, C. The roles of reactive species in micropollutant degradation in the UV/free chlorine system. Environ. Sci. Technol. 2014, 48, 1859–1868. [Google Scholar] [CrossRef]
  17. Kong, X.; Jiang, J.; Ma, J.; Yang, Y.; Liu, W.; Liu, Y. Degradation of atrazine by UV/chlorine: Efficiency, influencing factors, and products. Water Res. 2016, 90, 15–23. [Google Scholar] [CrossRef]
  18. Pan, Y.; Cheng, S.; Yang, X.; Ren, J.; Fang, J.; Shang, C.; Song, W.; Lian, L.; Zhang, X. UV/chlorine treatment of carbamazepine: Transformation products and their formation kinetics. Water Res. 2017, 116, 254–265. [Google Scholar] [CrossRef] [Green Version]
  19. Tiwari, R.N.; Shah, N.; Bhalani, V.; Mahajan, A.L.C. MSn and LC–MS/MS studies for the characterization of degradation products of amlodipine. J. Pharm. Anal. 2015, 5, 33–42. [Google Scholar] [CrossRef] [Green Version]
  20. Elliott, W.J.; Ram, C.V.S. Calcium channel blockers. J. Clin. Hypertens. 2011, 13, 687–689. [Google Scholar] [CrossRef]
  21. Hummel, D.; Löffler, D.; Fink, G.; Ternes, T.A. Simultaneous determination of psychoactive drugs and their metabolites in aqueous matrices by liquid chromatography mass spectrometry. Environ. Sci. Technol. 2006, 40, 7321–7328. [Google Scholar] [CrossRef] [PubMed]
  22. Batt, A.L.; Kostich, M.S.; Lazorchak, J.M. Analysis of ecologically relevant pharmaceuticals in wastewater and surface water using selective solid-phase extraction and UPLC−MS/MS. Anal. Chem. 2008, 80, 5021–5030. [Google Scholar] [CrossRef] [PubMed]
  23. Spongberg, A.L.; Witter, J.D. Pharmaceutical compounds in the wastewater process stream in Northwest Ohio. Sci. Total Environ. 2008, 397, 148–157. [Google Scholar] [CrossRef]
  24. Du, B.; Price, A.E.; Scott, W.C.; Kristofco, L.A.; Ramirez, A.J.; Chambliss, C.K.; Yelderman, J.C.; Brooks, B.W. Comparison of contaminants of emerging concern removal, discharge, and water quality hazards among centralized and on-site wastewater treatment system effluents receiving common wastewater influent. Sci. Total Environ. 2014, 466–467, 976–984. [Google Scholar] [CrossRef]
  25. Wang, J.; Gardinali, P.R. Uptake and depuration of pharmaceuticals in reclaimed water by mosquito fish (Gambusia holbrooki): A worst-case, multiple-exposure scenario. Environ. Toxicol. Chem. 2013, 32, 1752–1758. [Google Scholar] [CrossRef]
  26. Sapozhnikova, Y.; Hedgespeth, M.; Wirth, E.; Fulton, M. Analysis of selected natural and synthetic hormones by LC-MS-MS using the US EPA method 1694. Anal. Methods 2011, 3, 1079–1086. [Google Scholar] [CrossRef]
  27. Engebrecht, J.; Nealson, K.; Silverman, M. Bacterial bioluminescence: Isolation and genetic analysis of functions from Vibrio fischeri. Cell 1983, 32, 773–781. [Google Scholar] [CrossRef]
  28. Jones, O.A.H.; Voulvoulis, N.; Lester, J.N. Aquatic environmental assessment of the top 25 English prescription pharmaceuticals. Water Res. 2002, 36, 5013–5022. [Google Scholar] [CrossRef]
  29. Giddings, J.M.; Salvito, D.; Putt, A.E. Acute toxicity of 4-amino musk xylene to Daphnia magna in laboratory water and natural water. Water Res. 2000, 34, 3686–3689. [Google Scholar] [CrossRef]
  30. Xiang, H.; Shao, Y.; Gao, N.; Lu, X.; An, N.; Tan, C.; Zheng, Z. Degradation of diuron by chlorination and UV/chlorine process: Degradation kinetics and the formation of disinfection by-products. Sep. Purif. Technol. 2018, 202, 365–372. [Google Scholar] [CrossRef]
  31. Deng, L.; Huang, C.H.; Wang, Y.L. Effects of combined UV and chlorine treatment on the formation of trichloronitromethane from amine precursors. Environ. Sci. Technol. 2014, 48, 2697–2705. [Google Scholar] [CrossRef] [PubMed]
  32. Sanches, S.; Barreto Crespo, M.T.; Pereira, V.J. Drinking water treatment of priority pesticides using low pressure UV photolysis and advanced oxidation processes. Water Res. 2010, 44, 1809–1818. [Google Scholar] [CrossRef] [PubMed]
  33. Lu, X.; Shao, Y.; Gao, N.; Chen, J.; Zhang, Y.; Xiang, H.; Guo, Y. Degradation of diclofenac by UV-activated persulfate process: Kinetic studies, degradation pathways and toxicity assessments. Ecotoxicol. Environ. Saf. 2017, 141, 139–147. [Google Scholar] [CrossRef] [PubMed]
  34. Wang, W.L.; Wu, Q.Y.; Huang, N.; Wang, T.; Hu, H.Y. Synergistic effect between UV and chlorine (UV/chlorine) on the degradation of carbamazepine: Influence factors and radical species. Water Res. 2016, 98, 190–198. [Google Scholar] [CrossRef]
  35. Yin, K.; Deng, L.; Luo, J.; Crittenden, J.; Liu, C.; Wei, Y.; Wang, L. Destruction of phenicol antibiotics using the UV/H2O2 process: Kinetics, byproducts, toxicity evaluation and trichloromethane formation potential. Chem. Eng. J. 2018, 351, 867–877. [Google Scholar] [CrossRef]
  36. Acero, J.L.; Stemmler, K.; Von Gunten, U. Degradation kinetics of atrazine and its degradation products with ozone and OH radicals: A predictive tool for drinking water treatment. Environ. Sci. Technol. 2000, 34, 591–597. [Google Scholar] [CrossRef]
  37. Liu, T.; Yin, K.; Liu, C.; Luo, J.; Crittenden, J.; Zhang, W.; Luo, S.; He, Q.; Deng, Y.; Liu, H. The role of reactive oxygen species and carbonate radical in oxcarbazepine degradation via UV, UV/H2O2: Kinetics, mechanisms and toxicity evaluation. Water Res. 2018, 147, 204–213. [Google Scholar] [CrossRef]
  38. Wang, D.; Bolton, J.R.; Hofmann, R. Medium pressure UV combined with chlorine advanced oxidation for trichloroethylene destruction in a model water. Water Res. 2012, 46, 4677–4686. [Google Scholar] [CrossRef]
  39. Watts, M.J.; Hofmann, R.; Rcdsenfeldt, E.J. Low-pressure UV/Cl2 for advanced oxidation of taste and odor. J. Am. Water Work. Assoc. 2012, 104, E58–E65. [Google Scholar] [CrossRef] [Green Version]
  40. Watts, M.J.; Linden, K.G. Chlorine photolysis and subsequent OH radical production during UV treatment of chlorinated water. Water Res. 2007, 41, 2871–2878. [Google Scholar] [CrossRef]
  41. Yin, K.; Deng, Y.; Liu, C.; He, Q.; Wei, Y.; Chen, S.; Liu, T.; Luo, S. Kinetics, pathways and toxicity evaluation of neonicotinoid insecticides degradation via UV/chlorine process. Chem. Eng. J. 2018, 346, 298–306. [Google Scholar] [CrossRef]
  42. Nowell, L.H.; Hoigné, J. Photolysis of aqueous chlorine at sunlight and ultraviolet wavelengths—II. Hydroxyl radical production. Water Res. 1992, 26, 599–605. [Google Scholar] [CrossRef]
  43. Nam, S.W.; Yoon, Y.; Choi, D.J.; Zoh, K.D. Degradation characteristics of metoprolol during UV/chlorination reaction and a factorial design optimization. J. Hazard. Mater. 2015, 285, 453–463. [Google Scholar] [CrossRef] [PubMed]
  44. Qiang, Z.; Adams, C.D. Determination of monochloramine formation rate constants with stopped-flow spectrophotometry. Environ. Sci. Technol. 2004, 38, 1435–1444. [Google Scholar] [CrossRef]
  45. Tian, F.; Liu, W.; Guo, G.; Qiang, Z.; Zhang, C. Kinetics and mechanism of dimethoate chlorination during drinking water treatment. Chemosphere 2014, 103, 181–187. [Google Scholar] [CrossRef]
  46. Luo, J.; Liu, T.; Zhang, D.; Yin, K.; Wang, D.; Zhang, W.; Liu, C.; Yang, C.; Wei, Y.; Wang, L. The individual and Co-exposure degradation of benzophenone derivatives by UV/H2O2 and UV/PDS in different water matrices. Water Res. 2019, 159, 102–110. [Google Scholar] [CrossRef]
  47. Zhu, Y.; Wu, M.; Gao, N.; Chu, W.; Li, K.; Chen, S. Degradation of phenacetin by the UV/chlorine advanced oxidation process: Kinetics, pathways, and toxicity evaluation. Chem. Eng. J. 2018, 335, 520–529. [Google Scholar] [CrossRef]
  48. Yin, K.; He, Q.; Liu, C.; Deng, Y.; Wei, Y.; Chen, S.; Liu, T.; Luo, S. Prednisolone degradation by UV/chlorine process: Influence factors, transformation products and mechanism. Chemosphere 2018, 212, 56–66. [Google Scholar] [CrossRef]
  49. Fakhari, A.R.; Nojavan, S.; Haghgoo, S.; Mohammadi, A. Development of a stability-indicating CE assay for the determination of amlodipine enantiomers in commercial tablets. Electrophoresis 2008, 29, 4583–4592. [Google Scholar] [CrossRef]
  50. Li, J.; Ma, L.-Y.; Xu, L. Transformation of benzophenone-type UV filters by chlorine: Kinetics, products identification and toxicity assessments. J. Hazard. Mater. 2016, 311, 263–272. [Google Scholar] [CrossRef]
  51. Zhu, B.; Zonja, B.; Gonzalez, O.; Sans, C.; Pérez, S.; Barceló, D.; Esplugas, S.; Xu, K.; Qiang, Z. Degradation kinetics and pathways of three calcium channel blockers under UV irradiation. Water Res. 2015, 86, 9–16. [Google Scholar] [CrossRef] [PubMed]
  52. Chen, J.; Qu, R.; Pan, X.; Wang, Z. Oxidative degradation of triclosan by potassium permanganate: Kinetics, degradation products, reaction mechanism, and toxicity evaluation. Water Res. 2016, 103, 215–223. [Google Scholar] [CrossRef] [PubMed]
Figure 1. Amlodipine (AML) removal by UV alone, dark chlorination, and the UV/chlorine process ([AML]0 = 10 μM, [chlorine]0 = 20 μM, UV intensity = 1000 μW·cm−2, pH = 7).
Water 12 03150 g001
Figure 2. Effect of residual free chlorine on AML degradation by the UV/chlorine process ([AML]0 = 10 μM, UV intensity = 500 μW·cm−2, pH = 7).
Water 12 03150 g002
Figure 3. Effect of UV light intensity on AML degradation by the UV/chlorine process ([AML]0 = 10 μM, [chlorine]0 = 20 μM, pH = 7).
Water 12 03150 g003
Figure 4. Effect of the pH value on AML degradation by the UV/chlorine process ([AML]0 = 10 μM, [chlorine]0 = 30 μM, UV intensity = 500 μW·cm−2).
Water 12 03150 g004
Figure 5. Effect of the ammonia concentration on AML degradation by the UV/chlorine process ([AML]0 = 10 μM, [chlorine]0 = 30 μM, UV intensity = 500 μW·cm−2, pH = 7).
Water 12 03150 g005
Figure 6. AML degradation by the UV/chlorine process ([AML]0 = 10 μM, [chlorine]0 = 30 μM, UV intensity = 500 μW·cm−2, pH = 7).
Water 12 03150 g006
Figure 7. AML and NB degradation in the UV/chlorine process ([AML]0 = [NB]0 = 10 μM, [chlorine]0 = 30 μM, UV intensity = 500 μW·cm−2, pH = 7).
Water 12 03150 g007
Figure 8. Total ion chromatogram (TIC), extracted ion chromatogram (EIC) and MS2 spectra of AML and AML-Cl obtained by HRMS. (a) TIC spectrum, (b) EIC spectrum of AML at 409.1525 m/z, (c) EIC spectrum of AML-Cl at 443.1135 m/z, (d) MS2 spectrum of AML, (e) MS2 spectrum of AML-Cl-a, and (f) MS2 spectrum of AML-Cl-b.
Water 12 03150 g008
Figure 9. Reaction pathway of AML degradation by the UV/chlorine process.
Water 12 03150 g009
Figure 10. Inhibition rate of AML degradation by the UV/chlorine process on luminescent bacteria.
Water 12 03150 g010
Table 1. Molecular formula, retention time, high-resolution accurate masses ([M+H]+) with errors (∆), and molecular structures of AML and its degradation products detected by HRMS.
No.CompoundsLC Retention Time
(min)
Molecular Formula[M+H]+Molecular Structures
Theoretical m/zMeasured m/z
(ppm)
1AML17.73C20H25ClN2O5409.1525409.15220.73 Water 12 03150 i001
2AML-Cl-a11.02C20H24Cl2N2O5443.1135443.11350.01 Water 12 03150 i002
3AML-Cl-b17.50C20H24Cl2N2O5443.1135443.11310.90 Water 12 03150 i003
4AML-OH12.67C20H25ClN2O6425.1474425.14720.47 Water 12 03150 i004
5IM39511.97C19H23ClN2O5395.1368395.13680.01 Water 12 03150 i005
6IM28814.97C16H17NO4288.1230288.12280.69 Water 12 03150 i006
7IM1021.15C4H7NO2102.0550102.05500.01 Water 12 03150 i007
8IM24010.30C12H14ClNO2240.0786240.07860.01 Water 12 03150 i008
9IM1176.60C6H12O2117.0910117.0910−0.01 Water 12 03150 i009
Table 2. Molecular formula, retention time, high-resolution accurate masses ([M-H]) with errors (∆), and molecular structures of AML and its degradation products detected by HRMS.
No.CompoundsLC Retention Time
(min)
Molecular Formula[M-H]Molecular Structures
Theoretical m/zMeasured m/z
(ppm)
1AML17.73C20H25ClN2O5407.1379407.1380−0.25 Water 12 03150 i010
10AML−2OH11.71C20H25ClN2O7439.1278439.1281−0.68 Water 12 03150 i011
11IM36413.78C18H20ClNO5364.0957364.0961−1.09 Water 12 03150 i012
12IM35012.49C17H18ClNO5350.0801350.0804−0.86 Water 12 03150 i013
13IM33413.33C17H18ClNO4334.0852334.0855−0.89 Water 12 03150 i014
Table 3. Intermediates of AML degradation detected by GC-MS.
No.ProductsMolecular WeightCAS NumberGC Retention Time (min)Molecular Structures
14Acetic acid60.021164-19-78.2587 Water 12 03150 i015
15Oxalic acid89.9953144-62-717.6322 Water 12 03150 i016
16Glycolic acid76.016079-14-117.9978 Water 12 03150 i017
17Lactic acid90.031650-21-520.5232 Water 12 03150 i018
Table 4. Estimated acute toxicity of AML and its intermediates by ECOSAR software.
CompoundsFish
96 h-LC50 (mg·L−1)
Daphnid
48 h-LC50 (mg·L−1)
Green Algae
96 h-EC50 (mg·L−1)
AML290.0155.5144.3
AML-Cl82.950.346.8
AML-OH813.5398.3368.5
AML-2OH2278.71018.4939.7
IM395868.6419.8388.3
IM288201.2107.9100.2
IM10228,420.78802.88032.8
IM24060.735.833.3
IM117131.167.462.4
IM364106.161.757.4
IM350433.2220.8204.6
IM33419.913.512.6
Acetic acid25,785.712,302.48704.6
Oxalic acid168,000.067,876.839,658.6
Glycolic acid355,000.0152,000.095,559.1
Lactic acid177,000.079065.551,783.7
Publisher’s Note: MDPI stays neutral with regard to jurisdictional claims in published maps and institutional affiliations.