Abstract
During 29–31 September 2019, tropical storm Podul moved into the Kaeng Lawa sub-watershed (KLs), the upstream area of the Chi watershed, causing the worst flooding in 40 years. This study was carried out to analyze the watershed characteristic (WC) variables and prioritize the risks of land-use patterns in KLs, Khon Kaen Province, using a watershed delineation approach. As a result of this study, of the 11 sub-watersheds in the Kaeng Lawa watershed, only KL03 and KL04 were deemed medium priority within their drainage and storage capacity systems. KL01, in the upstream sub-watershed, displayed very low priority. The pattern of land-use that appeared most in KL01 sub-watershed was deforestation, where the upper forest area appeared to show a 63% decrease from 2002 to 2017. The decreased forest area was replaced with agricultural area, for crops such as sugarcane and para-rubber, and fruit farms. Moreover, increases in urban area expansion were found in the downstream area in the north of KLs. The findings of this study reveal that severe flooding in this area was caused not only by tropical storm Podul, but also by the low prioritization of watershed characteristics and patterns of land-use that resulted in decreasing forested area in this watershed area. Consequently, these factors have influenced watershed storage and caused an accumulation of water volume, which regularly results in floods. Thus, flood mitigation should be implemented urgently, in the very low priority areas of the study area first.
1. Introduction
A watershed is a crucial part of environmental geography, which can indicate or define areas for water resource management [1,2,3,4,5]. When thunderstorms come, the precipitation creates response units for the watershed system, which are described via runoff generation from a given rainfall, and characterized by land-use types, soil characteristics and morphometrical parameters [6,7,8]. Generally, the physical characteristics of the watershed, including topography, geomorphology, lithology, bedrock and geological structures, are not changed, but they do influence the drainage system of the watershed [9,10,11]. However, anthropogenic activities, frequently defined as important factors affecting any change in watershed characteristics (WC), are obviously seen via changes in land-use [12,13,14].
The effects of tropical storm Podul were brought about by the movement of the storm from the South China Sea into Vietnam and Laos, with maximum wind speeds near the center reaching 65 km per hour, while moving West at about 30 km per hour. It caused a monsoon trough across the northeastern, upper central and lower northern regions of Thailand. In August 2019, tropical storm Podul brought heavy rainfall in the northern, northeastern and eastern parts of Thailand, causing flash flooding and landslides affecting 194 households, in 72 villages in 13 provinces, including Chiang Mai, Phrae, Phetchabun, Amnat Charoen, Nakhon Phanom, Roi Et, Ubon Ratchathani, Maha Sarakham, Khon Kaen, Nong Bua Lam Phu, Prachin Buri, Krabi and Ranong. Kaeng Lawa sub-watershed (KLs), Khon Kaen Province, Thailand, was the area most severely affected by the great flood on August 31, 2019. The damage caused by tropical storm Podul during 29–31 August 2019 was a result of the monsoon passing over northern and northeastern Thailand and then stalling, which provoked more stationary rainfall than usual, totaling 371–440 mm in the period. This situation caused 3–5 m of high stagnant flooding. The extreme flood was the greatest of the past 40 years, and was influenced not only by human settlements and spatial urban planning, but also by changes in land-use within the upstream forests via trespassing in order to expand agricultural or occupational areas [4,5,8]. As mentioned, the increase in unabsorbed surface water, brought about by community built-up areas in the watershed area, affects watershed hydrological processes, including changes to river discharge, the level of runoff and overland flow [15]. A Digital Elevation Model (DEM) provides necessary information for this study, as it is the major dataset for various applications in the WC [16,17,18]. Therefore, applying a watershed delineation approach in Geographic Information System (GIS) to derive the WC in linear, areal and relief aspects for each individual watershed, is absolutely essential. Enforcing GIS for tasks concerning the watershed offers beneficial outcomes for the wide and hard-to-access area of research, allowing us to assess basic variables such as area, perimeter, stream order, stream length, number of streams and elevation of the watershed [19]. Further, a GIS in WC analysis provides environmental interpretation and analysis of the spatial information that is linked to the watershed area [2,20].
Most watershed work focuses its priorities on solving soil erosion problems [9], managing sufficient water for agricultural areas [14] and allocating land-use for maximum benefit [7]. In most cases, resolving water shortage problems in sub-watershed areas is key, but this research aims to solve flooding problems due to extreme rainfall. Tropical storm Podul, part of the Typhoon Podul disaster, moved across the northern region of Thailand, generating a huge amount of rainfall beyond the potential capacity of the KLs basin. In this study, we tried to solve the flooding problem by prioritizing the KLs basin’s potential, which involves several factors, including watershed characteristic variables, land-use data and the flood situation. Based on the results, watershed management guidelines could be implemented for the severely affected sub-watershed, and a water storage area could be developed to retard the streamflow discharge and mitigate flooding in the future.
Since natural resources have appeared to be rather limited recently, a sub-watershed approach should be adopted to integrate the watershed management approach, concerning watershed characteristics and land-use data, in order to tackle this problem. To evaluate the potential of watersheds, the watershed characteristic variables of the sub-watershed provide the most important information. In general, the physical characteristics and quantitative measurements of the sub-watershed provide spatial information, which can then be used for the management of each sub-watershed. The key tools used include remote sensing, GIS technologies in natural resource studies and development planning, as shown in the example involving the Piperiya watershed, India [6]. Furthermore, Chandniha and Kansal [6] have analyzed watershed potential using a DEM to analyze drainages and their relative parameters, such as stream order, stream length (Rl), stream frequency (Fs), drainage density (Dd), texture ratio (T), form factor (Ff), circulatory ratio (Rc), elongation ratio (Re), bifurcation ratio (Rb) and relief ratio (Rr). The watershed potential was calculated separately for each sub-watershed, to show which terrain type supports the streamflow system well. Furthermore, Sujatha et al. [17] studied watershed prioritization based on morphometric and land-use analysis to find the proper way to manage soil erosion and degradation in the Palar sub-watershed basin in India. In addition, Gumma et al. [3] prioritized the sub-watershed, using watershed characteristic analysis and land-use, to prioritize river basin potentials for agricultural development planning in areas of Mali, where limited water and soil resources prevail. In Thailand, the assessment of flood hazard has mainly focused on the affected floodplain or urban flooding in major basins [21,22]. For example, a study by Komori et al. [21] investigated the rainfall pattern and storage capacity of main dams during the 2011 extreme flooding of the Chao Phraya river basin, Thailand. Moreover, most works have dealt with the flood hazard issue by using mathematical modeling and field interviews, especially in downstream low-land areas [23,24,25]. However, there are a few studies that emphasize sub-watersheds. For example, as mentioned earlier, the study of Chandniha and Kansal [6] used the prioritized score for the morphometric parameters of the sub-watershed in the Piperiya watershed, but they did not identify the sensitivity parameters. Therefore, in this study, we carried out a sensitivity analysis to figure out the sensitivity parameters for prioritizing watershed characteristics of the sub-watersheds. Furthermore, the Piperiya watershed, characterized as topographically complex with high, steep mountains, is approximately 2 times larger than the current study area and has a different landscape from that used in this research, in which the watershed of the basin has a low-hill and undulating-plain landscape. The sub-watershed’s characteristics, particularly in the upstream areas, include useful data for assessing the watershed’s potential capacity to handle extreme rainfall from tropical storms.
Furthermore, since not all watershed management operations can be done completely in large-scale watersheds simultaneously, the most sensitive sub-watersheds need to be addressed first. As mentioned above, therefore, this research aims to rank the potentials of watersheds in mitigating the heavy flooding problem caused by extreme tropical storms at the sub-watershed level. Generally, the northeastern region of Thailand is frequently affected by tropical storms from May to September.
The main purpose of this study is to analyze the WC variables and prioritize the risks of land-use patterns in KLs, Khon Kaen Province, by utilizing a watershed delineation approach for tropical storm Podul. It is critical to better understand the capabilities of runoff generation [6] in order to comprehend the WC variables influencing the sub-watershed [26,27]. In order to be capable of utilizing the study results as a guideline, we must arrange and set an outline for policy aimed at preventing or lessening the damage from flash floods in affected areas. Since the upstream of the KLs is a low-hill and undulating-plain area, it is distinguished from other areas, and generally flooding has occurred every year when tropical storms descend. The historical frequency of flooding generally occurring after extreme storms was used to indirectly explain the watershed potential. However, the prioritization map, including the sensitivity analysis result, specifically revealed the areas vulnerable to flooding problems in each sub-watershed, leading to more detailed information than usual, which could be used by policy makers who can propose the proper measures for flood mitigation in the particular area in the future. By providing data of a spatial type for systematically planning and managing land-use, we hope to specify possible methods to enact changes for a sustainable approach in the future.
2. Materials and Methods
2.1. Study Area
The Kaeng Lawa sub-watershed (KLs) is located in the upstream area of the third part of the Lam Nam Chi watershed (Figure 1). The total study area is approximately 1250.67 km2. KLs is bounded between latitude 15°50′ N to 16°20′ N, and latitude 102°20′ E to 102°60′ E. This sub-watershed includes the Mancha Khiri, Chonnabot, Waeng Yai, Non Sila and Ban Phai districts in Khon Kaen Province, and the Kut Rang district in Maha Sarakham Province.
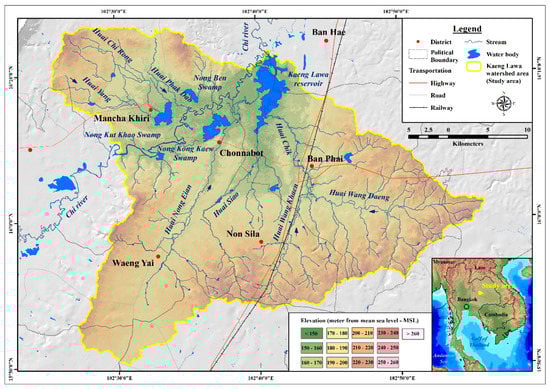
Figure 1.
Geographical setting of the study area of the KLs area.
The watershed is located in the third part of the Lam Nam Chi watershed. Its topography characteristics include undulating plains with a slight slope. Eastern and southern areas of the watershed include the upstream area, at 250–260 m above mean sea level (amsl), which get lower to the Northeast, causing a slope inclining in the mentioned direction, generating different drainage systems that flow down to the Chi River. The drainage systems of the Chi watershed flow from West to East; for example, Huai Phak Dao, Huai Chi Rong and Huai Yang. These three streams merge in the Mancha Khiri district in the downstream area, and in Nong Kut Khao Swamp and Nong Ben Swamp, before the water flows down to the Chi River. Drainage flows from South to North; for example, Huai Nong Eian meets Nong Kong Kaew in the Chonnabot district, and Huai Siao runs to the Kaeng Lawa reservoir before flowing into the Chi River. The last system’s flow direction is from East to West, and includes Huai Wang Khaen and Huai Wang Daeng, which merge at Huai Chik in the Ban Phai district, before going to the Kaeng Lawa reservoir and down to the Chi River, the main course of the third part of the Lam Nam Chi watershed.
2.2. Data Collection and Analysis
2.2.1. GIS Approach for Sub-Watershed Analysis
The primary data used in this research was the 30 m resolution grid of the Shuttle Radar Topography Mission (STRM), which was downloaded from https://earthexplorer.usgs.gov/. STRM data demonstrates information on the height of the topography in a Digital Elevation Model (DEM). Environmental geology and hydrology research was applied using ArcGIS tools for watershed delineation to compute the area, border and other essential WC variables of the sub-watershed [28,29]. For other data sources used in the analysis, see Table 1.

Table 1.
Data layers used in this study.
The land-use and land-cover (LU/LC) map used in this study has been revised using the standard map with a scale of 1:4000 obtained from the Land Development Department (LDD), Thailand. The government agency is responsible for issuing the LU/LC map in Thailand and revising the map every 2 years, via field survey and interpretation. The flooding map used in this study has been processed, analyzed and filtered by an expert from Geo-Informatics and Space Technology Development Agency (Public Organization) (GISTDA), using a COSMO-SkyMed-4 satellite with an observation swath of 40 km and a resolution of 3 × 3 m, which is reliable and acceptable data for our country. Furthermore, we have already filtered it to remove small polygons in repetitive flooding areas of the past 12 years (from 2005 to 2016), to assess the extreme flooding area in the past 40 years. Several recent studies used the COSMO-SkyMed-4 satellite to investigate flood hazard mapping [30,31,32].
The watershed characteristic variables of KLs, including area (A), perimeter (P), basin length (Lb) and stream order (Nu), were processed on ArcGIS, and input into the DEM to analyze the watershed area for watershed delineation in GIS, as shown in the following steps (Figure 2).
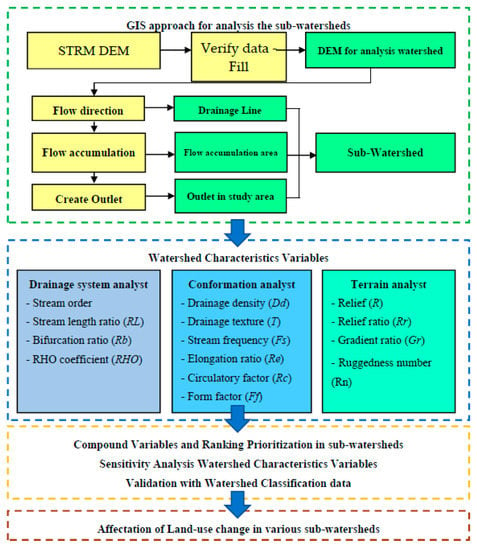
Figure 2.
Schematic flowchart summarizing the main methodological steps used in this research.
Step 1 uses the menu “Fill” in order to edit DEM data before inspecting surface characteristics of the topography in KLs. Step 2 analyzes it with the menu “Flow Direction”, to find out the watershed’s flow direction. It was found that the direction of drainage in sub-watershed areas are prioritized according to that stream’s order (e.g., 1st order, 2nd order, …, n order) [33]. Step 3 analyzes this to clarify the merge point of drainage using the menu “Flow Accumulation”. The flow accumulation area was displayed and then synchronized with the data before investigating the watershed area with the menu “Watershed”.
2.2.2. Watershed Characteristic Variables
The watershed characteristic variables can be classified into 3 groups, as follows: 1) drainage system analysis, including bifurcation ratio (Rb), mean stream length (Rl), and hydrologic storage coefficient (RHO); 2) conformation analysis, including drainage density (Dd), drainage texture (T), stream frequency (Fs), elongation ratio (Re), circulatory factor (Rc), form factor (Ff), compactness constant (Cc) and length of overland flow (Lg); and 3) terrain analysis, including relief ratio (Rr), gradient ratio (Gr) and ruggedness number (RN). The analysis of the watershed characteristic variables of KLs are shown in Table 2. After getting all parameters, watershed prioritization was carried out.
Table 2.
The standard formula for the watershed characteristic variables.
2.2.3. Compound Variables and Ranking Prioritization in Sub-Watersheds
Prioritization guidelines for the sub-watersheds followed those of Chandniha and Kansal [6]. The priorities of the potential watershed level require drainage system analysis, conformation analysis and terrain analysis to define watershed characteristics. The calculated compound parameters of each sub-watershed are revealed in ascending order, from the lowest score to the highest score, which can be classified into 5 levels as follows: very high priority (VH), high (H), medium (M), low (L) and very low (VL).
The results from Table 2 were used to analyze watershed characteristic variables and rank the capacity of the watershed. For prioritization, the compound factor was measured by summing all the ranks of linear variables, as well as forming variables and dividing by the number of variables. From the group of these mini-watersheds, the highest rank was assigned to the sub-watershed with the lowest compound factor, and so on. After the ranking of all the linear variables in all the sub-watersheds, the values of each watershed were confirmed to gain a compound value. Based on the average value, the priority criteria can be classified as follows [17]:
| <3.0 | Very high priority |
| 3.01–4.00 | High priority |
| 4.01–5.00 | Medium priority |
| 5.01–6.00 | Low priority |
| >6.1 | Very low priority. |
As seen in the result for the sub-watershed’s capacity in KLs, a flood mitigation plan should be implemented to prevent and decrease damage from severe flooding events in the future.
Sensitivity is the ratio responsible for the relationships between the variance of output and the change in input parameters [40,41]. The finite approximation of the partial derivative δy/δx can express the dependence of variable y on parameter x. y0 is the model output calculated with an initial value x0 of parameter x, varied by ∆x, yielding x1 = x0 − ∆x and x2 = x0 + ∆x, and leading to the corresponding outputs y1 and y2, respectively, as:
The sensitivity index, I, is a dimensionless term, which can be defined by the partial derivative as shown below:
The sensitivity index reveals the impact of the change in an input parameter on the model output, and the absolute value of I presents the comparative importance of parameter x to the model output y. Sensitivity indices can be categorized into four classes as shown in Table 3 [40,41].
Table 3.
Categorization of sensitivity index used in this study.
2.2.4. Land-Use and Land Cover Change Analysis
In the KLs area, land-use changes were evaluated by importing the land-use maps from 2002 and 2017 into the GIS database, and any changed detection of land-use was analyzed using spatial analysis. Land-use area was calculated to have changed from 2002 to 2017 using the tabulated area. The change estimation was used to identify the ‘‘from–to’’ change in land-use, and to quantify the different rates and magnitudes of those changes. The annual change in land-use was evaluated using Equation (3) [42]:
where ∆ is the average annual rate of change (%), A1 is the amount of a land-use type at time 1 (T1) and A2 is the amount of a land-use type at time 2 (T2).
∆ = [(A2 − A1)/A1 × 100]/(T2 − T1)
Based on the ranking of the KLs basin’s potential, the results of land-use changes are integral for implementing a land-use management plan, in terms of proposing the proper locations of reservoirs, which are used as water storage areas in the KLs area. This can then be used as a guide for local government agencies, to help solve flooding problems in the future.
3. Results and Discussion
The watershed characteristic variables of the upstream KLs area were calculated using the standard equation, as given in Table 2, by using ArcGIS. The properties of the stream network are crucial for studying the characteristics of the watershed, as they constitute the fundamental step of morphometric analysis. The physical watershed can be described using linear features of the drainage network, aerial features describing the shape of the sub-watershed, and relief features. These features indicate the inherent nature of each sub-watershed, which were applied to assess sensitivity to erosion and deterioration. Risk was associated with the socio-economic impact of deterioration on the sub-watersheds. Land-use was used as an index for measurement of the exposure to risk based on the risk assessment, the priority of the sub-watershed for monitoring developmental activities, and implementation of effective management strategies.
3.1. WC Variables of KLs Area
Table 2 displays the approach used for the calculation of the basic and derived morphometric parameters utilized in this study. The geometry, areal morphometric and relief morphometric were derived using the typical formula, as exhibited in Figure 3 and Supplementary Information, Tables S1–S3.
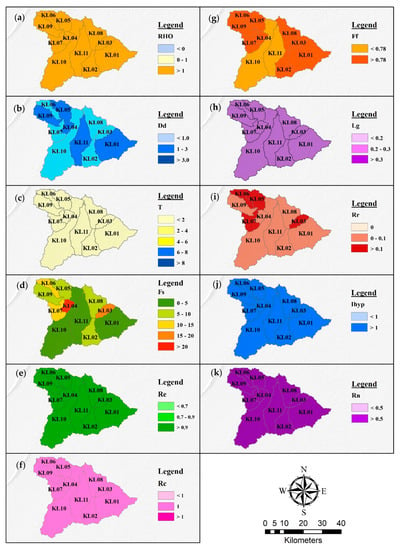
Figure 3.
Morphometric map for 11 sub-watersheds of KLs area including (a) Hydrologic storage coefficient (RHO); (b) Drainage density (Dd); (c) Drainage texture (T); (d) Stream frequency (Fs); (e) Elongation ratio (Re); (f) Circulatory factor (Rc); (g) Form factor (Ff); (h) Length of overland flow (LG); (i) Relief ratio (Rr); (j) Hypsometric Integral (Ihyp); and (k) Ruggedness number (Rn).
3.1.1. KLs Geometry
The drainage area of KLs is 1250.68 km2. A total of 11 sub-watersheds were depicted in the KLs. The sub-watersheds mostly exhibit a dendritic drainage pattern (Figure 4). KL10 is the largest, 323.51 km2 in area, while KL04 is the smallest with a 29.82 km2 area (Supplementary Information, Table S1). The drainage system in KLs was found in 6 orders, according to ranking by the drainage system criteria in [23], which is as follows: The 1st order is drainage as a watercourse branch as it appears around the upstream area; it is the leading order of watersheds, found with steep slopes and intermittent streams. When the 1st order is met it becomes the 2nd order, and so on until reaching the 6th order, which would be exhibited by the 1st drainage system increasing, and the branch drainage system would decrease until reaching the 6th order, as a perennial stream. Drainage systems in the study area primarily have the direction of South to North as they flow into the Chi River. The results could be used for analysis in the via areal morphometrics.
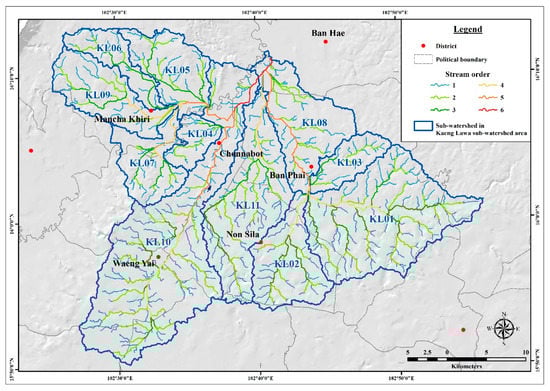
Figure 4.
Map of drainage and ranking based on Strahler [32].
The bifurcation ratio (Rb) exposes geometric similarities of the watershed. The proportion of the number of streams of a given order to the number of streams in the consecutive higher order were exposed [37]. The mean Rb of the sub-watershed is 0.98, while the mean stream length ratio (Rl) is approximately 1.00, and it is necessary to find the ratio of Rl and Rb to obtain the RHO coefficient [29]. The RHO value is a measure of physiographic development of the watershed with reference to the drainage system. From the study, the value of RHO is 1.00, on average. This indicates that the watershed has a low capacity for accumulating water, as well as low soil erosion, and the drainage ratio is at a high level. Soil erosion is at low level, and the drainage system is slightly high.
3.1.2. Areal Morphometric of KLs
The drainage in areal aspects was calculated, and is systematically shown in the Supplementary Information, Table S2. Drainage density (Dd) is one of the important drainage parameters in morphometric analysis [17,36]. Dd is a value that signifies the density of branch watercourses. According to the study of [36], once Dd is greater than 3, the watershed area has good drainage, whereas if Dd is between 1 and 3, this shows that the watershed area has medium drainage, and if Dd is less than 1, this identifies that watershed area as having bad drainage. In our results, Dd is at 1.00 on average, so it can be assumed that KLs has a medium level drainage system.
Drainage texture (T) shows the associated spacing of the waterways, and it has been described as the total number of stream segments of all orders per perimeter of that area [17]. The drainage texture (T) value influences infiltration and is classified into five classes, i.e., very coarse (<2), coarse (2–4), moderate (4–6), fine (6–8) and very fine (>8) [38]. In this study, the average value of T in the KLs was approximately 0.83. Therefore, this watershed’s surface is mostly of a very coarse type of topography, and this is because the geological nature of this watershed features sandstone as a basement rock, which affects its capacity to collect water. This is the major characteristic of the Mahasarakham Formation, which originally consisted of reddish brown or pale red siltstone, claystone and sandstone, with frequent rock salt, potash, gypsum and anhydrite [43].
Stream frequency (Fs) is the ratio between waterways in the 1st order and the watershed’s area. If Fs is high, it indicates low runoff, which can imply that water flows slowly from the upstream area. Whereas if Fs is low, water from upstream flows to downstream fast. As a result, KL04, 03, 06 and 07 watersheds show Fs at a high rate, which means that if there is heavy rainfall, stagnant water will probably accumulate, as it is hard to discharge the water in this watershed area.
Elongation ratio (Re) is the ratio between the diameter of a circle commensurate to the basin (D) and basin length (L). The higher Re is, the more circular the shape and the lower the elongated basin [19]. According to [41], Re can be classified into 3 classes: less elongated (<0.7), oval (0.8–0.9) and circular (>0.9). Dissimilar WCs possibly affect running water mass on the soil surface, and are related to the moving time of water from the upstream area to the downstream area. As a result, every watershed in this study area has an Re value over 1, indicating a circular shape. This means KLs has the highest vulnerability to flash floods because of its multiple branch watercourses. In other words, it has a low capacity for rainfall catchment and floods can occur frequently.
Circularity ratio (Rc) is the ratio between the basin area and the area of a circle at the relevant perimeter of the basin [12]. If the Rc value is higher than 1, this illustrates a non-circular shape, but if it is below 1, this implies this watershed is quite circular. From the study results of KLs, the Rc values of every watershed were below 1, and this shows a circular characteristic. The circularity ratio is affected by the following factors: stream length, geological structures, land-use, climatic condition, topography and slope.
Form factor (Ff) is the ratio of average width to length of a watershed. If the output shows that the range values for form factor are <0.78, they are elongated, and >0.78 indicates circular. It was found that the watersheds usually had values >0.78, and so most of them were circular, except KL10 and KL11, which had values of 0.20 and 0.21, respectively, due to their elongated characteristics.
The length of overland flow is the distance water flows over ground before it flows into a stream channel [1]. There are 3 classes of Lg, as follows: low value (<0.2), moderate value (0.2–0.3) and high value (>0.3). From the results of the study, all watersheds in KLs were above 0.3, which indicates gentle slopes and long flow paths, more infiltration, and reduced runoff.
3.1.3. Relief Morphometric Parameters
Relief ratio (Rr) indicates the contrast between the highest and lowest points in a watershed by elevation. The value range of the relief ratio still has not been cited regularly. A low value of relief ratio implies low relief, and a high value implies a steep slope with high relief. As a result, KLs displayed a very low Rr value, and so it can be interpreted that the topography of the watersheds were of low steepness (Supplementary Information, Table S3).
Hypsometric integral (Ihyp) represents the extent of fluvial erosion [39]. The Ihyp of the sub-watershed is more than 0.5, which means 80% of the original volume of the sub-watershed contained in the basins has been eroded. This factor is essential for considering the shape of the KLs and whether the topography has been eroded by the watercourse.
Ruggedness number (Rn) is an indicator of the flash flood potential of streams, and it can also represent the drainage density and maximum relief in the watershed. The KLs has a ruggedness number (Rn) of 0.07–0.25, which is relatively low, and indicates that the land surface is quite soft and provokes soil surface erosion easily.
3.2. Watershed Prioritization in KLs
In arranging and enforcing strategies for watershed restoration, the prioritization of sub-watersheds is the first step. With the watershed characteristic diversity of KLs clarified, we distinguished the morphology and prioritizing capacity in order to assess the features of the watershed that brings about watershed degradation. The final rank is presented as the cumulative rank (composite index), and is applied to assess the vulnerability to deterioration of each sub-watershed. It was found that only KL03 and KL04 of KLs had potentials at a medium level, while KL05, KL06 and KL07 were at a low level, and the other seven sub-watersheds were at very low level, especially KL01, with the lowest average value of approximately 7.85, followed by KL02, KL08, KL10, KL09 and KL11, respectively, as shown in Figure 5 and Table 4. This describes the risks of the six watersheds mentioned in their discharge water systems. A measurement is urgently required to prevent and manage disasters that will happen under extreme rainfall in the area.
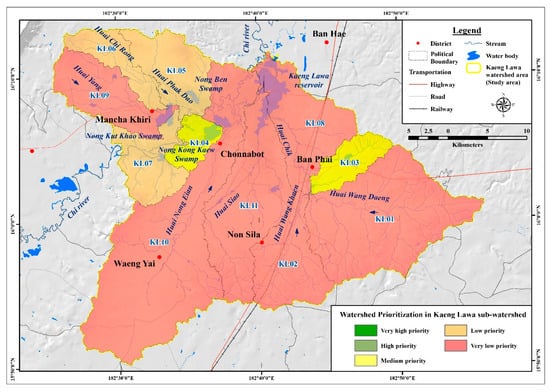
Figure 5.
Watershed prioritization in KLs.
Table 4.
Watershed prioritization in each sub-watershed in KLs.
As for the physical characteristics of the KL01 sub-watershed, the area of KLs is indicated as very low priority. Re, Rc and Ff values were at level 11, as a result of the watershed’s topography being round as well as having a lot of drainage branches, causing this area to have a high capacity for retaining a huge amount of rain. Moreover, the land surface in this area is slightly soft with surface roughness, since it contains mainly sandstone basement rock; this results in an inability to collect water in the soil, so surface water runs into the stream system. These effects can bring about the collapse and erosion of surface soil.
Based on watershed prioritization, with the catalyst of the greatest flooding in 40 years, this study showed that three sub-watersheds, KL01, KL10 and KL11, fall in the very low priority category. This implies that they are low vulnerability watersheds, which cannot contain much rainwater and generate large volumes of storm runoff quickly. This causes the greatest flooding in the downstream area. As a result, sub-watershed characteristics are an important factor, significantly impacting the flooding situation in the area. Furthermore, the most important factor in the watershed characteristics is land-use change, which can be exasperated by human activities. Thus, it is necessary to study land-use change in the watershed area, because managing the plan for land-use leads to significant measurements of the watershed’s ecology for use in water resource management. From the research results shown in the KLs potential-ranking, a study of land-use changes is integral to finding ways to manage land-use planning, in order to find suitable reservoir locations to store water in the KL01, KL10 and KL11 watershed area, so that related government agencies can solve this problem in the future.
Based on the sensitivity analysis shown in Table 5, for each parameter used in the prioritization of sub-watersheds in this study, we found that the highly sensitive parameters for most sub-watersheds were in the drainage system analysis (Rl, Rb, and RHO), while some parameters, including Fs and Re, presented as very highly sensitive, particularly in the low prioritization watersheds (KL1, KL10 and KL11). Furthermore, most of the other parameters in the conformation analysis and terrain analysis were classified as medium to high sensitivity parameters, except T and Rn, which were revealed as low sensitivity for almost all watersheds, including most of the low vulnerability watersheds, KL1, KL10 and KL11. Therefore, the findings of this study found that these two parameters (T and Rn) were very slightly sensitive to watershed potential, and so we can neglect to prioritize this watershed’s potential characterization (see Table 5; Supplementary Information, Table S4).
Table 5.
Sensitivity index ranking of watershed prioritization in KLs watershed.
3.3. Land-Use Change in KLs
Besides the very low priority condition of the watershed characteristics in the study area, another important factor influencing the drainage system of KLs and the flood problem is the land-use type. This has been substantially detected in several watersheds in the tropical climate region [44,45,46]. Their upstream and midstream areas are often susceptible to flash floods, with the circular and oval watershed shapes and sloped, undulating-plain terrain often leading to severe flash floods and extensive basin damage [47]. When it was found that the watershed area’s land use was farming, the distinctive features of minimal groundcover and a lack of large trees prevail. The forest area in the Chi watershed area, where most of the cropland has expanded to 70% agricultural area, is also a flood risk area [48]. The results revealed for the portions of land-use in 2002 and 2017 are exhibited in Table 6, and the spatial data processed using GIS software are displayed in Figure 6 and Figure 7. The results found that the majority of the area is covered with an agricultural area, and after 15 years, these agricultural areas have shown more diversified characteristics. For example, the cultivated cassava areas have been shrinking. Moreover, the ratio of sugarcane and para-rubber has increased due to an expansion of the sugar industrial base, brought about by the build-ups of several sugarcane factories in the Khon Kaen Province. Furthermore, there has been construction of combined-cycle biomass power plants, that supply bagasse from sugarcane to produce steam and electric power, with a steam production capacity of 185 tons/hour, ejecting high pressure steam. Total production capacity totals 19.8 megawatts, distributing electricity of 16 megawatts. The para-rubber area has also expanded continuously since the government started supporting the para-rubber industry for export, and hence this upstream area has been expanding as mentioned.
Table 6.
Comparison of land-use in the KLsarea during 2002–2017.
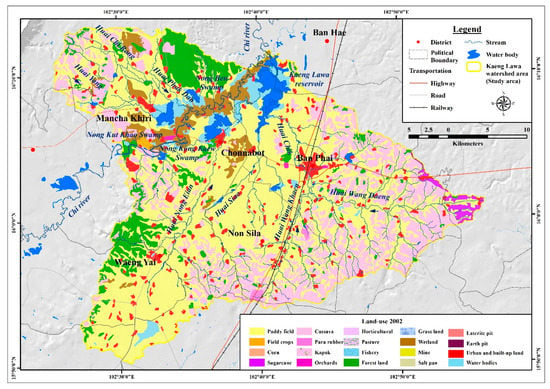
Figure 6.
Land-use patterns in 2002 of KLs area, Khon Kaen Province.
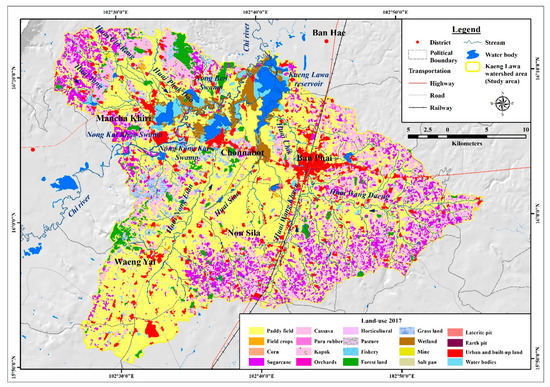
Figure 7.
Land-use patterns in 2017 of KLs area, Khon Kaen Province.
As the results of the study of land-use dynamics during the period 2002–2017 show, urbanization and built-up areas have expanded rapidly, from 62.826 to 83.859 km2 (Figure 8), causing the KL01, KL02 and KL08 watersheds to have very low priority levels, and leading KL03 to attain medium priority. These four watersheds are in the Ban Phai district, where branch drainage systems are dense and short. Further, the geological base is Quaternary sediments, which can hardly catch rainwater. Therefore, runoff was quickly generated and flowed through the Ban Phai district, causing the great flood on August 31, 2019. Furthermore, the other principal factor that accelerated the heavy flooding was insufficient forest area in the upstream area. The forest area decreased from 100.007 km2 (in 2002) to only 36.950 km2 (in 2017). As shown in Figure 6, deforestation in the upstream forest area totals 63% since 2002, which has been replaced with agricultural area, such as sugarcane, para-rubber, kapok, cassava, corn, fruit farms, etc., which can affect water overflow into the city.
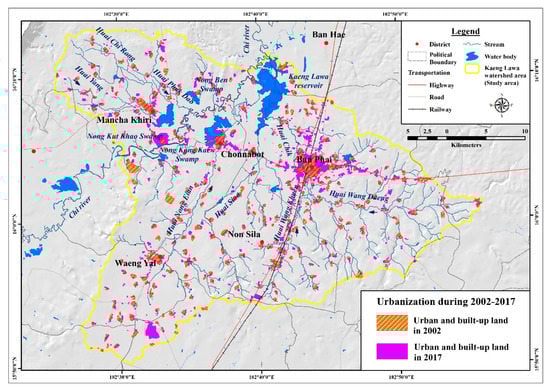
Figure 8.
Urbanization during 2002–2017 in KLs area, Khon Kaen Province.
According to the results, the WC variables of the KLs area compare to those of the upstream area of the Sungai Batu watershed in Selangor, Malaysia [19], as both are located in the same climate and region. Hence, the dissimilarities between the essential factors of the great flood in the KLs area were unveiled. The physical characteristics could be defined as the stream frequency (Fs) of KLs, which was obviously higher than that of the Sungai Batu watershed. It caused a long period of flooding across the mentioned areas. The inefficient management system of the KLs area, plus its long waterway, caused the runoff from upstream to downstream to take a longer time. Based on land-use information of the KLs watershed, we can conclude that the contributing factor that caused the greatest flood in 40 years was a significant decrease in forest area covering the upstream area, which has been almost completely replaced with agricultural area (Figure 9). Furthermore, the extension of urbanization and built-up areas in the downstream regions, especially the Nong Phai, Chonnabot and Mancha Khiri districts, obstructs the flow of water into the Chi River. Finally, the proportions of land-use changes in KLs during 2002–2017 are shown in Figure 10 and Supplementary Information, Tables S5 and S6. They reveal that the forest area has been significantly changed to paddy fields; up to 25% of the original forest areas. The other changed areas of the original forest areas were changed to cassava (15%), kapok (11%) and sugarcane (8%). Interestingly, most of the areas in the watersheds KL01, KL10 and KL11 are in line with the previous part, revealing that the basins have a very low priority. This information from the study of the priority of the KLs area is significant, and applicable as spatial information for supporting appropriate decisions regarding the regulation, follow-up and control dynamics of land-use in the current areas. In addition, a spatial database of the fundamental priorities of waterway systems, along with land-use changes, can help ground a better understanding for proposing proper flood mitigation and land-use management in the future.
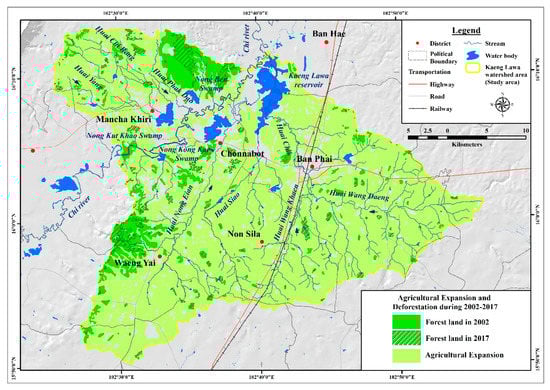
Figure 9.
The expansion of agricultural areas and deforestation during 2002–2017 in KLs area, Khon Kaen Province.
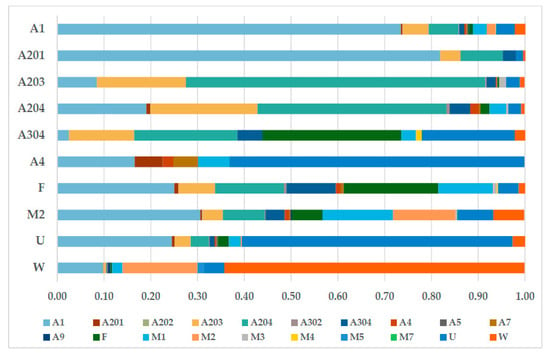
Figure 10.
Proportions of land-use change during 2002–2017 in KLs area.
According to this study of the dynamics of land-use change, the upstream areas in the KLs area, which showed significant loss of forestry area and the expansion of agricultural area, could explain the flooding encountered in those areas during 29–31 August 2019, which was the worst flooding in 40 years in this watershed area (Figure 11).
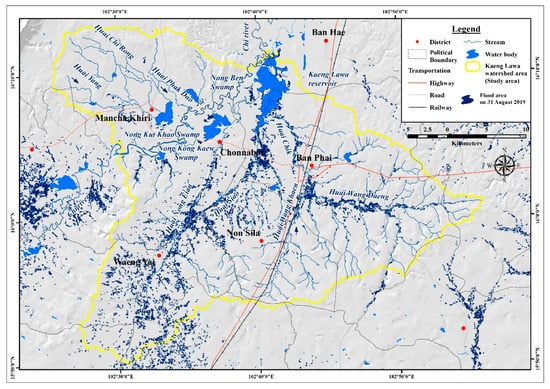
Figure 11.
Flooding areas by the influence of Podul tropical storm during 29–31 August 2019.
Figure 11 shows the flooded areas that were investigated with the COSMO-SkyMed-4 satellite, derived from the Geo-Informatics and Space Technology Development Agency (public organization) (GISTDA). It was found that the tropical storm Podul caused flooding over KLs, covering an area of approximately 90.45 km2 (7.23%) of the KLs watershed area. In addition, prioritization of the area was defined as very low, as the flooded areas were in a range between 0.10% and 13.38%, with an average of 7.23% (Table 7). As such, the KL10, KL11 and KL01 watershed, and especially the KL10 watershed, which has the largest area of all the watersheds, was covered by floodwater (43.07 km2, or 13.31 % of the watershed area). KL01, where the Ban Phai district is located, plus the downstream and urban areas, directly encountered the flood from the Podul Storm, which covered a flooded area of approximately 10.31 km2 (4.62% of the watershed area) (Table 7).
Table 7.
The flood area proportion of KLs watershed area on August 29–31, 2019.
The findings reveal that the watershed characteristic variables and land-use data, as well as the flooding situation, are integral, and must be studied first. For the impacts of storms on water management, the first level of management of a disaster-prone situation should be an effective preventative procedure, and thus spatial data should be prepared. The results showed that the watershed areas KL01, KL10 and KL11 exhibited watershed characteristics that have been caused by land-use changes, from forested areas to agricultural expansion areas, disturbing watershed potential characterization. This is a catalyst of the important situation in the KLs. In this research, the first step is to prepare for prevention, so that KLs will not have more frequent flooding in the future.
According to Hounkpè et al. [45], it was found that land-use changes causing flood risk to areas will be amplified if the rate of forest land conversion to croplands and pastures increases. Similar to the findings of Shrestha and Lohpaisankrit [48] concerning the flood hazard assessment that occurred in the Yang River watershed, where an HEC-RAS model was used for flooding simulations, flood hazard maps at 10-, 25-, 50- and 100-year return periods were presented. It was found that rice planting areas and urban areas would be affected by floods, up to +72% and +218% respectively, in the future, so several additional measures to control land-use planning in upstream areas are needed.
In the present study, the three watershed areas should be urgently integrated into watershed management schemes as a major priority, in order to prevent heavy flooding when a monsoon trough or storm crosses over the KLs watershed area. Further, we should be prepared to mitigate flood events in the downstream areas, particularly the Ban Phai district, which has flooded recently. Furthermore, in the Chonnabot district, as a commercial and residential area that has a high susceptibility to flooding in the future, a preventive policy is urgently required. Consequently, the results and findings in this study provide considerable information for the planning of water resource and land-use management, to mitigate flooding in the future. Furthermore, the methodology and selected sensitivity parameters can be further applied to other similar topographical characteristics, which generally found low hills and undulating plain areas in the upstream area.
3.4. Validation with Watershed Classification Data
The five-class prioritization map was validated with watershed classification data with the reference map derived from the Department of Water Resources in 1991, using tabulate area analysis in GIS software. The results show that an error matrix was produced (Table 8). According to Table 8, most producers accuracy and users accuracy data are categorized into very low, low and moderate watershed areas. For all five classes there are watershed classification data covering the potential area of 988.34 km2, matched with the derived priority class, resulting in an accuracy of 79.01% and Kappa value of 0.58.
Table 8.
Validation between the prioritization map and the watershed classification data derived from the Department of Water Resources in 1991.
4. Conclusions
For the resolution of flooding problems, it is necessary to study the issue in the context of the sub-watershed level and the branches of the sub-watershed, in order to clarify three characteristics of three main aspects: linear, areal and relief. In this research, six sub-watersheds were displayed as very low priority in three main aspects of the KLs. This study indicated a huge amount of runoff from the upstream to the downstream areas. The sub-watershed area in the eastern region of KLs is vulnerable to flooding, while in the western region of KLs flooding rarely occurs, because of greater sloping in that area than in the eastern area. In contrast, the effects of flooding occur in the downstream areas, near the Chonnabot district and the Mancha Khiri district, instead, due to its basin area and the large amount of wetland. It was found that the watershed characteristic variables of the KLs basin in KL01, KL10 and KL11 are of very low priority, since the stream frequencies (Fs) are only 2.95, 2.03 and 4.05, respectively. This indicates that if Fs is low, water from upstream flows downstream fast and causes the amount of water to accumulate in the downstream area, resulting in flooding. The elongation ratio (Re), which indicates the shape of the basin to be very wide and long, allows for a lot of rainfall. In addition, there was a large number of tributaries when tropical storm Podul occurred in the watershed areas, which, with land-use changes in the upstream areas leaving no remaining forested areas, caused no retention and quick runoff flow to the downstream areas of the KLs, resulting in flooding in the Ban Phai district that was the most extreme flooding in the past 40 years. The findings of this current study showed that the morphology, river shape and drainage systems are the contributing factors, integrated with land-use changes, to assess water management problems, concerning land-use planning in conjunction with integrated watershed management.
A three-levelled conceptual framework of policy recommendations, for the management of flood-affected areas in the KLs and upstream areas of other watersheds in Thailand, including other parts of the world, is as follows: The first level is flood prevention, as the local agency should prepare spatial data effectively, especially spatial data in upstream areas. Most upstream areas in Thailand still lack important information, especially rainfall and runoff observed data, which should be established via rainwater and runoff measurement stations to assess the water level in the upstream areas, which can then be used to establish a warning system. The next level is preparation and alert. This level is a very important step, as disasters tend to be spontaneous occurrences. Such rainfall and runoff information, including satellite data, can be employed for simulated stream flows. The last level is decision-making and crisis communication. This involves the integration of information from both levels mentioned previously, for the agencies and local people to prepare well for flooding situations that may occur. This is significant information for the department involved in manipulating and setting plans for handling future floods, including the establishment of guidelines for an effective, long-term management plan that specifies susceptible areas in the future.
Supplementary Materials
The following are available online at https://www.mdpi.com/2073-4441/12/6/1570/s1, Table S1: Geometry parameters of the KLs area, Table S2: Areal morphometric parameters of the KLs area, Table S3: Relief morphometric parameters of the KLs area, Table S4: Sensitivity index of Watershed Prioritization in KLs output to input parameters, Table S5: Matrix of land-use changes in KLs area, 2002–2017 (km2), Table S6: Matrix of proportion land-use changes in KLs area, 2002–2017.
Author Contributions
Conceptualization, K.W. and S.C.; methodology, K.W.; software, K.W.; validation, K.W. and S.C.; formal analysis, K.W.; investigation, K.W.; resources, K.W. and S.C.; data curation, K.W. and S.C.; writing—original draft preparation, K.W.; writing—review and editing, S.C.; visualization, K.W.; supervision, S.C.; project administration, S.C.; funding acquisition, K.W. and S.C. All authors have read and agreed to the published version of the manuscript.
Funding
“This research was funded by Grant for Research: Government Budget, Chulalongkorn University, grant number GBA-60-0027-23-006-1”, “This research was funded by the Ratchadapisek Sompoch Endowment Fund (2020), Chulalongkorn University, grant number 763014 Climate Change and Disaster Management Cluster”, “This research was funded by Grant for International Research Integration: Chula Research Scholar, Ratchadaphiseksomphot Endowment Fund, grant number GCURS-59-06-79-01” and “The APC was partially funded by Ratchadaphiseksomphot Endowment Fund, Chulalongkorn University”.
Acknowledgments
Acknowledgments to the U.S. Geological Survey (Earth Explorer Homepage: https://earthexplorer.usgs.gov/) for providing their Landsat imagery and Geo-Informatics and Space Technology Development Agency (public organization) (GISTDA) for flood areas in Thailand. The authors also thank the geology department, faculty of science, Chulalongkorn University for supporting facilities in this research.
Conflicts of Interest
The authors declare no conflict of interest.
References
- Khan, M.A.; Gupta, V.P.; Moharana, P.C. Watershed prioritization using remote sensing and geographical information system: A case study from Guhiya, India. J. Arid Environ. 2001, 49, 465–475. [Google Scholar] [CrossRef]
- Patel, D.P.; Gajjar, C.A.; Srivastava, P.K. Prioritization of Malesari mini-watersheds through morphometric analysis: A remote sensing and GIS perspective. Environ. Earth Sci. 2013, 69, 2643–2656. [Google Scholar] [CrossRef]
- Gumma, M.K.; Birhanu, B.Z.; Mohammed, I.A.; Tabo, R.; Whitbread, A.M. Prioritization of Watersheds across Mali Using Remote Sensing Data and GIS Techniques for Agricultural Development Planning. Water 2016, 8, 260. [Google Scholar] [CrossRef]
- Chotpantarat, S.; Boonkaewwan, S. Impacts of land-use changes on watershed discharge and water quality in a large intensive agricultural area in Thailand. Hydrol. Sci. J. 2018, 63, 1386–1407. [Google Scholar] [CrossRef]
- Chatewutthiprapa, C.; Chotpantarat, S.; Yumuang, S. Land use and cover change of chanthaburi watershed following 1999, 2006 and 2013 floods. In Springer Geography—Geoinformatics for Sustainable Development in Asian Cities; Monprapussorn, S., Lin, Z., Sitthi, A., Wetchayont, P., Eds.; Springer Nature: Cham, Switzerland, 2020; pp. 21–31. [Google Scholar]
- Chandniha, S.K.; Kansal, M.L. Prioritization of sub-watersheds based on morphometric analysis using geospatial technique in Piperiya watershed, India. Appl. Water Sci. 2014, 7, 329–338. [Google Scholar] [CrossRef]
- Welde, K. Identification and prioritization of subwatersheds for land and water management in Tekeze dam watershed, Northern Ethiopia. Int. Soil Water Conserv. Res. 2016, 4, 30–38. [Google Scholar] [CrossRef]
- Klongvessa, P.; Lu, M.; Chotpantarat, S. Response of the flood peak to the spatial distribution of rainfall in the Yom River basin, Thailand. Stoch. Environ. Res. Risk Assess. 2018, 32, 2871–2887. [Google Scholar] [CrossRef]
- Joshi, L.M.; Kotlia, B.S.; Singh, A.K. Geomorphic characteristics of landscape development and formation of lakes in the zone of Munsiari Thrust, Garhwal Himalaya, Uttarakhand, India. Quat. Int. 2019, 507, 233–248. [Google Scholar] [CrossRef]
- Su, Q.; Yuan, D.; Zhang, H.; Manopkawee, P.; Zhan, Y.; Zhang, P.; Xie, H. Geomorphic evidence for northeastward expansion of the eastern Qilian Shan, northeastern Tibetan Plateau. J. Asian Earth Sci. 2019, 177, 314–323. [Google Scholar] [CrossRef]
- Rahmati, O.; Samadi, M.; Shahabi, H.; Azareh, A.; Rafiei-Sardooi, E.; Alilou, H.; Melesse, A.M.; Pradhan, B.; Chapi, K.; Shirzadi, A. SWPT: An automated GIS-based tool for prioritization of sub-watersheds based on morphometric and topo-hydrological factors. Geosci. Front. 2019, 10, 2167–2175. [Google Scholar] [CrossRef]
- Javed, A.; Khanday, M.Y.; Rais, A. Watershed Prioritization Using Morphometric and Land-use/Land Cover Parameters: A Remote Sensing and GIS Based Approach. J. Geol. Soc. India 2011, 78, 63–75. [Google Scholar] [CrossRef]
- Waiyasusri, K.; Yumuang, S.; Chotpantarat, S. Monitoring and predicting land use changes in the Huai Thap Salao Watershed area, Uthaithani province, Thailand, using the CLUE-s model. Environ. Earth Sci. 2016, 73, 533. [Google Scholar] [CrossRef]
- Brendel, C.; Soupir, M.L. Relating Watershed Characteristics to Elevated Stream Escherichia coli Levels in Agriculturally Dominated Landscapes: An Iowa Case Study. Water 2017, 9, 154. [Google Scholar] [CrossRef]
- Jakada, H.; Chen, Z.; Luo, M.; Zhou, H.; Wang, Z.; Habib, M. Watershed Characterization and Hydrograph Recession Analysis: A Comparative Look at a Karst vs. Non-Karst Watershed and Implications for Groundwater Resources in Gaolan River Basin, Southern China. Water 2019, 11, 743. [Google Scholar] [CrossRef]
- Rama, V.A. Drainage basin analysis for characterization of 3rd order watersheds using Geographic Information System (GIS) and ASTER data. J. Geomat. 2014, 8, 200–210. [Google Scholar]
- Sujatha, E.R.; Selvakumar, R.; Rajasimman, U.A.B.; Victor, R.G. Morphometric analysis of sub-watershed in parts of Western Ghats, South India using ASTER DEM. Geomat. Nat. Hazards Risk 2015, 6, 326–341. [Google Scholar] [CrossRef]
- Cheah, R.; Billa, L.; Chan, A.; Teo, F.Y.; Pradhan, B.; Alamri, A.M. Geospatial Modelling of Watershed Peak Flood Discharge in Selangor, Malaysia. Water 2019, 11, 2490. [Google Scholar] [CrossRef]
- Malik, N.K.A.; Manaf, L.A.; Jamil, N.R.; Rosli, M.H.; Yusof, F.M. Morphometric Analysis of Upstream Sungai Batu Catchment in Selangor, Malaysia Using Geographical Information System (GIS). EnvironmentAsia 2019, 12, 155–163. [Google Scholar]
- Strager, M.P.; Fletcher, J.J.; Strager, M.J.; Yuill, C.B.; Eli, R.N.; Petty, J.T.; Lamont, S.J. Watershed analysis with GIS: The watershed characterization and modeling system software application. Comput. Geosci. 2010, 36, 970–976. [Google Scholar] [CrossRef]
- Komori, D.; Nakamura, S.; Kiguchi, M.; Nishijima, A.; Yamazaki, D.; Suzuki, S.; Kawasaki, A.; Oki, K.; Oki, T. Characteristics of the 2011 Chao Phraya River flood in Central Thailand. Hydrol. Res. Lett. 2012, 6, 41–46. [Google Scholar] [CrossRef]
- Thanvisitthpon, N.; Shrestha, S.; Pal, I. Urban Flooding and Climate Change: A Case Study of Bangkok, Thailand. Environ. Urban. ASIA 2018, 9, 86–100. [Google Scholar] [CrossRef]
- Maskong, H.; Jothityangkoon, C.; Hirunteeyakul, C. Flood Hazard Mapping Using On-site Surveyed Flood Map, HECRAS V.5 and GIS Tool: A Case Study of Nakhon Ratchasima Municipality, Thailand. Int. J. 2019, 16, 1–8. [Google Scholar] [CrossRef]
- Tanwattana, P. Systematizing Community-Based Disaster Risk Management (CBDRM): Case of Urban Flood-prone Community in Thailand Upstream Area. Int. J. Disaster Risk Reduct. 2018, 28, 798–812. [Google Scholar] [CrossRef]
- Komolafe, A.A.; Herath, S.; Avtar, R. Establishment of detailed loss functions for the urban flood risk assessment in Chao Phraya River basin, Thailand. Geomat. Nat. Hazards Risk 2019, 10, 633–650. [Google Scholar] [CrossRef]
- NVCA. Integrated Watershed Management Plan; Nottawasaga Valley Conservation Authority: Utopia, ON, Canada, 2019; p. 52.
- Perry, J.; Thompson, L. Empowering the Next Generation of Watershed Decision-Makers: A Pedagogical Design. Water 2019, 11, 662. [Google Scholar] [CrossRef]
- Rai, P.K.; Mohan, K.; Mishra, S.; Ahmad, A.; Mishra, V.N. A GIS-based approach in drainage morphometric analysis of Kanhar River Basin, India. Appl. Water Sci. 2017, 7, 217–232. [Google Scholar] [CrossRef]
- Ratchawang, S.; Chotpantarat, S. The Leaching Potential of Pesticides in Song Phi Nong District, Suphan Buri Province, Thailand. EnvironmentAsia 2019, 12, 112–120. [Google Scholar]
- Canisius, F.; Brisco, B.; Murnaghan, K.; Kooij, M.V.D.; Keizer, E. SAR Backscatter and InSAR Coherence for Monitoring Wetland Extent, Flood Pulse and Vegetation: A Study of the Amazon Lowland. Remote Sens. 2019, 11, 720. [Google Scholar] [CrossRef]
- Benoudjit, A.; Guida, R. A Novel Fully Automated Mapping of the Flood Extent on SAR Images Using a Supervised Classifier. Remote Sens. 2019, 11, 779. [Google Scholar] [CrossRef]
- Liu, J.; Xu, Z.; Chen, F.; Chen, F.; Zhang, L. Flood Hazard Mapping and Assessment on the Angkor World Heritage Site, Cambodia. Remote Sens. 2019, 11, 98. [Google Scholar] [CrossRef]
- Strahler, A.N. Quantitative geomorphology of drainage basin and channel networks. In Handbook of Applied Hydrology; Chow, V.T., Ed.; McGraw Hill: New York, NY, USA, 1964; pp. 4–76. [Google Scholar]
- Strahler, A.N. Quantitative Analysis of Watershed Geomorphology. Eos Trans. Am. Geophys. Union 1957, 38, 913–920. [Google Scholar] [CrossRef]
- Horton, R.E. Drainage basin characteristics. Trans. Am. Geophys. Union 1932, 13, 350–361. [Google Scholar] [CrossRef]
- Schumm, S.A. Evolution of drainage systems and slopes in badlands at Perth Amboy, New Jersey. Geol. Soc. Am. Bull. 1956, 67, 597. [Google Scholar] [CrossRef]
- Mesa, L.M. Morphometric analysis of a subtropical Andean basin (Tucumam, Argentina). Environ. Geol. 2006, 50, 1235–1242. [Google Scholar] [CrossRef]
- Smith, K.G. Standards for grading texture of erosional topography. Am. J. Sci. 1950, 248, 655–668. [Google Scholar] [CrossRef]
- Markose, V.J.; Jayappa, K.S. Hypsometric analysis of Kali River Basin, Karnataka, India, using geographic information system. Geocarto Int. 2011, 26, 553–568. [Google Scholar] [CrossRef]
- Lenhart, T.; Eckhardt, K.; Fohrer, N.; Frede, H.G. Comparison of two different approaches of sensitivity analysis. Phys. Chem. Earth 2002, 27, 645–654. [Google Scholar] [CrossRef]
- Dai, J.F.; Chen, J.Z.; Lu, G.; Brown, L.C.; Gan, L.; Xu, Q.X. Application of SWAT99.2 to sensitivity analysis of water balance components in unique plots in a hilly region. Water Sci. Eng. 2017, 10, 209–216. [Google Scholar] [CrossRef]
- Jia, Z.; Ma, B.; Zhang, J.; Zeng, W. Simulating Spatial-Temporal Changes of Land-Use Based on Ecological Redline Restrictions and Landscape Driving Factors: A Case Study in Beijing. Sustainability 2018, 10, 1299. [Google Scholar] [CrossRef]
- DMR (Department of Mineral Resources Department). The Geological Classification for Geological and Mineral Resources Management, Khon Kaen Province; Department of Mineral Resources Department: Bangkok, Thailand, 2009; p. 140.
- Yangchan, J.; Jain, A.K.; Tiwari, A.K. Morphometric Analysis of Drainage Basin through GIS: A Case study of Sukhna Lake Watershed in Lower Shiwalik. J. Sci. Eng. 2015, 6, 1015–1023. [Google Scholar]
- Hounkpè, J.; Diekkrüger, B.; Afouda, A.A.; Sintondji, L.O.C. Land use change increases food hazard: A multi-modelling approach to assess change in food characteristics driven by socio-economic land use change scenarios. Nat. Hazards 2019, 98, 1021–1050. [Google Scholar] [CrossRef]
- Klongvessa, P.; Lu, M.; Chotpantarat, S. Variation of characteristics of consecutive rainfall days over northern Thailand. Theor. Appl. Climatol. 2018, 133, 737–749. [Google Scholar] [CrossRef]
- Prabnakorn, S.; Suryadi, F.X.; Chongwilaikasem, J.; Fraiture, C. Development of an integrated food hazard assessment model for a complex river system: A case study of the Mun River Basin, Thailand. Model. Earth Syst. Environ. 2019, 5, 1265–1281. [Google Scholar] [CrossRef]
- Shrestha, S.; Lohpaisankrit, W. Flood hazard assessment under climate change scenarios in the Yang River Basin, Thailand. Int. J. Sustain. Built Environ. 2017, 6, 285–298. [Google Scholar] [CrossRef]


© 2020 by the authors. Licensee MDPI, Basel, Switzerland. This article is an open access article distributed under the terms and conditions of the Creative Commons Attribution (CC BY) license (http://creativecommons.org/licenses/by/4.0/).