Article

A Numerical Validation of 3D Experimental Dam-Break Wave Interaction with a Sharp Obstacle Using DualSPHysics

1
Department of Civil Engineering, University of Salerno, Via Giovanni Paolo II, 132, 84084 Fisciano, Italy
2
Department of Civil Engineering, Iskenderun Technical University, 31200 Iskenderun, Turkey
3
Civil and Mechanical Engineering Department, University of Cassino and Southern Lazio, 03043 Cassino, Italy
*
Author to whom correspondence should be addressed.
Water 2021, 13(15), 2133; https://doi.org/10.3390/w13152133
Submission received: 29 June 2021 / Revised: 24 July 2021 / Accepted: 28 July 2021 / Published: 3 August 2021

Abstract

:
The presence downstream of a dam of either rigid or erodible obstacles may strongly affect the flood wave propagation, and this complex interaction may lead to further dramatic consequences on people and structures. The open-source Lagrangian-based DualSPHysics solver was used to simulate a three-dimensional dam-break in a closed domain including an oriented obstacle that deflects the flow, thus increasing the complexity of fluid dynamics. By comparing numerical results with experimental data, the effectiveness of the model was evaluated and demonstrated with an extensive sensitivity analysis based on several parameters crucial to the smoothed particle hydrodynamics method, such as the resolution, the boundary conditions, and the properties of the interaction weight function. Charts and summary tables highlight the most suitable conditions for simulating such occurrences in the DualSPHysics framework. The presence of the obstacle, being also an opportunity for observation and study of complex fluid dynamics, opens the way to investigate the fluid interaction with solid objects involved in dam-break events and, possibly, to predict their effect with respect to the relative position between them and the flood and other relevant parameters. Finally, the numerical model presents a good overall agreement.

1. Introduction

With all their benefits, dams also carry a certain risk of failure that, in most cases, results in catastrophic consequences: from the damaging and/or destruction of buildings and infrastructure to the loss of human lives [1]. The experimental and numerical investigation of dam-break events has always been a central task, and several studies have been carried out to predict the resulting flow dynamics (e.g., [2]).
The presence of obstacles such as buildings, bridge piers, and roads plays an important role in the water depth distribution, velocity propagation, and, more in general, the flow regime. It also implies a greater complexity of the numerical modeling, even in the fixed-bed case, due to the interaction of the fluid wave with the impacting structures (e.g., [3,4]). The orientation of these constructions, with respect to the main flow direction, influences the flow peculiarities as well. Over all of these aspects, numerical simulations can provide vital information on the impact force exerted by an approaching dam-break wave [5,6,7,8,9,10,11].
The treatment of the presence of the rigid obstacle was traditionally tackled with simple numerical approaches, such as the shallow water equations (SWEs) [11,12], but further simulations of propagation of dam-break waves in urban areas [13,14,15] have shown that significant errors occur where the flow is strongly three-dimensional (3D). Aureli and co-workers [16] compared the predictions of a two-dimensional (2D) depth-averaged model, a 3D Eulerian two-phase model, and a 3D smoothed particle hydrodynamics (SPH) model in estimating the load exerted by a dam-break wave on a rigid squat structure. The results show that the 2D model based on the shallow-water approach leads to an error in the peak load in the order of 10% compared with the experimental data. The need for accurate predictions on the flow behavior motivated this study with a 3D investigation, thanks also to the increased computing power: the numerical simulation are, hence, executed in a SPH-based framework.
The SPH method belongs to the family of meshfree particle methods (MPMs), which present several advantages over mesh-based methods, such as the natural ability to solve multi-mechanics problems. Its Lagrangian nature allows computing, with relative ease, multi-mechanics problems involving complex interfaces and moving boundaries. By now, the SPH method is well established in the computational fluid dynamics (CFD) discipline, and its effectiveness has been proven in several works, especially when dealing with free-surface flows and large deformations [17,18,19,20,21,22,23,24].
DualSPHysics [25] is an advanced meshless solver with emphasis on free-surface flow modeling and has been shown to be robust and accurate in a wide range of applications: reproducing extreme wave events [26], coastal engineering simulations [27,28], fluid–solid interaction (FSI) [29,30], wave energy converters [31,32,33,34,35], etc. The peculiarities of this solver make it suitable for dam-break simulations, since it is naturally able to handle large deformations and violent impacts that involve solid obstacles [36,37]; it follows that SPH-based numerical models could be as effective as, if not better than, the traditional methods applied to the dam failure records, such as the ones based on 2D SWEs [38,39] or the VOF- or FEM-based [40,41] models.
In this work, small-scale laboratory experiments conducted by Kocaman et al. (2020) [3] are compared to a Lagrangian-based numerical model to examine the problem with a single obstacle. A numerical investigation of a 3D dam-break impacting a sharp obstacle was carried out with the SPH-based solver DualSPHysics. The DualSPHysics code was tested with respect to multiple aspects crucial to the SPH method to prove the effectiveness of the latter in reproducing phenomena usually tackled with grid-based methods. A wide sensitivity analysis based on several parameters, such as the resolution (initial inter-particle distance), the interaction domain dimension, and the boundary conditions (BC) treatment, was conducted against the experimental and numerical results depicted in [3]. The effectiveness of the SPH method in reproducing complex free-surface fluid dynamics, shown in this study, can lead the way to the simulation of more complex problems not easily solvable with the traditional finite difference method (FDM), but for which the SPH method is naturally suitable, e.g., debris flow combined with FSI.
This paper is structured as follows. In Section 2, the experimental set-up provided by Kocaman et al. (2020) [3] is reported. In Section 3, the SPH formulation for the governing equations implemented in DualSPHysics is presented, along with the boundary conditions treatment. Section 4 exposes the numerical implementation of the model, the crucial parameters taken into account, and the data analysis process. In Section 5, several charts and tables describe the results of the work, divided according to the prevalent fluid dynamics typology, including an introductory FSI analysis. Section 6 summarizes the main results of this research, giving an overall evaluation and detailing on the effects of the analyzed parameters, presenting an outlook of possible future investigations.

2. Experimental Set-Up

In this section, the reference experimental set-up is presented. The experiments were performed on a rectangular horizontal channel, 1.00 m long, 0.50 m wide, and 0.35 m high (Figure 1a). Bottom and lateral walls were made of thick glass. The upstream water domain at rest was 0.25 m long and h w = 0.15 m high, mimicking the presence of a reservoir. The water domain was confined by a transverse wall s = 0.01 m thick, made up of two lateral fixed parts and a central mobile gate, the motion of which activated the dam-break flow. The sluice gate, made of acrylic, was placed with its center of gravity aligned with the streamwise plan of symmetry. Waterproofing was achieved by using grease oil over the vertical guides.
In order to simulate the sudden removal of the closing gate, a 15 kg mass connected with a steel rope was set to fall down from an elevation of 1 m, generating a fast and complete gate opening. The opening time was about 0.06 s from video recordings, a period smaller than the recommended value for an instantaneous opening [42], 1.25 ( h w / g ) 1 / 2 = 0.15 s, with g being the gravity acceleration. Before performing any measurement, the upstream reservoir was filled with water. Dry bed conditions were realized at the downstream instead. The rectangular obstacle, 0.15 m long and 0.08 m wide, was located 0.25 m downstream the mobile plate with a rotation of θ = 28 . 0724 , to have one of its diagonals overlap the flow direction (Figure 1a). In order to detect the fluid motion, yellow dye was added to the water before removing the gate. Five ultrasonic sensor (MIC + 35/IU/TC, range 65–300 mm, at location P1, and MIC + 25/IU/TC, range 30–250 mm, at locations P2–P5) sampled the water levels (Figure 1b), and a high-speed 300 fps CCD camera recorded the experiment evolution. Moreover, the numerical investigation [3] produced with a volume of fluid (VOF) and Fractional Area/Volume Obstacle Representation (FAVOR TM ) model, which uses a k ε method to close Reynolds-Averaged Navier–Stokes (RANS) equations [43], was used as an extra reference in this work.

3. SPH Formulation

MPMs, in general, refer to the class of meshfree methods that employ a set of finite number of discrete particles to represent the state of a system and record its movement. Each particle can either be directly associated with one discrete physical object or be generated to represent a part of the continuum problem domain. For CFD problems, each particle possesses a set of field variables such as mass, momentum, energy, positions, etc. and other variables (vorticity, etc.) related to the specific problem. The advantages of the MPMs over conventional grid-based numerical methods can be roughly summarized as follows:
  • The problem domain is discretized with particles without a fixed connectivity, so treatment of large deformation is relatively easier.
  • Discretization of complex geometry is simpler as only an initial discretization is required.
  • It is easy to obtain the features of the entire physical system through tracing the motion of the particles, and, therefore, identifying free surfaces, moving interfaces, and deformable boundaries is no longer a tough task.
Among the MPMs, the smoothed particle hydrodynamics (SPH) method was employed in the present work.

3.1. Principles of the SPH Method

The strategy in SPH is to discretize the physical domain (fluid and/or solid objects) into a set of particles, where the physical quantities (position, velocity, density, and pressure) are obtained as an interpolation of the corresponding quantities of the surrounding particles. The contribution of those particles is weighted using a kernel function, with an area of influence that is defined using a characteristic smoothing length. This discretization process is divided into two key steps [44].
The first step is the integral representation or the so-called kernel approximation of field functions, consisting in the integration of an arbitrary function and a smoothing kernel function. The integral representation of a generic spatial function f ( r ) within an integral volume Ω is given by:
< f ( r ) > = Ω f ( r ) W ( r r , h ) d r
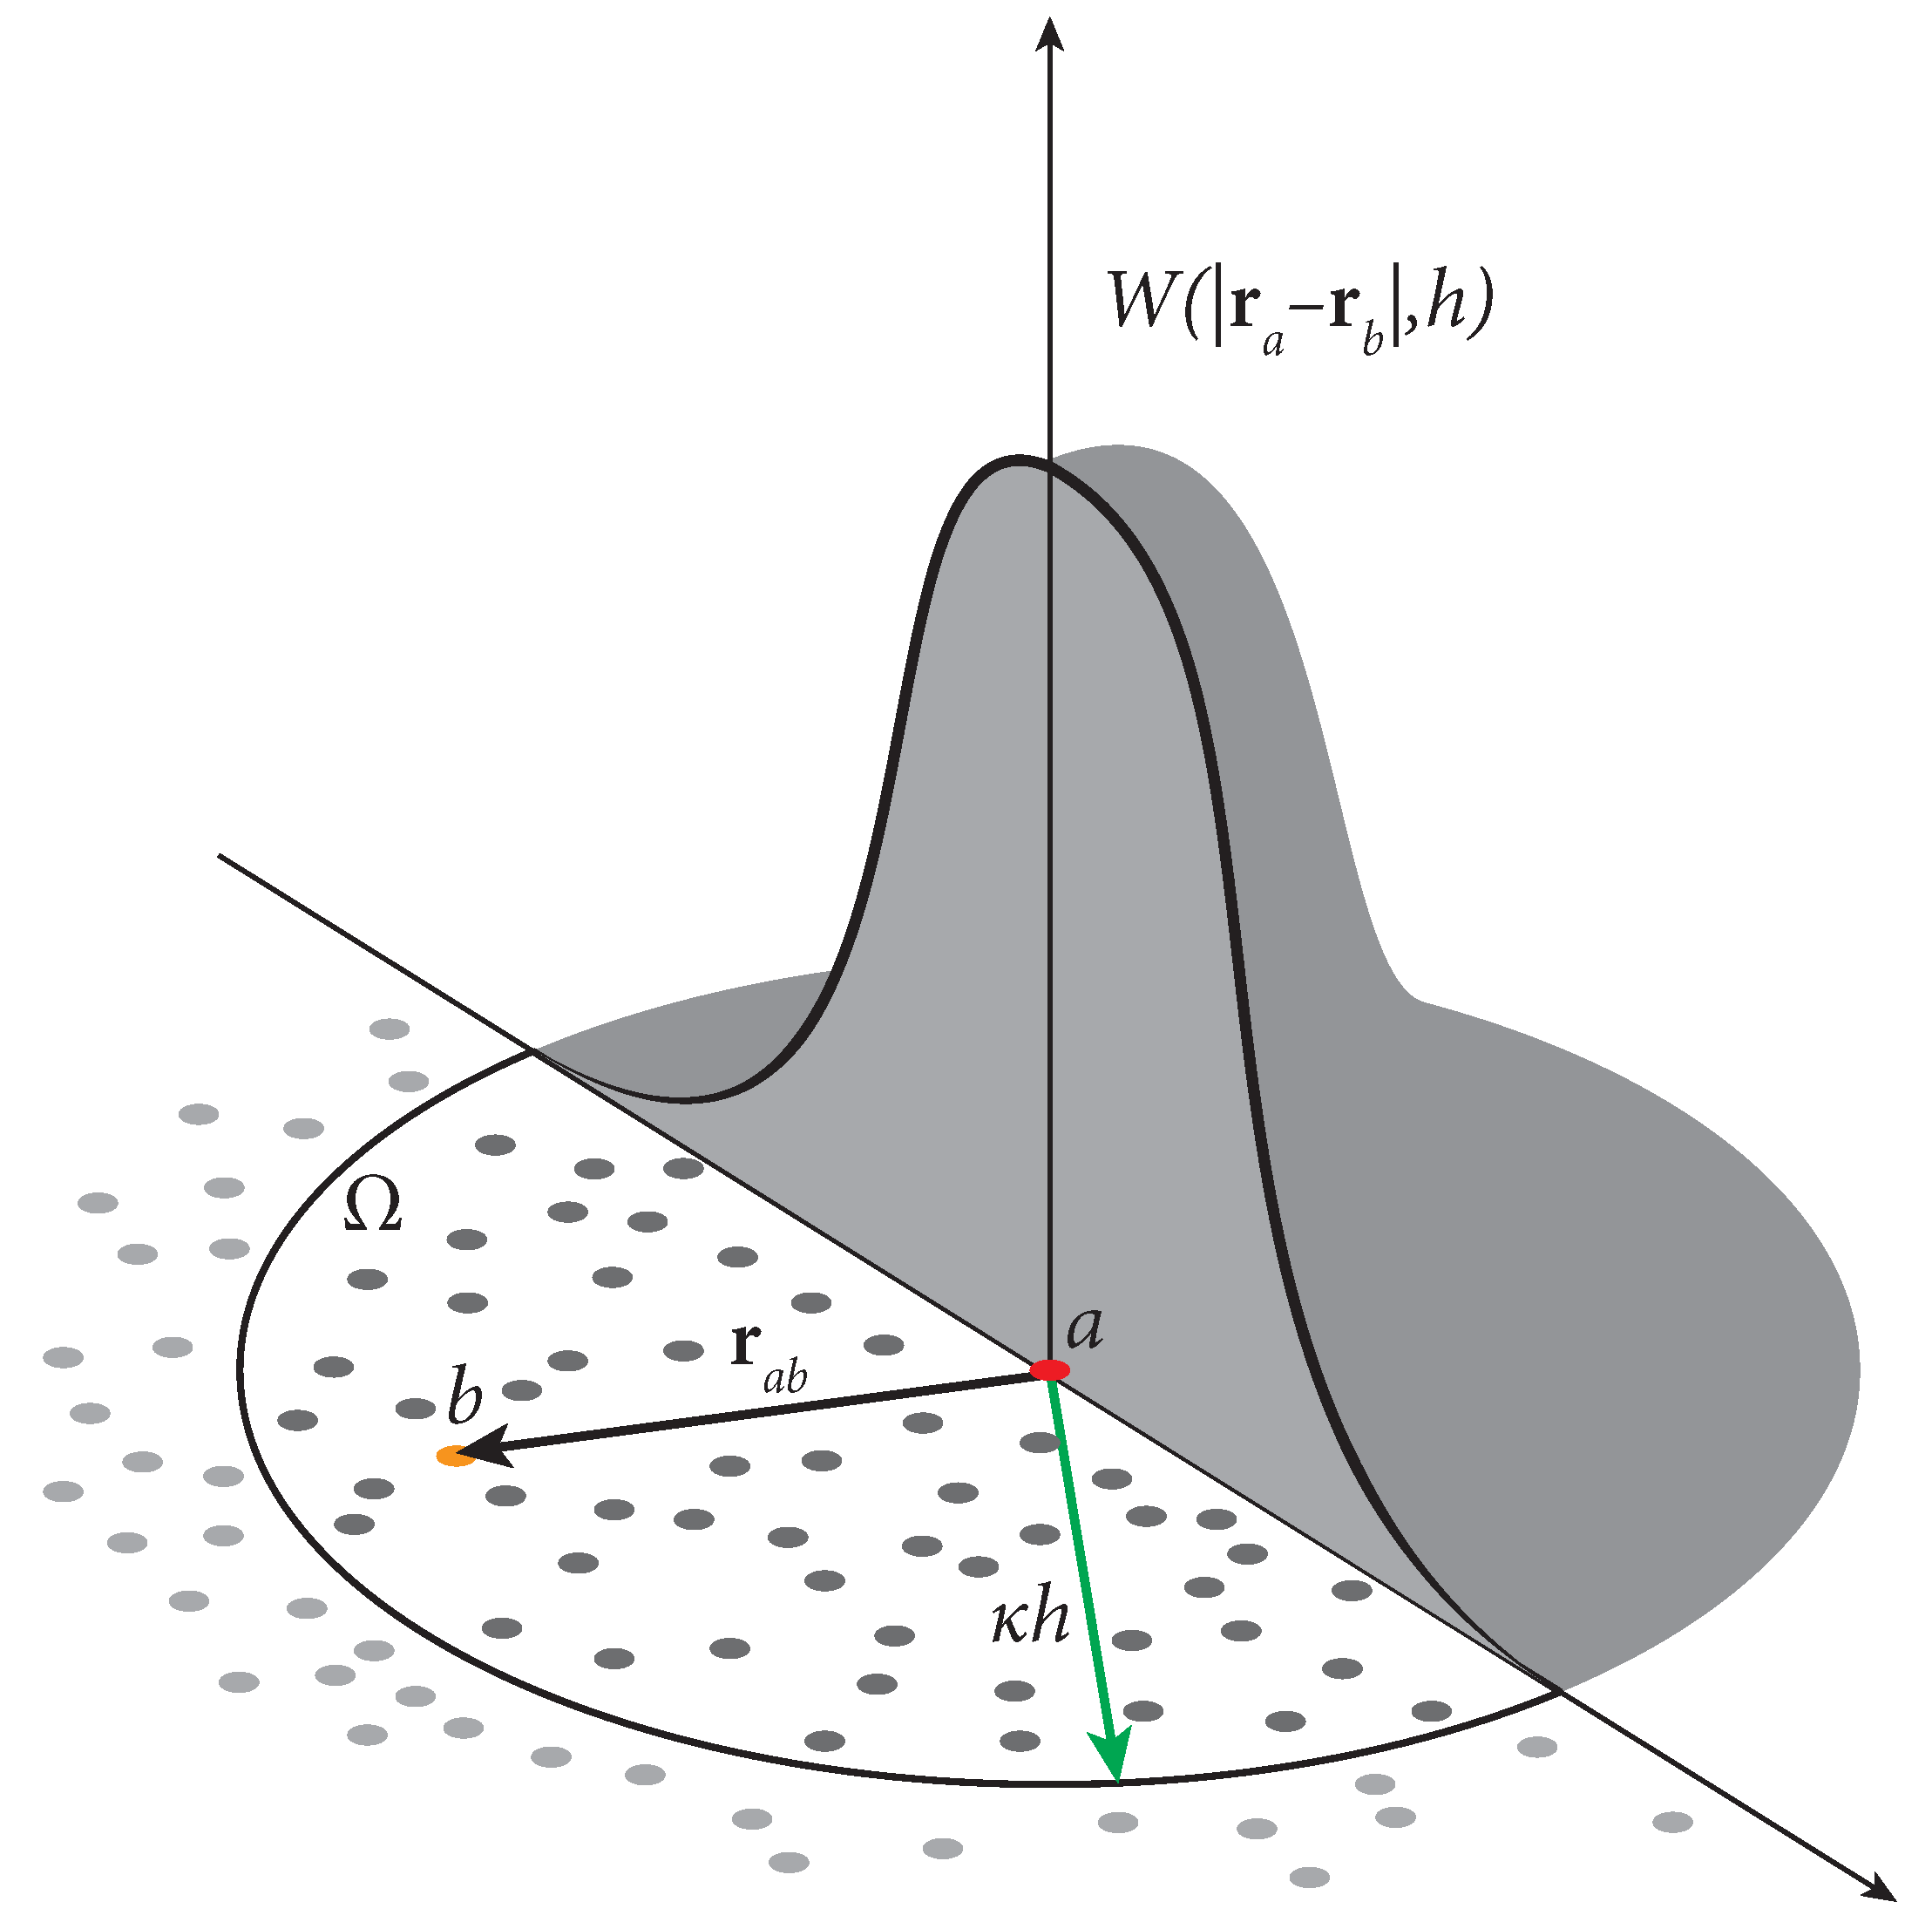
where W is the smoothing kernel function or kernel and r is the position vector. In the smoothing function, h is the smoothing length defining the influence area of W (Figure 2).
The second step is the particle approximation. The integral representation is approximated by summing the values of the nearest neighbor particles, which yields the particle approximation of the function at a discrete point (particle). The position vector r b is defined as the position of a particle having a fixed mass m b and a finite volume V b , related by:
V b = m b ρ b
where ρ b is the density of particle b = 1 , , N p , in which N p is the number of particles within the support domain of the particle a. The integral representation can be written in a discrete form for a particle a, being b part of its support domain:
< f ( r a ) > = b = 1 N p m b ρ b f ( r b ) W a b
where
W a b = W ( r a r b , h )
The kernel function, hence, plays a fundamental role in the SPH method. In DualSPHysics, the Wendland [45] quintic kernel function can be utilized:
W ( r , h ) = α D , n 1 q 2 4 ( 1 + 2 q ) 0 q 2 0 2 < q
where
q = r h = | r r | h
and α D , n is a constant depending on the dimension of the problem.

3.2. Governing Equations

The governing equations for a fluid domain in the Lagrangian formulation and the relative SPH discretization are presented. The fluid dynamics equations are based on the fundamental physical laws of conservation:
  • conservation of mass;
  • conservation of momentum.
These laws yield, respectively, to the continuity equation
D ρ D t = ρ · u
and the momentum equation
D u D t = 1 ρ p + g + Γ
where ρ is the density, u is the velocity vector, g is the gravitational acceleration vector, p is the pressure, and Γ is the deviatoric stress tensor. The governing equations in the Weakly Compressible SPH (WCSPH) formulation implemented in DualSPHysics become:
D ρ a D t = ρ a b = 1 N p m b ρ b u a b · a W a b
D u a D t = b = 1 N p m b p b + p a ρ a ρ b + Π a b · a W a b + g
The state equation [46]:
p = c 0 2 ρ 0 γ ρ ρ 0 γ 1
where γ = 7 , ρ 0 = 1000 [ kg / m 3 ] , and c 0 = c ( ρ 0 ) , along with Equations (9) and (10), completes the set of governing equations for the fluid domain implemented in DualSPHysics [25].
The artificial viscosity term, Π a b , is added in the momentum equation based on the Neumann–Richtmeyer artificial viscosity, aiming at stabilizing the SPH scheme [47]. A density diffusion term is implemented in DualSPHysics to improve the stability of the scheme by smoothing the density field [48]. This formulation is based on the density diffusion term developed with the name of δ S P H by Antuono et al. (2012) [49].

3.3. Boundary Treatment

Dynamic boundary conditions (DBC) [50] for solid surfaces are standard in DualSPHysics [51]. A stationary solid is simply represented by fixed particles with pressure evaluated from the equation of state. Boundaries are easy to set up and computations are relatively stable and efficient, providing robust numerical simulations for complex geometries. However, a small nonphysical gap between the fluid and solid boundaries can form, of the order of the smoothing length h [52], decreasing the accuracy of pressure measured on the boundary, especially when fluid particles approach dry walls.
On the other hand, an advantage of these boundary particles is their computational simplicity, since density, and therefore pressure, can be calculated inside the same loops as fluid particles with a considerable saving of computational time. DBC has been successfully applied to coastal engineering problems, discretizing complex 3D geometries without the need for implementing complex mirroring techniques or semi-analytical wall boundary conditions.
To enhance this formulation, a new boundary method has been developed: the modified dynamic boundary conditions (mDBC) [53]. In this method, the density of solid particles, arranged in the same way as in the original DBC, is obtained from ghost positions within the fluid domain by linear extrapolation. Thanks to an additional boundary interface, located half a particle spacing from the layer of the closest boundary particles to the fluid, a ghost node is mirrored, with respect to this interface, into the fluid domain (similarly to Marrone et al. [54]). In this ghost node, the fluid properties are found through a first-order consistent SPH spatial interpolation [55] over the surrounding fluid particles only.
Once the density and its gradient are computed at the ghost nodes, the density of the boundary particle ρ b is obtained by means of a linear extrapolation with the found values: in this way, the boundary density is presented as part of a fluid continuum and pressure from the equation of state gives smoother and more physical pressure fields, avoiding the non-physical gap between the boundary and the fluid observed when using the DBC.

4. Numerical Set-Up

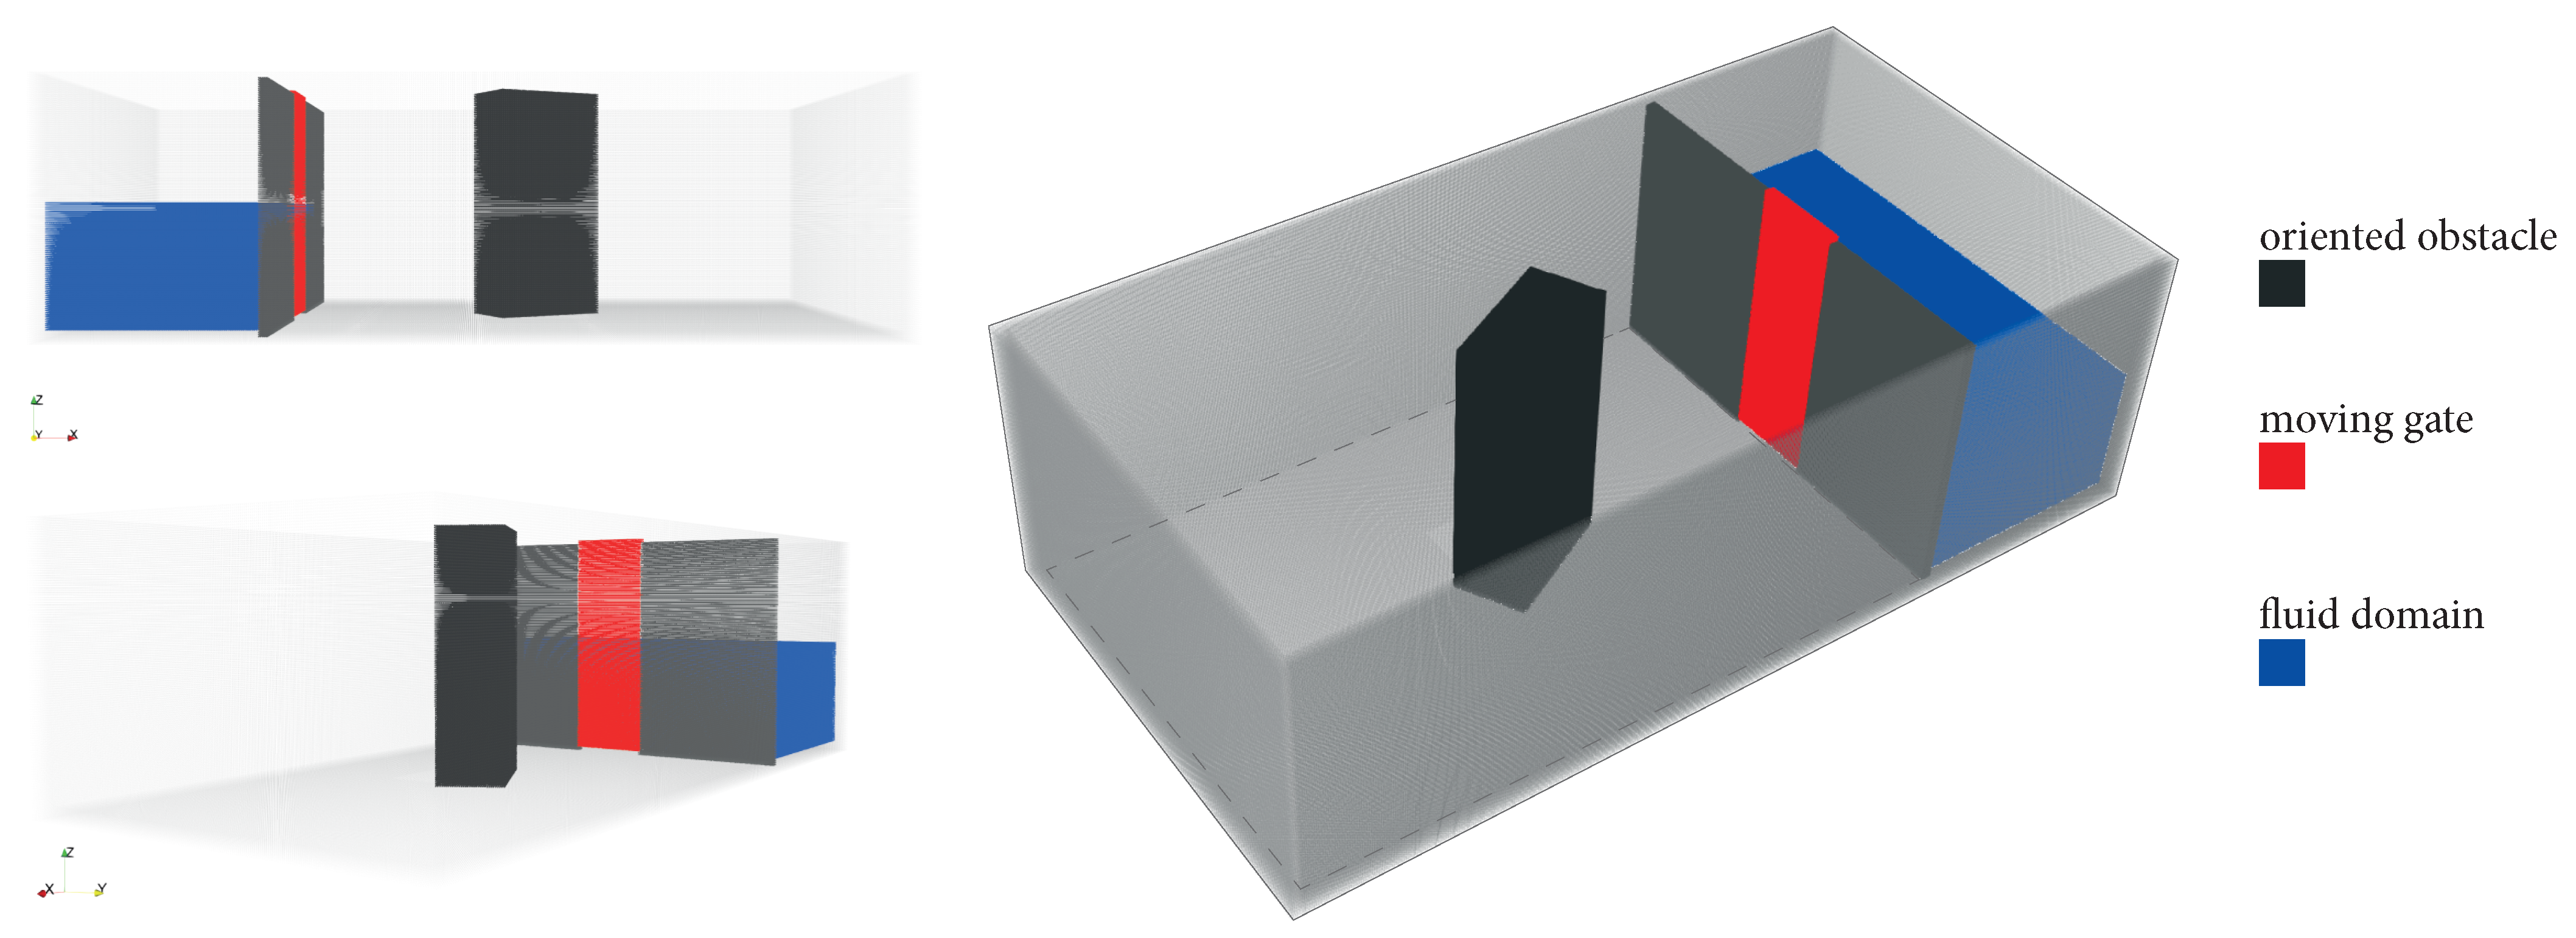
In the following paragraphs, the SPH numerical results regarding the water levels at five points, as reported in Figure 1b, are paired with data from ultrasonic sensors and with numerical results [3]. The numerical set-up of DualSPHysics (Figure 3) reproduces the experimental geometry described in Section 2. To reproduce the gate motion, the upward acceleration value of g is assigned in the solver.

4.1. Reference Parameters

In order to validate the model built in the DualSPHysics framework, simulations were performed with respect to several parameters: resolution, support domain dimension, and BCs. Let us define the first two quantities:
  • Resolution: It is the initial interparticle distance, or d p , defined as number of particle n p per separation wall thickness s
    d p = s n p where n p = { 2 ; 3 ; 4 } and s = 1 cm
  • Domain multiplicative coefficient: It is the multiplier κ of the smoothing length h, which defines the interaction domain for each particle; the smoothing length depends on d p and κ according to
    h = κ 3 ( d p ) 2 where κ = { 1 ; 1.2 }
Lastly, the BCs, which corresponds to one of the two treatments introduced in Section 3.3, are used in two ways:
  • The mDBC are applied on every surface in the domain (indicated in the charts with ‘mDBC’).
  • The tank walls (wet surfaces at t = 0 ) are treated with DBC, while the dry walls with mDBC, as visible in Figure 4 (indicated in the charts with ‘DBC’).
It is necessary to clarify that, to use the mDBC, at least three layers of particles, in the normal direction with respect to the fluid, are requested. The resolution of the simulation, hence, represents the discriminant factor for the choice of the BC treatment, because of the number of particles present in the separation wall, the thinnest element within the solid domain.

4.2. Data Analysis

The postprocessing calculation and data analysis are here exposed. To better understand the results, the numerical computation of elevations in DualSPHysics, provided by the postprocessing tool ‘MeasureTool’, is reported. For a given position ( x , y ) , the mass at several points a, regularly interspersed on the vertical axis z, is computed with:
m a = b = 1 N p m b W a b
where m b stands for the mass of the particles included in the support domain.
For elevations for which the support domain is completely immersed in the fluid, Equation (14) gives a unitary result, as a percentage of the assigned fluid mass m = m a x ( m a ) a fluid (reference quantity), while the latter becomes null when the support domain, for certain z values, is not filled with any fluid particle. The free surface of the fluid is calculated when m a assumes half the value of reference quantity m:
m a = 0.5 m
It follows that some divergences might occur and oscillations in the water level measurements, being the SPH particles prone to a certain dispersion, especially in phenomena that involve high velocities and impacts with solid structures, such as the one here investigated. The influence area of the kernel, together with the initial particle spacing, affects the output value of elevations provided by the software.
The performance of the SPH-based model is investigated analyzing the differences in the water elevation time histories. The local error is computed, for a visual purpose, as:
e = z t D S P H z t E X P
where z t D S P H and z t E X P are, respectively, the numerical and experimental water elevations at the t-th time interval.
To evaluate the accuracy of each combination, and to weight each parameter contribution, the index of agreement  W * and the linear correlation coefficient R * [56] are reported for every comparison. These quantities are evaluated following the equations:
W * 1 t = 1 N Δ t ( | z t D S P H z t E X P | ) t = 1 N Δ t ( | z t D S P H z ¯ t E X P | + | z t E X P z ¯ t E X P | )
R * 1 N t = 1 N Δ t ( | z t D S P H z t E X P | ) ( z t E X P z ¯ t E X P ) σ D S P H σ E X P
N Δ t being the total number of steps. The overvalue operator is the mean operator, while σ is the standard deviation operator. In Equation (17), first introduced by Willmott et al. [57], the values are bounded in [ 0 , + 1 ] , while, in Equation (18), the range is [ 1 , + 1 ] ; in both cases, values close to the upper ceiling correspond to good agreement.

5. Results

The following charts and tables report a sensitivity analysis in order to appreciate the effectiveness of the SPH approach; the results are divided in three main comparisons to highlight the influence of the aforementioned parameters on various numerical aspects. Each water level chart is matched with the graphic of the local error, to give an immediate visual perception of the distance between the simulations and the experimental references.

5.1. Tank Emptying Analysis

The first analysis focuses on the tank emptying following the gate motion, described by the water level at P1 and P2. These points, being aligned with the axis of symmetry of the domain, describe the basic dam-break fluid dynamics, and thus the comparison evaluates the influence of the dimension of the kernel support domain (namely, the κ coefficient). In this case, the mDBC conditions are applied to every surface of the closed tank, and the resolution is:
d p = s 3
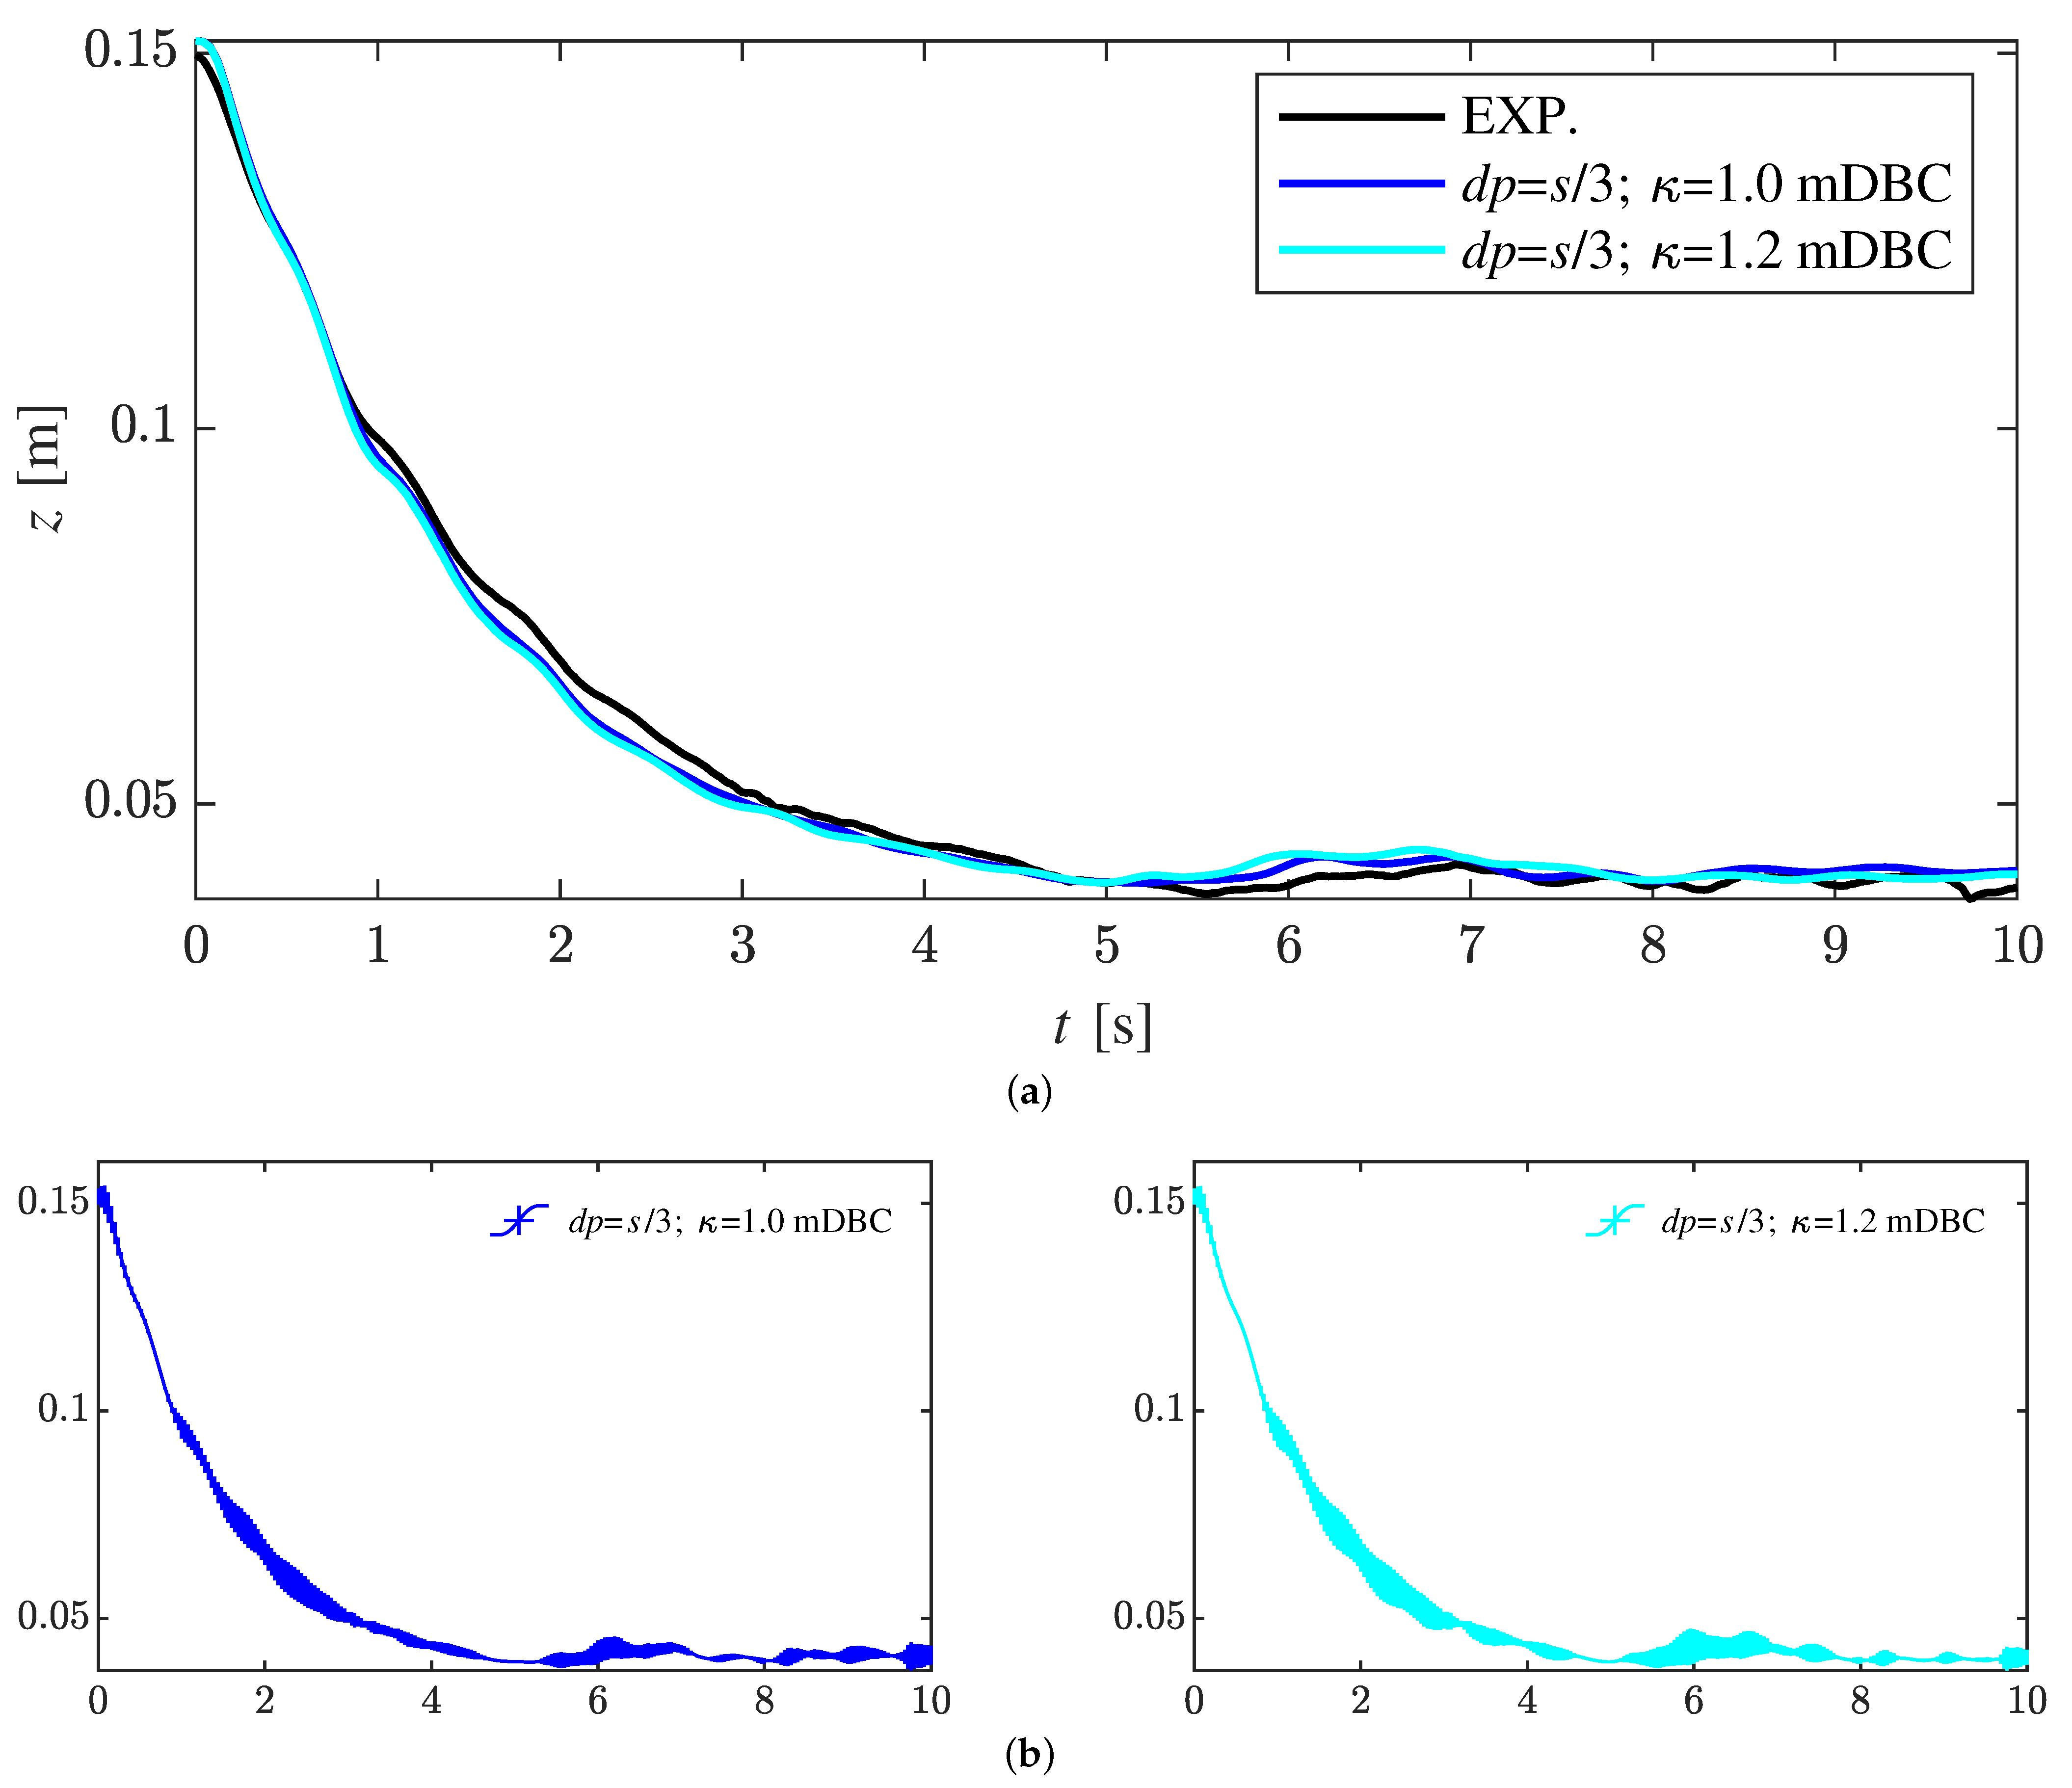
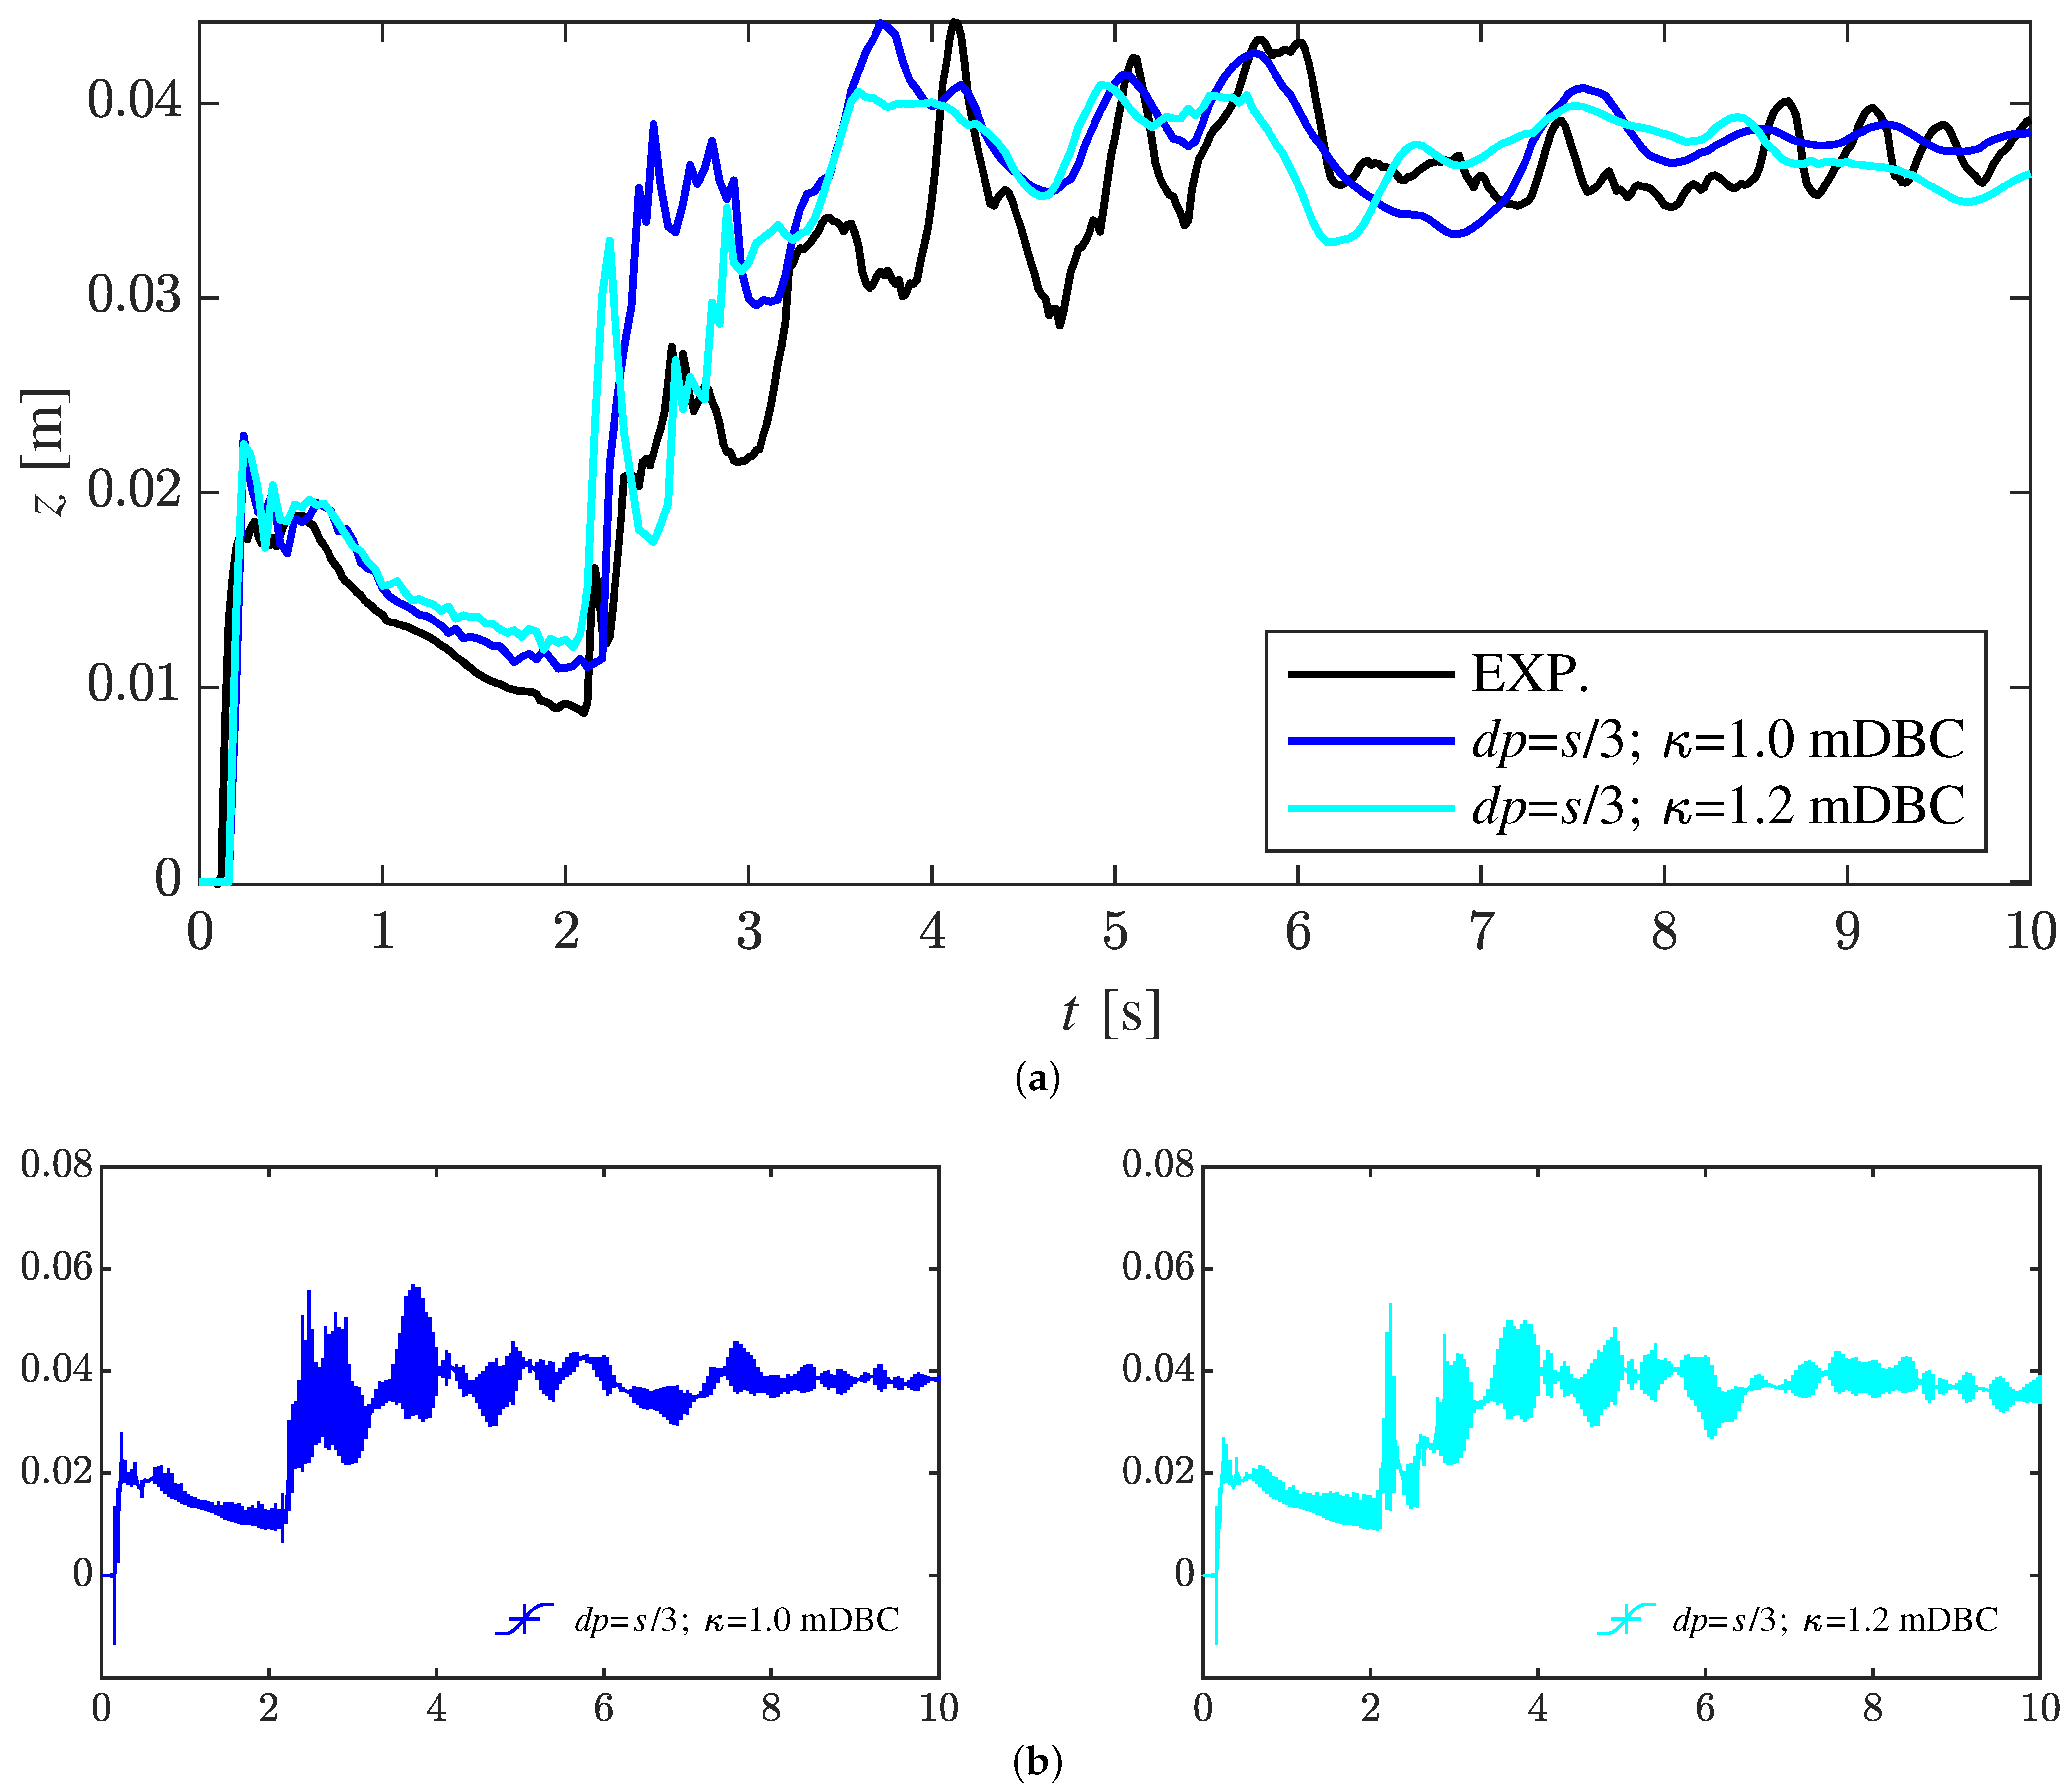
The DualSPHysics simulations perfectly reproduce the tank emptying, as visible in Figure 5 and Figure 6. In the latter figure, the change in the agreement is evident when the fluid dynamics switches from simple outflow to complex undulations and hydraulic jumps, caused by the wave reflected by the upstream channel-end and sidewalls; the main difference between experimental and numerical results can be observed immediately after the arrival of the reflected wave, approximately after 3 s (Figure 6).
This difference is partly due to the mono-phase simulation performed, while the experimental data are clearly referred to a multi-phase flow motion. The dimension of the support domain ( κ ) does not influence significantly the emptying of the tank (Figure 5), while a higher value of κ seems to improve the reproduction of the impact with the reflected wave; however, the overall agreement is better with the unitary value of the multiplying coefficient, as highlighted in Table 1.
The registrable error is very limited, and it is interesting to note the small differences in the initial water levels of the two DualSPHysics simulations (Figure 5), as proof of the parameters influence on the measurement of the free surface, also in stationary conditions.
The same fluid dynamics, with different value of resolution and with the DBC conditions applied on the wet surfaces, was evaluated, since the current d p does not allow to use the mDBC on every surface. In Figure 7, the elevation chart with d p = s / 2 at P2 is presented, since it was noted that at P1 the overall agreement of the simulation with the experimental data is always good. It is clear that a lower resolution costs a divergence between the results, which generally overestimate the elevation; however, in this case, an increment of κ worsens the effectiveness, not only when the fluid dynamics becomes more complex, but on average for all the duration of the simulation. The effect, instead, of the DBC appears to be not relevant, demonstrating what is reported in Section 3.3. To finally conclude this analysis, the influence of resolution is highlighted by the charts in Figure 8, which compares at P2 the simulations with d p = s / 3 and d p = s / 2 ; the index of agreement and the linear correlation error are reported in Table 2.

5.2. Fluid Propagation Dynamics

In the survey points P3 and P4, being placed laterally with respect to the obstacle, the fluid dynamics cannot be considered as a simple dam-break flow anymore, since the flood is diverted by the oblique surfaces. The fluid propagation is hence studied focusing on the sensitivity of the model with respect to the resolution.
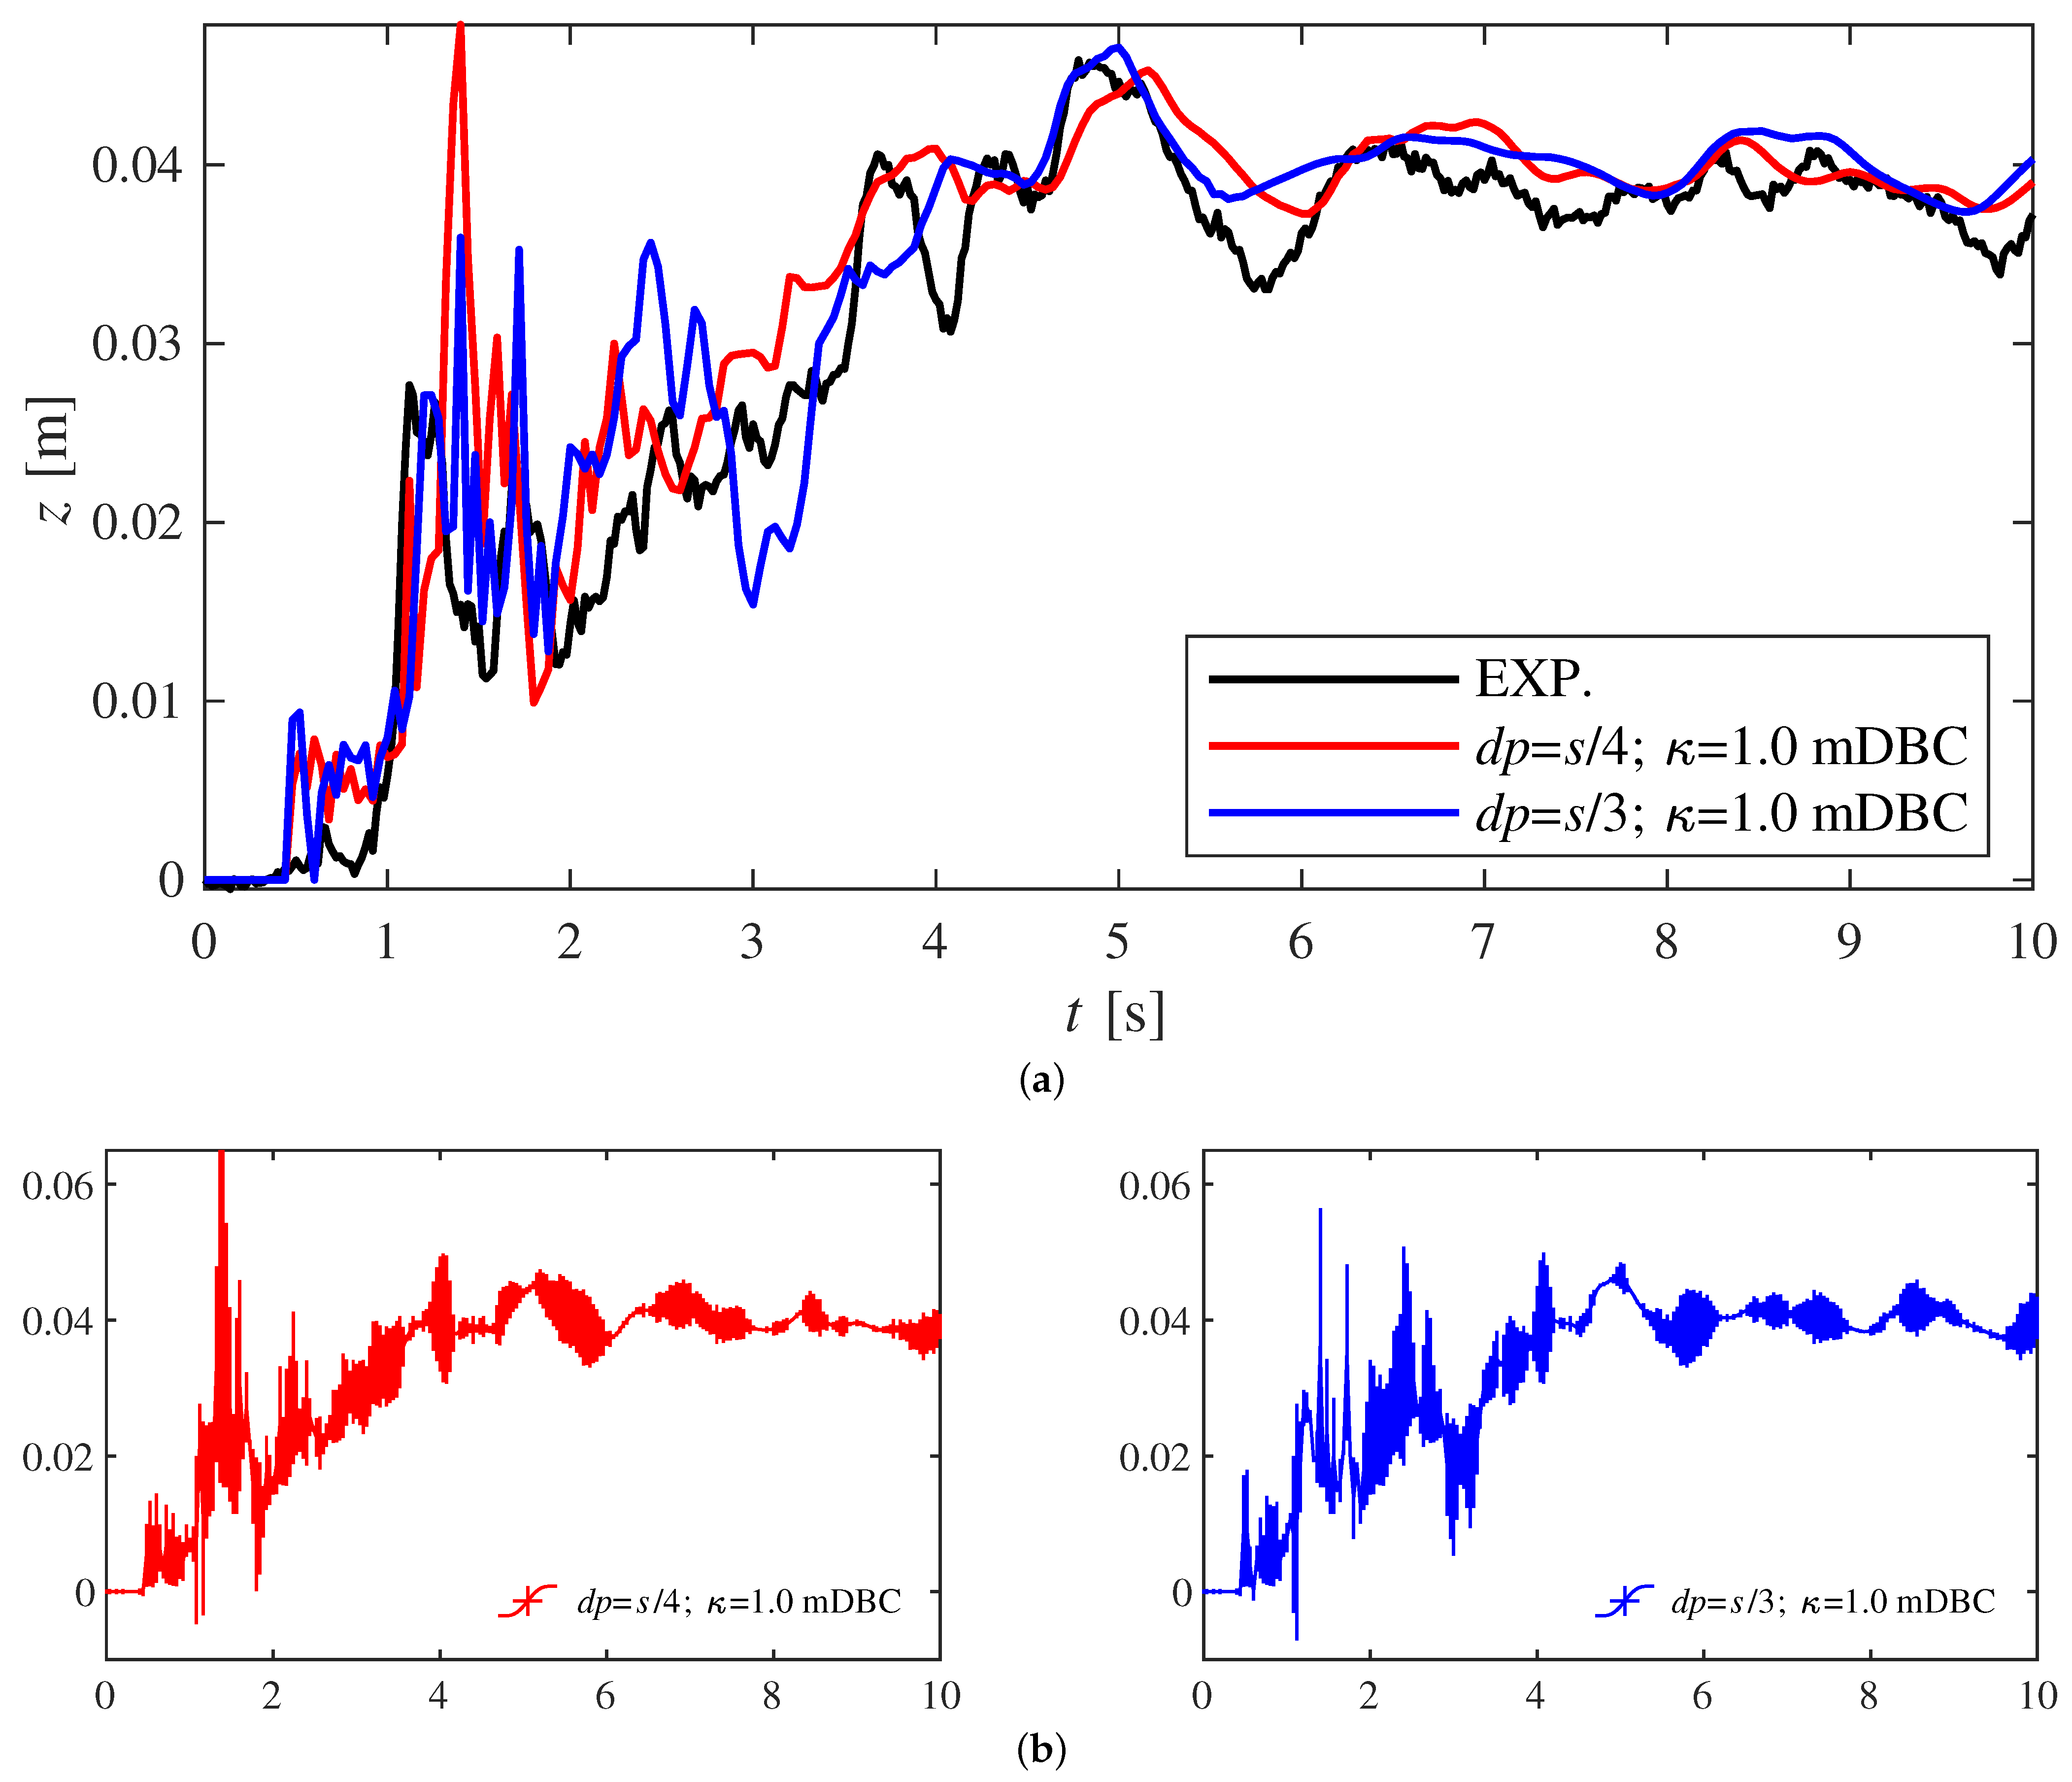
The first 1.5 s at P3 (Figure 9), in which propagation after the impact with the obstacle is observed, both resolution values, d p = s / 4 and d p = s / 3 , return a proper agreement, but, at the stage of the impact with the return wave, higher resolution enhances the performance and reduces the spread and, thus, the linear correlation error (Table 3). It is safe to say that the DualSPHysics model is robust in reproducing the phenomenon, the agreement being very similar, and proper, with different resolutions. At P4 (Figure 10), the complexity of the dynamics, involving several water jumps and lateral jumps, costs higher error and dispersion, but again the simulation can be considered representative of the phenomena. Despite some high peaks of error, the gain of fidelity with a higher resolution appears clear, with obvious costs in terms of computation time.

5.3. Impacts on the Downstream Structure

Among the themes mentioned to introduce the dam-break problem, the presence of the obstacle is surely the most interesting: the complex dynamics examined so far is just one of the aspects that such an occurrence encourages to examine in depth. The prediction of the effects on the downstream structures, in fact, could help reduce risky scenarios, deepening the knowledge of the stress conditions the structures are subjected to when involved in flood events. In the following, two different physical quantities, pressure and force, which are missing in the experimental dataset, are studied.
Figure 11 shows the time evolution of the pressure on the four lateral surfaces of the obstacle, computed at the midpoint of each one, at a height of 0.03 m (the location of these points is depicted in Figure 4); the data are computed from the case with d p = s / 4 , κ = 1.2 and mDBC. The pressure swiftly increases at points A and D, placed on the faces impacted by the first wave, which show comparable peak values, with a small shift in time for point D, farther away from the moving gate. Around t = 3.00 s, the impact or the return wave at points A and C can be noticed, as well as in Figure 8, which depicts the water surface close to point A. As the water fills the enclosed domain, the pressure values tend to the hydrostatic one, although the simulated time-span is not long enough to achieve the final stillness condition (about 15 s are needed).
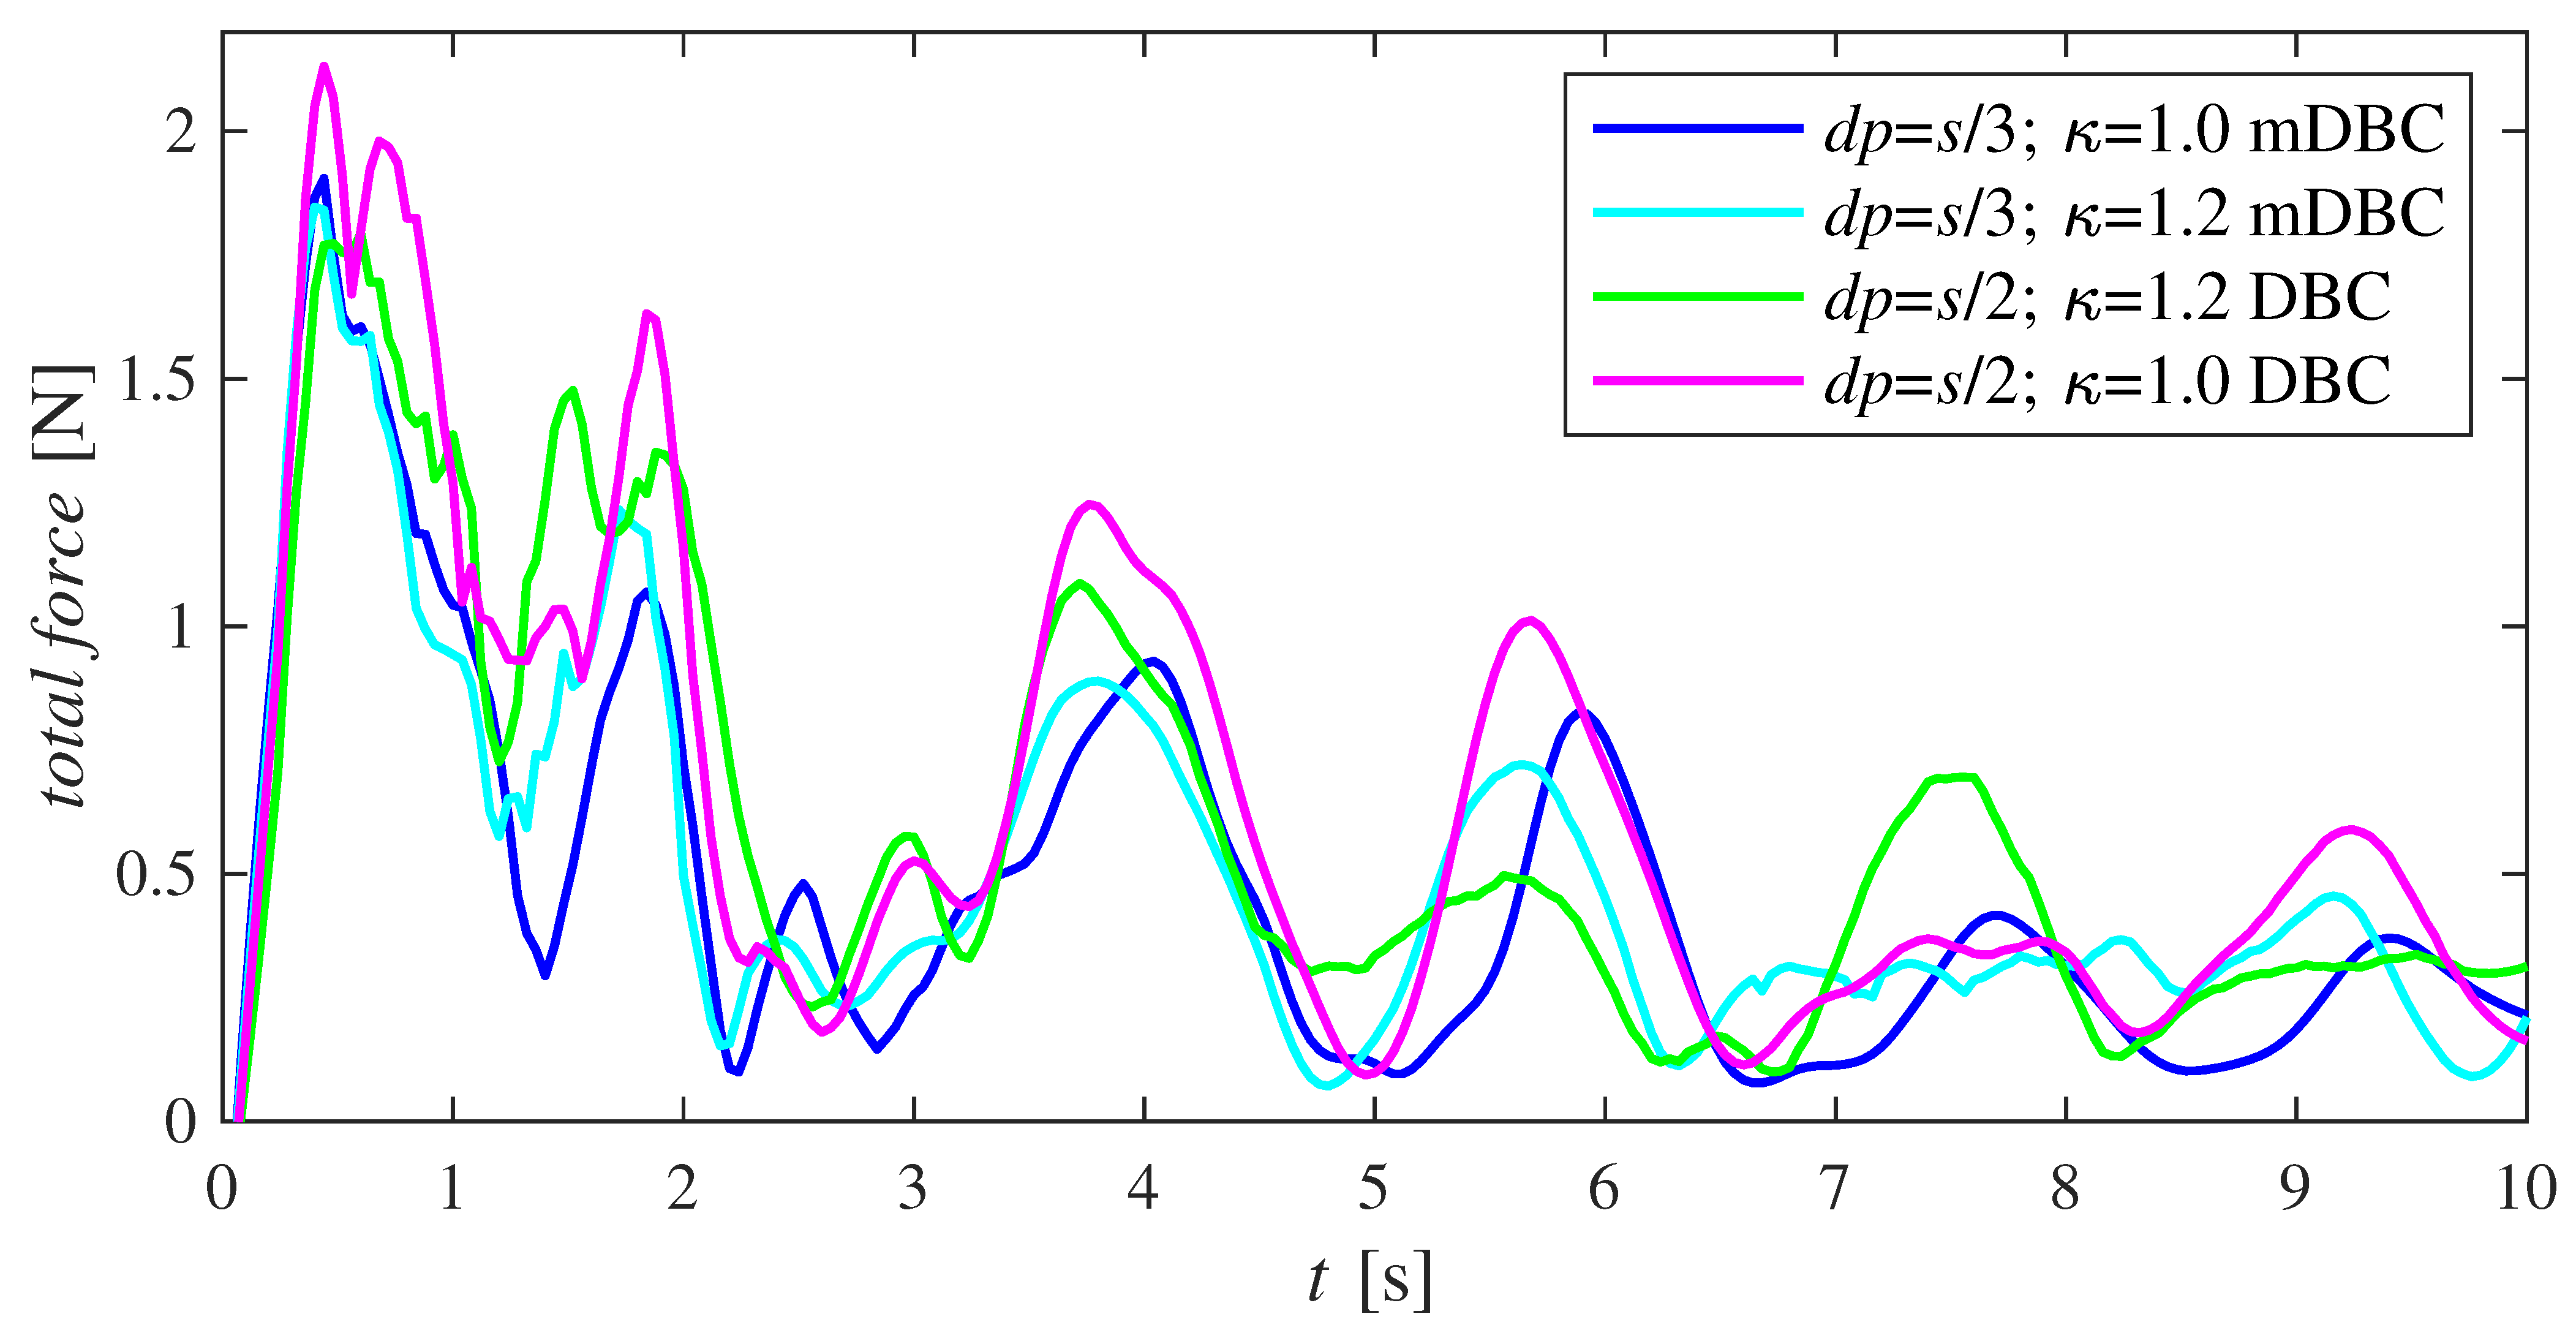
In Figure 12, a sensitivity analysis for the total force exerted by the fluid on the obstacle is presented. Four different configurations are displayed, with two different values for each reference parameter: resolution, support domain dimension, and BCs. The force evolution displays small variation moving among the four series and the main impact events are apparent; it is not immediate to locate the return waves since the force is computed on the whole structure, and each face is interacting with different fluid masses characterized by different velocities. The simulations with higher resolutions present less divergence in the values, as predictable. The peak values are very similar among the different simulations.

5.4. Overall Analysis

The last chart (Figure 13) gives a general overlook on the DualSPHysics model, comparing simulations with the highest resolution and different values of the support domain dimension. At P5, positioned on the axis of symmetry of the tank but behind the obstacle, the dynamics can be considered a hybrid between the two aforementioned ones. The peculiarity of this situation is evidenced in Figure 13, which includes the numerical reference solution from Kocaman et al. [3]. The agreement between the SPH model and this additional reference is meaningful at P5 because of the complexity of the fluid dynamics; it follows that the numerical models give comparable outcome when this phenomenon is reproduced. In fact, the simulation with d p = s / 4 and κ = 1 , proved to be efficient in tank emptying and pure propagation (Figure 9), appears here, in the second half of the simulation, evidently to underestimate the water level. The same resolution, but with a larger support domain, reproduces very well the mean elevation when the fluid movement tends to quieten. The κ value appears to be fundamental when the flow motion gains significant 3D characteristics, even more than the resolution. With such complex dynamics, high resolution and large support domains are required, because the influence of any parameter cannot be neglected.
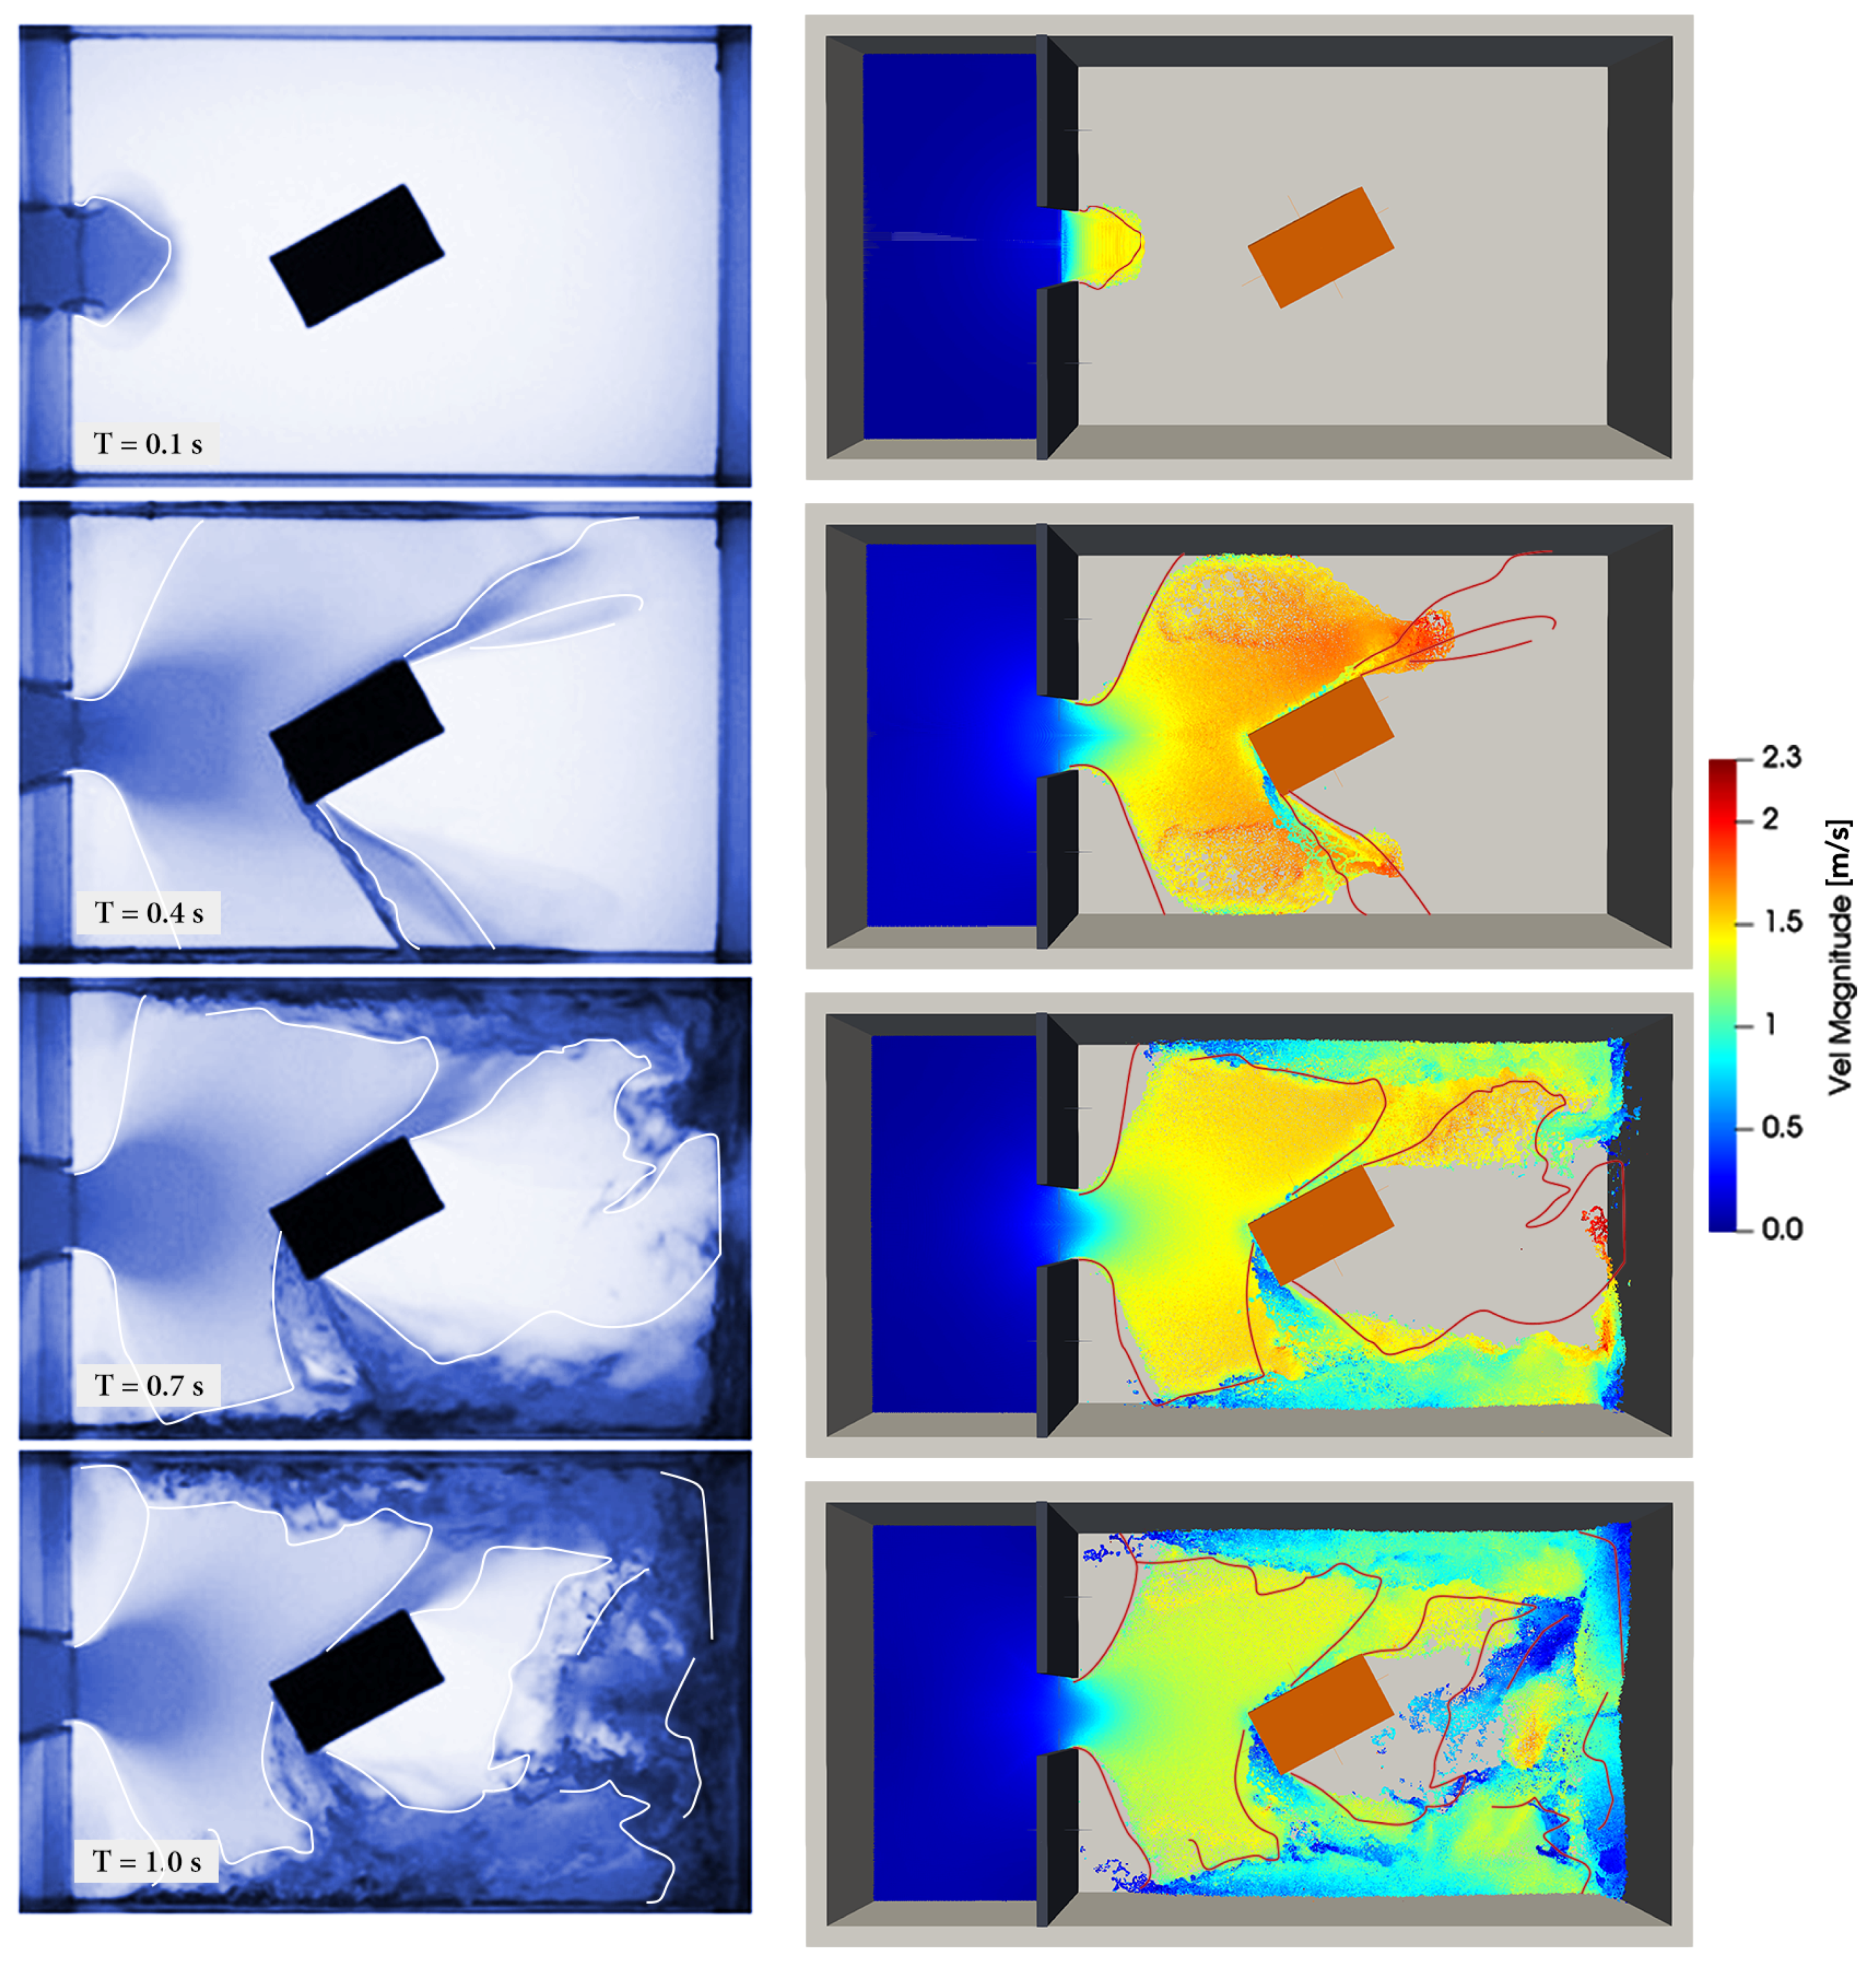
In Figure 14, a comparison between experimental and numerical simulation at several initial time steps is presented, showing good agreement in the standard dam-break tank emptying and in the propagation after the wave hits the obstacle. The diverted fluid, then impacting the lateral and bottom walls of the enclosed domain, suddenly changes its characteristics, resulting in an series of water jumps; despite being a single-phase simulation, and so not taking into account the air bubbles included after the wave reflection, the numerical model appears to well reproduce the fluid dynamics exhibited by the laboratory experiments. In Table 4, a general overview of the simulations carried out is presented, with the final mean values for index of agreement and linear correlation error.

6. Conclusions

The results show that the numerical investigation carried out in the DualSPHysics framework can be considered efficient overall, describing properly the various physical situations that occur:
  • The tank emptying is very well reproduced with all the attempted values for the parameters (Figure 5).
  • The FSI is well computed, and the mDBC has demonstrated its suitability for violent impacts of fluid masses with solid dry objects.
  • The agreement in the propagation dynamics is remarkable and increases with the resolution (Figure 9 and Figure 10).
  • The non-negligible multi-phase dynamics observable at P5 is represented with good agreement, especially considering the increasing importance of the air cavities when the dynamics complexity raises, and mainly depends on the resolution and the kernel support domain size κ (Figure 13).
  • The samples presented in Figure 11 and Figure 12 constitute a valid starting point for further FSI investigation.
The results in Table 4 show that the simulations with the highest values of resolution perform well, but, as exposed, each parameter taken into account influences a particular aspect of the fluid behavior, as shown by the differences in agreement, with the same parameters, at each measurement point. To not increase the computational cost, a balance has to be found in dependence of which aspect is more relevant with respect to the aim of the study. In conclusion, the results indicate that DualSPHysics can be a useful engine to simulate 3D dam-break phenomena, which also involve specific conditions for FSI during flow impacts, and this research provides vital information to initialize a global setup. This tool can be used for modeling fluid-driven debris impacting fixed or moving obstacles, and it clearly overcomes the limitations of mesh-based numerical solvers.
Future analyses will include a deep study of the obstacle behavior and the fluid- and debris-induced forces at the time of impact, along with a study about the influence of the position on possible damages to civil structures. The effectiveness of the present framework can be proven with respect to a wider range of terms of comparison, as shown in an introductory way in Section 5.3, using further experimental and numerical references.

Author Contributions

Conceptualization, S.C., G.V., and B.T.; methodology, S.C., B.T., G.V., S.E., and S.K.; software, S.C., and B.T.; validation, S.C., G.V., and B.T.; formal analysis, S.C.; investigation, S.C., and B.T.; resources, G.V.; writing—original draft preparation, S.C.; writing—review and editing, B.T., S.E., S.K., H.G., A.Y., and K.D.; visualization, S.C.; supervision, G.V., S.E., and S.K. All authors have read and agreed to the published version of the manuscript.

Funding

This research received no external funding.

Institutional Review Board Statement

Not applicable.

Informed Consent Statement

Not applicable.

Data Availability Statement

Not applicable.

Conflicts of Interest

The authors declare no conflict of interest.

Abbreviations

The following abbreviations are used in this manuscript:
2DTwo-Dimensional
3DThree-Dimensional
SWEsShallow Water Equations
FSIFluid–Solid Interaction
SPHSmoothed Particle Hydrodynamics
MPMsMeshfree Particle Methods
BCBoundary Conditions
DBCDynamic Boundary Conditions
mDBCmodified Dynamic Boundary Conditions
CFDComputational Fluid Dynamics

References

  1. Norin, S.; Belikov, V.V.; Aleksyuk, A. Simulating flood waves in residential areas. Power Technol. Eng. 2017, 51, 52–57. [Google Scholar] [CrossRef]
  2. Evangelista, S.; Altinakar, M.S.; Di Cristo, C.; Leopardi, A. Simulation of dam-break waves on movable beds using a multi-stage centered scheme. Int. J. Sediment Res. 2013, 28, 269–284. [Google Scholar] [CrossRef]
  3. Kocaman, S.; Evangelista, S.; Viccione, G.; Güzel, H. Experimental and Numerical Analysis of 3D Dam-Break Waves in an Enclosed Domain with a Single Oriented Obstacle. Environ. Sci. Proc. 2020, 2, 35. [Google Scholar] [CrossRef]
  4. Evangelista, S. Experiments and Numerical Simulations of Dike Erosion due to a Wave Impact. Water 2015, 7, 5831–5848. [Google Scholar] [CrossRef] [Green Version]
  5. Pugliese Carratelli, E.; Viccione, G.; Bovolin, V. Free surface flow impact on a vertical wall: A numerical assessment. Theor. Comput. Fluid Dyn. 2016, 30. [Google Scholar] [CrossRef]
  6. Hattori, M.; Arami, A.; Yui, T. Wave impact pressure on vertical walls under breaking waves of various types. Coast. Eng. 1994, 22, 79–114. [Google Scholar] [CrossRef]
  7. Peregrine, D.H. Water-Wave Impact On Walls. Annu. Rev. Fluid Mech. 2003, 35, 23–43. [Google Scholar] [CrossRef]
  8. Di Cristo, C.; Evangelista, S.; Greco, M.; Iervolino, M.; Leopardi, A.; Vacca, A. Dam-break waves over an erodible embankment: Experiments and simulations. J. Hydraul. Res. 2018, 56, 196–210. [Google Scholar] [CrossRef]
  9. Viccione, G.; Ferlisi, S.; Marra, E. A numerical investigation of the interaction between debris flows and defense barriers. In Proceedings of the 8th International Conference on Environmental and Geological Science and Engineering (EG’15), Salerno, Italy, 27–29 June 2015; pp. 332–342. [Google Scholar]
  10. Kocaman, S.; Güzel, H.; Evangelista, S.; Ozmen-Cagatay, H.; Viccione, G. Experimental and Numerical Analysis of a Dam-Break Flow through Different Contraction Geometries of the Channel. Water 2020, 12, 1124. [Google Scholar] [CrossRef] [Green Version]
  11. Shigeeda, M.; Akiyama, J.; Ura, M.; Arita, Y. 2-D Numerical model based ON unstructured finite volume method for flood flows. Proc. Hydraul. Eng. 2001, 45, 895–900. [Google Scholar] [CrossRef]
  12. Aureli, F.; Maranzoni, A.; Mignosa, P.; Ziveri, C. A weighted surface-depth gradient method for the numerical integration of the 2D shallow water equations with topography. Adv. Water Resour. 2008, 31, 962–974. [Google Scholar] [CrossRef]
  13. Kocaman, S.; Evangelista, S.; Guzel, H.; Dal, K.; Yilmaz, A.; Viccione, G. Experimental and Numerical Investigation of 3D Dam-Break Wave Propagation in an Enclosed Domain with Dry and Wet Bottom. Appl. Sci. 2021, 11, 5638. [Google Scholar] [CrossRef]
  14. Soares-Fraz ao, S.; Zech, Y. Dam-break flow through an idealised city. J. Hydraul. Res. 2008, 46, 648–658. [Google Scholar] [CrossRef] [Green Version]
  15. Abderrezzak, K.E.K.; Paquier, A.; Mignot, E. Modelling flash flood propagation in urban areas using a two-dimensional numerical model. Nat. Hazards 2008, 50, 433–460. [Google Scholar] [CrossRef]
  16. Aureli, F.; Dazzi, S.; Maranzoni, A.; Mignosa, P.; Vacondio, R. Experimental and numerical evaluation of the force due to the impact of a dam-break wave on a structure. Adv. Water Resour. 2015, 76, 29–42. [Google Scholar] [CrossRef]
  17. Violeau, D.; Rogers, B. Smoothed particle hydrodynamics (SPH) for free-surface flows: Past, present and future. J. Hydraul. Res. 2016, 54, 1–26. [Google Scholar] [CrossRef]
  18. Amicarelli, A.; Manenti, S.; Albano, R.; Agate, G.; Paggi, M.; Longoni, L.; Mirauda, D.; Ziane, L.; Viccione, G.; Todeschini, S.; et al. SPHERA v.9.0.0: A Computational Fluid Dynamics research code, based on the Smoothed Particle Hydrodynamics mesh-less method. Comput. Phys. Commun. 2020, 250, 107157. [Google Scholar] [CrossRef]
  19. Kocaman, S.; Dal, K. A New Experimental Study and SPH Comparison for the Sequential Dam-Break Problem. J. Mar. Sci. Eng. 2020, 8, 905. [Google Scholar] [CrossRef]
  20. Amicarelli, A.; Albano, R.; Mirauda, D.; Agate, G.; Sole, A.; Guandalini, R. A Smoothed Particle Hydrodynamics model for 3D solid body transport in free surface flows. Comput. Fluids 2015, 116, 205–228. [Google Scholar] [CrossRef]
  21. Ansari, A.; Khavasi, E.; Ghazanfarian, J. Experimental and SPH studies of reciprocal wet-bed dam-break flow over obstacles. Int. J. Mod. Phys. C 2021, 2150098. [Google Scholar] [CrossRef]
  22. Crespo, A.J.; Gómez-Gesteira, M.; Dalrymple, R.A. Modeling Dam Break Behavior over a Wet Bed by a SPH Technique. J. Waterw. Port Coast. Ocean Eng. 2008, 134, 313–320. [Google Scholar] [CrossRef]
  23. Viccione, G.; Bovolin, V.; Carratelli, E.P. Simulating fluid-structure interaction with SPH. AIP Conf. 2012. [Google Scholar] [CrossRef]
  24. Viccione, G.; Bovolin, V. Simulating triggering and evolution of debris-flows with Smoothed Particle Hydrodynamics (SPH). In Proceedings of the 5th International Conference on Debris-Flow Hazards Mitigation: Mechanics, Prediction and Assessment, Padua, Italy, 14–17 June 2011. [Google Scholar] [CrossRef]
  25. Domínguez, J.; Fourtakas, G.; Altomare, C.; Canelas, R.; Tafuni, A.; García Feal, O.; Martínez-Estévez, I.; Mokos, A.; Vacondio, R.; Crespo, A.; et al. DualSPHysics: From fluid dynamics to multiphysics problems. Comput. Part. Mech. 2021. [Google Scholar] [CrossRef]
  26. Vacondio, R.; Rogers, B.; Stansby, P.; Mignosa, P.; Feldman, J. Variable resolution for SPH: A dynamic particle coalescing and splitting scheme. Comput. Methods Appl. Mech. Eng. 2013, 256, 132–148. [Google Scholar] [CrossRef]
  27. Barreiro, A.; Crespo, A.; Domínguez, J.; Gómez-Gesteira, M. Smoothed Particle Hydrodynamics for coastal engineering problems. Comput. Struct. 2013, 120, 96–106. [Google Scholar] [CrossRef]
  28. Altomare, C.; Domínguez, J.; Crespo, A.; González-Cao, J.; Suzuki, T.; Gómez-Gesteira, M.; Troch, P. Long-crested wave generation and absorption for SPH-based DualSPHysics model. Coast. Eng. 2017, 127, 37–54. [Google Scholar] [CrossRef]
  29. Mogan, S.C.; Chen, D.; Hartwig, J.; Sahin, I.; Tafuni, A. Hydrodynamic analysis and optimization of the Titan submarine via the SPH and Finite-Volume methods. Comput. Fluids 2018, 174, 271–282. [Google Scholar] [CrossRef]
  30. Domínguez, J.; Crespo, A.; Hall, M.; Altomare, C.; Wu, M.; Stratigaki, V.; Troch, P.; Cappietti, L.; Gómez-Gesteira, M. SPH simulation of floating structures with moorings. Coast. Eng. 2019, 153, 103560. [Google Scholar] [CrossRef]
  31. Kisacik, D.; Stratigaki, V.; Wu, M.; Cappietti, L.; Simonetti, I.; Troch, P.; Crespo, A.; Altomare, C.; Domínguez, J.; Hall, M.; et al. Efficiency and Survivability of a Floating Oscillating Water Column Wave Energy Converter Moored to the Seabed: An Overview of the EsflOWC MaRINET2 Database. Water 2020, 12, 992. [Google Scholar] [CrossRef] [Green Version]
  32. Tagliafierro, B.; Montuori, R.; Vayas, I.; Ropero-Giralda, P.; Crespo, A.; Domìnguez, J.; Altomare, C.; Viccione, G.; Gòmez-Gesteira, M. A new open source solver for modelling fluid-structure interaction: Case study of a point-absorber wave energy converter with a power take-off unit. In Proceedings of the 11th International Conference on Structural Dynamics, Athens, Greece, 23–26 November 2020. [Google Scholar] [CrossRef]
  33. Ropero-Giralda, P.; Crespo, A.J.; Tagliafierro, B.; Altomare, C.; Domínguez, J.M.; Gómez-Gesteira, M.; Viccione, G. Efficiency and survivability analysis of a point-absorber wave energy converter using DualSPHysics. Renew. Energy 2020, 162, 1763–1776. [Google Scholar] [CrossRef]
  34. Ropero-Giralda, P.; Crespo, A.J.C.; Coe, R.G.; Tagliafierro, B.; Domínguez, J.M.; Bacelli, G.; Gómez-Gesteira, M. Modelling a Heaving Point-Absorber with a Closed-Loop Control System Using the DualSPHysics Code. Energies 2021, 14, 760. [Google Scholar] [CrossRef]
  35. Quartier, N.; Ropero-Giralda, P.; Domínguez, J.M.; Stratigaki, V.; Troch, P. Influence of the Drag Force on the Average Absorbed Power of Heaving Wave Energy Converters Using Smoothed Particle Hydrodynamics. Water 2021, 13, 384. [Google Scholar] [CrossRef]
  36. Mokos, A.; Rogers, B.D.; Stansby, P.K.; Domínguez, J.M. Multi-phase SPH modelling of violent hydrodynamics on GPUs. Comput. Phys. Commun. 2015, 196, 304–316. [Google Scholar] [CrossRef]
  37. Ruffini, G.; Briganti, R.; De Girolamo, P.; Stolle, J.; Ghiassi, B.; Castellino, M. Numerical Modelling of Flow-Debris Interaction during Extreme Hydrodynamic Events with DualSPHysics-CHRONO. Appl. Sci. 2021, 11, 3618. [Google Scholar] [CrossRef]
  38. Brufau, P.; Garcia-Navarro, P. Two-dimensional dam break flow simulation. Int. J. Numer. Methods Fluids 2000, 33, 35–57. [Google Scholar] [CrossRef]
  39. Liang, Q.; Marche, F. Numerical resolution of well-balanced shallow water equations with complex source terms. Adv. Water Resour. 2009, 32, 873–884. [Google Scholar] [CrossRef]
  40. Biscarini, C.; Di Francesco, S.; Manciola, P. CFD modelling approach for dam break flow studies. Hydrol. Earth Syst. Sci. 2010, 14. [Google Scholar] [CrossRef] [Green Version]
  41. Ozmen-Cagatay, H.; Kocaman, S. Dam-break flows during initial stage using SWE and RANS approaches. J. Hydraul. Res. 2010, 48, 603–611. [Google Scholar] [CrossRef]
  42. Lauber, G.; Hager, W.H. Experiments to dambreak wave: Horizontal channel. J. Hydraul. Res. 1998, 36, 291–307. [Google Scholar] [CrossRef]
  43. Launder, B.; Spalding, D. The Numerical Computation of Turbulent Flow Computer Methods. Comput. Methods Appl. Mech. Eng. 1974, 3, 269–289. [Google Scholar] [CrossRef]
  44. Liu, G.; Liu, M. Smoothed Particle Hydrodynamics: A Meshfree Particle Method; World Scientific: Singapore, 2003. [Google Scholar] [CrossRef]
  45. Wendland, H. Piecewise polynomial, positive definite and compactly supported radial basis functions of minimal degree. Adv. Comput. Math. 1995, 4, 389–396. [Google Scholar] [CrossRef]
  46. Monaghan, J.J.; Cas, R.A.F.; Kos, A.M.; Hallworth, M. Gravity currents descending a ramp in a stratified tank. J. Fluid Mech. 1999, 379, 39–69. [Google Scholar] [CrossRef]
  47. Monaghan, J.J. Smoothed Particle Hydrodynamics. Annu. Rev. Astron. Astrophys. 1992, 30, 543–574. [Google Scholar] [CrossRef]
  48. Fourtakas, G.; Dominguez, J.M.; Vacondio, R.; Rogers, B.D. Local uniform stencil (LUST) boundary condition for arbitrary 3-D boundaries in parallel smoothed particle hydrodynamics (SPH) models. Comput. Fluids 2019, 190, 346–361. [Google Scholar] [CrossRef]
  49. Antuono, M.; Colagrossi, A.; Marrone, S. Numerical diffusive terms in weakly-compressible SPH schemes. Comput. Phys. Commun. 2012, 183, 2570–2580. [Google Scholar] [CrossRef]
  50. Dalrymple, R.A.; Knio, O. SPH modelling of water waves. In Proceedings of the ASCE Conference on Coastal Dynamics ’01, Lund, Sweden, 11–15 June 2001; pp. 779–787. [Google Scholar] [CrossRef]
  51. Crespo, A.; Gómez-Gesteira, M.; Dalrymple, R. Boundary conditions generated by dynamic particles in SPH methods. Comput. Mater. Contin. 2007, 5, 173–184. [Google Scholar]
  52. Domínguez, J.M.; Fourtakas, G.; Cercós-Pita, J.L.; Vacondio, R.; Rogers, B.D.; Crespo, A. Evaluation of reliability and efficiency of different boundary conditions in an SPH code. In Proceedings of the 10th International SPHERIC Workshop, Parma, Italy, 16–18 June 2015; pp. 341–348. [Google Scholar]
  53. English, A.; Domínguez, J.; Vacondio, R.; Crespo, A.; Stansby, P.; Lind, S.; Chiapponi, L.; Gómez-Gesteira, M. Modified dynamic boundary conditions (mDBC) for general purpose smoothed particle hydrodynamics (SPH): Application to tank sloshing, dam break and fish pass problems. Comput. Part. Mech. 2021. [Google Scholar] [CrossRef]
  54. Marrone, S.; Antuono, M.; Colagrossi, A.; Colicchio, G.; Le Touzé, D.; Graziani, G. δ-SPH model for simulating violent impact flows. Comput. Methods Appl. Mech. Eng. 2011, 200, 1526–1542. [Google Scholar] [CrossRef]
  55. Liu, M.; Liu, G. Restoring particle consistency in smoothed particle hydrodynamics. Appl. Numer. Math. 2006, 56, 19–36. [Google Scholar] [CrossRef]
  56. Tagliafierro, B.; Crespo, A.; González-Cao, J.; Altomare, C.; Sande, J.; Pe na, E.; Gómez-Gesteira, M. Numerical modelling of a multi-chambered low-reflective caisson. Appl. Ocean Res. 2020, 103, 102325. [Google Scholar] [CrossRef]
  57. Willmott, C.J.; Ackleson, S.G.; Davis, R.E.; Feddema, J.J.; Klink, K.M.; Legates, D.R.; O’Donnell, J.; Rowe, C.M. Statistics for the evaluation and comparison of models. J. Geophys. Res. Ocean. 1985, 90, 8995–9005. [Google Scholar] [CrossRef] [Green Version]
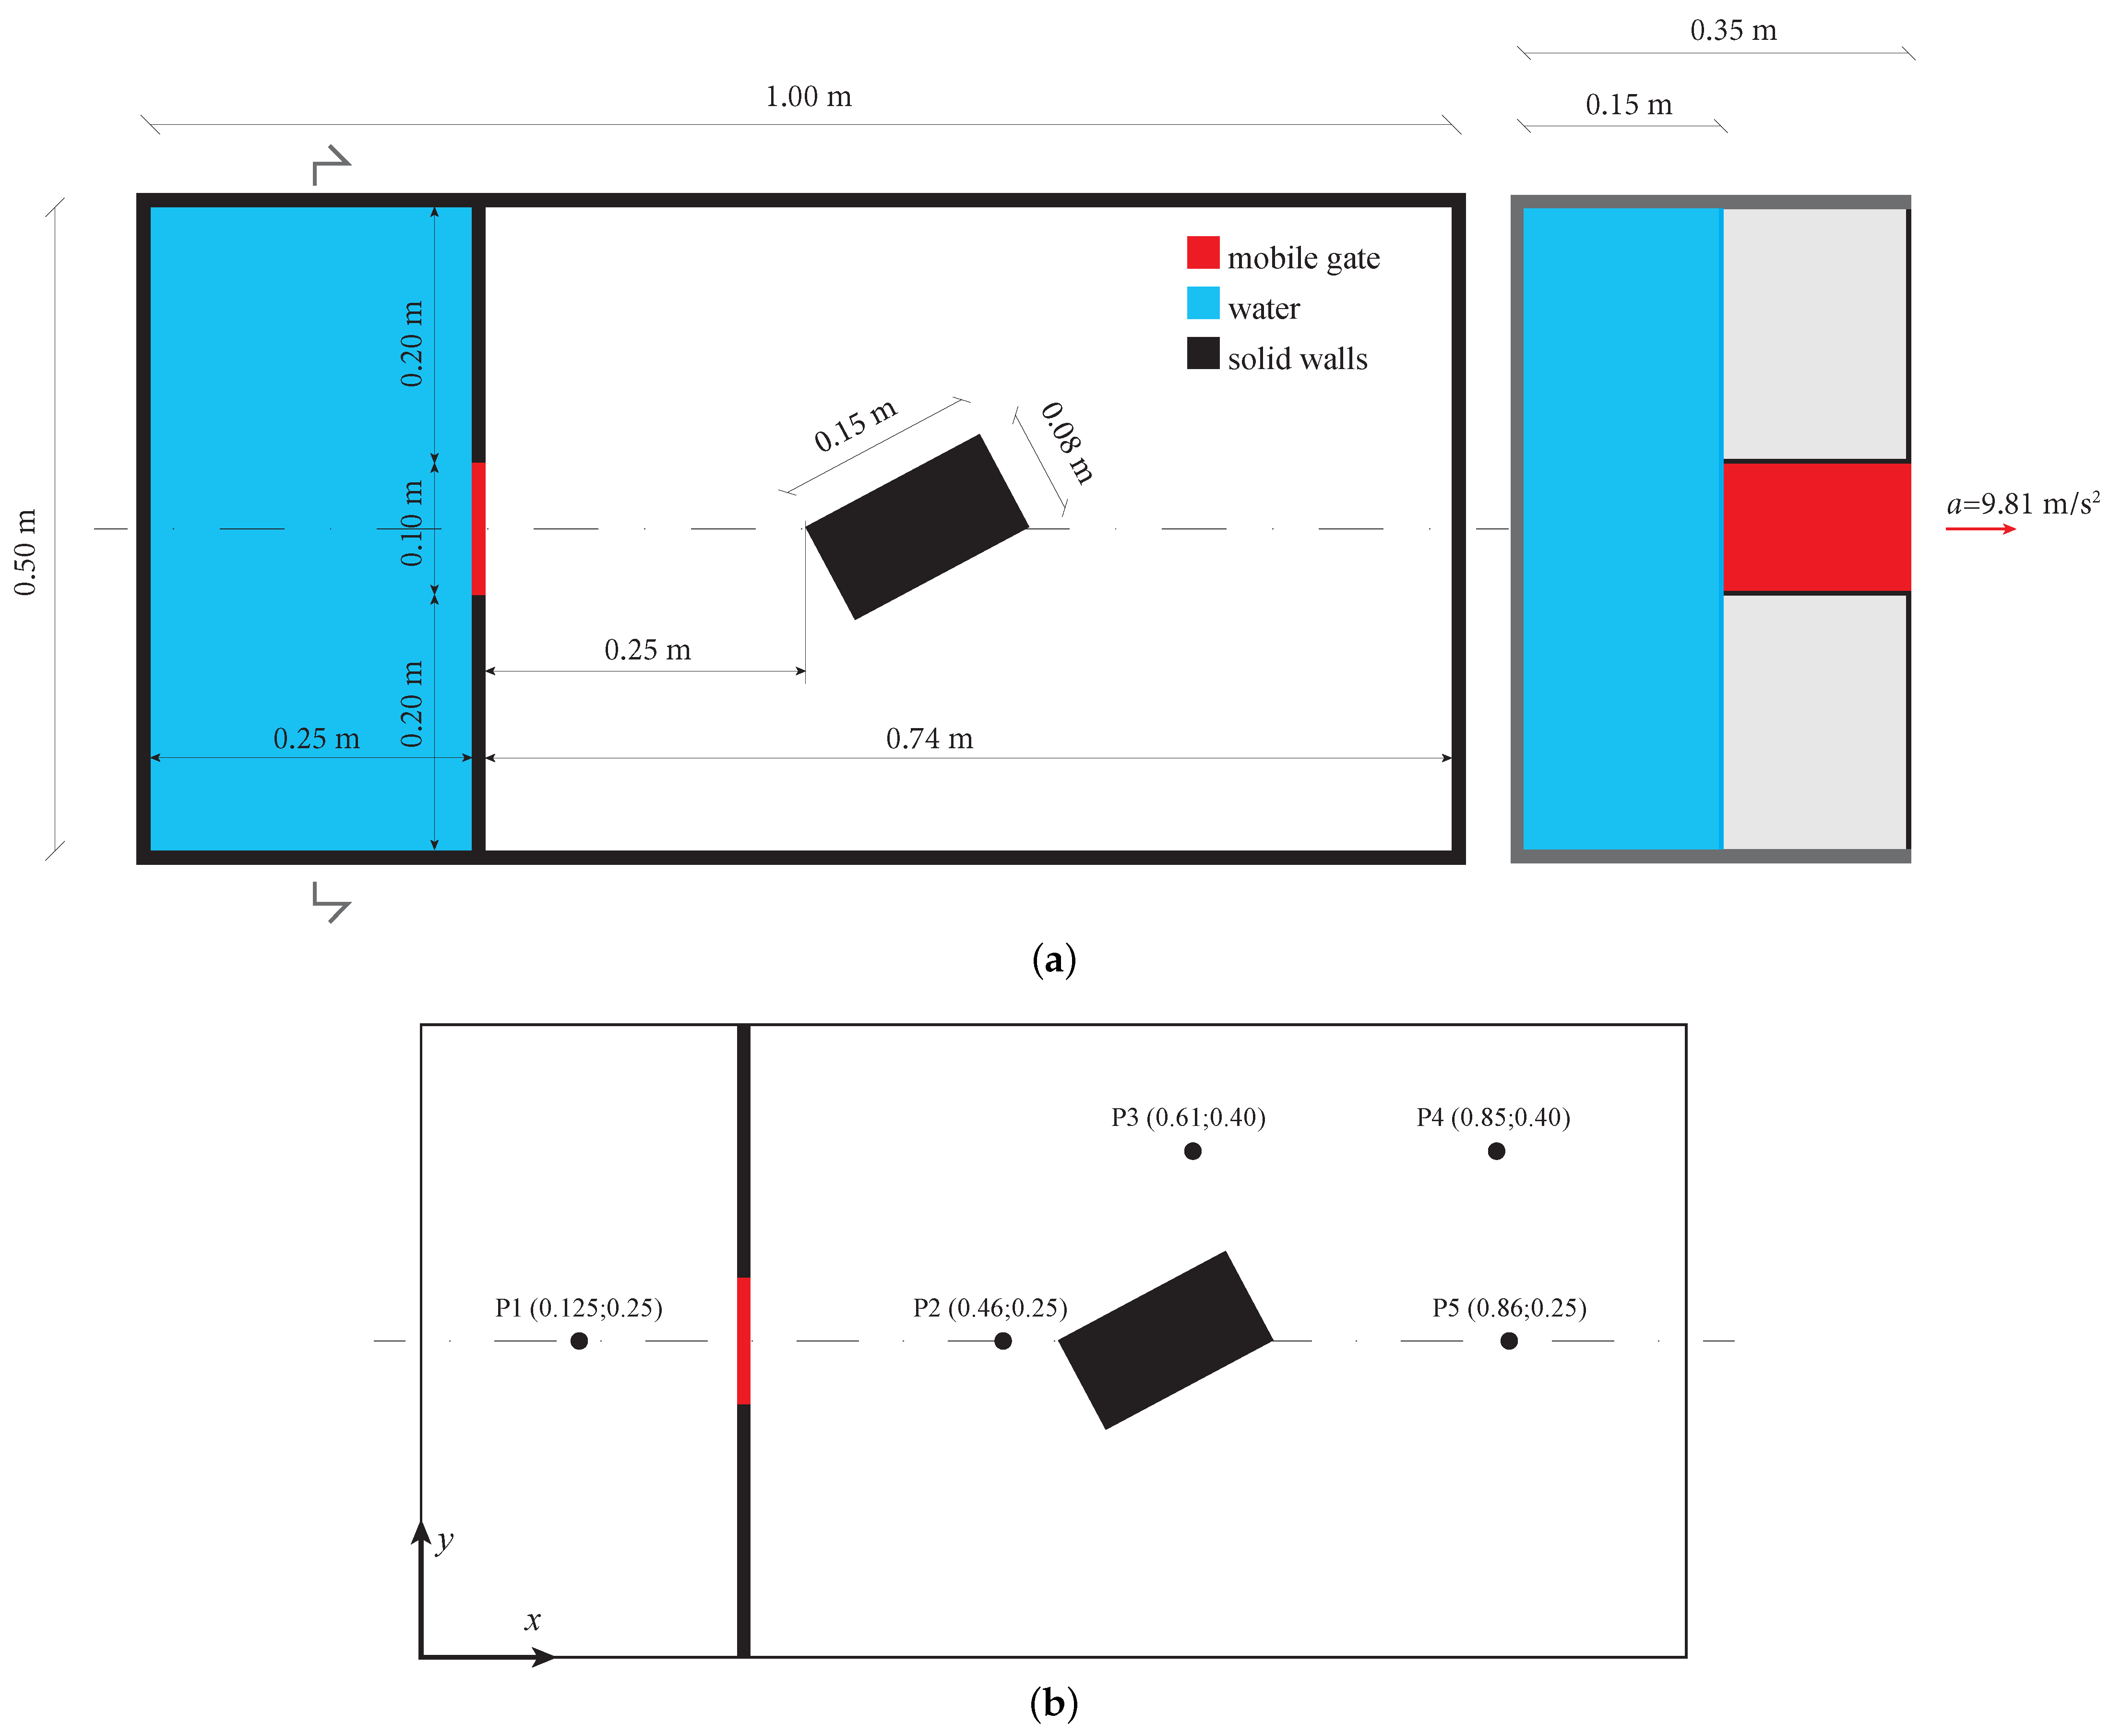
Figure 1. Planar and section scheme of the simulation domain (a) and measurement points positions (b).
Water 13 02133 g001
Figure 2. Smoothing kernel function.
Water 13 02133 g002
Figure 3. 3D views of the DualSPHysics numerical model.
Water 13 02133 g003
Figure 4. Different treatment of the surfaces: in grey, the ones computed with standard DBC; in orange, the ones with the new mDBC; in black, the reference points for pressure computation.
Water 13 02133 g004
Figure 5. Comparison at P1 (a) and relative local elevation error (b) with d p = s / 3 and different values of κ .
Water 13 02133 g005
Figure 6. Comparison in P2 (a) and relative local elevation error (b) with d p = s / 3 and different values of κ .
Water 13 02133 g006
Figure 7. Comparison in P2 (a) and relative local elevation error (b) with d p = s / 2 , DBC and different values of κ .
Water 13 02133 g007
Figure 8. General comparison at P2 (a) and relative local elevation error (b); same κ value but different resolutions and BC.
Water 13 02133 g008
Figure 9. Comparison at P3 (a) and relative local elevation error (b) with with mDBC and different resolutions.
Water 13 02133 g009
Figure 10. Comparison in P4 (a) and relative local elevation error (b) with mDBC and different resolutions.
Water 13 02133 g010
Figure 11. Pressure histories in the middle points of the faces, at a 3 cm height; the dashed line refers to the stillness condition.
Water 13 02133 g011
Figure 12. Variation in time of the total force exerted by the fluid on the downstream structure.
Water 13 02133 g012
Figure 13. Overall comparison, including numerical reference, at P5 (a) and relative error (b).
Water 13 02133 g013
Figure 14. Visual comparison between live experimental frames (left) and DualSPHysics simulation with d p = s / 4 , κ = 1.0 , mDBC (right). White and red lines highlight the fluid mass shape for easier understanding.
Water 13 02133 g014
Table 1. Index of agreement and linear correlation error at P1 and P2 for two different simulations.
d p s / 3 s / 3
κ 1.01.2
BCmDBCmDBC
Water 13 02133 i001 Water 13 02133 i002
P1 W * 0.91820.9016
R * 0.99360.9925
P2 W * 0.66920.6411
R * 0.92430.9216
Table 2. Index of agreement and linear correlation error at P2 for three different simulations.
d p s / 2 s / 2 s / 3
κ 1.21.01.0
BCDBCDBCmDBC
Water 13 02133 i003 Water 13 02133 i004 Water 13 02133 i005
P2 W * 0.40830.64270.6692
R * 0.75760.92630.9243
Table 3. Index of agreement and linear correlation error at P3 and P4 for two different simulations.
d p s / 4 s / 3
κ 1.01.0
BCmDBCmDBC
Water 13 02133 i006 Water 13 02133 i007
P3 W * 0.68060.7043
R * 0.93720.9114
P4 W * 0.70170.7173
R * 0.93160.9432
Table 4. Summary table, with index of agreement and linear correlation error for each point and each simulation.
Simulations d p s / 4 s / 3 s / 3 s / 2 s / 2 s / 4
κ 1.01.01.21.21.01.2
BCmDBCmDBCmDBCDBCDBCmDBC
Water 13 02133 i008 Water 13 02133 i009 Water 13 02133 i010 Water 13 02133 i011 Water 13 02133 i012 Water 13 02133 i013
P1 W * 0.90110.91820.90160.85220.88410.9261
R * 0.99310.99360.99250.98980.99170.9940
P2 W * 0.66650.66920.64110.40830.64270.7166
R * 0.91020.92430.92160.75760.92630.9456
P3 W * 0.68060.70430.63880.49160.57510.6947
R * 0.93720.91140.89930.86830.89940.9394
P4 W * 0.70170.71730.73980.73970.74430.6374
R * 0.93160.94320.95760.96590.96800.9021
P5 W * 0.45660.61390.69010.65510.67850.5810
R * 0.87880.91620.91690.91390.91540.8949
Averaged W * 0.68130.72460.72230.62940.70490.7112
R * 0.93020.93770.93810.89910.94010.9352
Publisher’s Note: MDPI stays neutral with regard to jurisdictional claims in published maps and institutional affiliations.