Abstract
Periphytic diatoms play important functional roles in aquatic ecosystems. Their community compositions are widely used in water quality monitoring due to their wide distribution, short reproductive cycles, and sensitivity to environmental changes. In this study, 116 samples of periphytic diatom samples were collected from lakes in the lower reaches of the Yangtze River. The weighted average without tolerance down-weighting regression method was used to develop total phosphorus (r2 = 0.661), total nitrogen (r2 = 0.699), and chemical oxygen demand (r2 = 0.423) models, and the optimal and tolerance values of 78 periphytic species were calculated. Then, a new index, the comprehensive diatom index (CDI), was established on the basis of the optima and tolerances of these 78 species concerning the three environmental variables (TP, TN, and COD) to assess the water trophic status of the lakes in this region. According to the CDI, the trophic statuses of 8, 17, 23, 30, 22, and 14 sample sites were oligotrophic, mesotrophic, light eutrophication, moderate eutrophication, heavy eutrophication, and ultra-eutrophication, respectively. The CDI was more strongly correlated with the conductivity, pH, TP, TN, COD, and TDS than other diatom indices. These results demonstrate that the CDI is a useful metric for assessing the water trophic status of the lakes in the lower reaches of the Yangtze River.
1. Introduction
Diatoms have been studied as environmental indicators since the 19th century [1]. In particular, periphytic diatoms are widely distributed worldwide and are very sensitive to changes in limnological variables, including temperature, pH, dissolved oxygen levels, salinity, conductivity, nutrient concentrations, and turbidity [2,3,4,5,6,7]. They occur on various substrates (e.g., stones, plants, and sediments) in most water bodies. They are key components of aquatic ecosystems and play fundamental roles in food webs [8,9,10]. Their rapid rate of reproduction and simplicity of sample collection and preparation make them low-cost alternatives for evaluating the status of water bodies [11]. Consequently, it has been argued that diatoms are the best biological assessment index targets for assessing water quality [12,13,14,15,16,17].
Diatom indices are based on diatom species-level classifications and are divided into different levels on the basis of diatom ecological preferences and pollution resistance to determine the degree of organic pollution or level of nutrients in the environment. Diatom indices are currently widely used to evaluate the ecological quality of rivers and lakes. The first diatom index was developed in Belgian basin of the river Meuse and was used to assess the pollution degree of the water [18]. Later, other researchers improved diatom indices according to the environmental conditions of other research areas and established new diatom indices. Most of these diatom indices are based on the relative abundances of species and their sensitivity to environmental gradients within rivers [1,5,19,20,21,22,23]. In addition, several diatom indices have been established for lakes [24,25]. To facilitate diatom index studies, Lecointe et al. (1993) developed the “Omnida” software program, which is currently used by scholars globally [26].
Some countries have established their own diatom indices on the basis of diatom community structures and the ecological preferences of species in certain regions. Nevertheless, some problems remain in the application of diatom indices, especially for assessing the quality of water environments in China. Several studies have indicated that diatom indices developed in certain regions are less successful when applied to other regions [4,10,15,27,28]. Furthermore, several studies have suggested that species typically exhibit regional variation in ecological tolerances that are influenced by a range of environmental factors such as climate, catchment geology, soil, river geomorphology, topography, and vegetation [4,29,30,31,32]. In addition, periphytic diatoms can be region-specific, and more than 100 new diatom species have been reported in China in recent years. Thus, the pollution sensitivity and ecological indicator values of these species require further investigation before they can be applied to diatom indices. Lastly, different countries and regions have their own guidelines for water quality parameters, and differences also exist in water quality evaluation standards among countries [33]. Therefore, the establishment of regional diatom indices will render assessment results more scientifically accurate and reasonable for application.
China comprises a large area and features various types of water environments that contain diverse diatom species that differ from those in other countries. Moreover, there are also considerable differences in the diatom compositions of the different watersheds within China. Consequently, the direct use of a diatom index developed for use in other countries to assess water bodies in China is controversial [34,35]. The use of physical and chemical monitoring methods to assess water quality in China is more common, while the use of diatom biological monitoring approaches is rare. Furthermore, an in-depth study of diatom indicators for waters bodies in China has not been conducted, and a suitable diatom index for biomonitoring of lakes and rivers in China has not been developed [36]. Many lakes exist in the lower reaches of the Yangtze River, which is the area with the densest distribution of lakes in China. The lakes in this region host rich freshwater resources, but the degree of eutrophication is also very serious in this area and is an ecological and environmental problem that requires urgent mitigation. Diverse periphytic diatoms are also present in the water bodies in this region. Thus, the development of a suitable diatom index is needed to better assess the trophic status of the water bodies in this area.
The aim of this research was to develop a comprehensive diatom index (CDI) for lakes in the lower reaches of the Yangtze River, which can improve water trophic status assessment for the studied systems. The CDI is based on the growth optimal and tolerance characteristics of a periphytic diatom species in relation to the total phosphorus (TP), total nitrogen (TN), and chemical oxygen demand (COD), brought together in a final metric, which provides an integrated value of water trophic status of lakes in the lower reaches of the Yangtze River.
2. Materials and Methods
2.1. Study Region
The lower reaches of the Yangtze River comprise the area from Jiangxi to Shanghai. The region includes Jiangxi, Anhui, Jiangsu, Zhejiang, and Shanghai and has a drainage area of about 120,000 km2. The terrain is flat and the altitudes are mostly below 50 m. The area is mainly composed of plains and hills and includes the Jiangsu Anhui River plain, the Poyang Lake Plain, and the Yangtze River delta plain. The lower reaches of the Yangtze River have a subtropical monsoon climate, with an average annual temperature of 13–18 °C and four distinct seasons. The summers are hot, humid, and rainy; the winters are cold, dry, and less rainy. There is abundant rainfall in the basin, with an average annual rainfall of about 1100 mm, but the rainfall mainly occurs from April to October. Many lakes are present in the plain region of the lower reaches of the Yangtze River, most of which are shallow freshwater lakes, making this one of the most densely distributed freshwater lake areas in China [37]. In the plain area of the lower reaches of the Yangtze River, there are 233 lakes with areas of greater than 1 km2, 13 lakes with areas of greater than 100 km2, and two lakes with areas of greater than 1000 km2. Poyang Lake, Taihu Lake, and Chaohu Lake are located in this area. The lakes in the lower reaches of the Yangtze River represent rich freshwater resources, but the degree of eutrophication is also very serious and represents an urgent ecological and environmental problem that requires resolution [38]. The development of agriculture has led to an increased flow of pollutants such as pesticides and chemical fertilizers into the lakes with rainfall. Furthermore, increased discharge of domestic sewage and industrial wastewaters, in addition to pollution caused by lake aquaculture, has accelerated lake eutrophication, leading to a decline in the lake water ecosystem functions in the lower reaches of the Yangtze River. Moreover, the ecosystems and biodiversity within these lakes have become seriously affected. In addition, the water quality of the lakes in this area has been seriously affected, thereby critically threatening the drinking water sources of the residents of the region, resulting in water resource shortages, and even affecting the health of residents [39].
2.2. Diatom Sampling and Identification
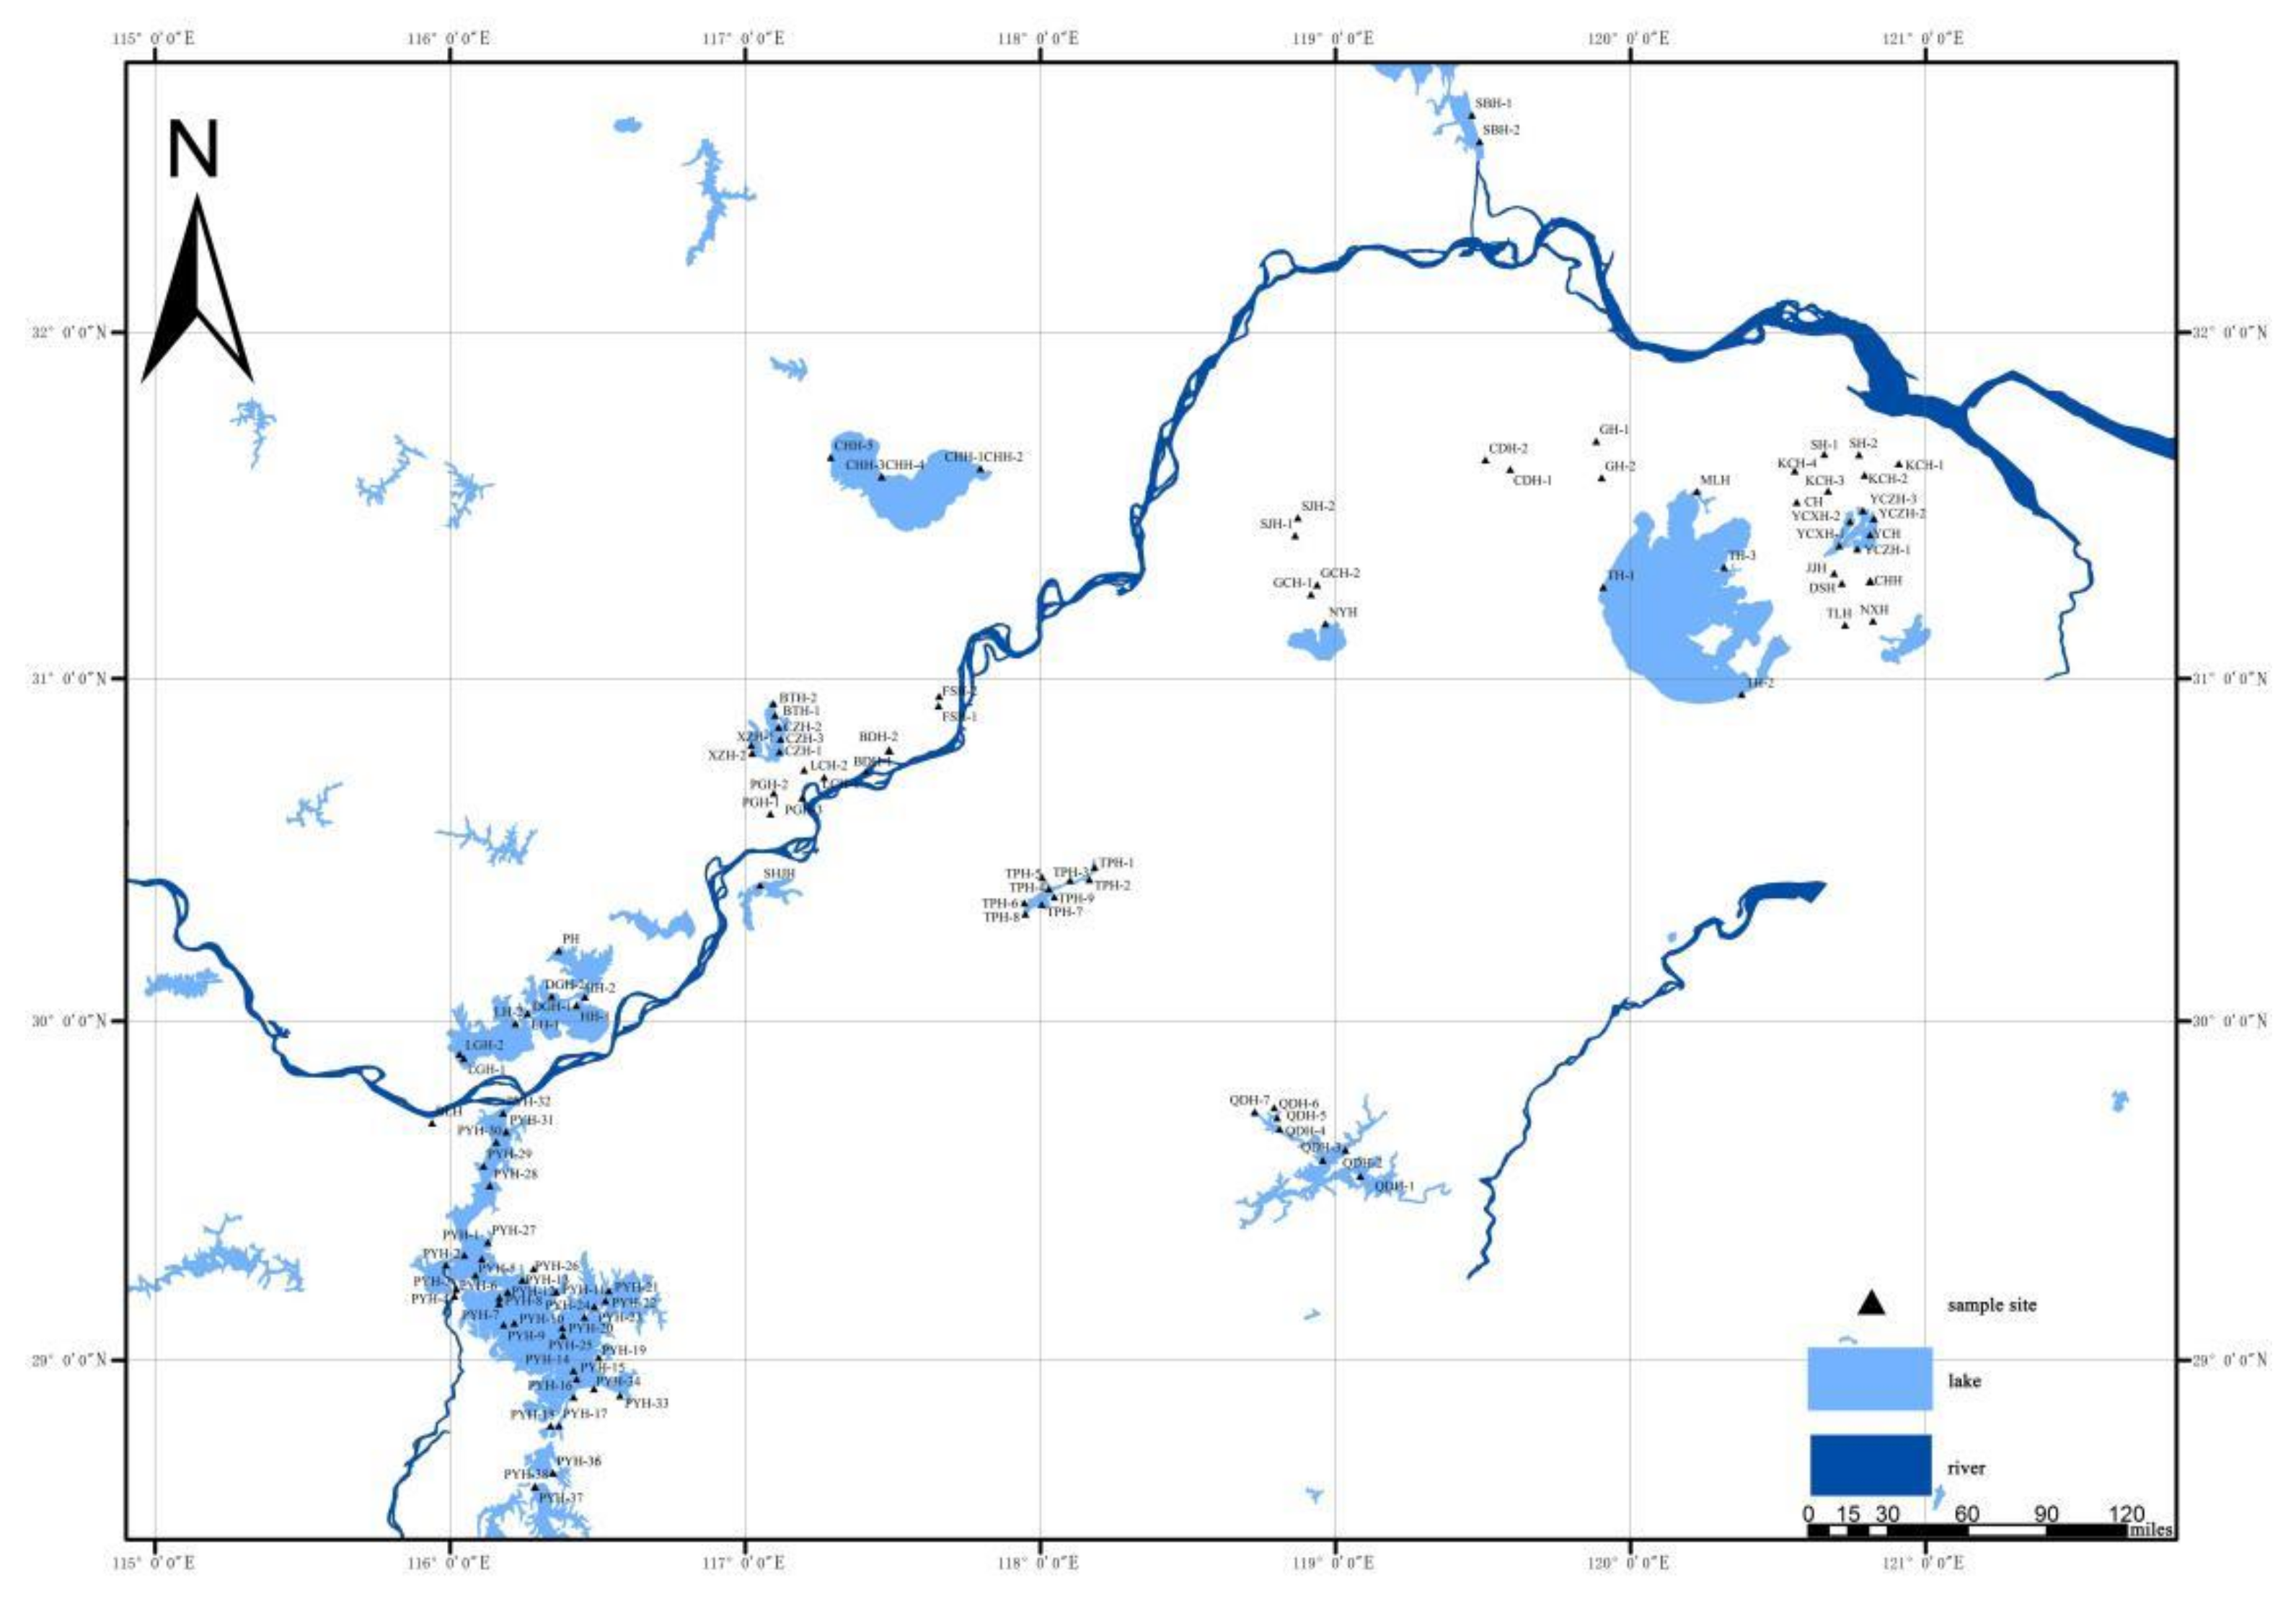
Periphytic diatom samples were collected from 116 sites of 34 lakes during August 2017 and 2018 (Figure 1). The diatom samples were collected from natural substrates, including stones, rocks, and aquatic macrophytes. If the above substrates were absent, other substrates were sampled, including wharfs, piers, navigation markers, dead wood, and fishing nets. The samples were brushed from the substrates using clean toothbrushes and were rinsed several times with distilled water into a container. The resulting samples were collected in plastic bottles (50 mL) and preserved with formalin (4% final concentration).
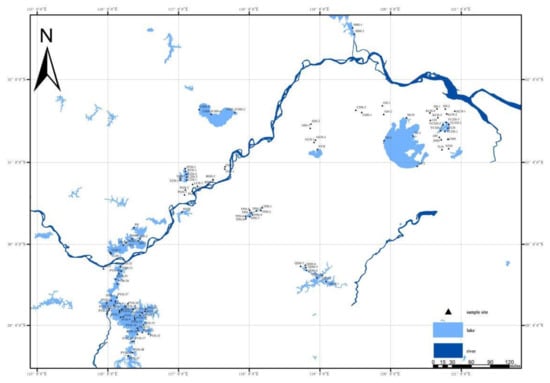
Figure 1.
Sample sites in the lakes in the lower reaches of the Yangtze River.
The organic material was removed from the diatom samples using concentrated nitric acid and a microwave-accelerated reaction system [40,41]. Permanent slides were then prepared using Naphrax (Brunel Microscopes Ltd., Chippenham, UK) and were observed using a light microscope at 1000× magnification. At least 400 diatom valves were counted for each slide [19], and the diatoms were identified to the species level at least. The diatom identification and the nomenclature used were those described by Krammer and Lange-Bertalot [42,43,44,45], Zhu and Chen [41], Lange-Bertalot et al. [46], Diatoms of North America (http://diatoms.org/ (accessed on: 15 July 2019)), Diatom New Taxon File (http://symbiont.ansp.org/dntf/index.php (accessed on: 15 July 2019), and Institute for Biodiversity Science and Sustainability (http://researcharchive.calacademy.org/ (accessed on: 15 July 2019)).
2.3. Environmental Data
The temperature, pH, dissolved oxygen (DO), total dissolved solids (TDS), and conductivity (Cond) of the water were measured using a YSIPro Plus multiparameter meter (Yellow Springs, Ohio, OH, USA). The water samples (1 L) were collected 0.5 m below the water surface and were analyzed to determine their TP, TN, and COD (Table S1 in the Supplementary Materials). The TP was measured using alkaline potassium persulfate digestion ultraviolet spectrophotometry, the TN was measured using potassium persulfate digestion ammonium molybdate spectrophotometry, and the COD was measured using the potassium permanganate index method [47]. Principal component analysis (PCA) was used to explore the relationship between diatoms and water chemistry (Figure S1 in Supplementary Materials).
2.4. Model Development and Statistical Analyses
The environmental optima and tolerances of the diatom species were estimated using the weighted average method (WA) [48]. The theoretical foundation of this method is that species occur in the highest abundances near their ecological optima. Thus, the environmental optimum of a diatom species for a particular environmental variable is the mean of the variable values at sites where the taxon is present, and it is weighted by the species abundances in analyzed samples. Thus, the optimum can then be calculated using Equation (1).
where ûvk is the v environmental variable optimum for a species k, yik is the is the abundance of species k at site i, and xvi is the value of the v environmental variable at site i.
The tolerance of the species is the weighted standard deviation,
where ǒk is the environmental tolerance of species k, and N is the sample size.
The estimated optimum can be used to infer a lake’s given environmental variable (xi) from its diatom assemblage as follows:
In addition, the species tolerance-weighted value is
Using the random sampling method, 83 samples were selected as the test group, and 33 samples were selected as the control group. Regression was used to develop TP, COD, and TN models using data for 83 samples and by calculating the TP, COD, and TN optimal and tolerance levels (defined as one standard deviation) of the individual species. The calibration step allowed testing of this model via calibration against the 33 samples in the control group. The calculations were performed using the R Studio program. The root-mean-squared error (RMSE) of the prediction values was calculated directly using the calibration set.
On the basis of the optimal and tolerance values for TP, COD, and TN, the trophic status indicator (v) and sensitive indicator (s) values for the diatoms were determined. The trophic status indicator values (v) for TP, COD, and TN were slightly modified according to national standards and were divided into five grades (1–5). On the basis of the TP tolerance of the diatoms, the sensitivity values were divided into four grades (1–4). Then, the comprehensive diatom index (CDI) for evaluating the degree of eutrophication of the lakes waters was established as a function of the comprehensive indices of TP, COD, and TN according to the equation described by Zelinka and Marvan [17].
where ak is the relative abundance of the species k, vk is the sensitivity value for species k for the comprehensive indicators, sk is the nutritional status indicator value for species k as a function of the comprehensive indicators, and WMS is the weighted average value for species k as a function of the environmental factors (values of 1 to 5). The value of the index varies between 0 and 100.
3. Results
3.1. Predictive Models of Environments of Diatom Assemblages
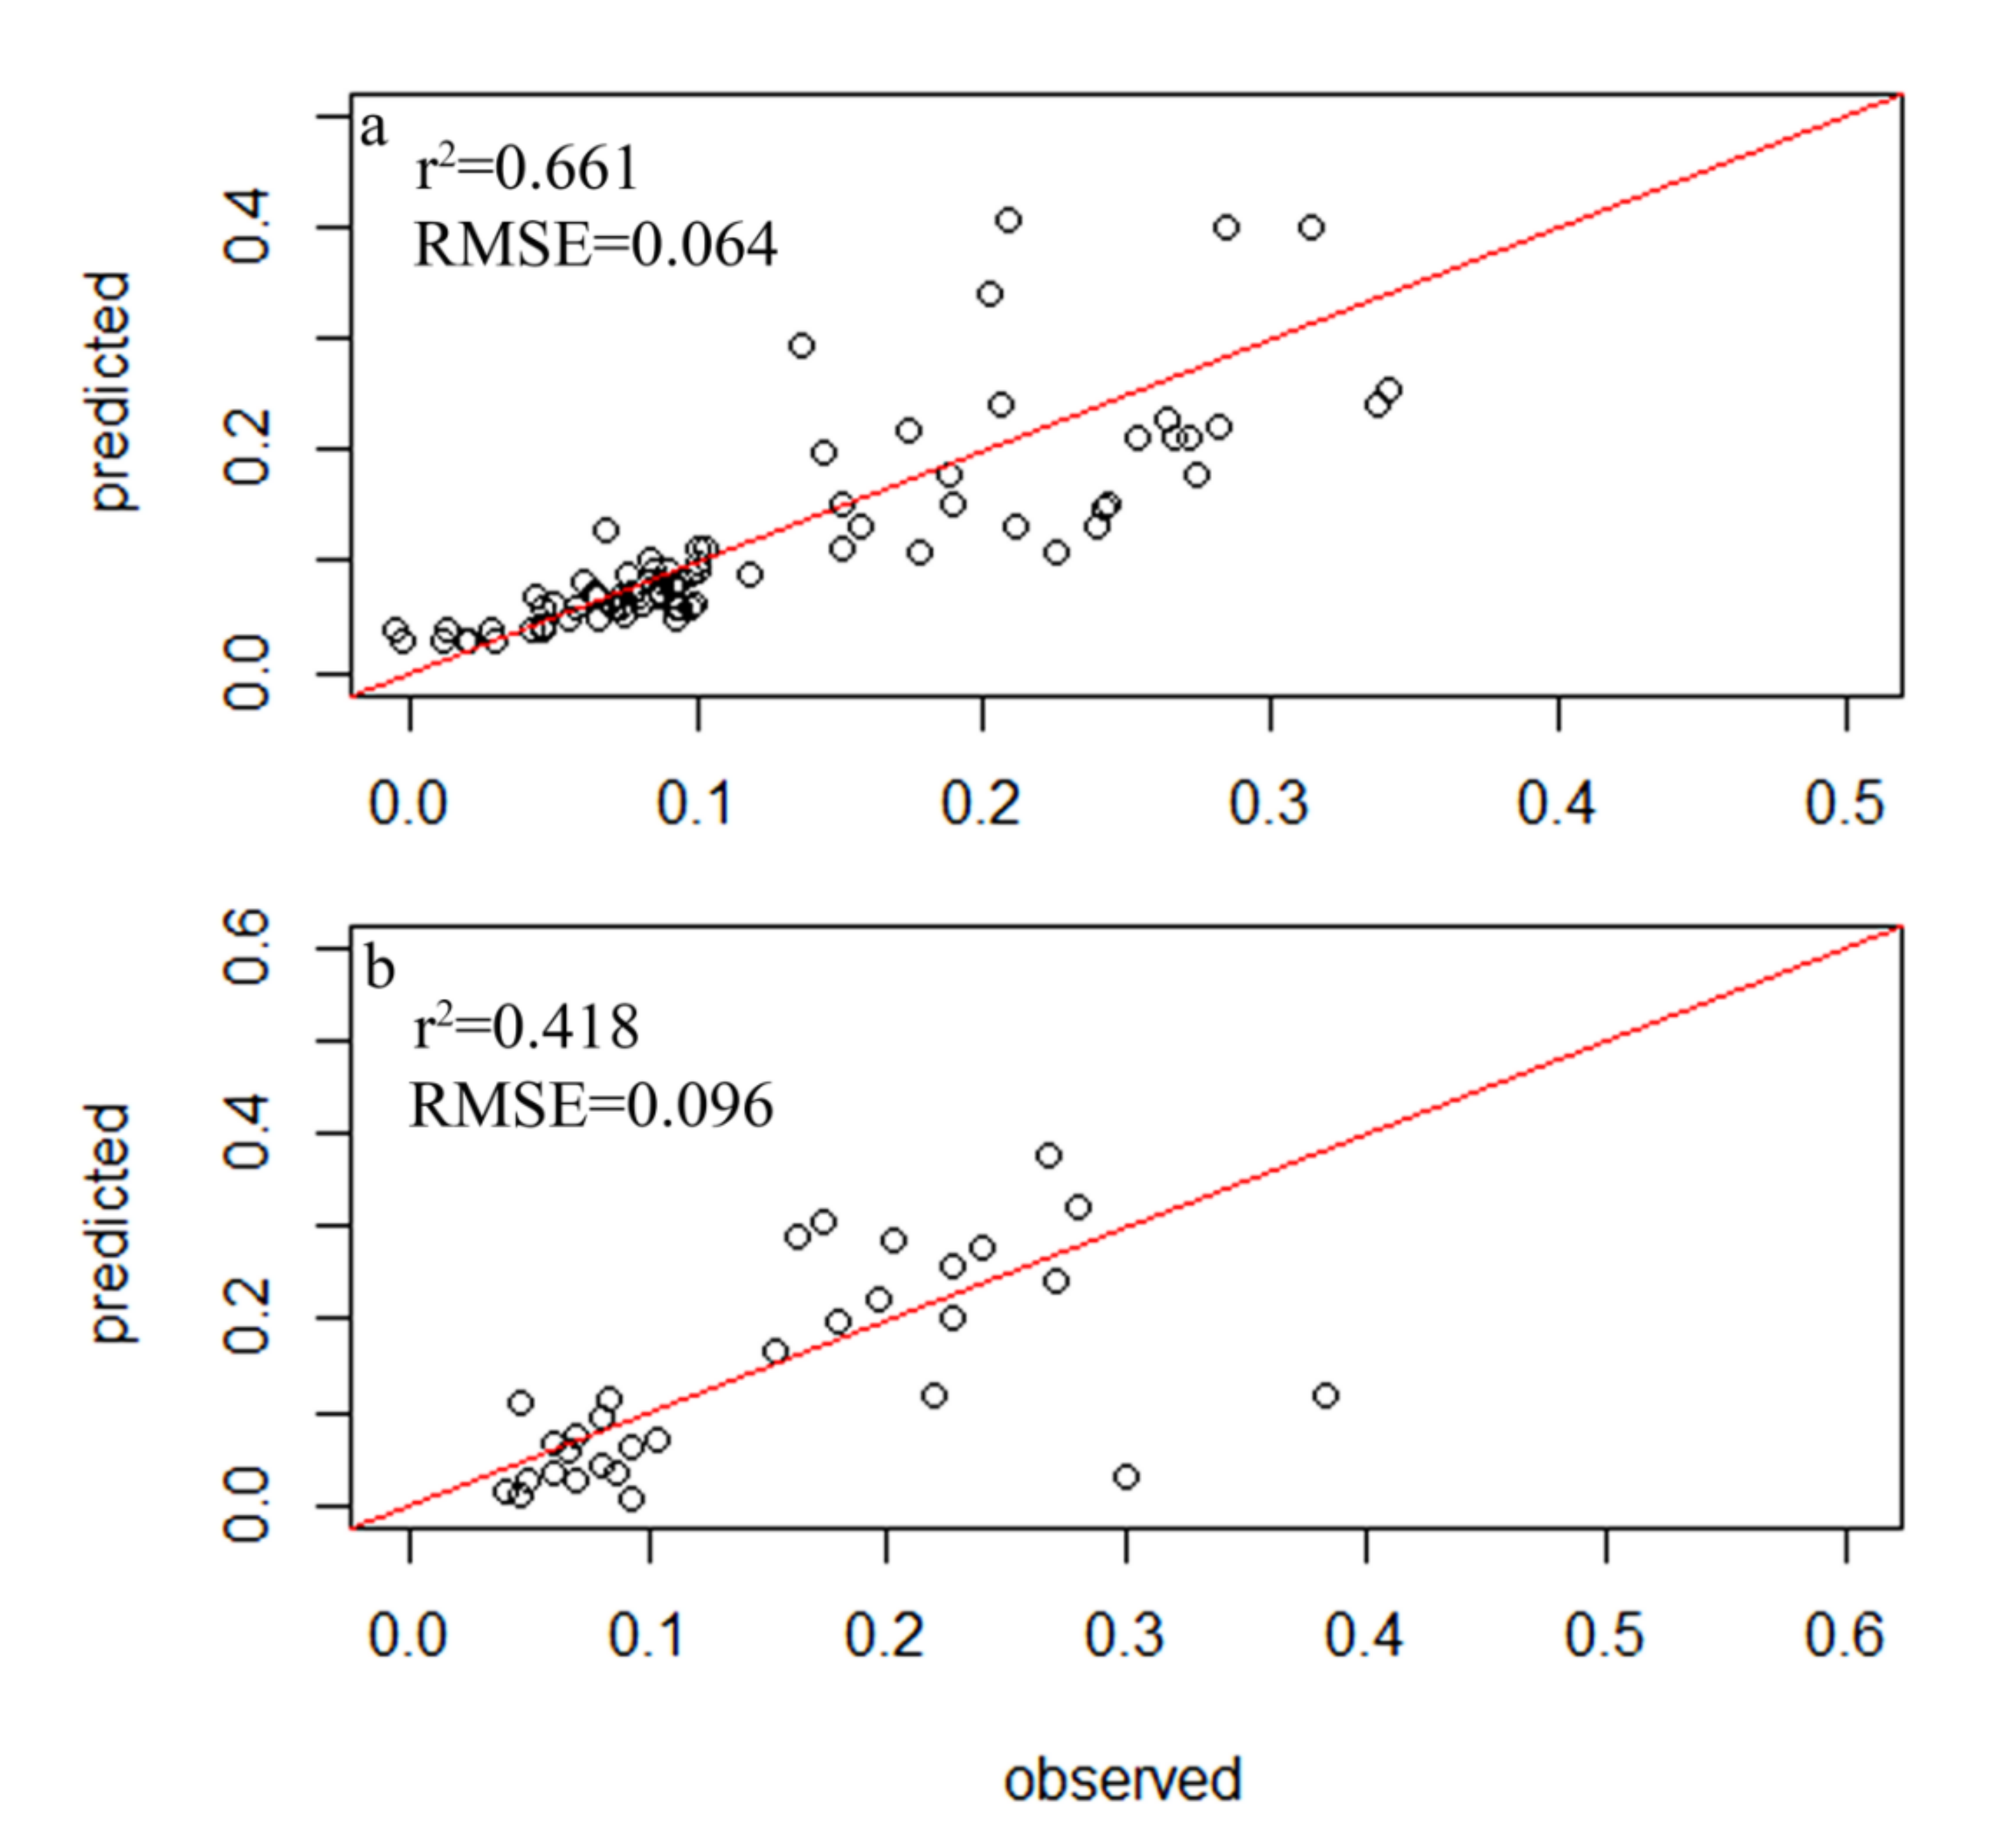
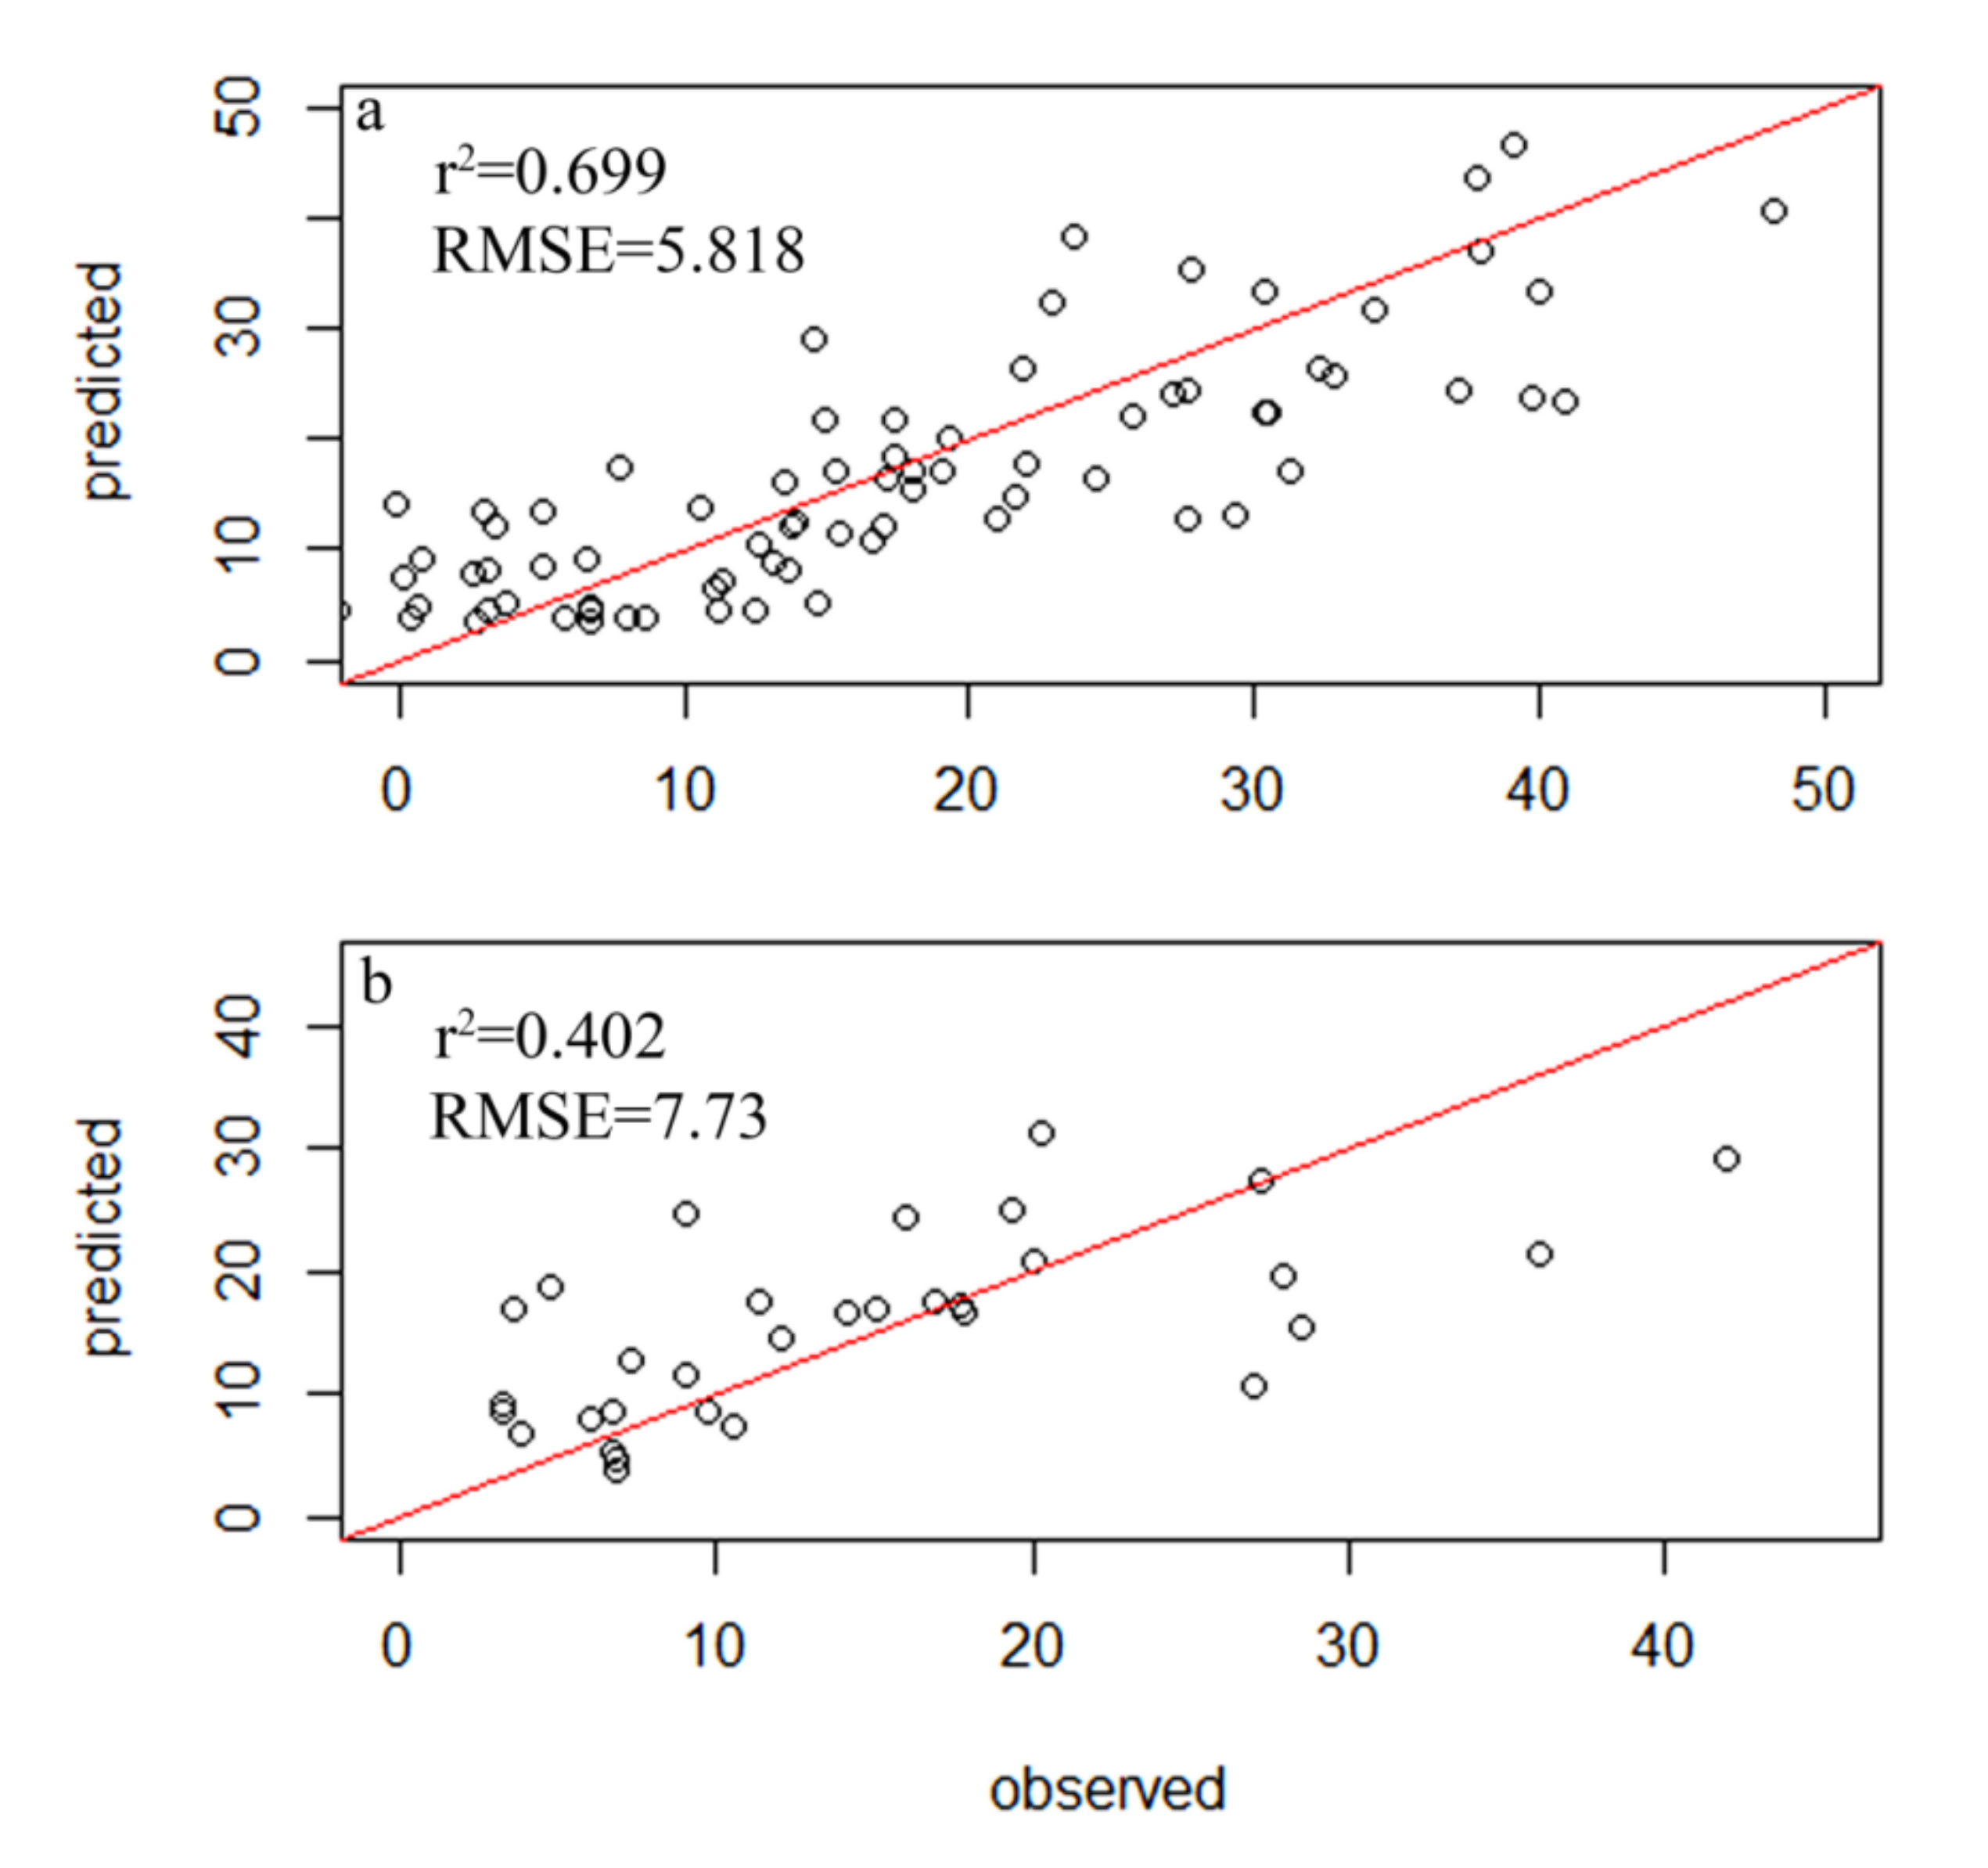
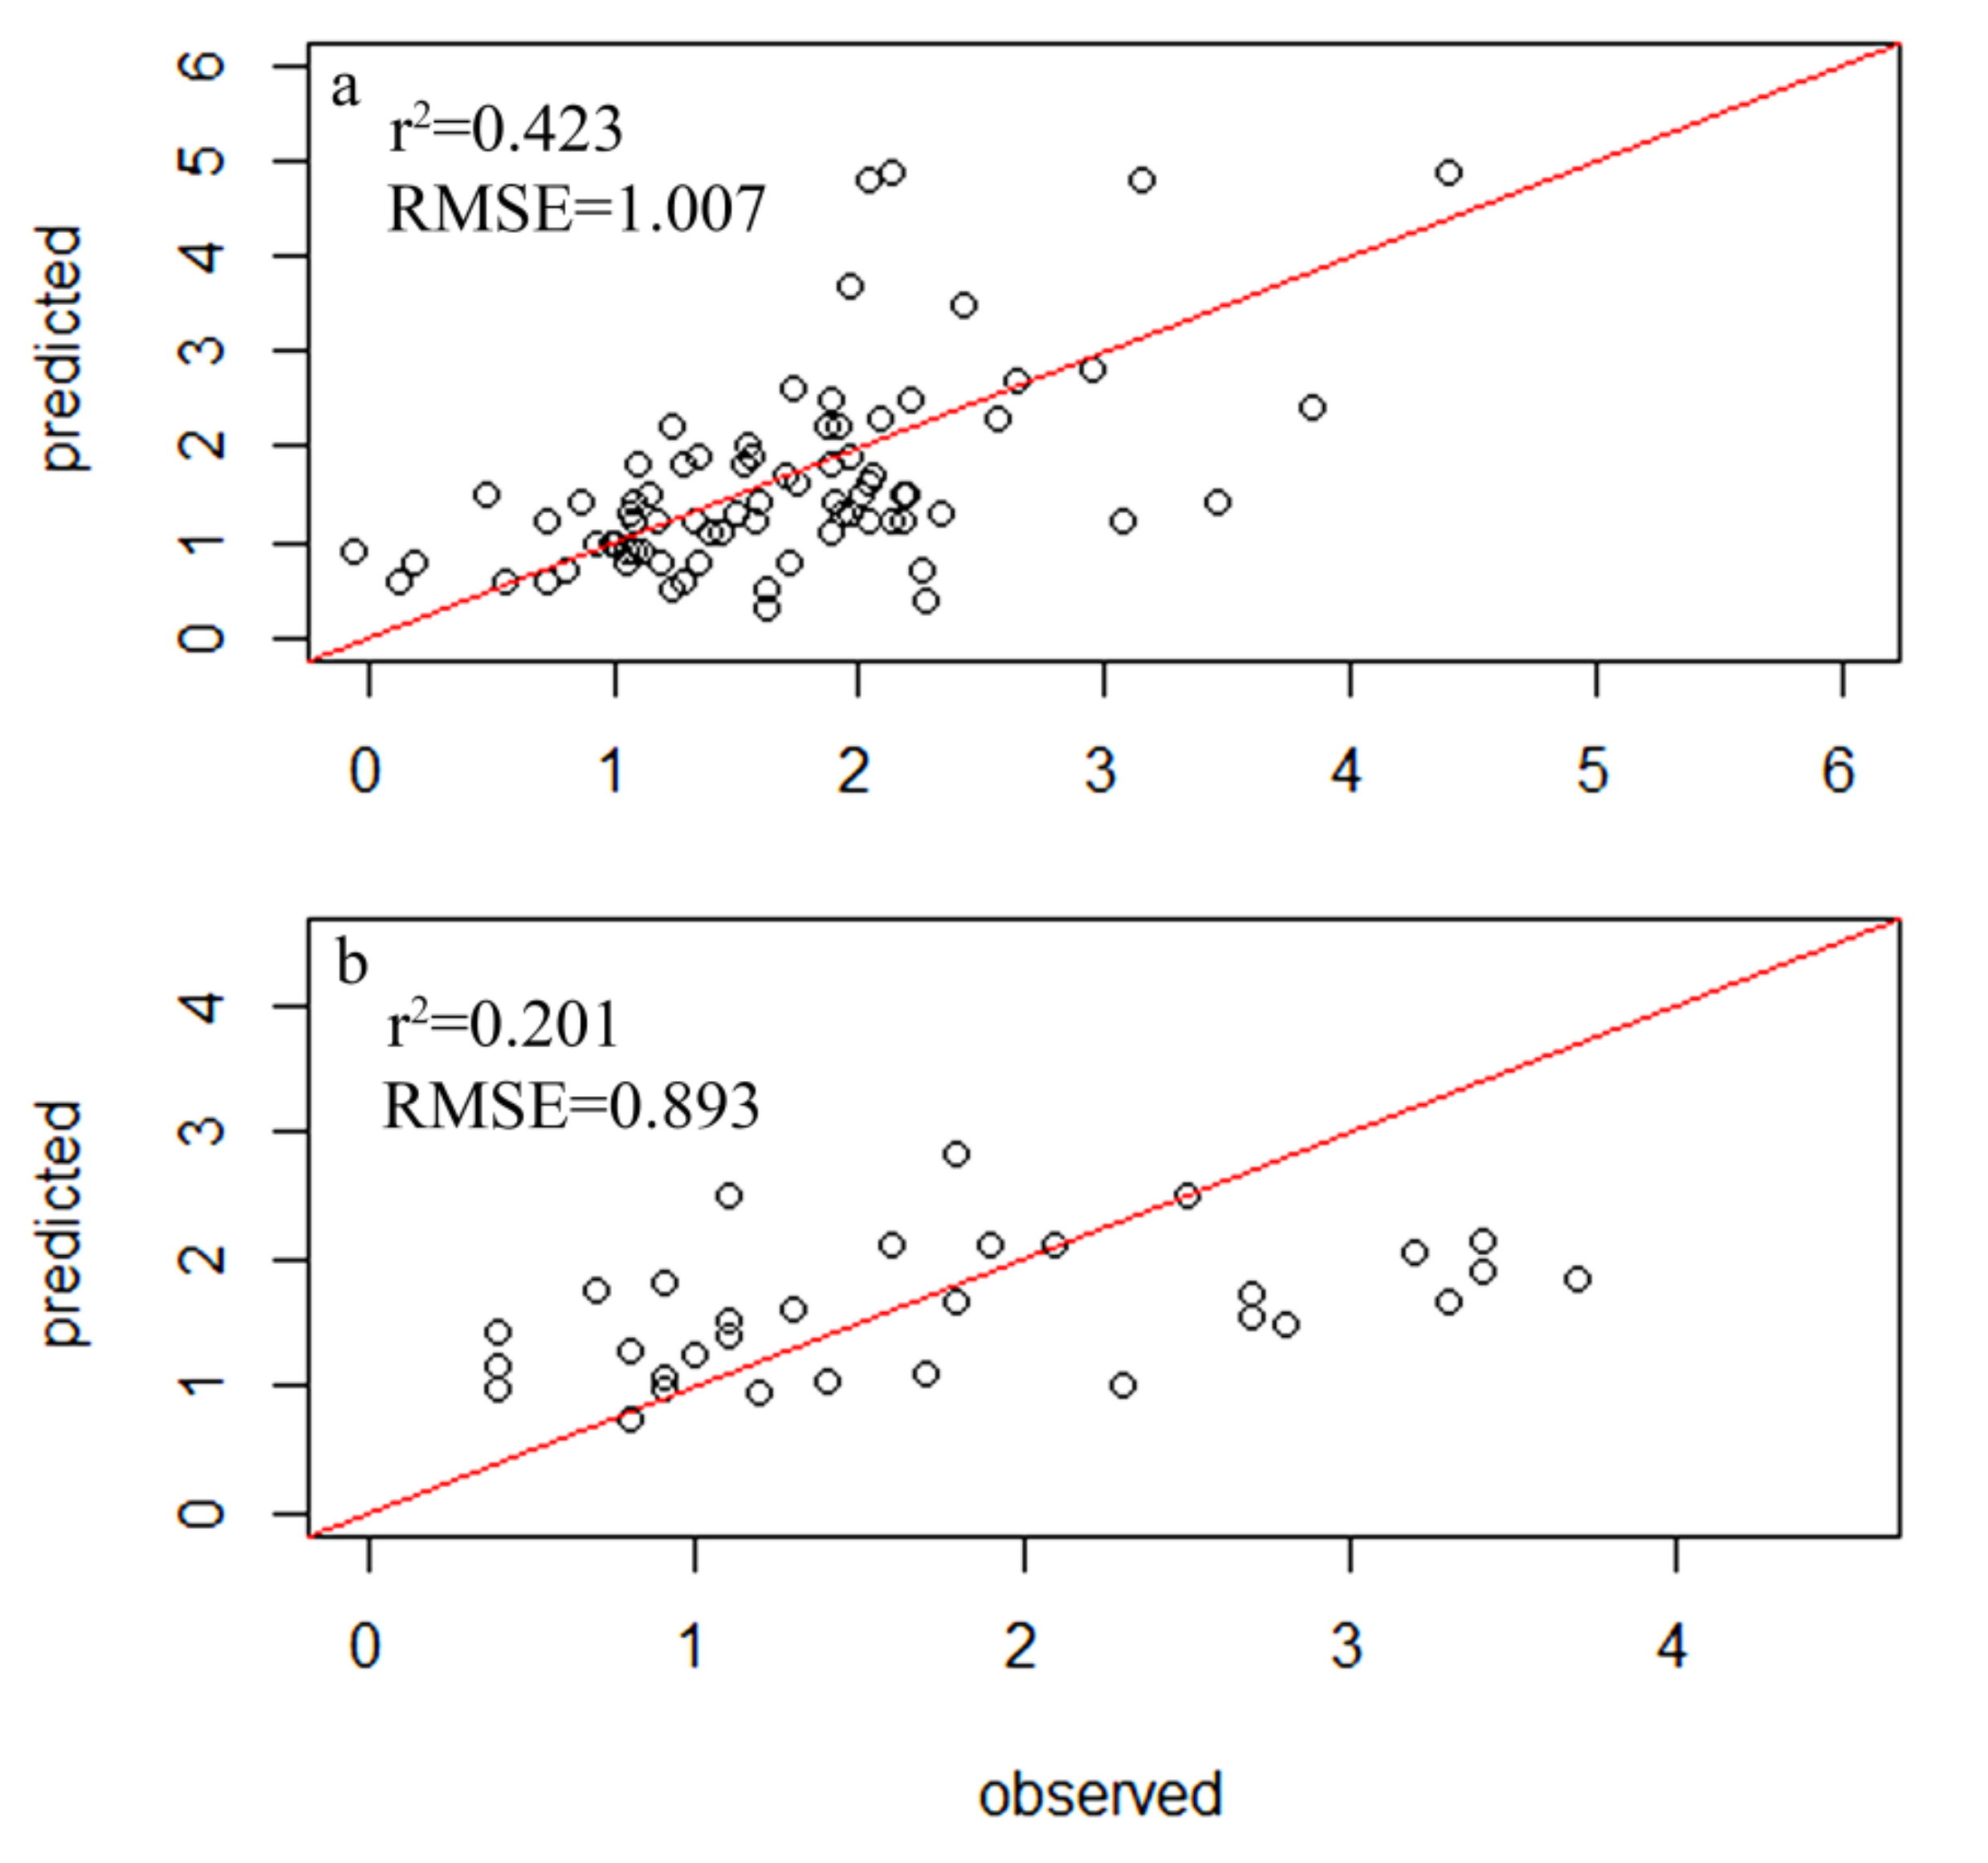
A total of 354 diatom species were identified in the samples from 116 sampling sites within 34 lakes, but only 78 species had relative abundances of greater than 1% and a frequency among sites of greater than four, which led to their inclusion in the subsequent analysis (Table S2). A total of 83 samples were randomly selected as the experimental group, while 33 diatom samples were used as the control group. The weighted averaging without tolerance descending region (WAtol) method was used to establish transfer function models for TP (Figure 2). This yielded an r2 value of 0.661 for the correlation between the inferred and measured values of TP and an RMSE of 0.064 mg/L. The correlation for the control group was r2 = 0.418 (RMSE = 0.096 mg/L). The WAtol method was also used to establish the transfer function models for TN, with an r2 of 0.423 for the correlation between the inferred and measured values of TN and an RMSE of 1.007 mg/L. The correlation of the control group was r2 = 0.201 (RMSE = 0.893 mg/L) (Figure 3). Lastly, the WAtol method was used to establish transfer function models for COD. This yielded an r2 value of 0.699 for the correlation between the inferred and measured values of the COD. The correlation for the control group was r2 = 0.4 (RMSE = 7.73 mg/L) (Figure 4). The TP, TN, and COD models were suitable for predicting the optima and tolerances of the species and confirming the indicator values of the species at different trophic levels.
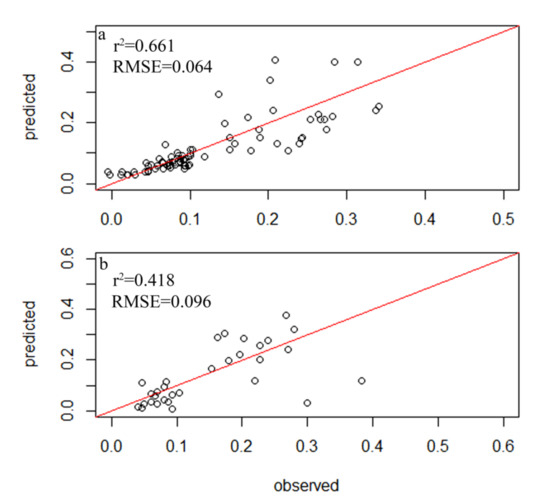
Figure 2.
Relationship between the observed and diatom-inferred TP obtained via weighted averaging without tolerance down-weighting regression: (a) test group; (b) control group.
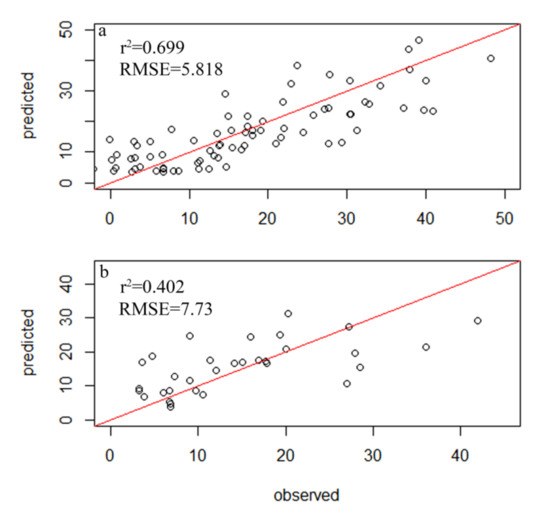
Figure 3.
Relationship between the observed and diatom-inferred COD obtained via weighted averaging without tolerance down-weighting regression: (a) test group; (b) control group.
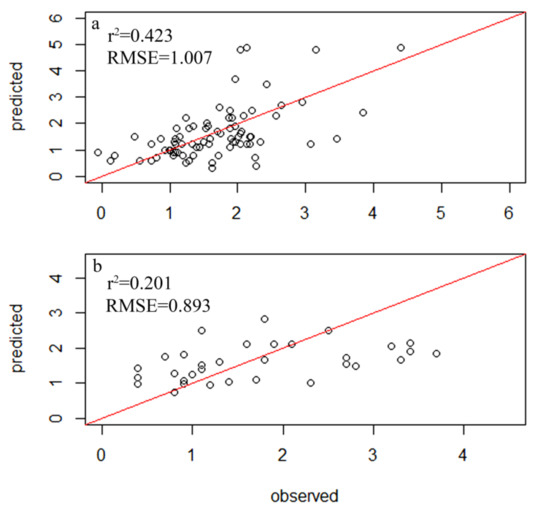
Figure 4.
Relationship between the observed and diatom-inferred TN obtained via weighted averaging without tolerance down-weighting regression: (a) test group; (b) control group.
3.2. Environmental Optima and Tolerances of the Diatoms
The optimal values and tolerances of the primary diatom species regarding TP, COD, and TN are presented in Table S3 in the Supplementary Materials. The 10 species of periphytic diatoms that had TP optima of greater than 0.22 mg/L were primarily within the genera Nitzschia and Fragilaria. Fragilaria vaucheriae exhibited the highest optimal (0.46 mg/L) and tolerance (0.48 mg/L) values, indicating that the TP tolerance range of this species was highest. In contrast, Gomphonema exilissimum (optima: 0.05 mg/L; tolerance: 0.01 mg/L), Pinnularia obscura (optima: 0.08 mg/L; tolerance: 0.01 mg/L), Luticola goeppertiana (optima: 0.08 mg/L; tolerance: 0.01 mg/L), and Luticola pitranenis (optima: 0.09 mg/L; tolerance: 0.01 mg/L) exhibited the lowest tolerances to TP. Thus, these species were the most sensitive to changes in TP according to their narrow tolerance ranges.
Sixteen species of periphytic diatoms exhibited COD optima of greater than 20 mg/L, with Fragilaria vaucheriae exhibiting the highest optimal (29.1 mg/L) and tolerance (14.08 mg/L) values. Some of the species exhibited lower optimal values and higher tolerance values, including Navicula erifuga (optima: 12.19 mg/L; tolerance: 12.9 mg/L), Melosira varians (optima: 11.67 mg/L; tolerance: 12.11 mg/L), and Aulacoseira granulata var. angustisima (optima: 10.67 mg/L; tolerance: 10.18 mg/L). Thus, these species exhibited a wide range of COD adaptations. In addition, several species exhibited lower optimal and tolerance values, including Gomphonema insularum (optima: 7.17 mg/L; tolerance: 1.64 mg/L), Achnanthidium pyrenaicum (optima: 6.6 mg/L; tolerance: 1.74 mg/L), and Achnanthidium exile (optima: 6.36 mg/L; tolerance: 1.74 mg/L). Consequently, these species were the most sensitive to changes in the COD.
A total of 10 periphytic diatoms species exhibited TN optima of greater than 2.88 mg/L. Navicula catalanogermanica exhibited the highest optima value (2.88 mg/L), and Gomphonema exilissimum exhibited the lowest tolerance value (0.69 mg/L). The TN tolerances exhibited trends similar to the TP and COD, whereby the species with lower tolerance values also had lower optimal values. Achnanthidium eutrophilum (optima: 1.17 mg/L; tolerance: 0.28 mg/L), Encyonema lange-bertalotii (optima: 1.14 mg/L; tolerance: 0.29 mg/L), and Gomphonema acidoclinatum (optima: 0.78 mg/L; tolerance: 0.33 mg/L) exemplified these trends. Thus, these species were the most sensitive to changes in the TN.
3.3. Development of the Comprehensive Diatom Index
On the basis of the optimal and tolerance values for TP, COD, and TN, the trophic status indicator (v) and sensitive indicator (s) values for the diatoms were determined. The trophic status indicator values (v) for TP, COD, and TN were slightly modified according to national standards and were divided into five grades (1–5). Among these, the TP concentration ranges corresponding to each grade of the trophic status indicator value (v) were as follows: grade 1 (<0.06 mg/L); grade 2 (0.06–0.09 mg/L); grade 3 (0.09–0.12 mg/L); grade 4 (0.12–0.22 mg/L); grade 5 (>0.22 mg/L). The trophic status indicator values (v) based on the TN ranges were as follows: grade 1 (<1.2 mg/L); grade 2 (1.2–1.5 mg/L); grade 3 (1.5–1.8 mg/L); grade 4 (1.8–2 mg/L); grade 5 (>2 mg/L). The trophic status indicator values (v) based on the COD ranges were as follows: grade 1 (<7.5 mg/L); grade 2 (7.5–12 mg/L); grade 3 (12–15 mg/L); grade 4 (15–20 mg/L); grade 5 (>20 mg/L).
According to the tolerances of the diatoms toward TP, the sensitivity values were divided into four grades: grade 1 (0.012–0.05 mg/L); grade 2 (0.05–0.1 mg/L); grade 3 (0.1–0.2 mg/L); grade 4 (0.2–0.479 mg/L). The four grades for the tolerance sensitivity values of the diatoms to COD were as follows: grade 1 (1.64–6 mg/L); grade 2 (6–8 mg/L); grade 3 (8–12 mg/L); grade 4 (12–14.08 mg/L). The four grades for the tolerance sensitivity values of the diatoms to TN were as follows: grade 1 (0.28–0.71 mg/L); grade 2 (0.71–1 mg/L); grade 3 (1–1.5 mg/L); grade 4 (1.5–2.87 mg/L). The comprehensive eutrophication status of the diatoms based on TP, COD, and TN was subsequently determined as a function of the above three indicators. In particular, the indicator value (v) and sensitivity indicator value (s) of the diatom index were divided into three categories, wherein one-third of each index was assigned to the three environmental indicators. The indicator (v) and sensitivity (s) values for each diatom index are listed in Table 1.

Table 1.
List of TP, TN, COD, and comprehensive indicators (indicator (v) and sensitivity (s) values) of the periphytic diatoms.
Then, the comprehensive diatom index (CDI) for evaluating the trophic degree of lake waters was then established as a function of the comprehensive indices of TP, COD, and TN according to the equation described by Zelinka and Marvan [17], as shown in Equations (5) and (6). The range of CDI values was from 0 (oligotrophic) to 100 (ultra-eutrophication) (Table 2).

Table 2.
Class boundaries and trophic status of the lake according to the CDI.
3.4. Application of the Comprehensive Diatom Index
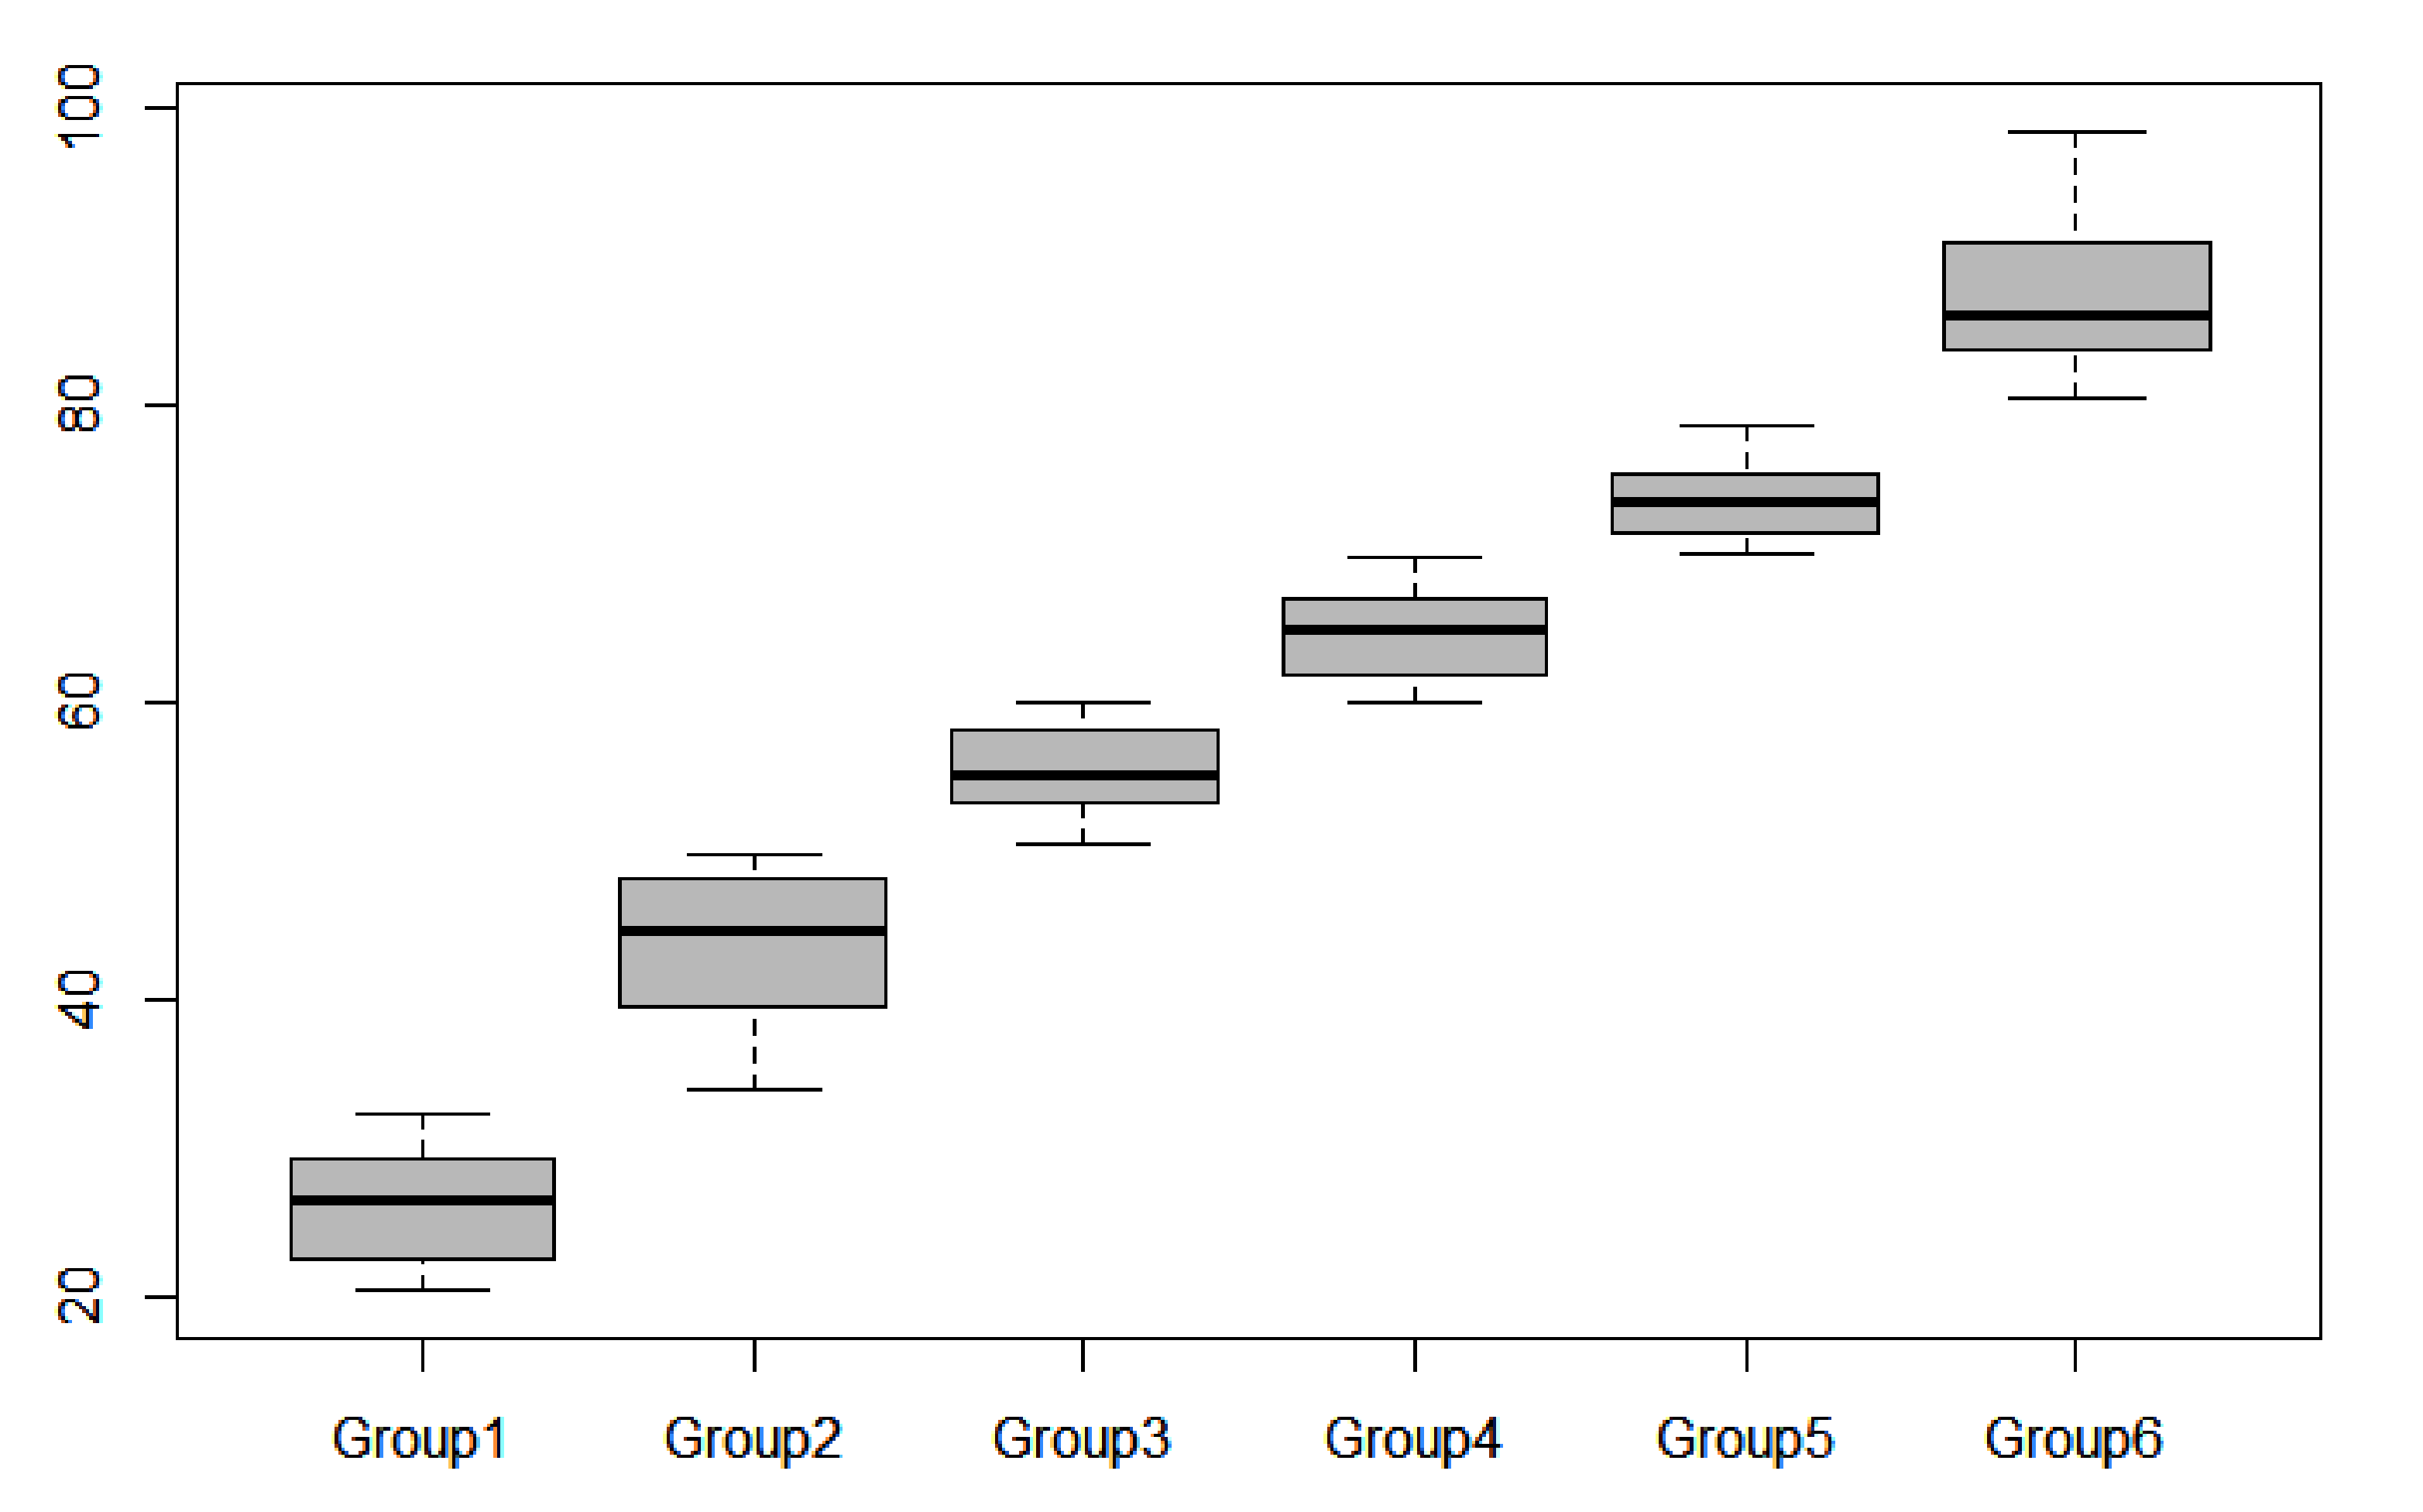
According to the CDI, the water eutrophication statuses of eight sites was oligotrophic; 17 sites were in a mesotrophic state, 23 were in a light eutrophication state, 30 were in a moderate eutrophication state, 22 were in a heavy eutrophication state, and 14 were in an ultra-eutrophication state (Figure 5).
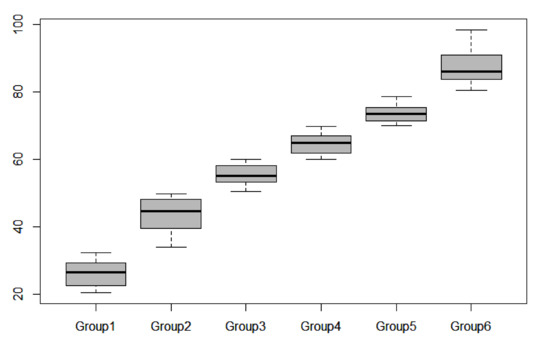
Figure 5.
Distribution of CDI values along the water quality gradient (group 1: oligotrophic; group 2: mesotrophic; group 3: light eutrophication; group 4: moderate eutrophication; group 5: heavy eutrophication; group 6: ultra-eutrophication).
The CDI was more highly correlated with the conductivity, pH, TP, TN, COD, and TDS compared to the other diatom indices (Table 3).

Table 3.
Spearman correlations between the diatom indices and some physical–chemical properties (n = 116).
The CDIs of the test group were more highly correlated with the COD, TP, Cond, pH, TN, and TDS; the CDIs of the control group were more highly correlated with the TP, Cond, COD, and TDS (Table 4).

Table 4.
Pearson’s correlation coefficients between the CDI index and environmental variables (test group: 83 samples; control group: 33 samples).
4. Discussion
4.1. A Predictive Model of Diatom Associations in the Environment
Lake eutrophication is one of the most pressing global issues. Human activities have played an important role in the progression of lake eutrophication; consequently, researchers have invested significant effort in monitoring and controlling lake eutrophication. In this study, a diatom index was constructed on the basis of the relationships between the diatoms and environmental factors to evaluate the trophic status of the lakes in the lower reaches of the Yangtze River. Three environmental factors (TP, COD, and TN) were evaluated in relation to diatom assemblages and the transfer function models between the diatom communities, and the three environmental indicators were established using weighted average regression modeling. Similar function models have mostly been used to evaluate the effects of TP, pH, salinity, or conductivity, but few functional conversion models have evaluated relationships between diatoms and TN or COD. Transfer function models between diatom assemblages and pH, salinity, or conductivity have primarily been based on sediment diatoms and have been used to reconstruct the paleoenvironmental conditions of lakes or rivers [8,49,50,51,52,53,54]. Nevertheless, several transfer function models of diatoms have been developed using TP. In this study, the transfer function model of the diatoms in relation to TP yielded an r2 = 0.661 and an RMSE = 0.064 mg/L, with the r2 being slightly lower (and the RMSE far lower) than the transfer function models of Bennion (r2 = 0.79, RMSE = 0.16) [55] and Stenger Kovács et al. (r2 = 0.96, RMSE = 0.17 mg/L) [24]. In addition, Ponader et al. constructed a transfer function model for diatoms in relation to TP (r2 = 0.72, RMSE = 0.23, log10 μg/L) and TN (r2 = 0.58, RMSE = 0.23, log10 μg/L) for streams in New Jersey, USA [56]. The r2 values of the models for diatoms in relation to TP developed in the latter study and this study are similar, but the RMSE of the model developed in this study is much lower. Furthermore, the r2 of the model of the diatoms in relation to TN developed in this study is lower; however, the range of observed TN values in this study (0.69–2.88 mg/L) is smaller than that in the study conducted by Ponader et al. (0.36–4.41 mg/L), which may be one reason why the model developed in this study is relatively weak. In particular, Ponader et al. suggested that the ranges of physical and chemical factors evaluated in a study are among the most important factors affecting models [56].
The weighted average method was used to determine the optimal and tolerance values of 78 species of diatoms to TP, TN, and COD in lakes in the lower reaches of the Yangtze River. Thirty-two diatom species were not identified in this study compared with the investigation conducted by Van Dam et al. [57], which may be related to the geological, climatic, and hydrological characteristics of the study area. Van Dam et al. suggested that Pinnularia diatoms primarily occur in oligotrophic water, but Pinnularia obscura (Krasske) was identified as an indicator species of eutrophic water in this study. Furthermore, other studies have suggested that Cymbella are more abundant in oligotrophic water [57,58], but Cymbella affinis (Kützing) and C. tumida ((Brebisson) Van Heurck) were identified as indicators of oligotrophic water in this study, and C. turgidula was identified as an indicator of eutrophic water. Several studies have suggested that Fragilaria and Gomphonema diatoms are broadly distributed ecological indicators [57], with great differences in the ecological characteristics of the species within the genus, which is consistent with the results of this study. Specifically, Fragilaria crotonensis (Kitton), F. tenera (Smith) Lange-Bertalot, Gomphonema exilissimum (Grunow) Lange-Bertalot, G. insularum (Kociolek, Woodward & Graeff), and G. turris (Ehrenberg) primarily occurred in the lakes with a low trophic state, while F. nevadensis (Linare), F. vaucheriae (Kützing) Petersen, G. parvulum (Kützing) Kützing, and G. gracile (Ehrenberg) primarily occurred in eutrophic lakes. Achnanthidium and Encyonema diatoms were found to mainly occur in oligo-mesotrophic to mesotrophic lakes [59,60,61,62], and the results of this study confirm these observations. Moreover, Nitzschia elegantula (Grunow), N. subcohaerens var. scotica (Grunow) Van Heurck, and N. perminuta (Grunow) Peragallo were identified as indicators of water bodies with a low eutrophication state.
4.2. Comparison of Different Diatom Indices
The CDI was developed in this study to assess the eutrophic states of lakes in the lower reaches of the Yangtze River. The CDI ranges from 0 to 100 and is divided into five eutrophication grades. According to the CDI, the trophic statuses of 8, 17, 23, 30, 22, and 14 sample sites were oligotrophic, mesotrophic, light eutrophication, moderate eutrophication, heavy eutrophication, and ultra-eutrophication. Thus, the CDI is representative of the trophic status of the lakes in the lower reaches of the Yangtze River. In this study, most of the heavy or ultra-eutrophication status sampling sites had high TP, TN, and COD concentrations, and the oligotrophic status lakes had lower TP, TN, and COD concentrations. These results are highly consistent with the comprehensive trophic status index based on physical and chemical factors. To further evaluate the accuracy of the CDI, it was compared with several other widely used diatom indices. The Trophic Diatom Index of Lakes (TDIL) was developed on the basis of relationships between diatoms and TP and is suitable for evaluating the trophic status of shallow lakes [24]. The index involves 127 diatom species, including 48 that were absent in the CDI. These two indices similarly assigned comprehensive nutritional status indicator (v) and sensitivity indicator (s) values for each diatom. However, the TDIL is not suitable for assessing the trophic status of the lakes in the lower reaches of the Yangtze River. The biological diatom index was established as a function of pH, conductivity, dissolved oxygen, biological oxygen demand, ammonium, orthophosphate, and nitrate levels to evaluate the water quality status of rivers in France [63,64]. This index includes 838 diatoms, 19 of which were absent in the CDI. In addition, the Pampean Diatom Index (PDI) was developed on the basis of 210 diatoms and by integrating the organic pollution and eutrophication statuses of water bodies to evaluate the status of rivers and streams [22], but 65 species in this index were absent from the CDI, representing more than 80% of the total species. Differences were also observed in the values for the same two indices. The PDI was developed to evaluate the status of lakes in the lower reaches of the Yangtze River. However, the results were not ideal or suitable for this area. In addition, the Trophic Diatom Index was established as a function of the relationships between TP and 70 diatom species, and it has been used to evaluate the eutrophication status of rivers [20]. However, 60 species from this index were not present in the CDI, and the evaluation methods of the two also differ. The Specific Pollution Sensitivity Index is the most widely used and is also based on the relationships between diatoms and the TP [65]. The index incorporates 550 species and is most appropriate for evaluating the water quality of rivers. However, 58 species in this index were absent in the CDI, accounting for more than 50% of the total number of species.
In addition to the above discrepancies, differences were observed in the numbers of diatoms and the assigned indicator values between the CDI and the other diatom indices. The reasons underlying these differences may arise from the specific characteristics of the study area, including water morphology, geographic environment, and/or from the number of samples used in each study. Each index should be considered according to the specific characteristics of the particular study area to ensure that the diatom indicator values are reasonably calibrated and accurate. The Generic Diatom Index (GDI) was developed as a function of the relationships between diatoms and the TP at the genus level. It contains 44 genera and has been used to evaluate river water quality [66]. The largest advantage of the GDI is its easy application and the low necessity for identification by researchers, although the latter is also a disadvantage. Single diatom species can indicate the trophic status of water bodies. Nevertheless, if the indicator values of diatoms from the same genus are determined according to similar standards, the accuracy of the assessments can be affected. For example, Nitzschia elegantula (Grunow) and N. palea (Kützing) Smith) are both members of the Nitzschia genus, but N. elegantula is an indicator of water bodies with low nutrient levels while N. palea is an indicator of water bodies with high trophic levels. Likewise, Cymbella affinis (Kützing) and C. turgidula (Grunow) belong to the genus Cymbella, but C. affinis is an indicator of water bodies with low trophic levels, while C. turgidula is an indicator of water bodies exhibiting eutrophication.
Overall, the various aforementioned diatom indices are based on relationships between diatoms and river/lake water environmental indicators, as well as the unique environmental conditions of the study areas, including the climate, altitude, human activities, temperature, the composition of the diatom community structure, and the response of diatom communities to regional environments [4,30,67]. Consequently, researchers have used the relationships between diatoms and environmental factors to establish diatom indices for monitoring the water environment. Numerous diatom indices have been established for globally distributed regions that are based on specific diatom species and their sensitivity to environmental factors. Nevertheless, the particular characteristics of each index differ. Indeed, the specific characteristics of the water bodies in each research area have guided the revision of each index; thus, the environmental indicator values and the tolerance values for each diatom are tuned to environmental changes to make each index suitable for use. In this study, we determined the indicator and tolerance values for diatoms in lake environments to establish a new diatom index for evaluating the trophic levels of the lakes in the lower reaches of the Yangtze River. In future studies, the CDI will be modified to expand the application scope of this index to encompass characteristics of other water types, including rivers and streams, in addition to improving its applicability across regions.
5. Conclusions
The periphytic diatoms in the lakes in the lower reaches of the Yangtze River are diverse and are good indicators of the trophic status of these water bodies. Here, in this study, we analyzed the correlations between the compositions of the periphytic diatoms and the environmental factors to develop the transfer function models of TP, TN, and COD, as well as to establish a new CDI based on the TP, TN, and COD optima and the tolerances of 78 periphytic diatoms toward these parameters. Correlational analysis indicated revealed the CDI is more highly correlated with Cond, pH, TP, TN, COD, and TDS than the other diatom indices. In addition, the CDI is more highly correlated with Cond, TP, TN, and COD for the test group and control group. Thus, the CDI is a useful metric for assessing the water trophic status of the lakes in the lower reaches of the Yangtze River. In addition, the CDI provides a theoretical framework for improving China’s environmental monitoring and assessment in China by providing a basis for similar research in other regions.
Supplementary Materials
The following are available online at https://www.mdpi.com/article/10.3390/w13243570/s1: Table S1. Environmental variables in the lakes of the lower reaches of the Yangtze River; Table S2. Number of occurrences (N) and maximum relative abundances (MARs) of the periphytic diatoms; Table S3. TP, COD, and TN optima and tolerance values of the periphytic diatoms; Figure S1. PCA ordination plot of all of the environmental variables.
Author Contributions
Conceptualization, Q.W. and P.Y.; methodology, P.Y. and Q.W.; software, P.Y.; formal analysis, P.Y.; investigation, P.Y., Y.B., Q.Y., Y.C., W.P. and Q.W.; writing—original draft preparation, P.Y.; writing—review and editing, Q.W., Y.B. and Q.Y.; supervision, Q.W.; project administration, Q.W. and Y.B.; funding acquisition, Q.W. All authors read and agreed to the published version of the manuscript.
Funding
This research was funded by the Biodiversity Survey and Assessment Project of the Ministry of Ecology and Environment, China (No. 2019HJ2096001006); Natural Science Foundation of Shanghai (21ZR1447300); National Natural Science Foundation of China (No. 32100165).
Institutional Review Board Statement
Not applicable.
Informed Consent Statement
Not applicable.
Data Availability Statement
No data are reported in this study.
Acknowledgments
We would like to thank Yingyu Miao, Lixuan Zhang, and Yidao Zhou of Shanghai Normal University for their help in the field and with the sample preparation.
Conflicts of Interest
The authors declare no conflict of interest.
References
- Szczepocka, E.; Zelazna-Wieczorek, J. Diatom biomonitoring-scientific foundations, commonly discussed issues and frequently made errors. Oceanol. Hydrobiol. Stud 2019, 47, 313–325. [Google Scholar] [CrossRef]
- Tan, X.; Sheldon, F.; Bunn, S.E.; Zhang, Q.F. Using diatom indices for water quality assessment in a subtropical river, China. Environ. Sci. Pollut. Res 2013, 20, 4164–4175. [Google Scholar] [CrossRef] [PubMed] [Green Version]
- Potapova, M.; Charles, D.F. Distribution of benthic diatoms in U.S. rivers in relation to conductivity and ionic composition. Freshw. Biol 2003, 48, 1311–1328. [Google Scholar] [CrossRef] [Green Version]
- Potapova, M.; Charles, D.F. Diatom metrics for monitoring eutrophication in rivers of the United States. Ecol. Indic 2007, 7, 48–70. [Google Scholar] [CrossRef]
- Lobo, E.A.; Schuch, M.; Heinrich, C.G.; Da Costa, A.B.; Düpont, A.; Wetzel, C.E.; Ector, L. Development of the Trophic Water Quality Index (TWQI) for subtropical temperate Brazilian lotic systems. Env. Monit Assess 2015, 187, 354. [Google Scholar] [CrossRef]
- Vilmi, A.; Karjalainen, M.S.; Landeiro, V.L.; Heino, J. Freshwater diatom as environment indicators: Evaluating the effects of eutrophication using species morphology and biological indices. Environ. Monit. Assess. 2015, 187, 243. [Google Scholar] [CrossRef] [PubMed]
- Chessman, B.C.; Bate, N.; Gell, P.A.; Newall, P. A diatom species index for bioassessment of Australian rivers. Mar. Freshw. Res. 2007, 58, 542–557. [Google Scholar] [CrossRef]
- Kireta, A.R.; Reavie, E.D.; Sgro, G.V.; Angradi, T.R.; Bolgrien, D.W.; Hill, B.H.; Jicha, T.M. Planktonic and perphytic diatoms as indicators of stress on great rivers of the United States: Testing water quality and disturbance models. Ecol. Indic. 2012, 13, 222–231. [Google Scholar] [CrossRef]
- O’Driscoll, C.; de Eyto, E.; Rodgers, M.; O’Connor, M.; Asam, Z.; Xiao, L. Diatom assemblage and their associated environmental factors in upland peat forest rivers. Ecol. Indic. 2012, 18, 443–451. [Google Scholar] [CrossRef]
- Chen, X.; Zhou, W.Q.; Pickett, S.T.A.; Li, W.F.; Han, L.J. Diatoms are better indicators of urban stream conditions: A case study in Beijing, China. Ecol. Indic. 2016, 60, 265–274. [Google Scholar] [CrossRef]
- Gray, J.B.; Vis, M.L. Reference diatom assembalage response to restoration of an acid mine drainage stream. Ecol. Indic. 2013, 29, 234–245. [Google Scholar] [CrossRef]
- Stevenson, R.J.; Pan, Y.D. Assessing ecological conditions in rivers and streams with diatoms. In The Diatoms: Applications to the Environment and Earth Sciences; Stoermer, E.F., Smol, J.P., Eds.; Cambridge University Press: Cambridge, UK, 1999. [Google Scholar]
- Stevenson, R.J.; Pan, Y.D.; Manoylov, K.M.; Parker, C.A.; Larsen, D.P.; Herlihy, A.T. Development of diatom indicators of ecological conditions for streams of the wetern US. J. N. Am. Benthol. Soc. 2008, 27, 1000–1016. [Google Scholar] [CrossRef]
- Delgado, C.; Pardo, I.; Garcia, L. A multimetric diatom index to assess the ecological status of coastal Galicain rivers (NW Spain). Hydrobiologia 2010, 644, 371–384. [Google Scholar] [CrossRef]
- Rusanov, A.G.; Stanislavskya, E.V. River pollution in Ladoga basin: Estimation based on diatom index. Water Res. 2011, 38, 95–106. [Google Scholar] [CrossRef]
- Adams, G.L.; Pichler, D.E.; Cox, E.J.; O’gorman, E.J.; Seeney, A.; Woodward, G.; Reuman, D.G. Diatoms can be an important exception to temperature-size rules at species and community levels of organization. Glob. Chang. Biol 2013, 19, 3540–3552. [Google Scholar] [CrossRef] [PubMed] [Green Version]
- Zelinka, M.; Marvan, P. Zur Präzierung der biologischen Klassifikation der Reinheit fliessender Gewässer. Arch. Für Hydrobiol. 1961, 57, 389–407. [Google Scholar]
- Descy, J.P. A new approach to water quality estimation using diatoms. Nova Hedwig. 1979, 64, 305–323. [Google Scholar]
- Delgado, C.; Pardo, I.; García, L. Diatom communities as indicators of ecological status in Mediterranean temporary streams (Balearic Islands, Spain). Ecol. Indic. 2012, 15, 131–139. [Google Scholar] [CrossRef]
- Kelly, M.G.; Whitton, B.A. The Trophic Diatom Index: A new index for monitoring eutrophication in rivers. J. Appl. Phycol. 1995, 7, 433–444. [Google Scholar] [CrossRef]
- Chessman, B.; Growns, I.; Currey, J.; Plunkett-Cole, N. Predicting diatom communities at the genus level for the rapid biological assessment of rivers. Freshw. Biol. 1999, 41, 317–331. [Google Scholar] [CrossRef]
- Gómez, N.; Licursi, M. The Pampean Diatom Index (IDP) for assessment of rivers and streams in Argentina. Aquat. Ecol. 2001, 35, 173–181. [Google Scholar] [CrossRef]
- Eloranta, P.; Soininen, J. Ecological status of some Finnish rivers evaluated using benthic diatom communities. J. Appl. Phycol. 2002, 14, 1–7. [Google Scholar] [CrossRef]
- Stenger-Kovács, C.; Buczkó, K.; Hajnal, É.; Padisák, J. Epiphytic, littoral diatoms as bioindicators of shallow lake trophic status: Trophic Diatom Index for Lakes (TDIL) developed in Hungary. Hydrobiologia 2007, 589, 141–154. [Google Scholar] [CrossRef]
- Picińska-Fałtynowicz, J.; Błachuta, J.; Kotowicz, J.; Mazurek, M.; Rawa, W. Wybór Typów Jednolitych Czesci Wód Recznych i Jeziornych do Oceny Stanu Ekologicznego na Podstawie Fitobentosu wraz z Rekomendacjq Metodyki Poboru i Analizy Prób; Główny Inspektorat Ochrony Środowiska: Wrocław, Poland, 2006. [Google Scholar]
- Lecointe, C.; Coste, M.; Prygiel, J. “Omnidia”: A software for taxonomy, calculation of diatom indices and inventories management. Hydrobiologia 1993, 269/270, 509–513. [Google Scholar] [CrossRef]
- Carayon, D.; Tison-Rosebery, J.; Delmas, F. Defining a new autoecological trait matrix for French stream benthic. Ecol. Indic. 2019, 103, 650–658. [Google Scholar] [CrossRef]
- Potapova, M.; Coles, J.E.; Giddings, E.M.P.; Zappia, H. A comparsion of the influences of urbanization in contrasting environmental settings on stream benthic algal assemblages. Am. Fish. Soc. Symp. 2005, 41, 333–359. [Google Scholar]
- Lavoie, I.; Campeau, S.; Grenier, M.; Dillon, P.J. A diatom-based index for the biological assessment of eastern Canadian rivers: An application of correspondence analysis (CA). Can. J. Fish. Aquat. Sci. 2006, 63, 1793–1811. [Google Scholar] [CrossRef]
- Oeding, S.; Taffs, K.H. Developing a regional diatom index for assessment and monitoring of freshwater streams in sub-tropical Australia. Ecol. Indic. 2017, 80, 135–146. [Google Scholar] [CrossRef]
- Kelly, M.G.; Whitton, B.A. Biological monitoring of eutrophication in rivers. Hydrobiologia 1998, 384, 55–67. [Google Scholar] [CrossRef]
- Bere, T.; Tundisi, J.G. Applicability of borrowed diatom-based water quality assessment indices in streams around São Carlos-SP, Brazil. Hydrobiologia 2011, 673, 179–192. [Google Scholar] [CrossRef] [Green Version]
- Li, G.C.; Liu, L.S.; Wang, X.; Li, L. Application of diatom in river health assessment: A review. Chin. J. Appl. Ecol. 2012, 23, 2617–2624. [Google Scholar]
- Wu, J.T. A generic index of diatom assemblages as bioindicator of pollution in the Keelung River of Taiwan. Hydrobiologia 1999, 397, 79–87. [Google Scholar] [CrossRef]
- Deng, D.Y.; Lu, W.; Tao, M. Recent advances and indicative role of diatoms in water environment monitoring. Environ. Sci. Technol. 2009, 32, 222–225. [Google Scholar]
- Feio, M.J.; Hughes, R.M.; Callisto, M.; Nichols, S.J.; Odume, O.N.; Quintella, B.R.; Kuemmerlen, M.; Aguiar, F.C.; Almeida, S.F.P.; Alonso-Eguíalis, P.; et al. The biological assessment and rehabilitation of the world’s rivers: An overview. Water 2021, 13, 371. [Google Scholar] [CrossRef] [PubMed]
- Wang, S.M.; Dou, H.S. Lakes in China; Science Press: Berlin, Germany, 1998. [Google Scholar]
- Dong, X.H.; Yang, X.D.; Chen, X.; Liu, Q.; Yao, M.; Wang, R.; Xu, M. Using sedimentary diatoms to identify reference conditions and historical variability in shallow lake ecosystems in the Yangtze floodplain. Mar. Freshw. Res. 2016, 67, 803. [Google Scholar] [CrossRef]
- Qin, B.Q. Appraoches to mechanisms and control of eutrophication of shallow lakes in the middle and lower reaches of the Yangze River. J. Lake Sci. 2002, 3, 193–202. [Google Scholar]
- Parr, J.F.; Taffs, K.H.; Lane, C.M. A microwave digestion technique for the extraction of fossil diatoms from coastal lake and swamp sediments. J. Paleolimnol. 2004, 31, 383–390. [Google Scholar] [CrossRef]
- Zhu, H.Z.; Chen, J.Y. Bacillariophyta of the Xizang (Tibet) Plateau; Science Press: Beijing, China, 2000. [Google Scholar]
- Krammer, K.; Lange-Bertalot, H. Die Süsswasserflora von Mitteleuropa 2: Bacillariophyceae. 1 Teil: Naviculaceae; Gustav Fischer-Verlag: Stuttgart, Germany, 1986. [Google Scholar]
- Krammer, K.; Lange-Bertalot, H. Die Süßwasserflora von Mitteleuropa, II: 2. Bacillariophyceae. Teil 2: Bacillariaceae, Epithemiaceae, Surirellaceae. 2te Auflage, mit einem neuen Anhang; Gustav Fischer Verlag: Stuttgart, Germany, 1997. [Google Scholar]
- Krammer, K.; Lange-Bertalot, H. Die Süsswasserflora von Mitteleuropa 2: Bacillariophyceae. 3 Teil: Centrales, Fragilariaceae, Eunotiaceae, 2nd ed.; Gustav Fischer Verlag: Stuttgart, Germany, 2000. [Google Scholar]
- Krammer, K.; Lange-Bertalot, H. Süsswasserflora von Mitteleuropa 2, Bacillariophyceae. Teil 4: Achnanthaceae. Kritische Ergänzungen zu Achnanthes s.l., Navicula s. str., Gomphonema; Spektrum Akademischer Verlag: Heidelberg, Germany, 2004. [Google Scholar]
- Lange-Bertalot, H.; Hofmann, G.; Werum, M.; Cantonati, M. Freshwater Benthic Diatoms of Central Europe: Over 800 Common Species Used in Ecological Assessment; Koeltz Botanical Books: Stuttgart, Germany, 2017. [Google Scholar]
- Chinese State Environment Protection Bureau (CSEPB). Water and Wastewater Monitoring Analysis Methods, 4th ed.; Chinese Environment Science Press: Beijing, China, 2002. [Google Scholar]
- Ter Braak, C.J.F.; van Dam, H. Inferring pH from diatoms: A comparison of old and new calibration methods. Hydrobiologia 1989, 178, 209–223. [Google Scholar] [CrossRef]
- Birks, H.J.B.; Line, J.M.; Juggins, S.; Stevenson, A.C.; Ter Braak, C.J.F. Diatoms and pH reconstruction. Philos. Trans. R. Soc. Lond. 1990, 327, 263–278. [Google Scholar]
- Snyder, J.A.; Wasylik, K.; Fritz, S.C.; Wright, J.H.E. Diatom-based conductivity reconstruction and palaeoclimatic interpretation of a 40-ka record from lake Zeribar, Iran. Holocene 2001, 11, 737–745. [Google Scholar] [CrossRef]
- Davies, S.J.; Metcalfe, S.E.; Caballero, M.E.; Juggins, S. Developing diatom-based transfer functions for Central Mexican lakes. Hydrobiologia 2002, 467, 199–213. [Google Scholar] [CrossRef]
- Ryves, D.B.; Mcgowan, S.; Anderson, N.J. Development and evaluation of a diatom-conductivity model from lakes in West Greenland. Freshw. Biol. 2002, 47, 995–1014. [Google Scholar] [CrossRef]
- Yang, X.; Kamenik, C.; Schmidt, R.; Wang, S. Diatom-based conductivity and water-level inference models from eastern Tibetan (Qinghai-Xizang) Plateau lakes. J. Paleolimnol. 2003, 30, 1–19. [Google Scholar] [CrossRef]
- Zhang, Y.L.; Huo, S.L.; Li, R.H.; Xi, B.D.; Li, H.; He, Z.S.; Pang, C.F. Diatom taxa and assemblages for establishing nutrient criteria of lakes with anthropogenic hydrologic alteration. Ecol. Indic. 2016, 67, 166–173. [Google Scholar] [CrossRef]
- Bennion, H. A diatom-phosphorous transfer function for shallow, eutrophic pond sin southeast England. Hydrobiologia 1994, 275/276, 391–410. [Google Scholar] [CrossRef]
- Ponader, K.C.; Charles, D.F.; Belton, T.J. Diatom-based TP and TN inference models and indices for monitoring nutrient enrichment of New Jersey streams. Ecol. Indic. 2007, 7, 79–93. [Google Scholar] [CrossRef]
- Dam, H.V.; Mertens, A.; Sinkeldam, J. A coded checklist and ecological indicator values of freshwater diatoms from The Netherlands. Aquat. Ecol. 1994, 28, 117–133. [Google Scholar] [CrossRef]
- Hustedt, F. Diatomeen aus den Pyrenäien. Bet. Dtsch. Hot. Ges. 1938, 56, 543–572. [Google Scholar]
- Charles, D.F.; Acker, F.W.; Hart, D.D.; Reimer, C.W.; Cotter, P.B. Large-scale regional variation in diatom-water chemistry relationship, rivers of the eastern United States. Hydrobiologia 2006, 561, 27–57. [Google Scholar] [CrossRef]
- Besse-Lototskaya, A.; Verdonschot, P.F.W.; Coste, M.; Van de Vijver, B. Evaluation of European diatom trophic indices. Ecol. Indic. 2011, 11, 456–467. [Google Scholar] [CrossRef]
- Blanco, S.; Cejudo-Figueiras, C.; Álvarez-Blanco, I.; Donk, E.V.; Gross, E.M.; Hansson, L.A.; Irvine, K.; Jeppesen, E.; Kairesalo, T.; Moss, B.; et al. Epiphytic Diatoms along Environmental Gradients in Western European Shallow Lakes. Clean Soil Air Water 2013, 42, 229–235. [Google Scholar] [CrossRef]
- Rimet, F.; Bouchez, A.; Tapolczai, K. Spatial heterogeneity of littoral benthic diatoms in a large lake: Monitoring implications. Hydrobiologia 2016, 771, 179–193. [Google Scholar] [CrossRef]
- Coste, M.; Boutry, S.; Rosebery, J.T.; Delmans, F. Improvements of the biological diatom index (BDI): Description and efficiency of the new version (BDI-2006). Ecol. Indic. 2009, 9, 621–650. [Google Scholar] [CrossRef]
- European Parliament. Directive 2000/60/EC of the European Parliament and of the Council Establishing a Framework for Community Action in the Field of Water Policy, O.J.L327; European Parliament: Brussels, Belgium, 2000. [Google Scholar]
- Prygiel, J.; Lévêque, L.; Iserentant, R. A new Practical Diatom Index for the assessment of water quality in monitoring networks. Rev. Des Sci. De L’eau J. Water Sci. 1996, 9, 97–113. [Google Scholar]
- Rumeau, A.; Coste, M. Introduction into the systematics of freshwater diatoms. For a useful generic diatomic index. Bull. Fr. De La Peche Et De La Piscic. 1988, 309, 1–69. [Google Scholar] [CrossRef] [Green Version]
- Kelly, M.G.; Cazzubon, A.; Coring, E.; Dell’Uomo, A.; Ector, L.; Goldsmith, B.; Guasch, H.; Hürlimann, J.; Jarlman, A.; Kawecka, B.; et al. Recommendations for the rountine sampling of diatoms for water quality assessments in Europe. J. Appl. Phycol. 1998, 10, 215–224. [Google Scholar] [CrossRef]
Publisher’s Note: MDPI stays neutral with regard to jurisdictional claims in published maps and institutional affiliations. |
© 2021 by the authors. Licensee MDPI, Basel, Switzerland. This article is an open access article distributed under the terms and conditions of the Creative Commons Attribution (CC BY) license (https://creativecommons.org/licenses/by/4.0/).

