Abstract
Service quality and efficiency of urban systems have been dramatically boosted by various high technologies for real-time monitoring and remote control, and have also gained privileged space in water distribution. Monitored hydraulic and quality parameters are crucial data for developing planning, operation and security analyses in water networks, which makes them increasingly reliable. However, devices for monitoring and remote control also increase the possibilities for failure and cyber-attacks in the systems, which can severely impair the system operation and, in extreme cases, collapse the service. This paper proposes an automatic two-step methodology for cyber-attack detection in water distribution systems. The first step is based on signal-processing theory, and applies a fast Independent Component Analysis (fastICA) algorithm to hydraulic time series (e.g., pressure, flow, and tank level), which separates them into independent components. These components are then processed by a statistical control algorithm for automatic detection of abrupt changes, from which attacks may be disclosed. The methodology is applied to the case study provided by the Battle of Attack Detection Algorithms (BATADAL) and the results are compared with seven other approaches, showing excellent results, which makes this methodology a reliable early-warning cyber-attack detection approach.
1. Introduction
In recent decades, urban areas all over the world have not stopped growing and becoming increasingly dense. Consequently, virtually all urban services are in dire need to become more efficient and accessible to all citizens. Water distribution systems (WDSs), which are obviously among the main urban components, have undergone many changes. In this paper, we focus on the connection between WDS physical and cyber layers, thus turning WDSs into cyber-physical systems. The physical layer of a WDS (pipes, valves, pumps, reservoirs, etc.) can be remotely controlled and monitored by the cyber layer, which allows the implementation of predictive control, and early-warning systems in case of anomalies. As a result, the efficiency of urban water systems is improved.
Cyber-physical systems may considerably improve the operation of water companies, but they will also increase the possibilities for system failure. This is chiefly because cyber layers can include gates that may be easily violated during various kinds of attacks (e.g., information access for damaging the entire water distribution process) [1]. Attackers can access programmable logic controllers and change pump and valve schedules, operational points, and/or corrupt data in SCADA systems. This could threaten the creation and expansion of smart cities that depend on the reliability of cyber systems [2].
Scenarios of cyber-physical attacks in water systems have already become a reality. According to the United States Department of Homeland Security, in 2015, 25 cyber-attacks were disclosed in various water systems [3]. In Israel, three attacks happened between 2019 and 2020. The first attack in 2019 managed to change the free chlorine level and, consequently, harmed the water quality of the system. In 2020 the attacks changed pumping operational points, bringing high pressure to the system and associated increasing leakage [4]. In their Systematic Review of the State of Cyber-Security in Water Systems, Tuptuk et al. [5] compile a set of cyber-physical attacks occurred between 2000 and 2020 that have been made public. Most of them were remotely performed and even a recent one used cryptocurrency mining for the attack. The examples of cyber-attacks in the USA and Israel show that despite a system may be highly protected, attackers manage to find their ways to enter the system and eventually produce chaos. Consequently, even virtually fully secure SCADA systems need additional mechanisms to try to close any access gate to the system and minimize the impact of any security breach.
With the aim of improving the reliability of cyber-physical systems, special attention has been given by researchers to the topic, as shown by the promotion of dedicated events. One milestone on cyber-physical system analysis applied to water systems was the International Workshop on Cyber-Physical Systems for Smart Water Networks, in 2015 [6]. The works in that conference mainly focused on data acquisition via SCADA system and the security of the system. Nevertheless, no cyber-physical failure detection methodologies were proposed. However, recently, the detection of malicious attacks in WDSs has become a problem highly faced by researchers and managers, and has been the subject of recommendations from various protection agencies (e.g., Environmental Protection Agency—EPA, from USA). The main objective of this kind of developments is the reduction of the system vulnerability, thus narrowing the potential damage to the physical layer.
Considering the importance of the problem, the Battle of the Attack Detection Algorithms (BATADAL) [7] was organized in a special session of the World Environmental and Water Resources Congress, in Sacramento, California on 21–25 May 2017. The challenge was proposed for comparing possible approaches in detection attacks. Several solutions, concisely described in the next section, were presented.
According to the above-mentioned systematic literature review [5], the vast majority of works in cyber-attack detection, including the ones presented in BATADAL, are based on machine learning, developing classifiers or auto-encoder algorithms. However, the authors of [5] pinpoint the need for targeting at other fields of study for building increased confidence on the algorithms. An alternative, exploited in other research fields, is the use of signal-detection models. These kinds of models handle a mixture of true signal and noisy data. When applied for cyber-attack detection, the main objective of a signal-detection model is to separate attack from normal data, which helps detect abnormal situations accurately and efficiently. One example of signal-processing data applied to detect anomalies in cyber-physical systems is the application of Independent Component Analysis (ICA) [8]. This algorithm separates original signals into components or sources by suitably demixing them. The demixing and consequent separation of signals can help highlight anomalies, thus easing their identification.
Moreover, for automatic identification, the application of statistical control processes such as cumulative sum (CUSUM) and abrupt change point detection (ACPD) have shown to be very useful tools.
Considering the substantial number of applications of ICA for anomaly detection problems in various research fields, and the simultaneous lack of applications in water distribution, this paper proposes a two-stage algorithm for cyber-attack detection in water distribution systems. In the first stage, hydraulic time series acquired by a SCADA system are processed by the ICA algorithm. The resulted signals, so-called sources, are highly affected by cyber-attacks, as shown in the results. This feature is used for automatic detection in the second stage, using an ACPD algorithm. The methodology is applied to the BATADAL case study, and the results are compared, under the same framework, including case study, objectives and metrics, with other approaches presented in the Battle. All seven attacks hidden on the test data sets used in the event are detected by this methodology, thus resulting in a reliable early-warning cyber-attack detection algorithm. Regarding the limitations of this approach, we must mention that some attack scenarios have been detected too late, which is a limitation, otherwise, typical of any detection evaluation methodology. However, overall, the methodology can be considered a novel non-machine-learning-based approach in the field of cyber-attack detection in WDSs.
2. Related Work
The recent literature presents several data analysis and computational modelling techniques aimed at developing early-warning systems for cyber-attack detection in water systems. For example, in [9] a classification algorithm is developed using Support Vector Machines for identifying cyber-attacks in water systems. The authors propose a simple one-class classification approach based on a truncated Mahalanobis distance. The algorithm is tested on a real dataset from a water distribution system in France. Hidden Markov chains are used in [10] for analyzing and detecting anomalies in the SCADA system of a water supply system. Normal behavior was first modelled and then modified with generated abnormal data to simulate potential attack detection. Not only water distribution systems, but also water treatment plants have been used for investigating cyber-attacks. Attacks in Programmable Logic Controllers (PLC) are designed by [11] for better comprehension of the impacts in the produced water.
In BATADAL, seven solutions, coming from research groups from all over the world, were presented, which were ranked based on time-detection and classification accuracy of the events. As our approach in this paper is directly competing with those seven solutions, to make it clear its novelty, we concisely describe the methodologies used in the other solutions. Those contributions together with several papers derived from the event, which we also mention later, can be considered a state-of-the-art literature on the subject, which can be enlarged with [5].
A two-stage method based on feature vector extraction and classification was proposed in [12]: vector extraction was applied to multidimensional hydraulic data, and safety classification was performed by random forests, the machine-learning algorithm developed by [13]. In [14] recurrent neural networks (RNNs) were used for hydraulic state estimation of network district metered areas and, based on the RNN output, a statistical control process was applied for detecting abrupt changes in the residual time series.
The authors in [15] use first operational variables to check whether physical and/or operating rules have been violated, and the generated set of flagged events feeds a deep learning method based on a convolutional variational auto-encoder to calculate the probability for measured data being anomalous.
In [16] also two detection methods were proposed: one evaluates consistency of the SCADA data and verifies the relation between actuator rules (e.g., pump/valve operation) and the measured data; then, the second method uses principal component analysis (PCA) for separating the hydraulic time series into normal and abnormal data.
A three-stage detection method was presented in [17]: the first step detects outliers in the data, focusing on single sensor analysis; the second stage employs a multilayer perceptron to detect SCADA data nonconformity to normal operation; and the third stage finds anomalies affecting multiple sensors.
Another three-module method was presented in [18]: the first module evaluates the consistency of the data against the set of control rules; the second applies statistical analysis to identify anomalous behaviors; then, the anomalies are confirmed by the third module, which finds correlations between hydraulic variables.
Finally, a model-based approach using EPANET for hydraulic simulations was developed in [19]; analyses of the residual time series between simulated and measured data from SCADA system detected the anomalies, and a multilevel classification algorithm was implemented to classify the residual time series into normal and abnormal events.
BATADAL opened a fruitful discussion among various research groups around the world. Following the cyber-attack detection paradigm, new approaches have been presented in the literature after that Battle. For example, work [1] points to multisite detection approaches based on simultaneous analysis for an efficient warning system. In this work the authors present a joint data-model-based approach for cyber-attack detection: the model of the water network is used for inference from the observational data. Exploring the capacity of machine-learning techniques, in [20] a model for detecting anomalies in a water system controlled by SCADA using various machine-learning techniques is presented. The model classifies events including physical failures and cyber-attacks. As another example, research [21] has tested a set of machine-learning algorithms, highlighting the performance of extreme learning machine for classifying normal and abnormal data from multisite sensors.
Despite many devoted efforts to detect cyber-attacks on WDSs in recent years, the primary focus, as observed in the literature, has been mainly on machine learning and optimization techniques. The techniques of signal-processing for cyber-physical attack detection is still not well explored in the literature, especially in water distribution.
Work [22] investigates the application of Independent Component Analysis (ICA) for stealthy false data attack detection without prior knowledge of any power grid topology. The separated signal by ICA is used for detecting virtually unobservable attacks. The authors in [23] apply ICA for obtaining the fundamental traffic components and, in a second stage, the components are classified by machine-learning-inferred decision trees. Still on ICA applications, work [24] develops an algorithm to characterize hidden structures in fused residuals. Suppression of possible noisy content in residuals—to decrease the likelihood of false alarms—is achieved by performing the residual analysis solely on the dominant parts of a so-called demixing matrix.
In the water resources field, ICA has been applied to drought analysis, exploring hydrological data [25]. Also, in [26] the application of ICA to assess and estimate leakage in water distribution networks is proposed. The algorithm is tested on data acquired in a leakage experimental platform. Water demand is forecasted using a principal component model, and ICA is applied for developing climate predictors in [27].
Once demixed by ICA, source signals can be treated for automatically detecting anomalies, and this inspired us to apply ICA and then ACPD to the automatic detection of cyber-physical attacks. In this line, still within urban hydraulics, but with a different purpose, automatic identification of pipe bursts has been developed using statistic control processes applied to hydraulic parameters (e.g., pressure nodal pressure and flow in pipes) [28] or jointly to water demand forecasting [29]. Also, to improve the capacity of burst and leakage detection, work [30] proposes ACPD applied to filtered signals of consumption data.
After the Introduction, the structure of the paper is the following. The Materials and methods are presented in the next section. Then a section is devoted to the case study, and includes the obtained results and a discussion. The paper closes with the Conclusions section.
3. Materials and Methods
The methodology for cyber-attack detection proposed in this paper is based on two separate techniques. The first one comes from the signal-processing field and applies a Blind Source Separation (BSS) algorithm, which makes use of Independent Component Analysis. This technique produces the segregation of the original measured signals, affected by the attacks, into independent components. These components can be detected using a statistical control method, which corresponds with the other technique in this work: an abrupt change point detection algorithm is applied to the separate signals to accurately detect the start and the end times of the attacks, which helps characterize the attacks. Let us first concisely describe these techniques.
3.1. Independent Component Analysis-ICA
ICA is a methodology for multivariate signal-processing based on the statistical independence property. ICA techniques seek to uncover the independent source signals from a set of observations that are composed of linear mixtures of the underlying sources. The sources are the data projected onto some new axes that must be discovered. Accordingly, this process is known as blind source separation, a category of algorithms that try to decompose mixed signals into their original sources. A classical example of separation of a mixed signal is the cocktail party in which a band is playing [31]. Invited people to the cocktail are not listening each instrument of the band separately, but the combination of all the instruments, voices and noises of the environment. Is it possible to separate each sound’s source captured by the microphones? To answer the question, BSS algorithms are proposed that try to isolate each source.
Let us consider N time series each consisting of M samples (measured points). The aim is to find a transformation of these time series into a new representation in which independent components are identified and separated.
Formally, we represent the N measured time series
compactly by a matrix whose rows are the transposed time series
This matrix is supposed to be a linear combination of the original signals, which can also be represented by another matrix with similar structure to , i.e., the rows of are the transposed of the original time series . The linear combination may be expressed by
where A, so-called mixing matrix, is the matrix representing the linear transformation. Keeping the analogy of the cocktail party, corresponds to the sounds listened by the guests and to the original sounds. The main objective of ICA is to determine the mixing matrix A and the original sources . This task is formulated as an inverse and dual problem. First, a demixing matrix W must be found and then, based on this matrix, the source vector is calculated by
Since the problem is highly underdetermined, the direct calculation of W or A is not possible. An estimate of the sources is made instead by calculating a demixing matrix W, which acts on X such that
and .
To perform this approximation, the process in the ICA algorithm uses some factorization of the observed data (mainly singular value decomposition), and high order statistics (such as the fourth moment, kurtosis) to measure signal-noise separation. From a statistical point of view, the separated signals must be independent, and the independent components must have a non-Gaussian distribution [32]. Based on this non-Gaussian nature, to calculate W, most ICA methods estimate the inverse of A, allowing the calculation of the source vector. The trick behind this process is to find that that maximizes the non-Gaussian nature of the independent components. Usually, this process is done based on maximum-likelihood estimation, maximization of the output entropy or minimization of mutual information in the output [33].
In this paper, the non-Gaussian nature is measured based on the the concept of negentropy, as presented and discussed by [32] in the algorithm called fastICA. The idea behind negentropy comes from the Information Theory. Gaussian-distributed data has entropy H equal to zero, while non-Gaussian-distributed data has non-negative entropy. Negentropy J is calculated as:
where is a Gaussian random variable with the same covariance as .
The fastICA algorithm is based on a fixed-point scheme for finding through maximization of the negentropy. In addition, based on that matrix, it is possible to approximately rebuild the source vector as written in (5).
3.2. Abrupt Change Point Detection-ACPD
After sources separation by fastICA, it is expected that one of the sources will be affected by the cyber-attack. For detecting this change, an algorithm of abrupt change point detection (ACPD) is applied. ACPD is performed by evaluating one or more statistical parameters of the time series, so-called control variables.
For a formal definition, following the ACPD algorithm proposed by [34], let us first identify, among the separate signals provided by fastICA, that one that best represents the kind of signal we are interested in. In our case, we must identify that series mainly representing non-periodic behavior. Let , one of the signals obtained by (5), be our series of interest, where M is the size of the time series. The algorithm tries to identify the various, say m, change points in this time series, which are positioned at indexes . Each position corresponds to an integer value between 1 and and splits the time series into intervals .
A common approach to estimating is by minimizing the objective function:
where is a cost function related to the time series in the interval . Several cost functions have been proposed in the literature, such as log-likelihood [35], quadratic loss or cumulative sums [36]. Moreover, is a penalty function to avoid overfitting. The most common choice, according to [34], is a linear variation . This constraint allows the method to estimate a vector corresponding to a trade-off between the minimization of the cost function (found by a large-size ) and the minimization of the penalty function (found by a small-size ) [37].
The entire process can be summarized as follows:
- A point is chosen and the time series is divided into two intervals.
- For each interval, a control variable (mean, standard deviation, root-mean-square, etc.) is computed.
- For each point within the interval, deviations of control variables are computed.
- The deviations are summed for all the intervals to calculate the total residual error, and the objective function (7) is evaluated.
- Vary the division point to minimize the total residual error.
The result of this process is exactly the set of components of . For this work, each component of the source’s signal found by fastICA obtained by (5) is evaluated by the ACPD algorithm, and the vector corresponds to the start and the end times of an attack.
3.3. Automatic Detection of Cyber-Attacks in WDSs
Following the formalization given for fastICA and ACPD algorithms, this section presents the application of both methods for disclosing cyber-attacks in WDSs. First, based on the available data set, the input time series for fastICA are selected. Hydraulic measurements (e.g., pressure, flow and tank level) are considered in this work as input data, which are combined to get the best input arrangement. After a trial-and-error process, we have identified that decomposing the signal into two components will be enough to suitably identify the effects of the attacks. Indeed, the results presented for the case study confirm this assumption. From the software development point of view, the data is processed in Python language and makes use of the package sklearn.
The non-periodic component of the demixed signal is then used as the input for the ACPD algorithm. This second process is responsible for automatically identifying the start and end time of the anomalies, thus allowing the disclosure of the attack. The output of this process is the exact interval of time where the water network was subjected to an attack. With this outcome, it is possible to apply the performance evaluation metrics considered in BATADAL, and then, to compare the ability of the proposed algorithm with other approaches. In this stage, the demixed data is processed in the MATLAB programming environment, and makes use of several tools in the toolbox of Signal-processing. For a better understanding, Figure 1 presents the flowchart of the complete methodology.
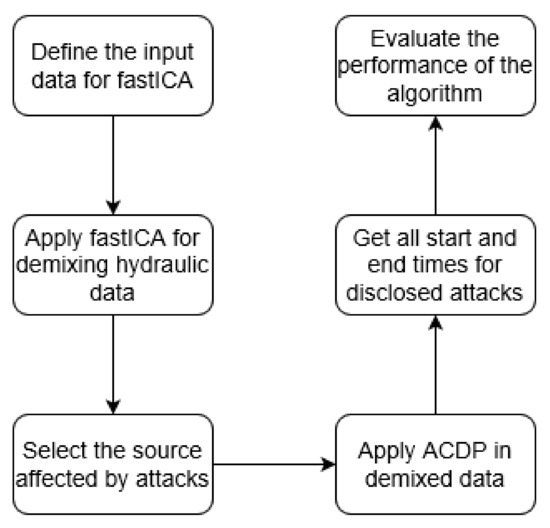
Figure 1.
Flowchart of the complete methodology for disclosing cyber-attacks applying fastICA and ACPD algorithms.
3.4. Performance Evaluation
In addition to the BATADAL data sets, the performance evaluation also follows the criteria and metrics presented in [7], namely time-to-detection () and single classification rate ().
is the time required by the algorithm to find an attack and can be calculated as:
where is the time when an attack is detected, and is the time when the attack really started. When an attack is detected, varies in the interval , where is the total attack duration. For calculating the total under several attack scenarios, work [7] presents a score for the specific attack detection calculated by (9):
where is the number of attack scenarios.
An ideal algorithm for cyber-attack detection must be able not only to quickly disclose the attacks, but also to not produce false positive warnings. For evaluating the accuracy of the algorithm, the true positive rate, (10), and the true negative rate (11), are calculated based on a confusion matrix. Both rates are combined for calculating the (12):
where and are the numbers of true positive and true negative time stamps, respectively. and are the numbers of false positive and false negative time stamps.
4. Case Study
The methodology presented in this paper is applied to the case study posed in BATADAL [7], which uses the water network D-town (Figure 2) and considers potential attacks to pump stations and pressure and tank level sensors, as indicated in the figure. The network is composed of 429 pipes, 388 junction nodes, 7 tanks, 1 reservoir, 11 pumps and 5 valves.
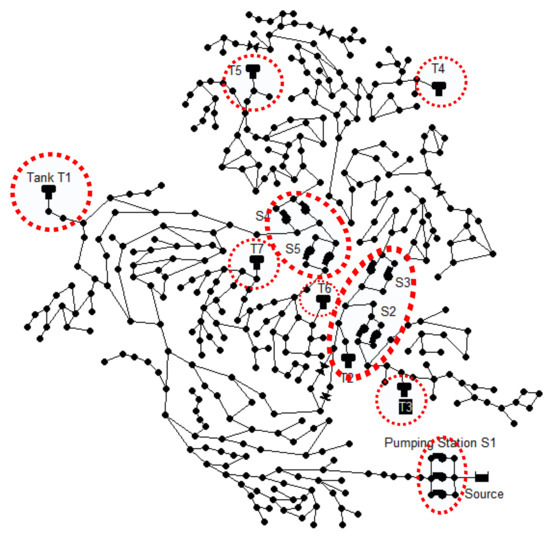
Figure 2.
D-town water network topology highlighting potential attack locations.
Three data sets are provided by BATADAL generated via epanetCPA [38], a MATLAB toolbox for cyber-attack design and hydraulic simulation. Please note that due to obvious security reasons, studies of cyber-physical attacks are usually conducted using simulated data that reproduce real-world conditions [5]. In the case of BATADAL, hourly pressure, flow, tank level and control device status are provided in the data sets. The first data set corresponds to one year of data without cyber-attacks. The second data set is based on a set of 492 h. This data set unfolds an entire, well-labeled cyber-attack, and other six cyber-attacks partially or completely hidden. Finally, the third data set has 7 new attacks distributed along 407 h of data.
The application of the methodology starts by selecting the combination of data to be used as input for fastICA from the available data. Since the water network is naturally divided into small district metered areas according to its topology, eight combinations of data are used as input for the ICA algorithm. These combinations consider the hydraulic connections of the system and are summarized in Table 1.

Table 1.
Description of control and measuring devices for fastICA application
Using the combinations presented in Table 1, the algorithm fastICA is applied, which separates each combination into 2 (approximate) sources. To illustrate the signal separation, Figure 3a presents the original data for combination B, and Figure 3b presents the separated signals, split into two sources. In the separated sources (Figure 3b), an abnormal trend of the time series is discovered in the test data set.
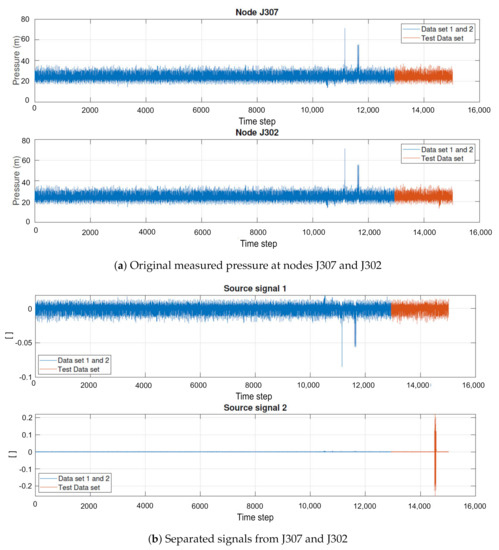
Figure 3.
Comparison between mixed and separated pressure signal—combination B.
This behavior is repeated for other combinations. One source has a periodic trend, as a typical behavior of a WDS, while the second source is similar to a random noise. This second one is, usually, highly affected by the attacks and is considered by the detection algorithm to identify abrupt changes.
For automatic detection of the changes in the separated signals, ACDP is applied. The algorithm evaluates the second source, highly affected by the attacks, and allows a more accurate detection of the anomalies. Applying ACDP to the sources obtained from all combinations (Table 1), the start and end time indexes of the attacks are obtained.
The entire process may be summarized as follows. First, a combination of hydraulic time series is selected and is processed by fastICA (Figure 4a); this algorithm splits the time series and produces two sources that are processed by ACDP (Figure 4b). Finally, ACDP is launched to locate the time interval when the attack occurred (Figure 4c), allowing the water company to start actions for mitigating the impacts of the attack. Figure 4c shows in detail the attack corresponding to combination F. It is possible to observe the delay in detecting the attack (interval between the first black and the green lines). As described in [7], this attack is related to changes of tank T4 signal. Even though these changes are not easily identified in the original data, as shown in Figure 4a, after fastICA processing, source signal 1 clearly reveals the change in data, allowing ACDP to disclose the attack.
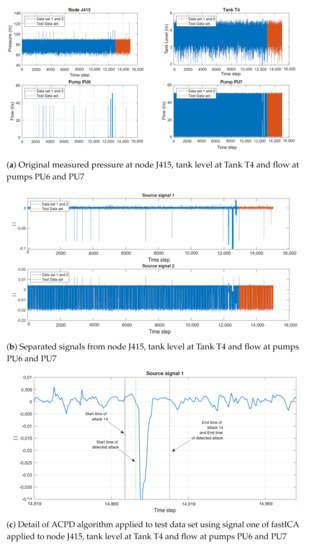
Figure 4.
Complete data processing, illustrating fastICA and ACPD applied to Combination F.
Still for illustrating the joint capability of fastICA and ACDP, Figure 5a shows original measured data of pumps PU8 and PU9, node J306 and tank level T5. The joint process by fastICA and ACDP applied to the corresponding test data set reveals that no attacks are found in the sources. This fact corroborates the accuracy of the algorithm, mainly in terms of false positives minimization, since according to [7], there were no attacks occurring in the test data set.
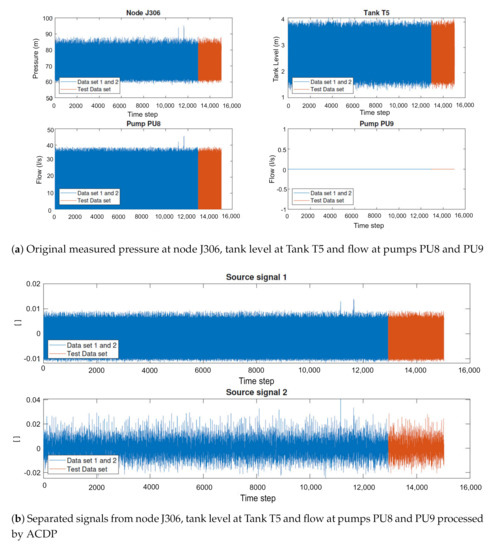
Figure 5.
Original and processed data for combination G.
The ACDP applied to all sources and combinations for the test data set resulted in the identification of 7 cyber-attacks, i.e., all the attacks were disclosed by the proposed methodology. Figure 6 presents the confusion matrix with the numbers of and .
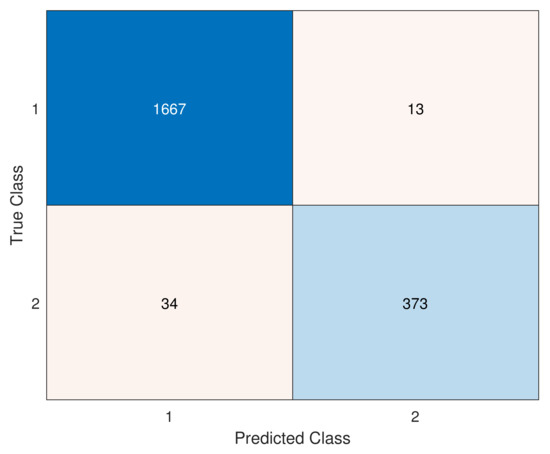
Figure 6.
Confusion matrix for the test data set presenting the number of true positives and negatives on the main diagonal and the false negatives and false positives on the counterdiagonal.
Based on the confusion matrix, it is possible to calculate and , resulting in a . Compared to the seven teams that presented solutions for BATADAL, the value of is the second higher, the first team having obtained , virtually identical. Comparing the , the methodology of the present work gets the highest scores, showing its efficiency to find abnormal scenarios.
The results in terms of , are summarized in Table 2. Four out of the seven attacks are detected immediately or in a maximum of 1 h later. The rest is detected in a maximum of 10 h later, as shown in the table. Based on these values, the score for the other metric proposed in BATADAL, namely , is calculated, resulting in . Compared to the other teams, this value is the lowest and shows that despite the accuracy of the methodology, for some abnormal scenarios, early warnings cannot be suitably obtained. Based on both metrics and the final score is calculated, resulting in . This final score is the second highest, when compared with the seven teams that presented solutions in BATADAL.
Table 2.
Summarized results for the test data sets presenting start and end time date for each attack
5. Conclusions
The security of water distribution systems has become increasingly complex due to the rapid rise of telemetry and remote controls. The growing number of reported cyber-attacks in WDSs has also created an important need for new, fast and efficient methodologies for early-warning systems that help guarantee WDS security.
Most efforts devoted to detecting cyber-attacks in WDSs have primary focused on machine-learning and optimization techniques. Statistical analysis of measured data can provide valuable results for quick detection of anomalies. However, as attested in [5], studies from other fields are necessary to build confidence in the models. In this paper, we focus on signal-processing. Among the signal-processing techniques based on statistical analysis, fastICA is explored in this work. FastICA has shown to be a powerful tool for hydraulic data analysis, mainly under abnormal conditions. The signal separation follows a trend, where one signal is more related to a typical periodical oscillation of the system, and the second one is more related to a random process. The latter is highly affected by abnormal conditions and, consequently, it is a possible input for detection algorithms. The application of fastICA to hydraulic time series (e.g., tank level) allowed to clearly highlight the attacks against the studied water system. These attacks cannot be easily disclosed in the original time series; however, this task becomes easier after processing the data by a BSS algorithm.
Change point detection algorithms are useful for automatic statistical changes in time series, and can be used for early-warning systems. In this work, the ACPD algorithm is applied to the separate signals resulted from fastICA for automatically defining changes in data, which are seen to correspond to cyber-attacks. The methodology applied to the BATADAL case study resulted in the detection of the seven attacks with high accuracy and few false positives. We claim that the methodology can be perfectly applied to any real system, as long as the water utility can measure at least one of the hydraulic parameters, namely flow, pressure and tank level.
Nevertheless, some attack scenarios have been detected too late, which is a limitation, otherwise typical of most risk evaluation methodologies. Special attention to this kind of attacks should be paid, requiring more investigation for developing ultimate conclusions about the global efficiency of the methodology. Future works, more than ratifying the efficiency of detection algorithms, should go deeper into the cyber-physical problem, investigating the causes of the attacks, optimally placing grids of dedicated sensors, and timely responding to prevent the occurrence of damage. Optimal sensor placement is still an only recently and partially formed subject. Accordingly, efforts should be devoted to expanding and enriching this field by producing novel and efficient methodologies to help fully develop this field of research.
Author Contributions
Conceptualization, B.B. and E.L.J.; methodology, P.R., B.B. and D.B.; software, B.B. and P.R.; validation, G.M. and D.B.; formal analysis, J.I. and E.L.J.; writing—original draft preparation, B.B. and P.R.; writing—review and editing, G.M. and J.I.; supervision, J.I. and E.L.J. All authors have read and agreed to the published version of the manuscript.
Funding
This research received no external funding.
Institutional Review Board Statement
Not applicable.
Informed Consent Statement
Not applicable.
Data Availability Statement
Not applicable.
Conflicts of Interest
The authors declare no conflict of interest.
References
- Taormina, R.; Galelli, S. Deep-learning approach to the detection and localization of cyber-physical attacks on water distribution systems. J. Water Resour. Plan. Manag. 2018, 144, 04018065. [Google Scholar] [CrossRef]
- Adepu, S.; Palleti, V.R.; Mishra, G.; Mathur, A. Investigation of cyber attacks on a water distribution system. In International Conference on Applied Cryptography and Network Security; Springer: Berlin/Heidelberg, Germany, 2020; pp. 274–291. [Google Scholar]
- Clark, R.M.; Panguluri, S.; Nelson, T.D.; Wyman, R.P. Protecting drinking water utilities from cyberthreats. J. Am. Water Work. Assoc. 2017, 109, 50–58. [Google Scholar] [CrossRef]
- Water Infrastructure: When States and Cyber Attacks Rear Their Ugly Heads, Howpublished. Available online: https://www.stormshield.com/news/water-infrastructure-when-states-and-cyber-attacks-rear-their-ugly-heads (accessed on 25 January 2021).
- Tuptuk, N.; Hazell, P.; Watson, J.; Hailes, S. A Systematic Review of the State of Cyber-Security in Water Systems. Water 2021, 13, 81. [Google Scholar] [CrossRef]
- CySWater’15: Proceedings of the 1st ACM International Workshop on Cyber-Physical Systems for Smart Water Networks; Association for Computing Machinery: New York, NY, USA, 2015.
- Taormina, R.; Galelli, S.; Tippenhauer, N.O.; Salomons, E.; Ostfeld, A.; Eliades, D.G.; Aghashahi, M.; Sundararajan, R.; Pourahmadi, M.; Banks, M.K.; et al. Battle of the attack detection algorithms: Disclosing cyber attacks on water distribution networks. J. Water Resour. Plan. Manag. 2018, 144, 04018048. [Google Scholar] [CrossRef]
- Comon, P. Independent Component Analysis. In International Signal Processing Workshop on High-Order Statistics, Chamrousse, France, 10–12 July 1991; Lacoume, J.L., Ed.; Higher-Order Statistics, Elsevier: Amsterdam, The Netherlands, 1992; pp. 29–38. [Google Scholar]
- Nader, P.; Honeine, P.; Beauseroy, P. Detection of cyberattacks in a water distribution system using machine learning techniques. In Proceedings of the 2016 Sixth International Conference on Digital Information Processing and Communications (ICDIPC), Beirut, Lebanon, 21–23 April 2016; pp. 25–30. [Google Scholar]
- Zohrevand, Z.; Glasser, U.; Shahir, H.Y.; Tayebi, M.A.; Costanzo, R. Hidden Markov based anomaly detection for water supply systems. In Proceedings of the 2016 IEEE International Conference on Big Data (Big Data), Washington, DC, USA, 5–8 December 2016; pp. 1551–1560. [Google Scholar]
- Adepu, S.; Mathur, A. An investigation into the response of a water treatment system to cyber attacks. In Proceedings of the 2016 IEEE 17th International Symposium on High Assurance Systems Engineering (HASE), Orlando, FL, USA, 7–9 January 2016; pp. 141–148. [Google Scholar]
- Aghashahi, M.; Sundararajan, R.; Pourahmadi, M.; Banks, M.K. Water Distribution Systems Analysis Symposium–Battle of the Attack Detection Algorithms (BATADAL). In World Environmental and Water Resources Congress 2017; American Society of Civil Engineers: Sacramento, CA, USA, 2017; pp. 101–108. [Google Scholar]
- Breiman, L. Random forests. Mach. Learn. 2001, 45, 5–32. [Google Scholar] [CrossRef]
- Brentan, B.M.; Campbell, E.; Lima, G.; Manzi, D.; Ayala-Cabrera, D.; Herrera, M.; Montalvo, I.; Izquierdo, J.; Luvizotto, E., Jr. On-line cyber attack detection in water networks through state forecasting and control by pattern recognition. In World Environmental and Water Resources Congress 2017; American Society of Civil Engineers: Sacramento, CA, USA, 2017; pp. 583–592. [Google Scholar]
- Chandy, S.E.; Rasekh, A.; Barker, Z.A.; Shafiee, M.E. Cyberattack detection using deep generative models with variational inference. J. Water Resour. Plan. Manag. 2019, 145, 04018093. [Google Scholar] [CrossRef]
- Giacomoni, M.; Gatsis, N.; Taha, A. Identification of cyber attacks on water distribution systems by unveiling low-dimensionality in the sensory data. In World Environmental and Water Resources Congress 2017; American Society of Civil Engineers: Sacramento, CA, USA, 2017; pp. 660–675. [Google Scholar]
- Abokifa, A.A.; Haddad, K.; Lo, C.; Biswas, P. Real-time identification of cyber-physical attacks on water distribution systems via machine learning–based anomaly detection techniques. J. Water Resour. Plan. Manag. 2019, 145, 04018089. [Google Scholar] [CrossRef]
- Pasha, M.F.K.; Kc, B.; Somasundaram, S.L. An approach to detect the cyber-physical attack on water distribution system. In World Environmental and Water Resources Congress 2017; American Society of Civil Engineers: Sacramento, CA, USA, 2017; pp. 703–711. [Google Scholar]
- Housh, M.; Ohar, Z. Model-based approach for cyber-physical attack detection in water distribution systems. Water Res. 2018, 139, 132–143. [Google Scholar] [CrossRef]
- Hindy, H.; Brosset, D.; Bayne, E.; Seeam, A.; Bellekens, X. Improving SIEM for critical SCADA water infrastructures using machine learning. In Computer Security; Springer: Berlin/Heidelberg, Germany, 2018; pp. 3–19. [Google Scholar]
- Choi, Y.H.; Sadollah, A.; Kim, J.H. Improvement of Cyber-Attack Detection Accuracy from Urban Water Systems Using Extreme Learning Machine. Appl. Sci. 2020, 10, 8179. [Google Scholar] [CrossRef]
- Esmalifalak, M.; Nguyen, H.; Zheng, R.; Han, Z. Stealth false data injection using independent component analysis in smart grid. In Proceedings of the 2011 IEEE International Conference on Smart Grid Communications (SmartGridComm), Brussels, Belgium, 17–20 October 2011; pp. 244–248. [Google Scholar]
- Palmieri, F.; Fiore, U.; Castiglione, A. A distributed approach to network anomaly detection based on independent component analysis. Concurr. Comput. Pract. Exp. 2014, 26, 1113–1129. [Google Scholar] [CrossRef]
- Lughofer, E.; Zavoianu, A.C.; Pollak, R.; Pratama, M.; Meyer-Heye, P.; Zörrer, H.; Eitzinger, C.; Radauer, T. On-line anomaly detection with advanced independent component analysis of multi-variate residual signals from causal relation networks. Inf. Sci. 2020, 537, 425–451. [Google Scholar] [CrossRef]
- Ndehedehe, C.E.; Agutu, N.O.; Okwuashi, O.; Ferreira, V.G. Spatio-temporal variability of droughts and terrestrial water storage over Lake Chad Basin using independent component analysis. J. Hydrol. 2016, 540, 106–128. [Google Scholar] [CrossRef]
- Gao, J.; Qi, S.; Wu, W.; Li, D.; Ruan, T.; Chen, L.; Shi, T.; Zheng, C.; Zhuang, Y. Study on leakage rate in water distribution network using fast independent component analysis. Procedia Eng. 2014, 89, 934–941. [Google Scholar] [CrossRef]
- Moradkhani, H.; Meier, M. Long-lead water supply forecast using large-scale climate predictors and independent component analysis. J. Hydrol. Eng. 2010, 15, 744–762. [Google Scholar] [CrossRef]
- Jung, D.; Kang, D.; Liu, J.; Lansey, K. Improving resilience of water distribution system through burst detection. In World Environmental and Water Resources Congress 2013: Showcasing the Future; Elsevier: Amsterdam, The Netherlands, 2013; pp. 768–776. [Google Scholar]
- Bakker, M.; Jung, D.; Vreeburg, J.; Van de Roer, M.; Lansey, K.; Rietveld, L. Detecting pipe bursts using Heuristic and CUSUM methods. Procedia Eng. 2014, 70, 85–92. [Google Scholar] [CrossRef]
- Christodoulou, S.E.; Kourti, E.; Agathokleous, A. Waterloss detection in water distribution networks using wavelet change-point detection. Water Resour. Manag. 2017, 31, 979–994. [Google Scholar] [CrossRef]
- Comon, P. Contrasts, independent component analysis, and blind deconvolution. Int. J. Adapt. Control. Signal Process. 2004, 18, 225–243. [Google Scholar] [CrossRef]
- Hyvärinen, A.; Oja, E. Independent component analysis: Algorithms and applications. Neural Netw. 2000, 13, 411–430. [Google Scholar] [CrossRef]
- Ziehe, A. Blind source separation based on joint diagonalization of matrices with applications in biomedical signal processing. Ph.D. Thesis, Universitat Potsdam, Postdam, Germany, April 2005. [Google Scholar]
- Killick, R.; Fearnhead, P.; Eckley, I.A. Optimal detection of changepoints with a linear computational cost. J. Am. Stat. Assoc. 2012, 107, 1590–1598. [Google Scholar] [CrossRef]
- Horváth, L. The maximum likelihood method for testing changes in the parameters of normal observations. Ann. Stat. 1993, 21, 671–680. [Google Scholar] [CrossRef]
- Inclan, C.; Tiao, G.C. Use of cumulative sums of squares for retrospective detection of changes of variance. J. Am. Stat. Assoc. 1994, 89, 913–923. [Google Scholar]
- Lavielle, M. Using penalized contrasts for the change-point problem. Signal Process. 2005, 85, 1501–1510. [Google Scholar] [CrossRef]
- Taormina, R.; Galelli, S.; Tippenhauer, N.O.; Salomons, E.; Ostfeld, A. Characterizing cyber-physical attacks on water distribution systems. J. Water Resour. Plan. Manag. 2017, 143, 04017009. [Google Scholar] [CrossRef]


Publisher’s Note: MDPI stays neutral with regard to jurisdictional claims in published maps and institutional affiliations. |
© 2021 by the authors. Licensee MDPI, Basel, Switzerland. This article is an open access article distributed under the terms and conditions of the Creative Commons Attribution (CC BY) license (http://creativecommons.org/licenses/by/4.0/).