Abstract
A 2D streamwise velocity model based on the Reynolds Averaged Navier–Stokes (RANS) is a useful approach to predict the boundary shear stress and the streamwise velocity in a free surface stream where secondary flows are not relevant. Boundary conditions treatment is a key aspect implementing these models. A low computational cost and fully predictive numerical model with a novel treatment of boundary conditions is presented. The main features of the modified model are the employment of a modified law of the wall valid for any roughness condition, the estimation of the boundary shear stress is done only focusing on the near-contour region, the use of a full-predictive physical based model for the eddy viscosity distribution and the incorporation of the free surface shear stress due to water–air interface. The validation of the proposed changes was performed with a substantial number of experimental cases available in the literature using different cross-section shapes (circular, rectangular, trapezoidal and compound section) and roughness condition with quite good agreement. Preliminary results suggest that the influence of the free surface boundary layer has a significant impact on the results for both the streamwise velocity and boundary shear stress in windy conditions. The proposed approach allows its considerations in practical applications.
1. Introduction
An accurate knowledge of the boundary shear stress and cross sectional velocity distributions of a free surface stream is fundamental due to its practical applications in many fluid dynamic and environmental problems, such as flow discharge estimation, sediment and other substance transport, erosion and sedimentation process or changes in riverbed morphology [1]. For these reasons, there has been continuous development in numerical modeling techniques in the last decades.
Numerical models can be divided, according to their complexity, into: (i) 1D lumped models based on semi-empirical equations which allow calculating the average velocity (Manning, Chezy or Darcy–Weisbach) [2]; (ii) quasi-1D lumped models used mainly in compound channels where lateral momentum transfers normally occur between the fast flow of the main channel and the slower flow of the floodplain, such as the methods of Lotter, Ackers or Pavloski [1,3,4]; (iii) quasi-2D models which provide information on the lateral distributions of depth-averaged velocity and boundary shear stress based on the lateral distribution, e.g. the Shiono and Knight Method (SKM) [5,6,7,8,9]; (iv) 2D streamwise velocity models which provide the longitudinal velocity distribution along the cross section over a one-dominant-direction-flow based on the Reynolds Averaged Navier–Stokes (RANS) equations applying some turbulence closure model [10,11]; and (v) 3D models, such as Direct Numerical Simulation (DNS), Large Eddy Simulation (LES) or 3D RANS models [12]. All these 3D computational fluid dynamical (CFD) algorithms are very precise and complex, requiring high computational cost and additional information that, in many cases, is not available. An example of this kind of models with application in sediment transport can be found in Liu and Garcia [13].
Methods based on the SKM (Group iii) have been widely investigated and are a key approach especially in rectangular and trapezoidal compound channels [14,15]. However, these models compute the depth-averaged velocity without calculating the vertical velocity distribution. Even though 2D RANS models (Group iv) neglect the influence of secondary currents and associated phenomena, they do simulate streamwise velocity along the cross section. They are a good alternative to 3D CFD approaches due to their simplicity, low computational load and ease of application on any arbitrary cross-section. The key aspects of these models are mainly the treatment of the boundary conditions and the closure model employed for the eddy viscosity. Houjou et al. [16] presented a turbulence closure for rectangular channels based on the ray–isovel coordinate system since the flow equations predict the same behavior along the rays as they should do along the vertical direction for a wide horizontal bed. However, this model required the measure of a single velocity to adequately scale the velocity field. Note that, since the velocity field is scaled by the measured velocity, the imposed boundary conditions become less important. Kean and Smith [11] generalized the model by Houjou et al. [16] to be valid for arbitrary cross sections and included the effect of drag from rigid vegetation and imposed as boundary conditions null velocity at the roughness height. However, it still required an adjustment parameter when setting the maximum value of the eddy viscosity at a certain distance to the wall. Later, Kean et al. [17] validated the previous model against a high-resolution laboratory dataset of velocity and boundary shear stress measurements for a trapezoidal channel. More recently, Cassan et al. [18] presented a simplified method based on previously mentioned works to estimate the streamwise velocity distribution in rectangular and compound channels with spatially varying roughness, imposing as boundary condition the velocity at a certain fixed distance to the wall given by the logarithmic law for smooth and rough boundaries. This method incorporates a fully predictive mixing length model and a sub-division of the wetted surface to calculate bed shear stress along the perimeter applying the momentum balance over each portion between adjacent rays, but it neglects the influence of the free surface boundary layer. The downstream component of the momentum in each portion is compensated only by the local bed shear stress acting along its corresponding length of the rigid contour, which heavily depends on the computed streamwise velocity distribution. Both methods [17,18] require an iterative procedure to alternatively solve the momentum equation for velocity and the equation for shear stress and eddy viscosity until convergence. Against this background, the estimation of bed shear stress using this method has three main issues: (i) small errors in the velocity distribution affect isovelocity curves and could have a great effect when calculating bed shear stress since the geometry of the rays defines the control volume; (ii) it requires analyzing velocity distribution over the full section to compute bed shear stress at any point along the wetted perimeter, where the relation among velocity and shear stress is mainly local; and (iii) the shear stress along the water–air interface is not considered in the momentum balance. Additionally, the eddy viscosity in the model by Cassan et al. [18] increases up to free surface without setting a maximum value, contrary to what is observed in reality.
This paper proposes using an alternative methodology to improve the treatment of boundary conditions, both at the rigid and not movable contours and at the free surface. It can correctly calculate the boundary shear stress from the velocity distribution according to previously mentioned limitations and a full-predictive physical based model for the eddy viscosity distribution. Instead of applying the momentum balance over each sub-area delimited by adjacent rays, which requires considering the velocity distribution over the whole cross-section, the proposed technique estimates the boundary shear stress only focusing on the near-contour region. The velocity profile obtained from the numerical procedure should be consistent with the analytical velocity profile along each individual ray. A modified law of the wall [19] valid for any roughness condition (smooth, transitional and rough) is employed to obtain the analytical velocity profile. The full new modified approach is validated against a wide variety of experimental results available in the literature. The effect of a free surface boundary layer due to wind velocity (not considered in previous works) is included, and its effects are analyzed in a qualitative manner in the absence of laboratory measurements.
The rest of this paper is set out as follows: First, the governing equations to be solved with the ray–isovel approach and the new features concerning the new methodology to calculate the boundary shear stress and the boundary conditions are described. Then, the computational method is fully explained. Subsequently, the model is validated making a more extensive validation against empirical data with respect to previous work for both streamwise velocity and boundary shear stress distributions. The results are compared against some experiments available in the literature with different cross-section shapes (circular, rectangular, trapezoidal and compound section) and roughness condition. The influence of the free surface boundary layer on velocity and shear stress distributions is analyzed and highlighted. Finally, relevant conclusions are duly drawn.
2. Governing Equations
Assuming a Cartesian coordinate system, the momentum equation for steady flow in the streamwise direction, i.e., x-direction, is given by
with the velocity vector; fluid density; acceleration of gravity; kinematic viscosity of the fluid; the free surface level; and and shear stress components of the deviatoric stress tensor in the plane normal to the downstream component (x) in the cross-stream (y) and vertical (z) directions respectively. In Equation (1), the left-side terms represents the secondary currents (responsible for dip-phenomenon among others), while the right-side terms represent the sum of gravitational action and the shear stresses (both lateral and vertical). In a general form, the shear stress component in the i-direction can be computed as
where is the scalar eddy viscosity introduced by Boussinesq in 1877. According to this definition, the shear stress between fluid layers is proportional to the velocity gradient in the perpendicular direction to those layers. In these cases, is the proportionality constant that quantifies the transfer of momentum in the transverse direction. Substituting Equation (2) into Equation (1) gives
and, assuming that the transversal and vertical velocities are negligible (), Equation (3) is written as follows:
which is a partial differential equation (PDE) governing the streamwise velocity distribution averaged over time, for open channels, under steady conditions. Note that, for uniform flow, apply, being the friction slope and S the bed channel slope. This equation constitutes the theoretical basis for the 2D RANS model group, where the present work contributes.
2.1. Eddy Viscosity
One of the main parameters to be modeled is the eddy viscosity distribution, which has been widely investigated in the literature. Assuming a linear shear stress distribution with a maximum at the bed and zero at the water surface together with a logarithmic velocity law and a parabolic mixing length function, Yalin [20] presented an empirical equation for the vertical eddy viscosity given by
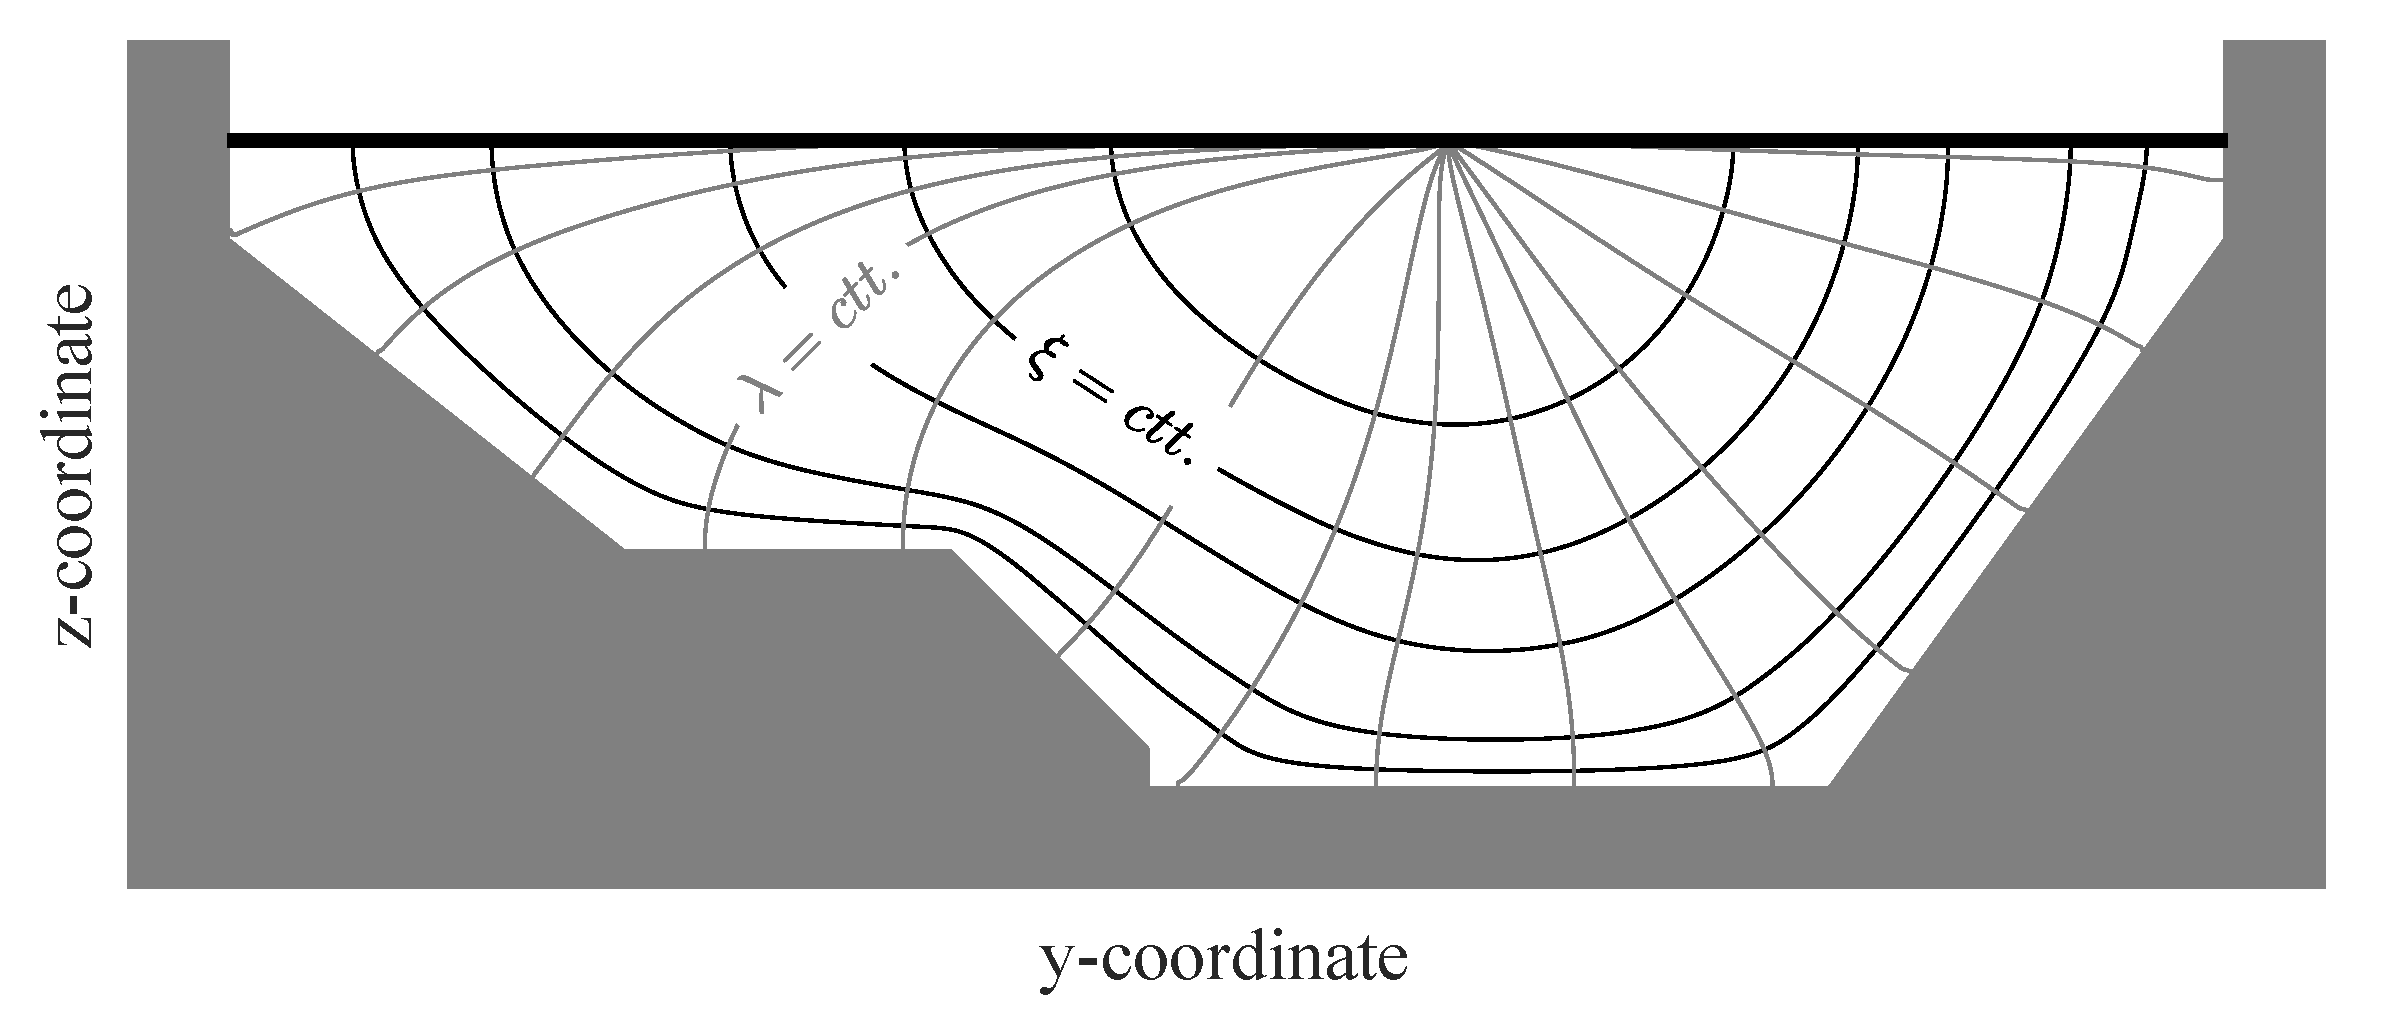
where is the von Karman constant, is the distance from the boundary, is the total depth and is the shear velocity. For non infinite wide channels, Kean and Smith [11] and Kean et al. [17], among others, considered measuring d and h along the rays ( in Figure 1), defined as the normal lines to isovelocity lines or isovels ( in Figure 1). However, it is still not clear the most appropriate expression for . For instance, Kean et al. [17] proposed the expression
being the shear stress along the ray in the interior of the channel at a distance d from the boundary and the bed shear stress. Additionally, Kean and Smith [11] found that the eddy viscosity increases along each ray until it reaches a maximum value to be calibrated. However, in Cassan et al. [18], the eddy viscosity increases as it approaches the free surface without reaching a maximum value. For simplicity reasons and avoiding the use of adjustment parameters, a shear stress-independent function similar to Equation (5) is considered hereinafter for the eddy viscosity distribution along the rays, increasing until it reaches its maximum value of at , and then remaining constant from that point to the end of the ray, at the point where maximum velocity is located.
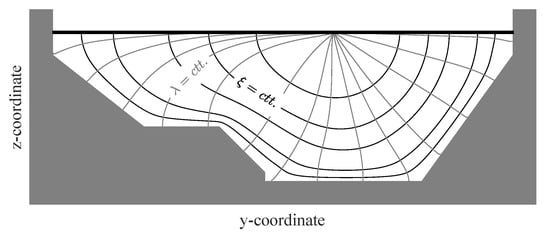
Figure 1.
Diagram of orthogonal ray () and isovel () system.
2.2. Boundary Conditions Near Walls
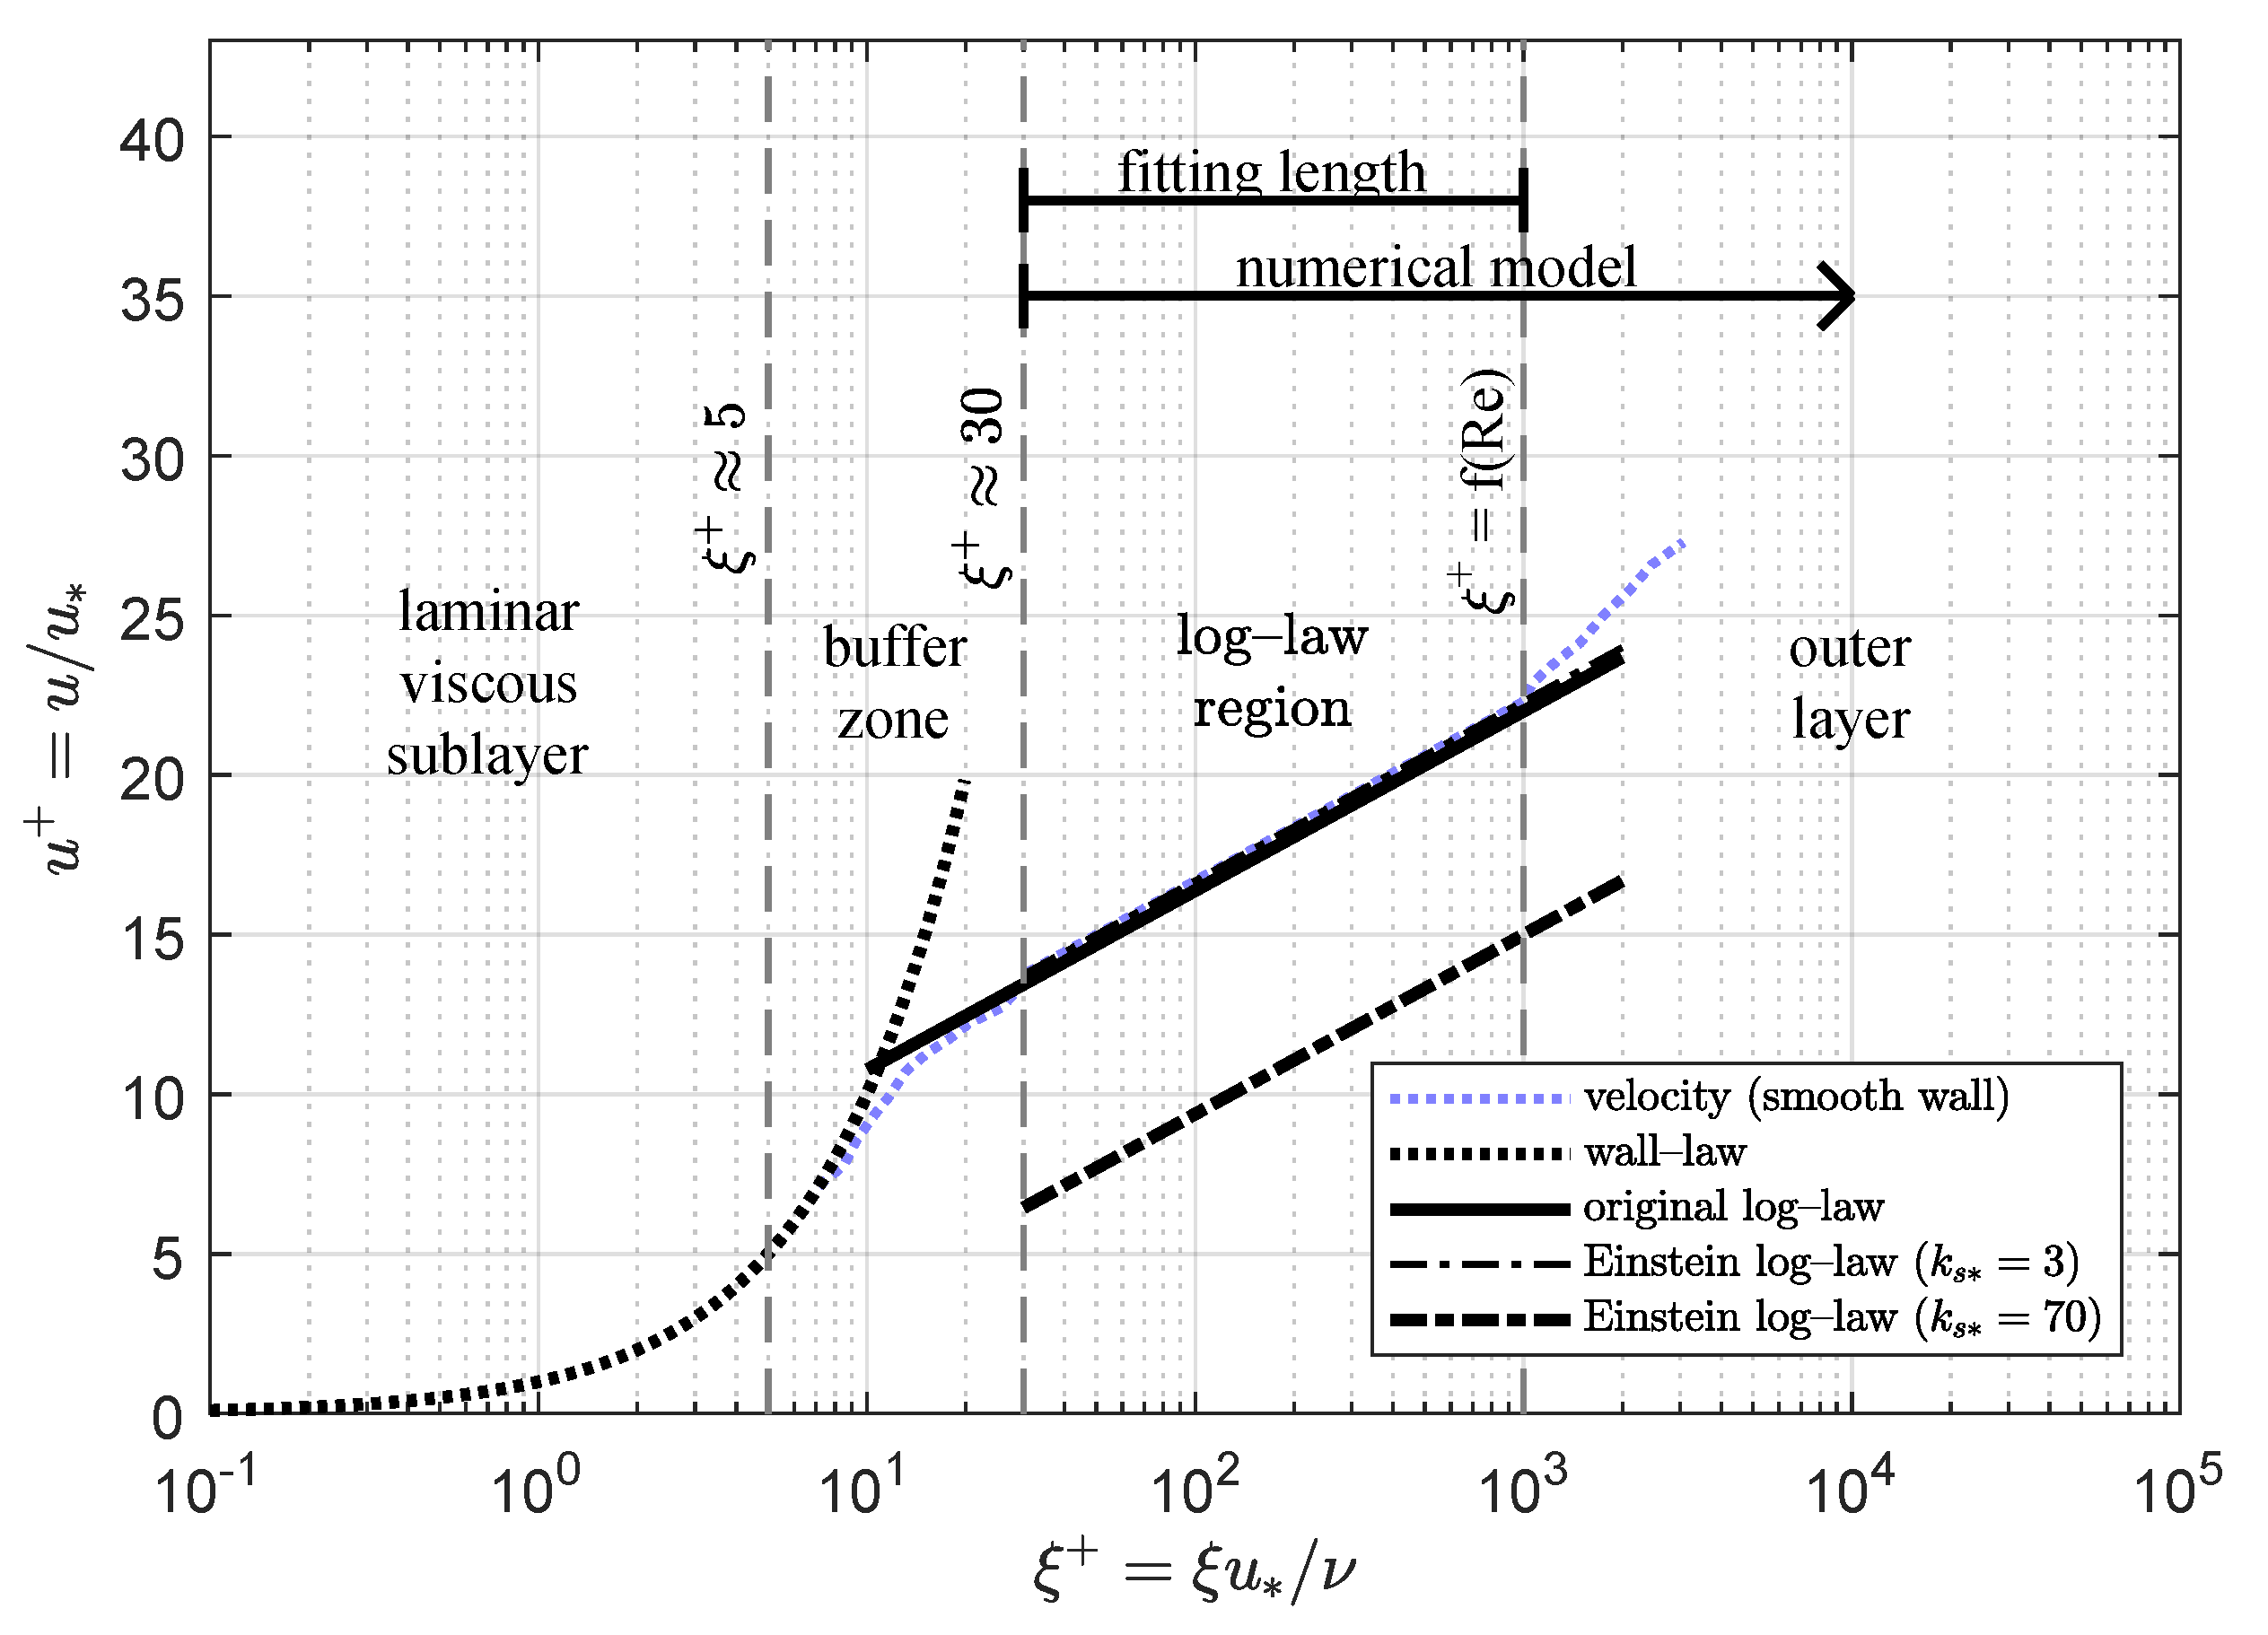
Very close to the bed contours and up to a dimensionless distance , the viscous effects are predominant, causing the so-called laminar viscous sublayer [21]. These effects can be neglected for values larger than , where the universal logarithmic profile is valid with a good approximation inside the inner layer (see Figure 2). The log-law for the velocity profile reads
where
is a small distance to the rigid contour and stands for the equivalent roughness. Equation (7) is only valid with smooth boundaries, i.e., for dimensionless roughness . However, the following modification to the universal log-law velocity profile, based on the work of Einstein [19], is valid for smooth, transitional and rough surface:
where function can be calculated as
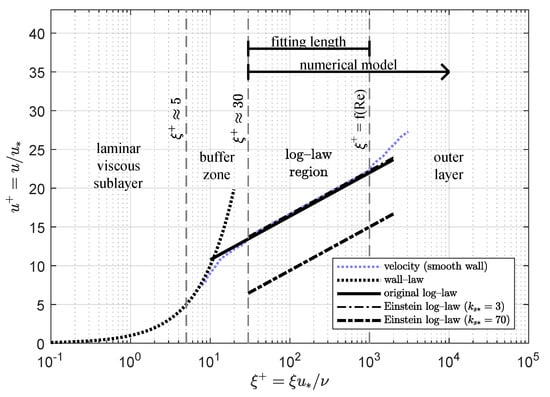
Figure 2.
Velocity profile across the boundary layer.
This modification introduces an offset in the velocity profile with respect to the universal log-law, being suitable for any roughness condition. The value of has been widely investigated for different flow and roughness conditions [22] but it has been usually considered as a constant instead of a function of roughness, limiting the applicability of the universal log-law. Considering as a roughness-dependent function, Ligrani and Moffat [23] also proposed an analytical expression for the function with similar results to Equation (10) that could be equally applicable. Both formulations are the result of experimental data and studies (e.g., [24]). Figure 2 shows the different regions inside the boundary layer. Since the characteristically thickness of a turbulent boundary layer is small compared to the out flow field, a huge number of grid cells would be necessary to numerically simulate the whole boundary layer. Similarly to Kean et al. [17], to reduce the complexity of the numerical problem and the number of grid points required in the calculation, the boundary conditions are not specified just on the wall but are applied at a distance from the wall. However, instead of applying the law of the wall at a fixed distance according to Kean et al. [17], which may be incorrect depending on the roughness, the new method eliminates the laminar viscous sublayer and buffer zone from the numerical domain, imposing the velocity obtained from Equation (9) as boundary condition at . This approach allows leading with a spatial distributed roughness but does not explicitly consider the presence of isolated rough elements [17] or the influence of the microtopography of the bed [25]. However, the mean effect of those elements could be modeled by adequately modifying the equivalent bed roughness.
Traditionally, the most employed method to obtain the value of the shear velocity and therefore the velocity boundary condition, used for instance by the authors of [11,17,18], apply the momentum balance over each portion of the flow between adjacent rays. In that case, the streamwise component of the weight of water of the considered portion is compensated by the local bed shear stress acting over the length in contact with the rigid contour, which can yield to an overestimation of bed shear stress if free surface stress is not considered. Unlike the above methods, we propose an alternative methodology to estimate the local shear velocity. Instead of applying the momentum balance over each sub-area, which requires considering the velocity distribution over the whole cross-section, the new approach only uses velocity close to contours, reducing the computational effort. As long as Equation (9) is valid for the range , as shown in Figure 2, and the numerical model domain is defined for , there is an overlapping zone where the numerical and analytical results should be similar (). Hence, once the numerical velocity distribution is known, the only value to be adjusted is the local shear velocity . It can be obtained by making the numerical and theoretical solutions compatible and consistent by means of an objective function which minimizes the difference between both solutions of the velocity profile within the fitting length for each individual ray.
2.3. Boundary Condition at the Free Surface
Since fluid particles located at the free surface move at a certain velocity, the air just in contact with the free surface will generate a drag force. This wind shear at the air–water interface leads to momentum transfer and vertical turbulent mixing in the water body [26]. The wind shear stress, , can be parameterized as
where is the empirical non-dimensional drag coefficient for z height, is the air density and is the difference between the free surface velocity, , and the streamwise wind velocity at some specified height above the water surface, , typically at m. Wróbel-Niedźwiecka et al. [27] presented some of the most common drag coefficient formulae. For typical values of maximum streamwise velocity in open channels (), the classical parameterization proposed by Wu [28], valid within the range m/s is adopted here, being the drag coefficient given by
Additionally, setting Equation (11) equal to Equation (2), the following relationship can be written at the free surface (considered as an horizontal plane)
which is an implicit boundary condition for the derivative of velocity depending on the same velocity and the eddy viscosity at the free surface and the wind velocity 10 m over the water. If wind effect is neglected assuming , Equation (13) becomes the classical slip boundary condition () leading to maximum velocities at the free surface.
3. Computational Method
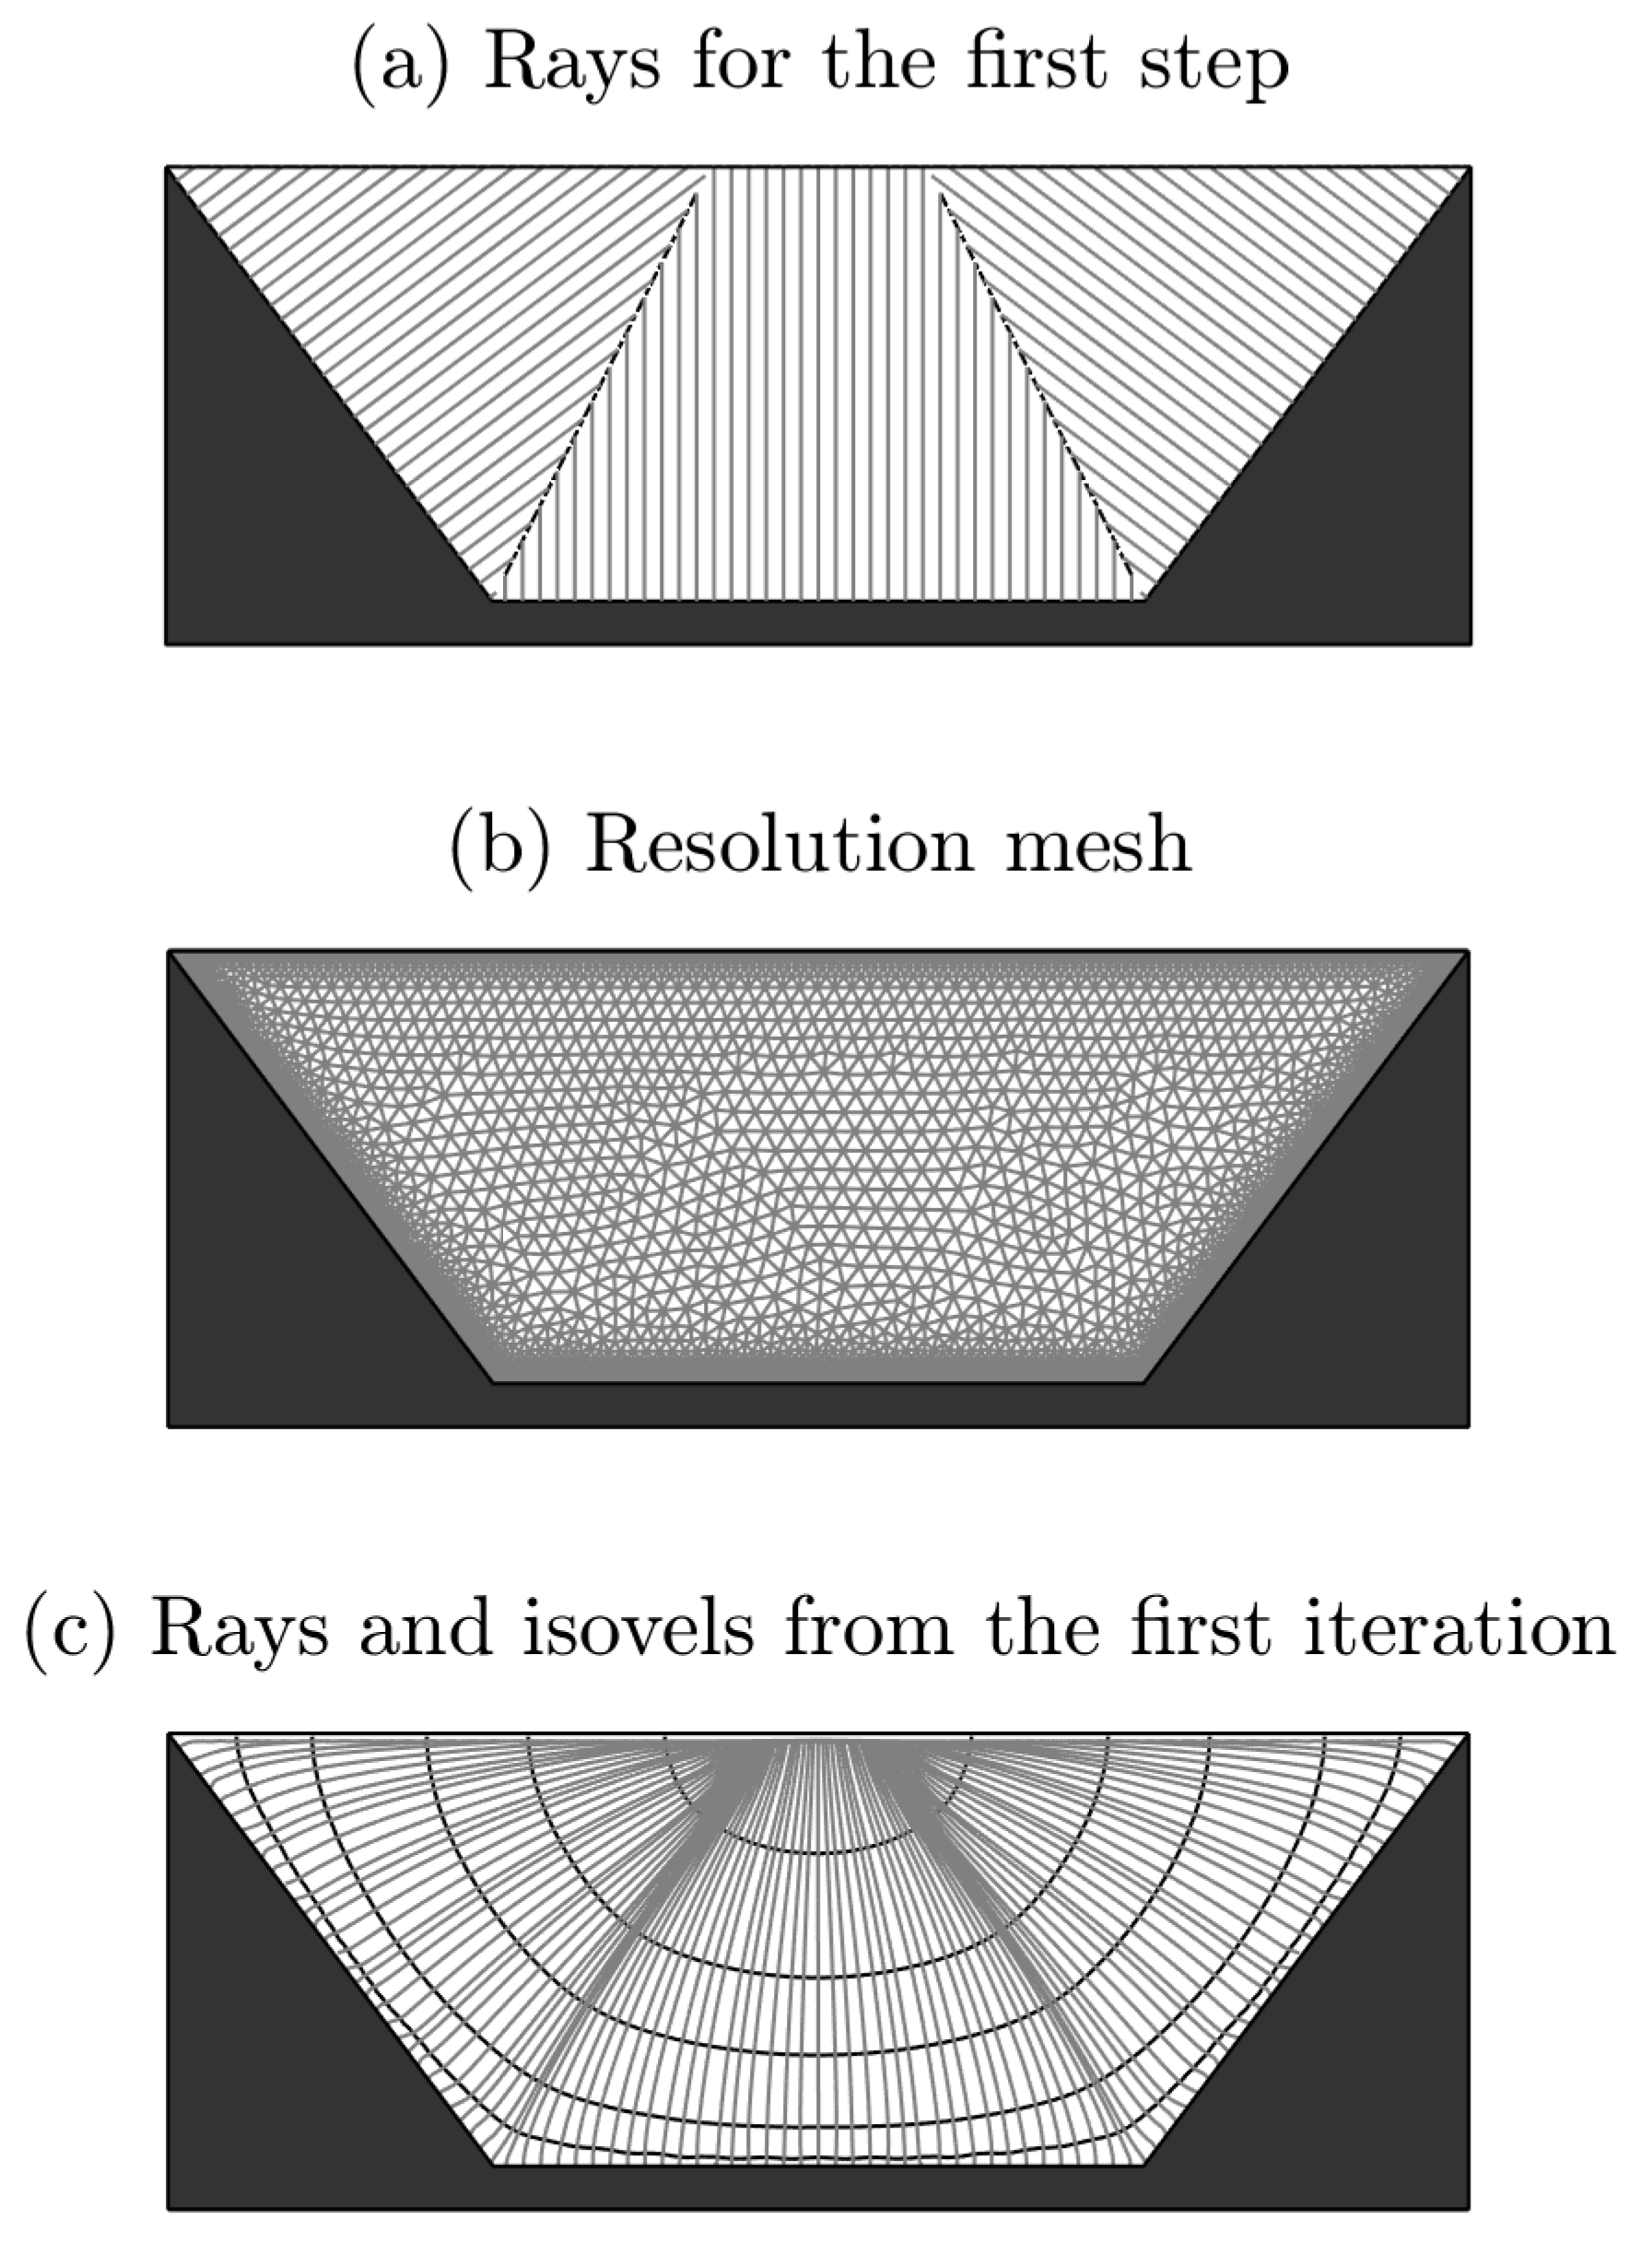
The proposed method uses a module to numerically resolve the governing PDE in the defined domain using the finite element method together with error control. In this case, the numerical iterative procedure is developed combining Matlab and FlexPDE [29], but any other appropriate software to solve PDE can be employed. FlexPDE allows the user to define the problem in a high level language, specifying the PDE in their strong form, unknowns, problem parameters, domain geometry and boundary conditions. It takes the problem to the weak formulation, performs a grid discretization (which can be automatically refined throughout the calculation according to the values adopted by the spatial gradient of the unknown), assembles the system of nodal equations and solves it without requiring the development and implementation of a specific code. FlexPDE subdivides the domain through an unstructured mesh of triangular elements and a more refined mesh is imposed only near the contours (rigid contours and free surface) to reduce the computational time (Figure 3b). To set the maximum mesh size near the rigid contours, the mesh should contain at least 10 nodes in the fitting length (see Figure 2) to be compared with the theoretical solution of the velocity profile. A relative error in velocity of was used for the computations. Matlab was used to build the FlexPDE files and perform the iterative process.
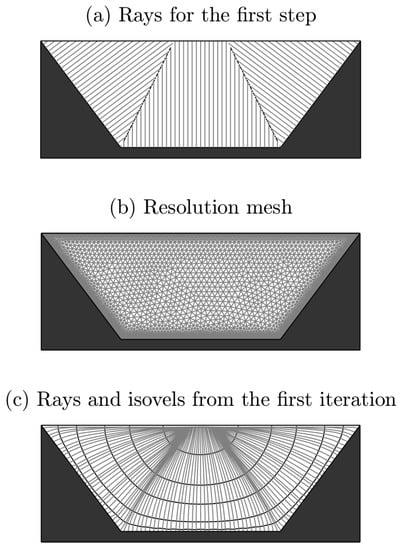
Figure 3.
(a) Rays for the first step using the MPM variation; (b) mesh used for the trapezoidal case; and (c) Rays and isovels using the velocity distribution obtain from the first iteration.
To solve the problem, Equation (4) together with boundary conditions (9) and (13) are considered. The input parameters of the model are the cross sectional geometry, the roughness distribution at rigid contours (), the hydraulic slope () and the wind velocity () if not negligible. Since there are several parameters dependent on the velocity distribution (unknown a priori), such as or , an initial value must be provided for them. For the first step, the shear velocity has usually been assumed as constant along the wetted perimeter attending to the mean bed shear stress given by with being the hydraulic radius. For the proposed methodology, a simple variation of the Merged Perpendicular Method (MPM) [30] to compute the local shear stress for the first step is adopted. The wetted perimeter is discretized in points and the shear stress is computed by being the distance between each point and either a bisector or free surface using the lines normal to the wetted perimeter (Figure 3a). This method provides a better initial approach of the boundary shear stresses reducing the number of required iterations. Additionally, the spatial distribution of rays and isovels is required to get the distance from the boundaries to any point and so the eddy viscosity distribution. For the first step, these lines normal to the wetted perimeter are assumed as rays to calculate the eddy viscosity in the whole domain. Therefore, the PDE for the first iteration can be solved.
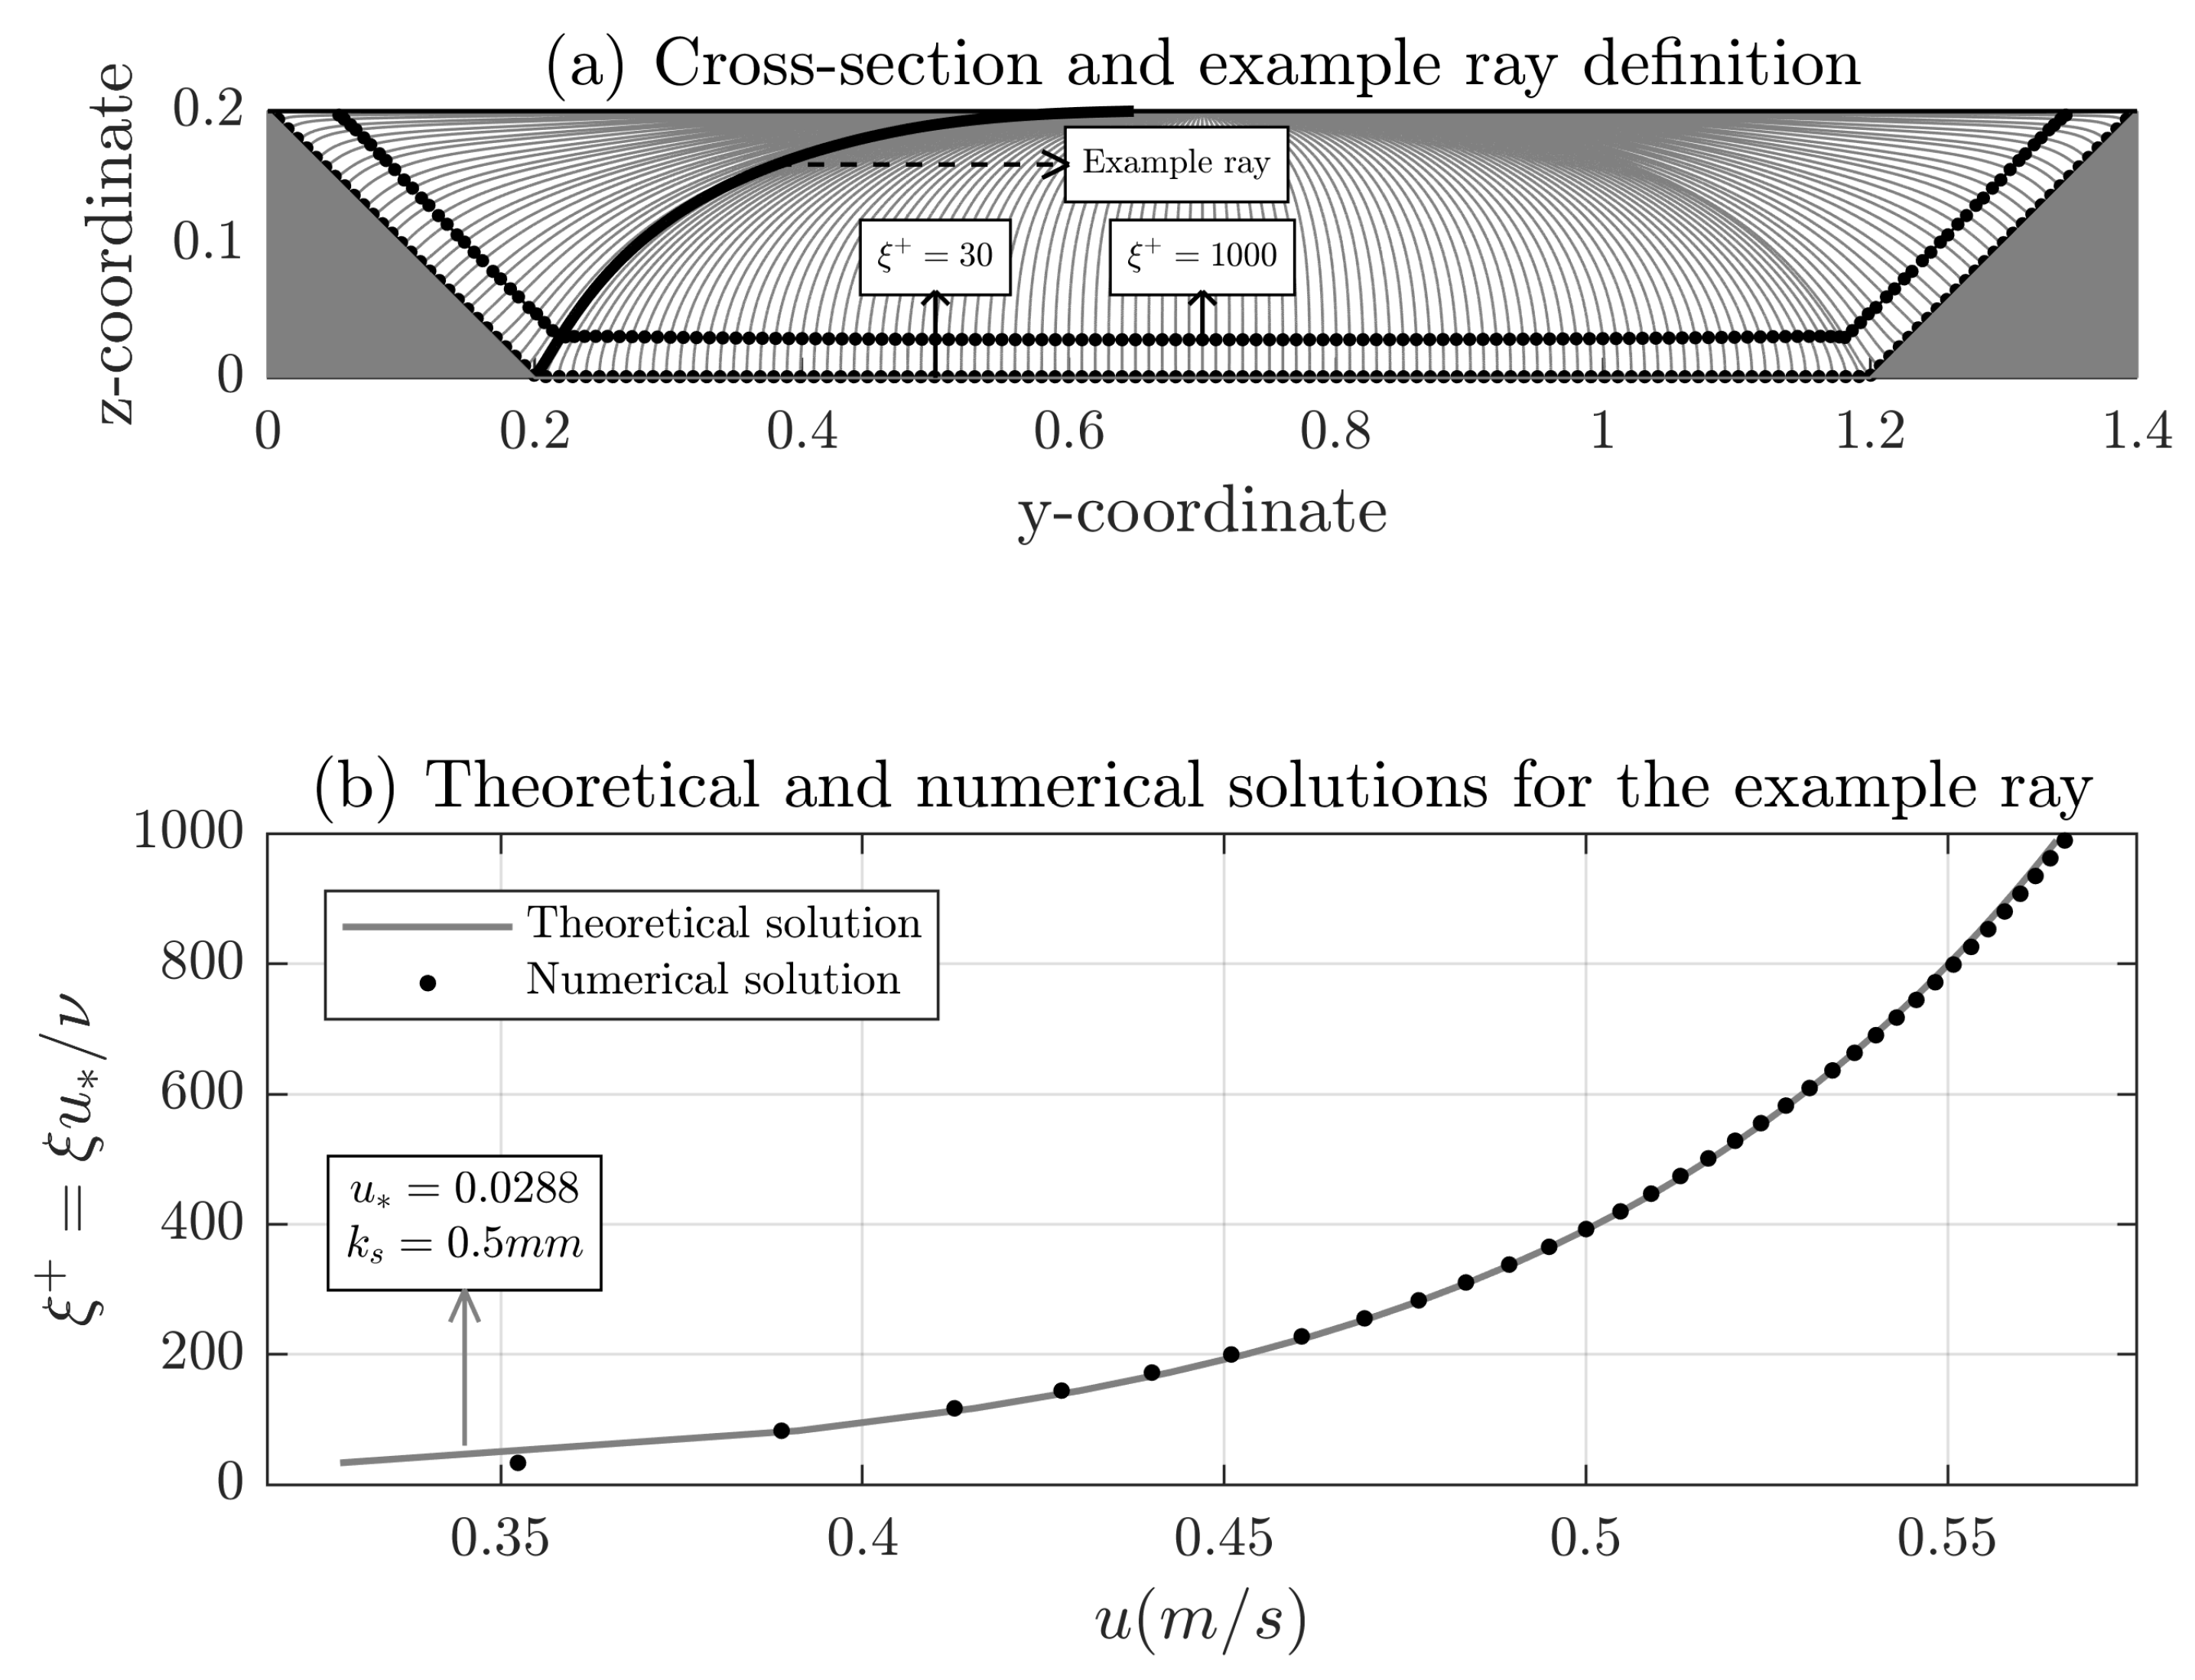
Once the velocity distribution for the first step is settled, the new rays and isovels are computed (Figure 3c) in addition to the distances measured along the rays (d and h in Equation (5)). The shear velocity is then obtained at any point by means of an objective function which minimizes the difference between the numerical results and theoretical velocity profile within the fitting length along the corresponding ray. Figure 4 shows both velocity profiles after the adjustment procedure for a specific ray. In that example, applying Equation (9) with the adjusted value of the shear velocity () yields a theoretical profile close to the one obtained with the numerical model. From the adjusted shear velocity for each ray, the boundary shear stresses are easily calculated.
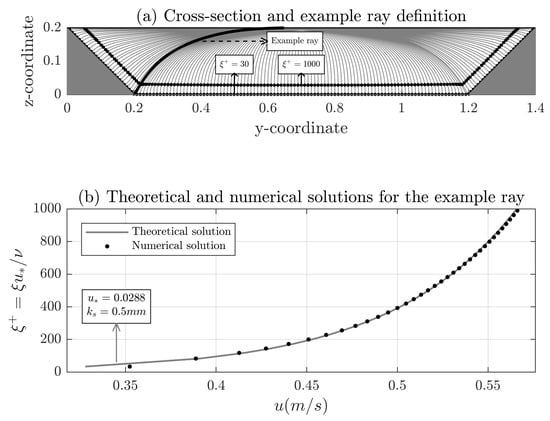
Figure 4.
(a) Rays for the solution of a trapezoidal section and definition of the example ray; and (b) theoretical (; mm) and numerical solution for the example ray velocity profile in the fitting length.
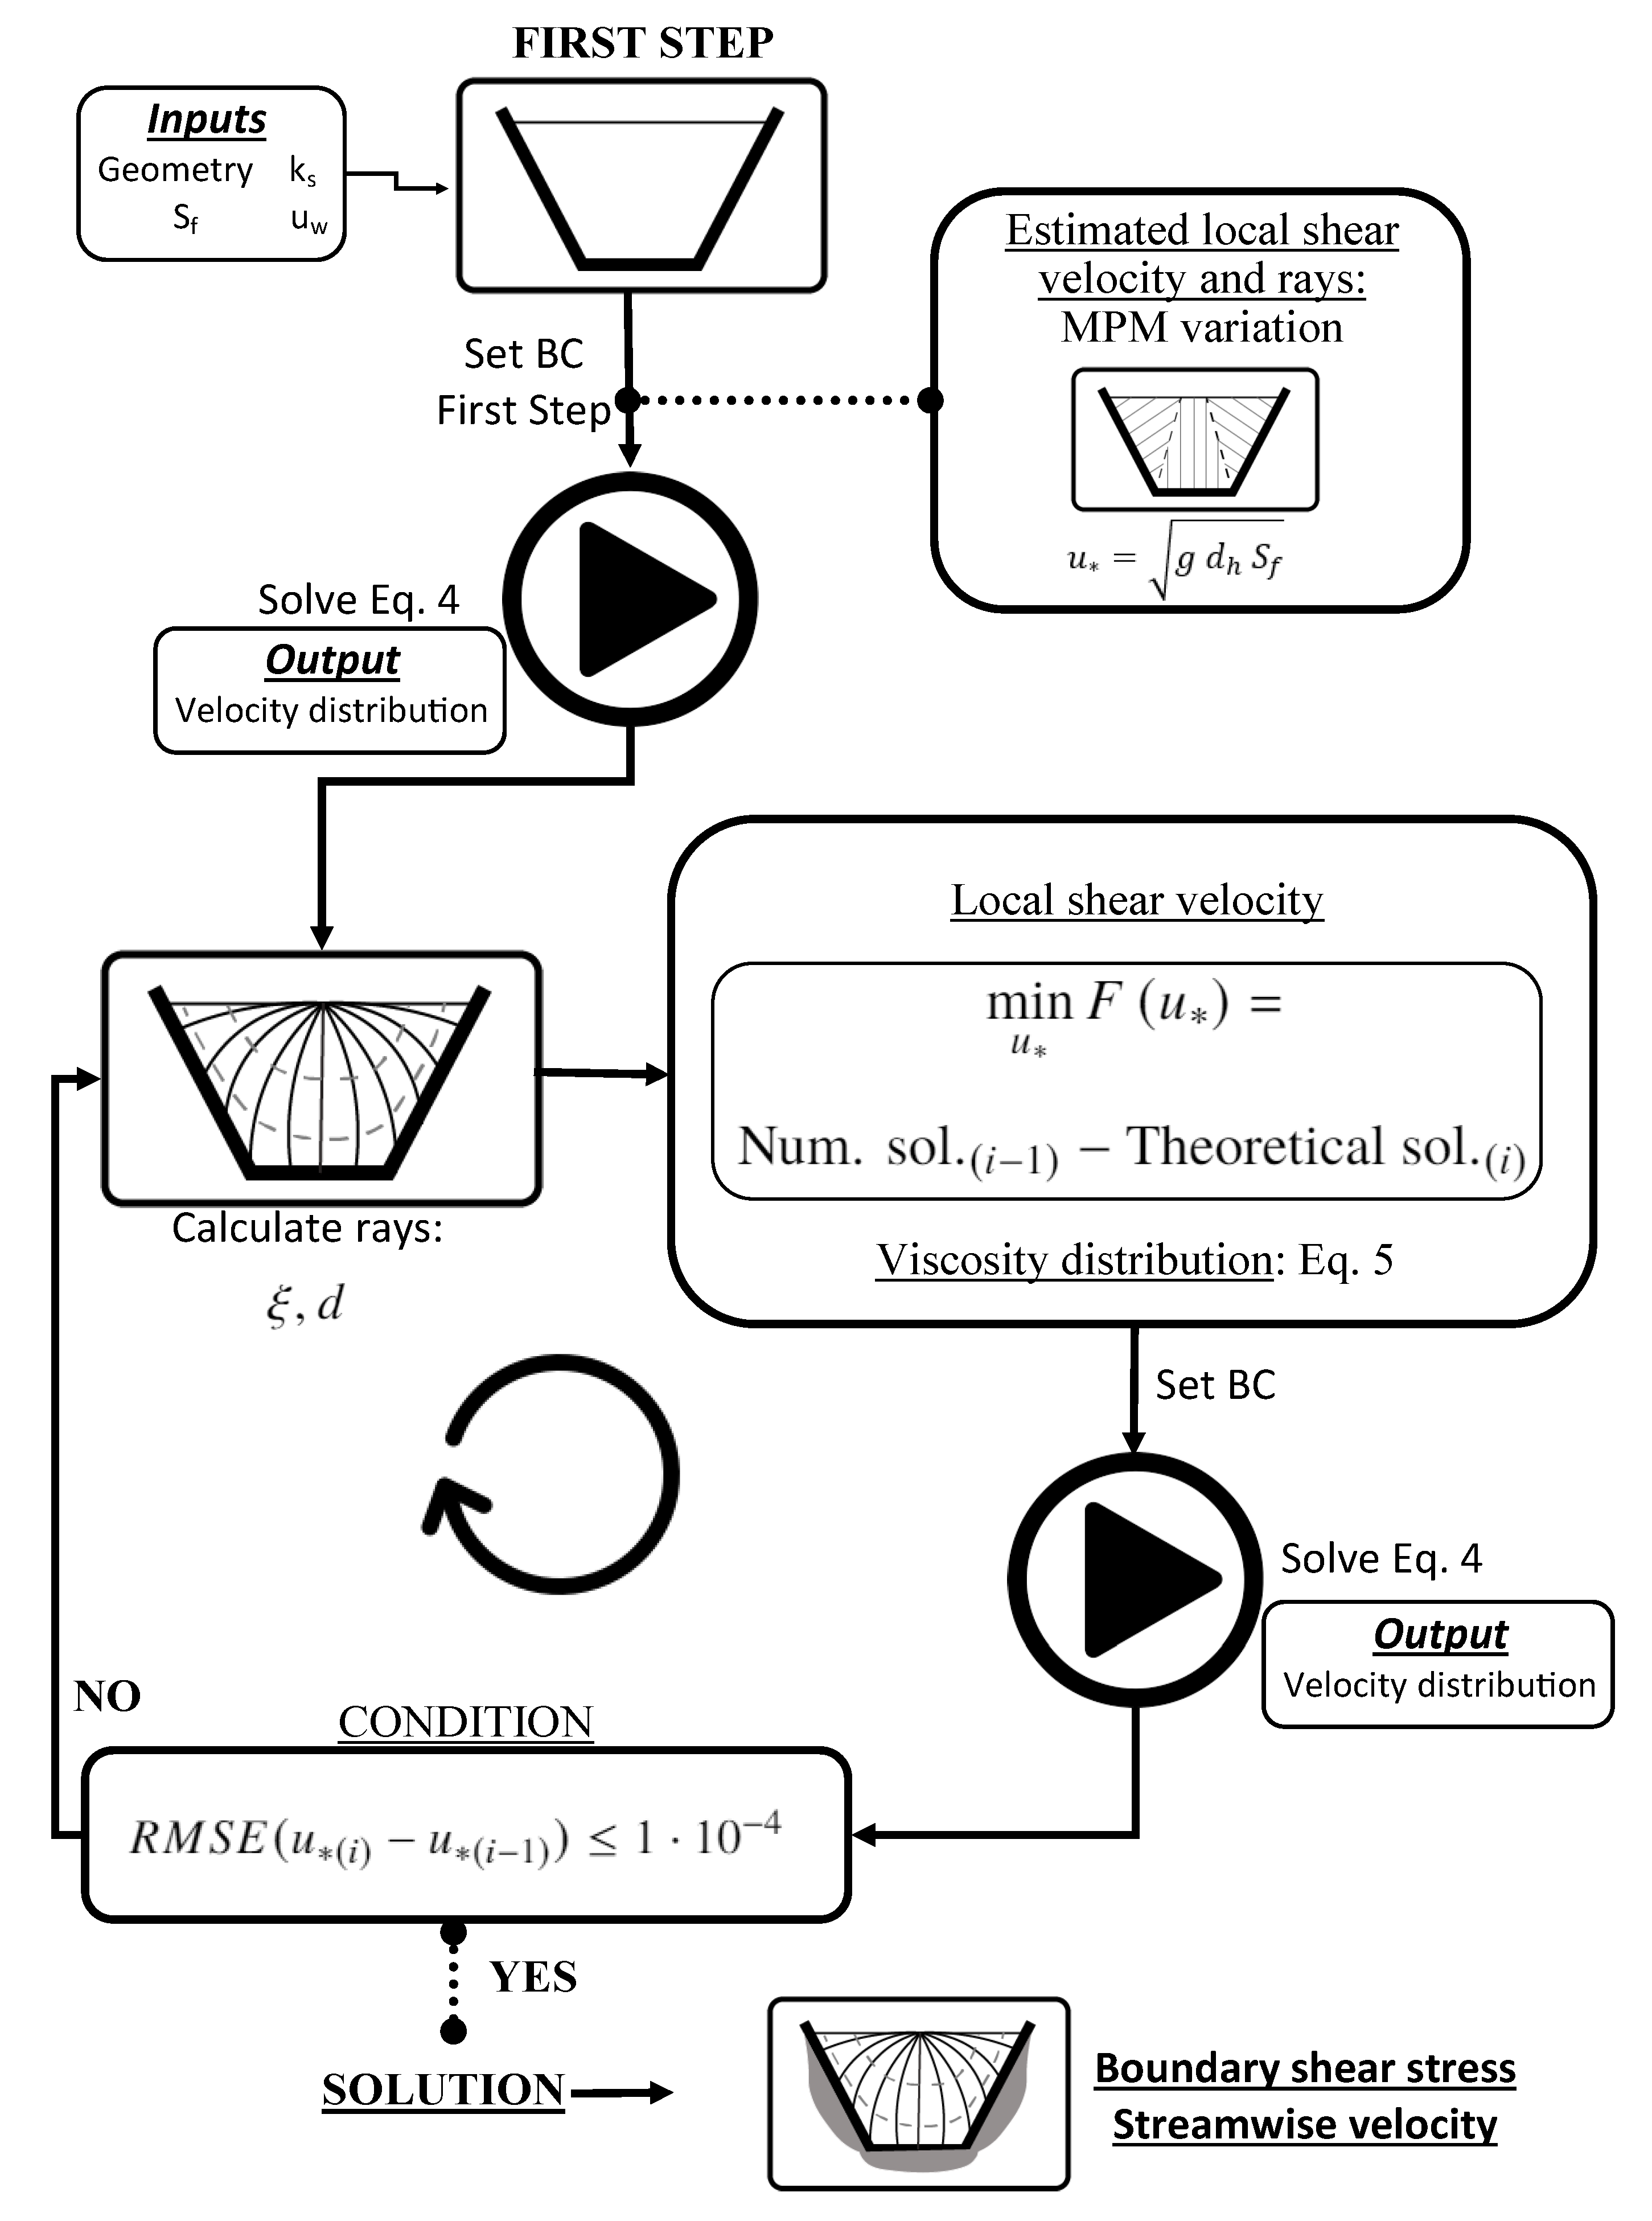
The next step consists of recomputing the velocity distribution with a boundary condition deduced from the shear velocity determined in the previous step. The iterative process continues until acceptable performance in terms of the Root Mean Square Error () between value for two consecutive iterations is reached. For all tests presented in following sections, the criterion was fixed. The flow diagram of the computation process with its inputs and outputs is shown in Figure 5.
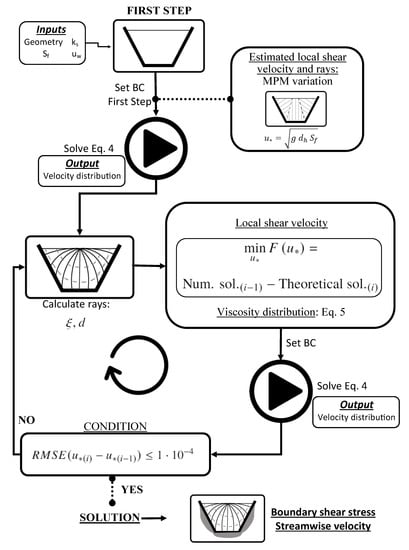
Figure 5.
Flow diagram of the computation process.
4. Model Validation
In this section, the numerical results are compared against experimental values available in the literature for both velocity and bed shear stress distribution in order to test the validity of the proposed modifications: (i) new procedure to obtain bed shear stress considering only near bed velocity distribution; (ii) definition of velocity boundary condition at a rough-dependent distance to the wall; (iii) eddy viscosity model without adjustment parameters; and (iv) inclusion of free surface shear stress due to the wind. Experimental data were selected to consider different cross section shapes and roughness conditions among the most used works, usually contemplated for validation purposes (see Table 1), considering null wind velocity (this assumption does not imply that free surface shear stress is null since there exists a relative velocity between water at the free surface and air) and null sediment transport rate, i.e., fixed bed. As a rule, grid spacing was chosen to obtain around 500 grid points along the wetted perimeter, around 100 grid points at the free surface and a total number of grid points of 2000–5000 (specific values of grid spacing for each simulation are shown in Table 1). Regarding the values adopted for the roughness, for those cases with no values provided in the original work, for smooth and for rough cases were adopted.

Table 1.
Experimental cases employed for comparison purpose, where is the pipe diameter (circular), is the longitudinal slope, is the roughness, is the water depth, is the base width, is the sidewall slope (trapezoidal), is the water surface width (compound), is the grid spacing along the wetted perimeter and is the grid spacing along the free surface.
4.1. Streamwise Velocity
The proposed method is tested for a wide range of flow conditions using the measured velocity distribution in circular, rectangular, trapezoidal and compound channels. The experimental values have been obtained by scanning the images with at least 200 points of control. For these points we can define the velocity error, , as the root mean square of the differences between numerical and experimental values of the streamwise velocity.
4.1.1. Circular Channels
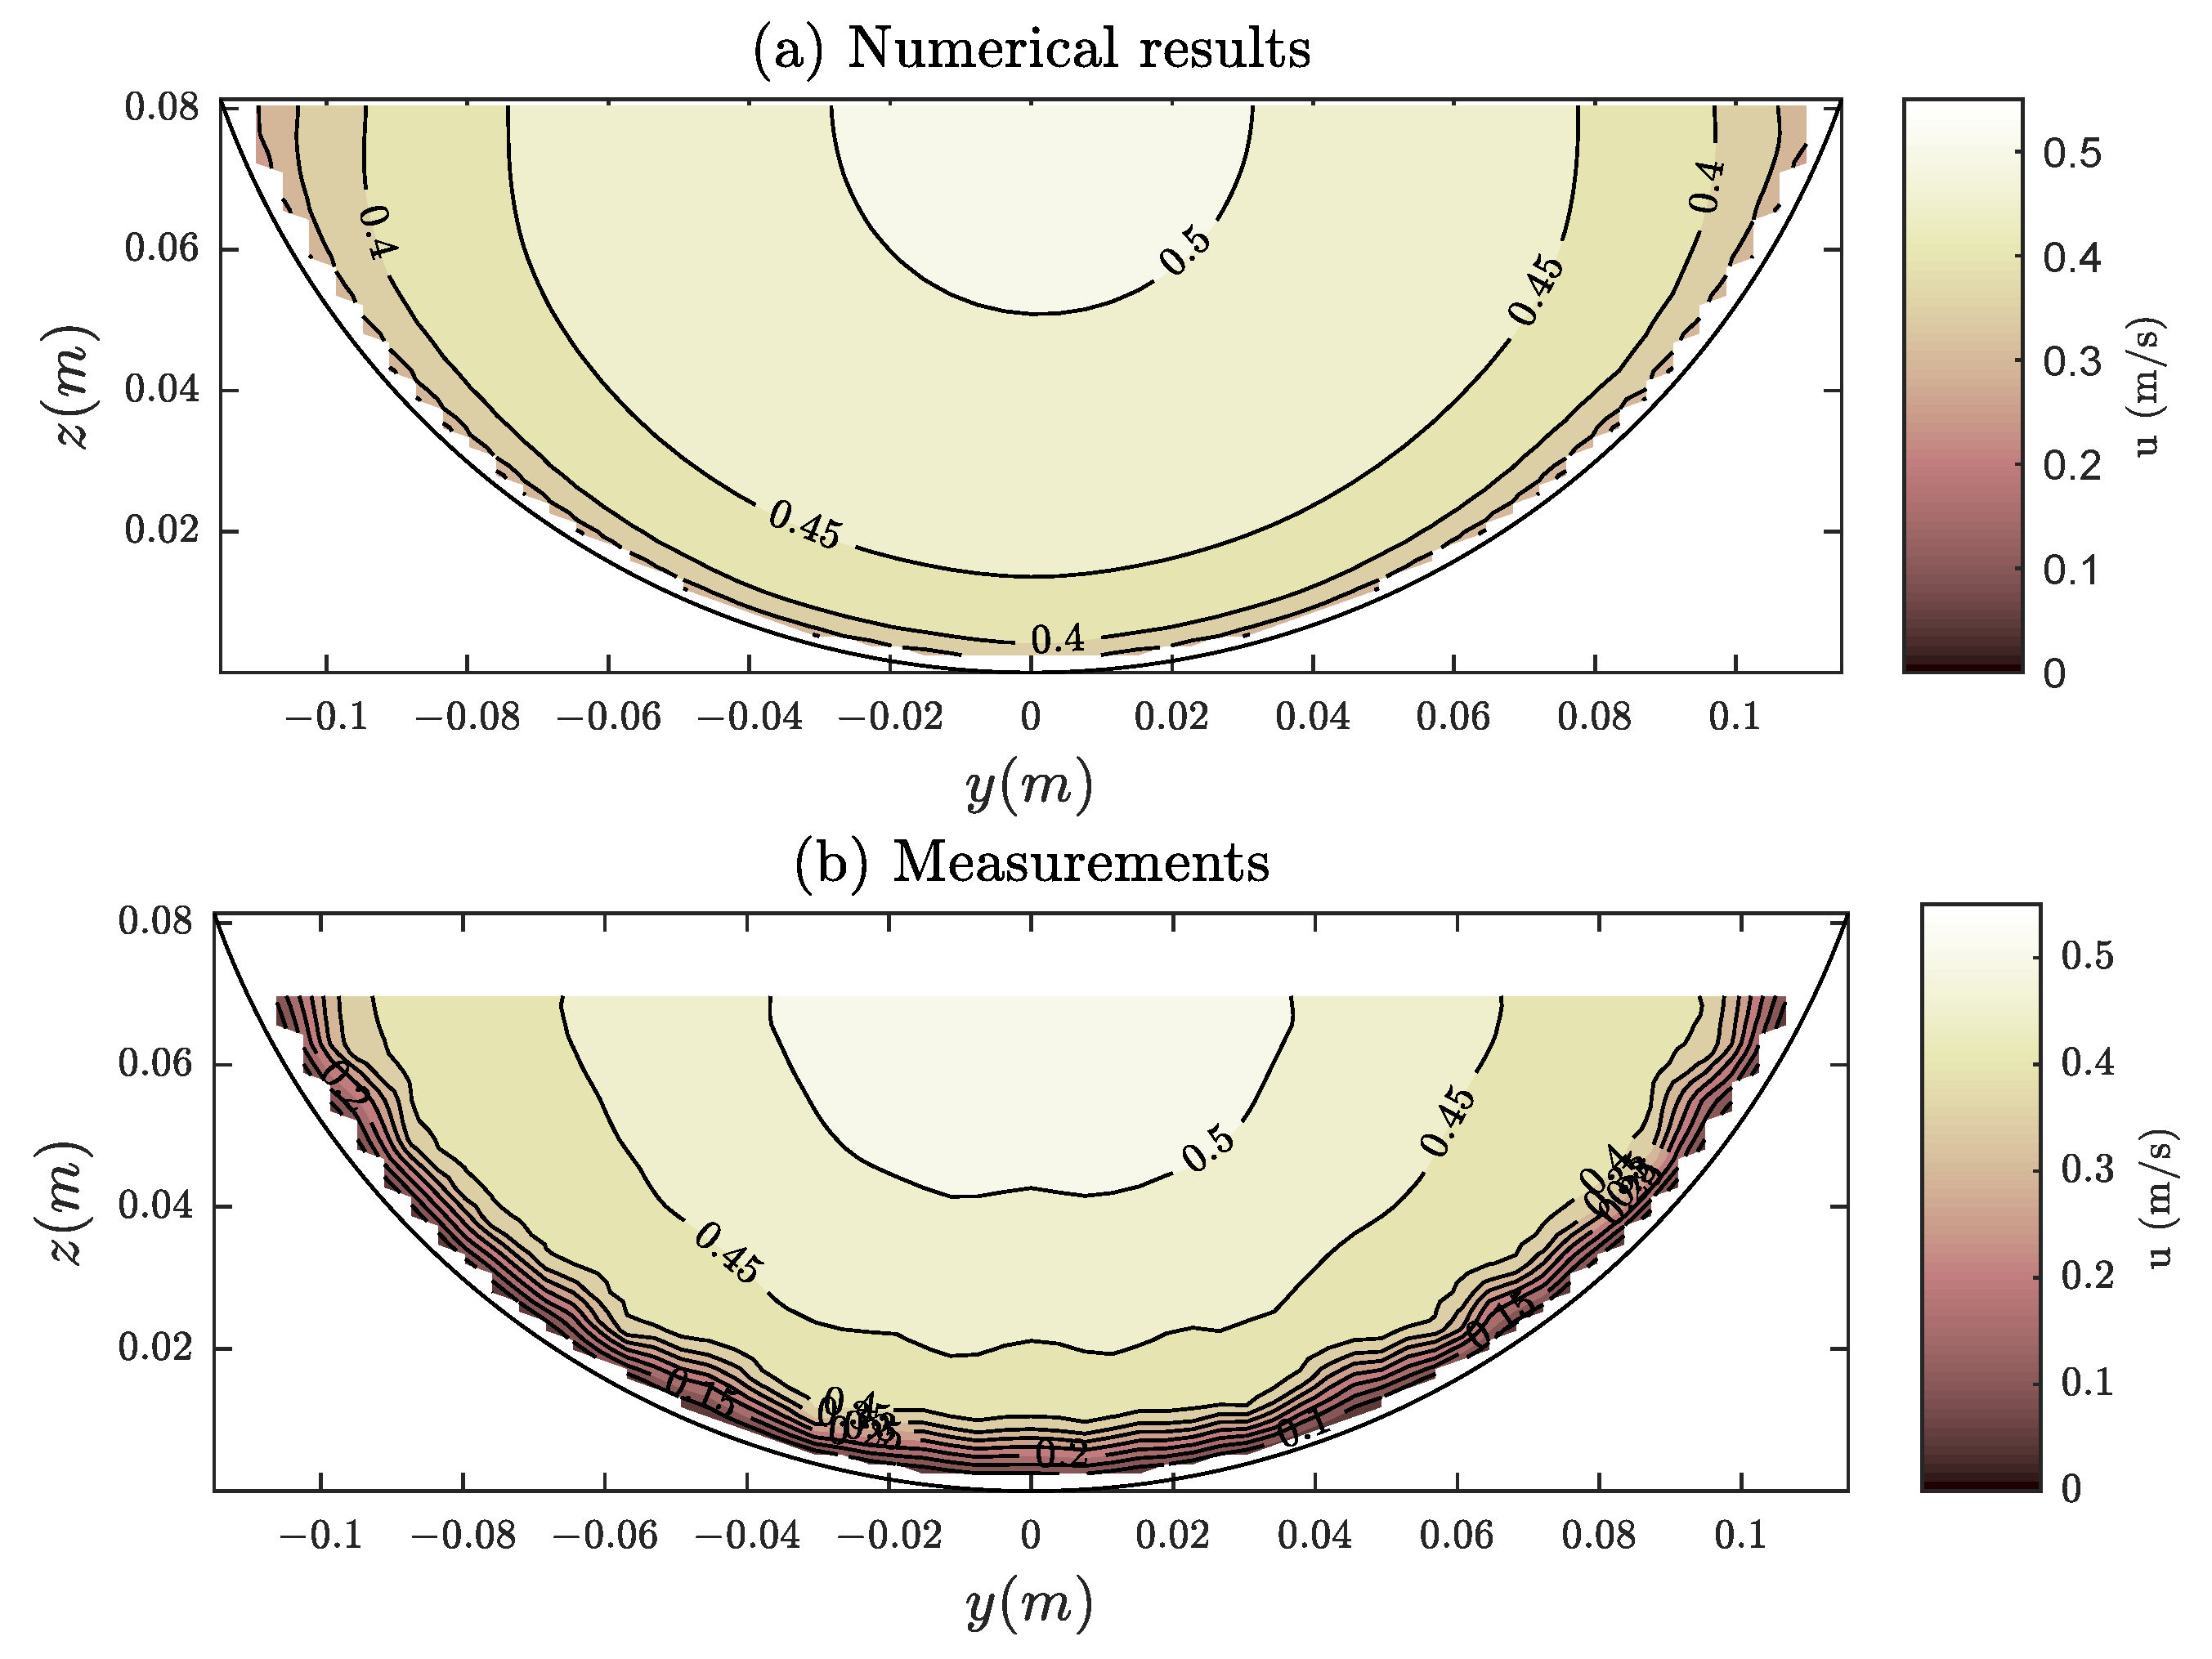
Knight and Sterling [31] carried out some experiments on a partially full smooth pipe with an internal diameter m and longitudinal slope . The experimental data show that the maximum velocity core is located below the water surface mainly due to secondary flow, as shown in [39,40,41]. As the model does not consider this phenomenon, the experiment in which the maximum velocity core is close to the water surface, with a water depth m, is selected. Figure 6 shows the predicted velocity distribution compared with the experimental data. In general, there is a good agreement between the numerical results and the measurements, being the differences located near the boundaries and water surface, where the secondary flows causes the velocities to decrease. Notwithstanding these differences, both the velocity magnitude and distribution are quite similar, with m/s.
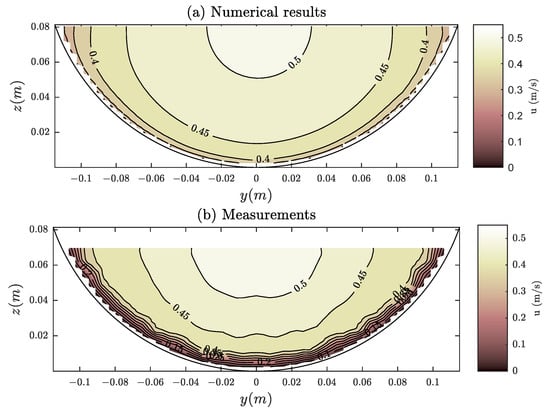
Figure 6.
Comparison of calculated and measured streamwise velocity distribution in a smooth circular conduit of the experiments of Knight and Sterling [31].
4.1.2. Rectangular Channels
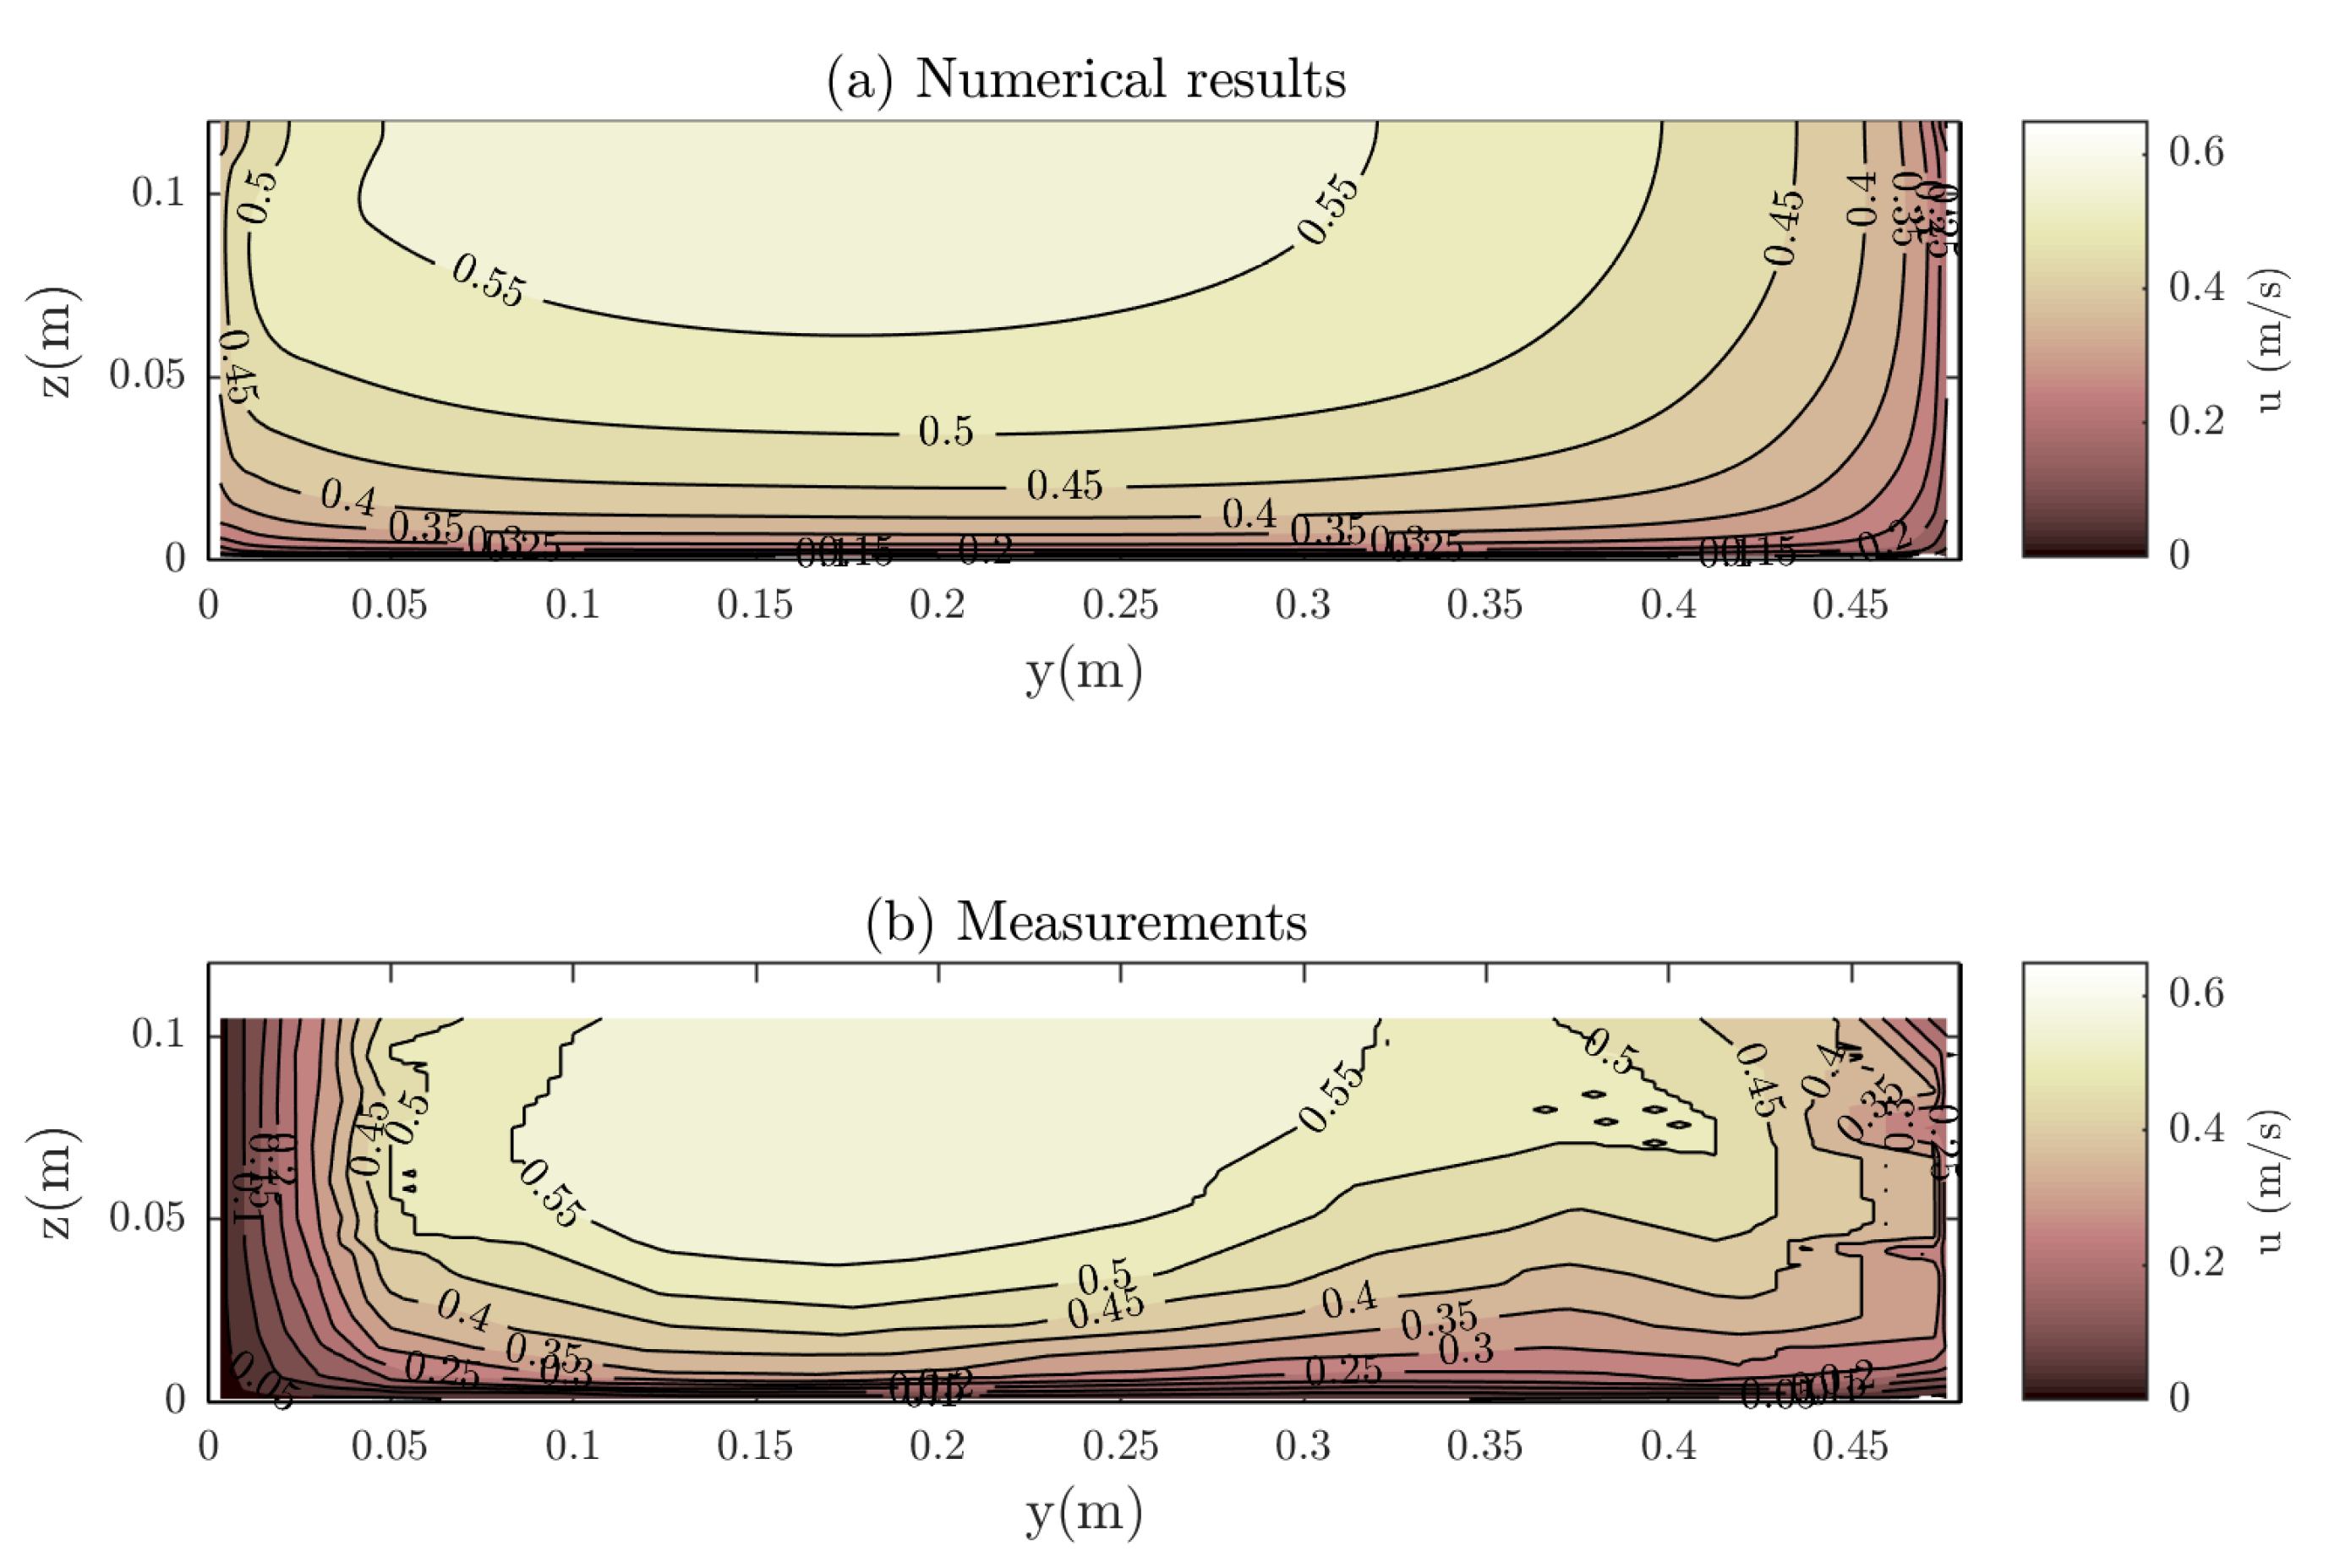
For rectangular channel with variable bed roughness, one of the experiments presented by Wang et al. [33] is here considered. The channel width was m and the water depth m. The bed slope is null and is deduced from the water surface profile (). The roughness of one wall and the bottom was about while the roughness of the other sidewall was , leading to the asymmetry of the flow, as shown in Figure 7. Despite this asymmetric flow distribution, the agreement of the results is good and both values and shape of the velocity distribution are correctly estimated ( m/s). The flow rate calculated by the model is whereas the measured one is , which means a relative error below .
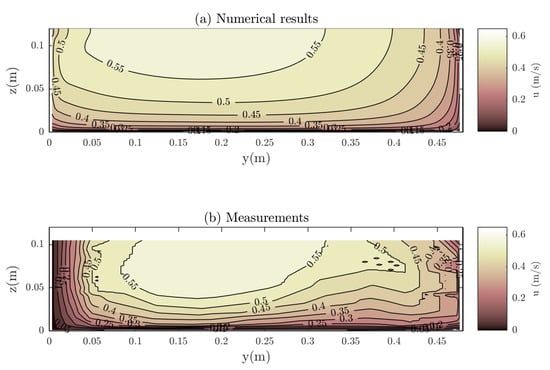
Figure 7.
Comparison of calculated and measured streamwise velocity distribution in a rectangular flume of the experiments of Wang et al. [33].
4.1.3. Trapezoidal Channels
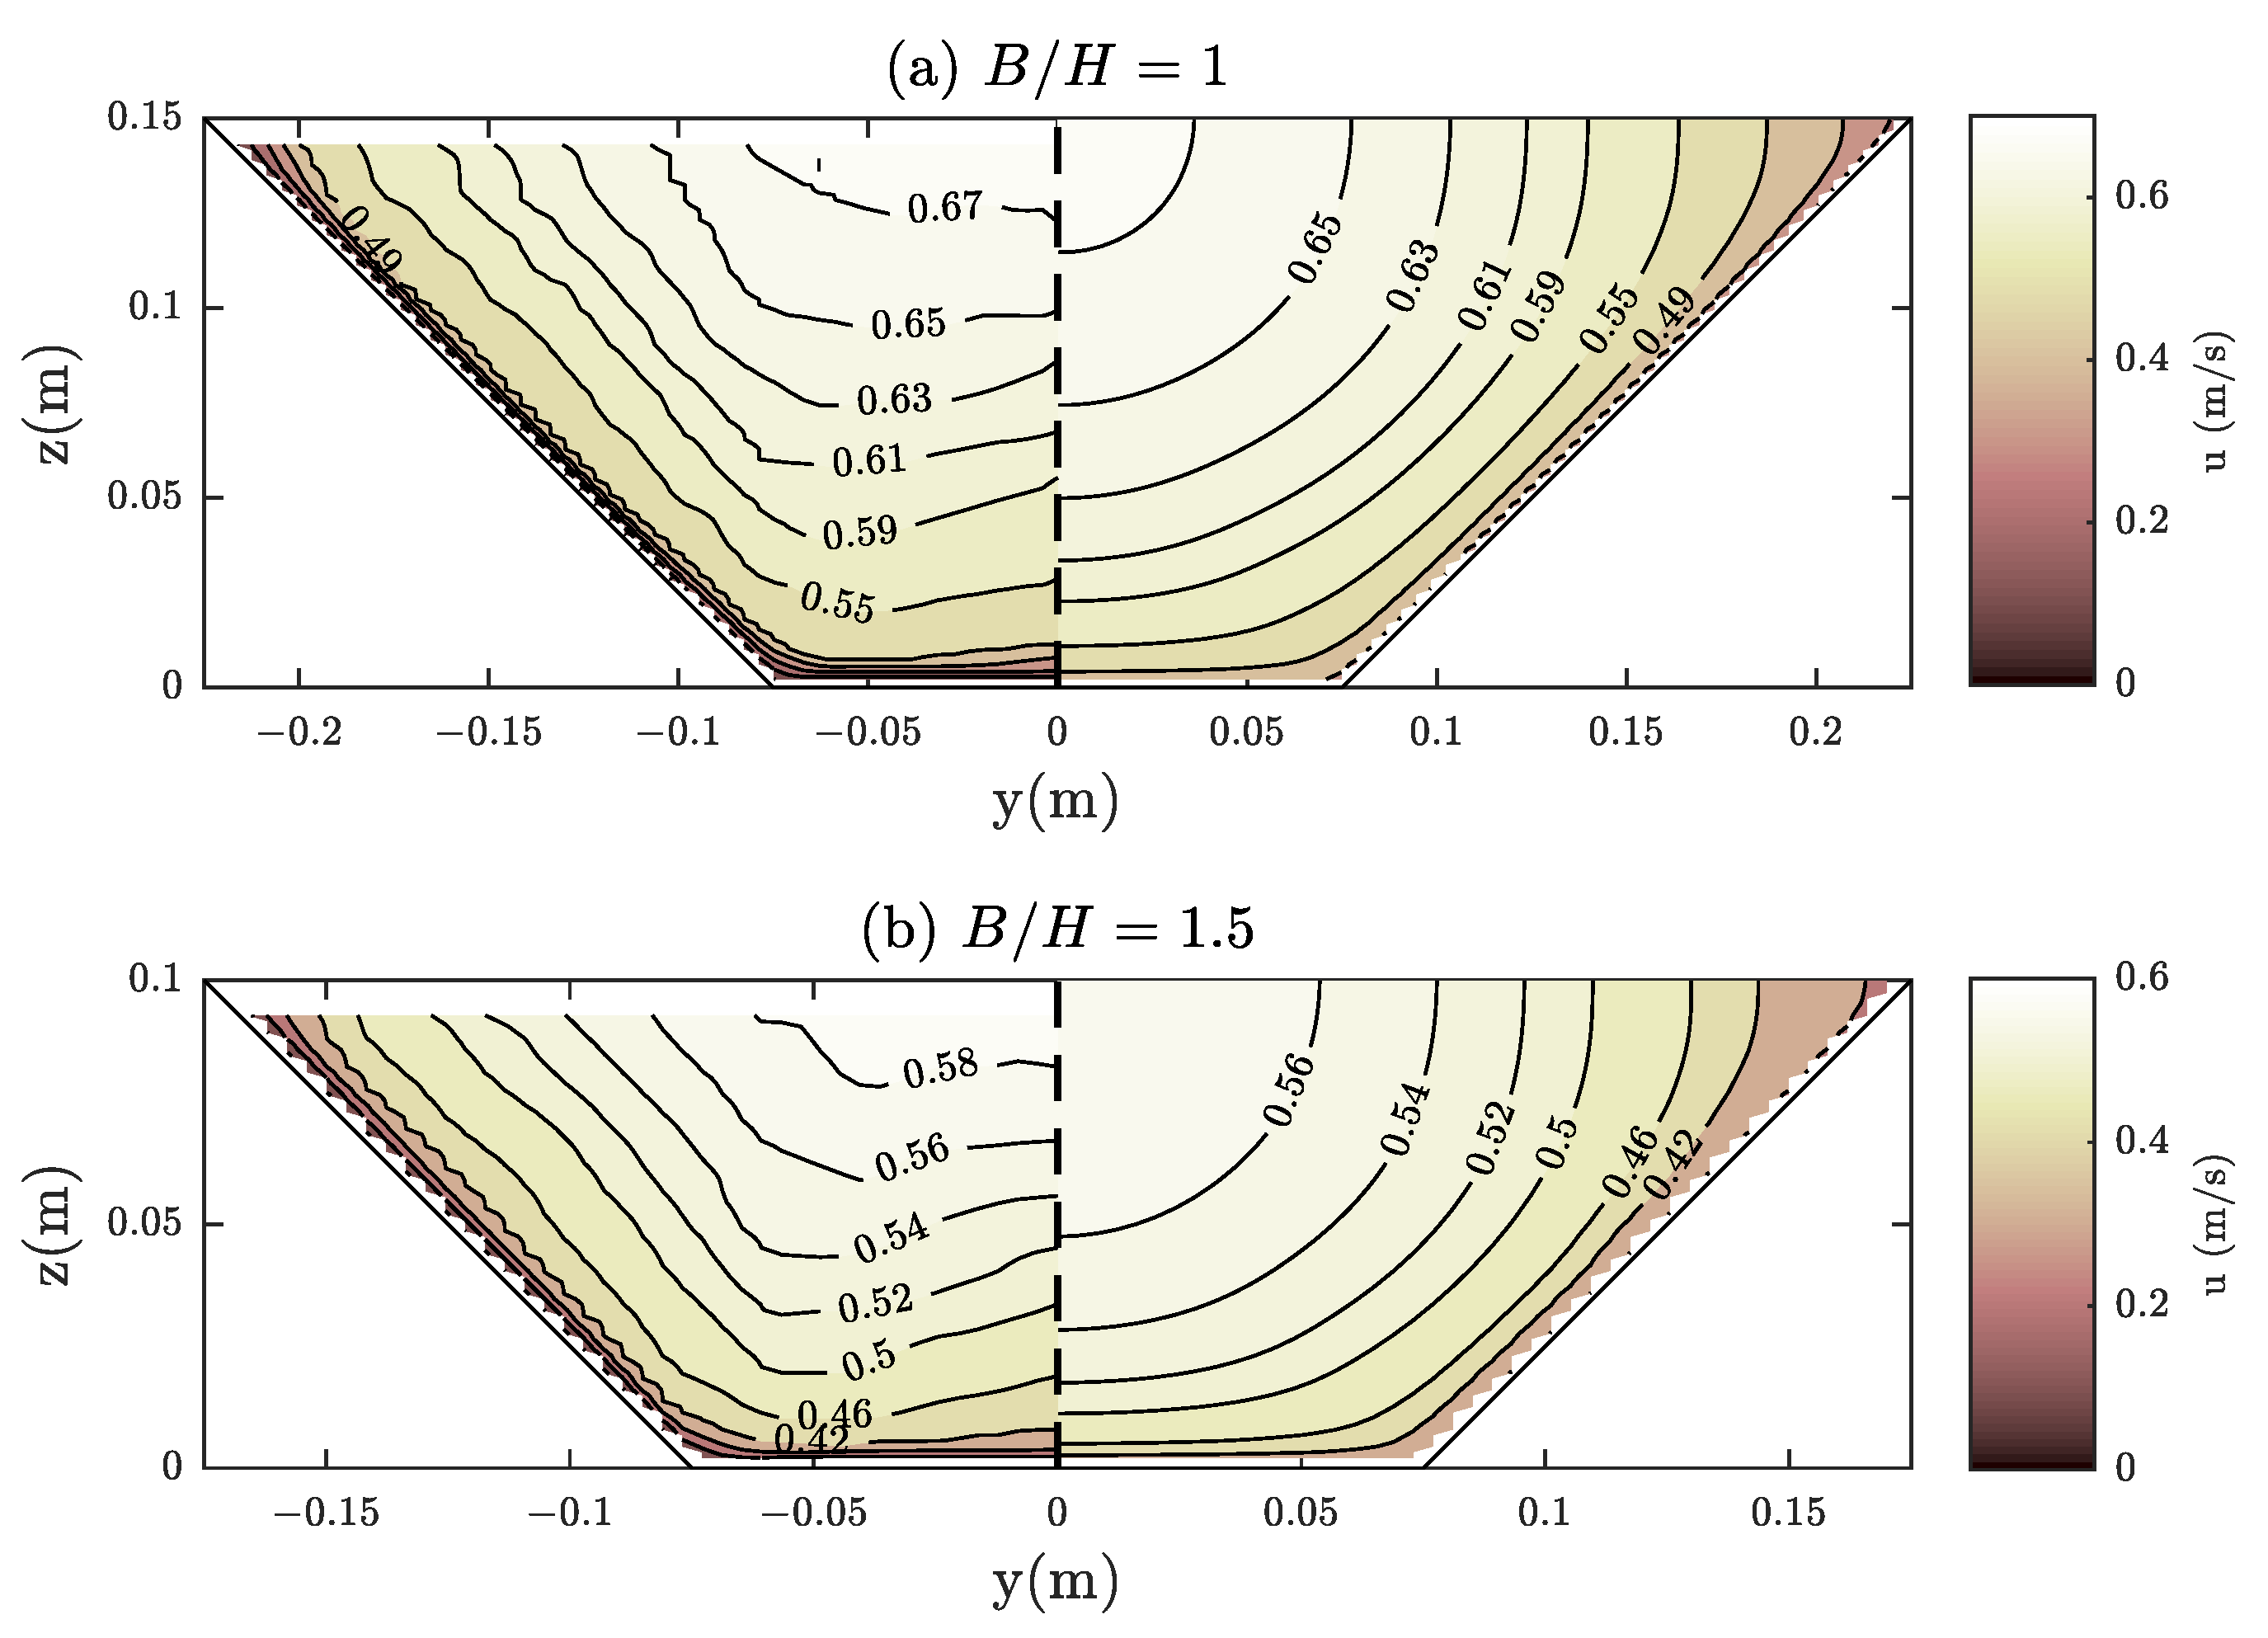
Yuen [35] performed some experiments for trapezoidal channels with different width-depth ratios. The main channel width was m and the sidewalls slope of 1V:1H with longitudinal slope . Two cases are numerically simulated, and , as shown in Figure 8. In both cases, secondary flows are negligible in the central region and hardly produces dip phenomenon, which encourages the good behavior of the model, which is in reasonable agreement with magnitude and structure of the measured field. For the first case, the error in velocities is m/s and the calculated discharge () is close to the measured one (, difference). For the second case, the calculated discharge is , whereas the measured one is , being the velocity error m/s.
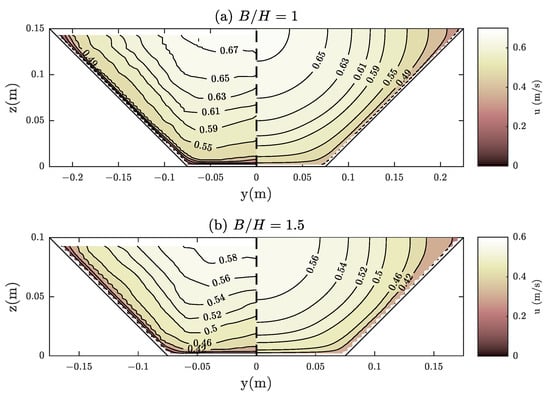
Figure 8.
Comparison of calculated (right) and measured (left) streamwise velocity distribution in trapezoidal channels of the experiments of Yuen [35]: (a) ; and (b) .
4.1.4. Compound Channels
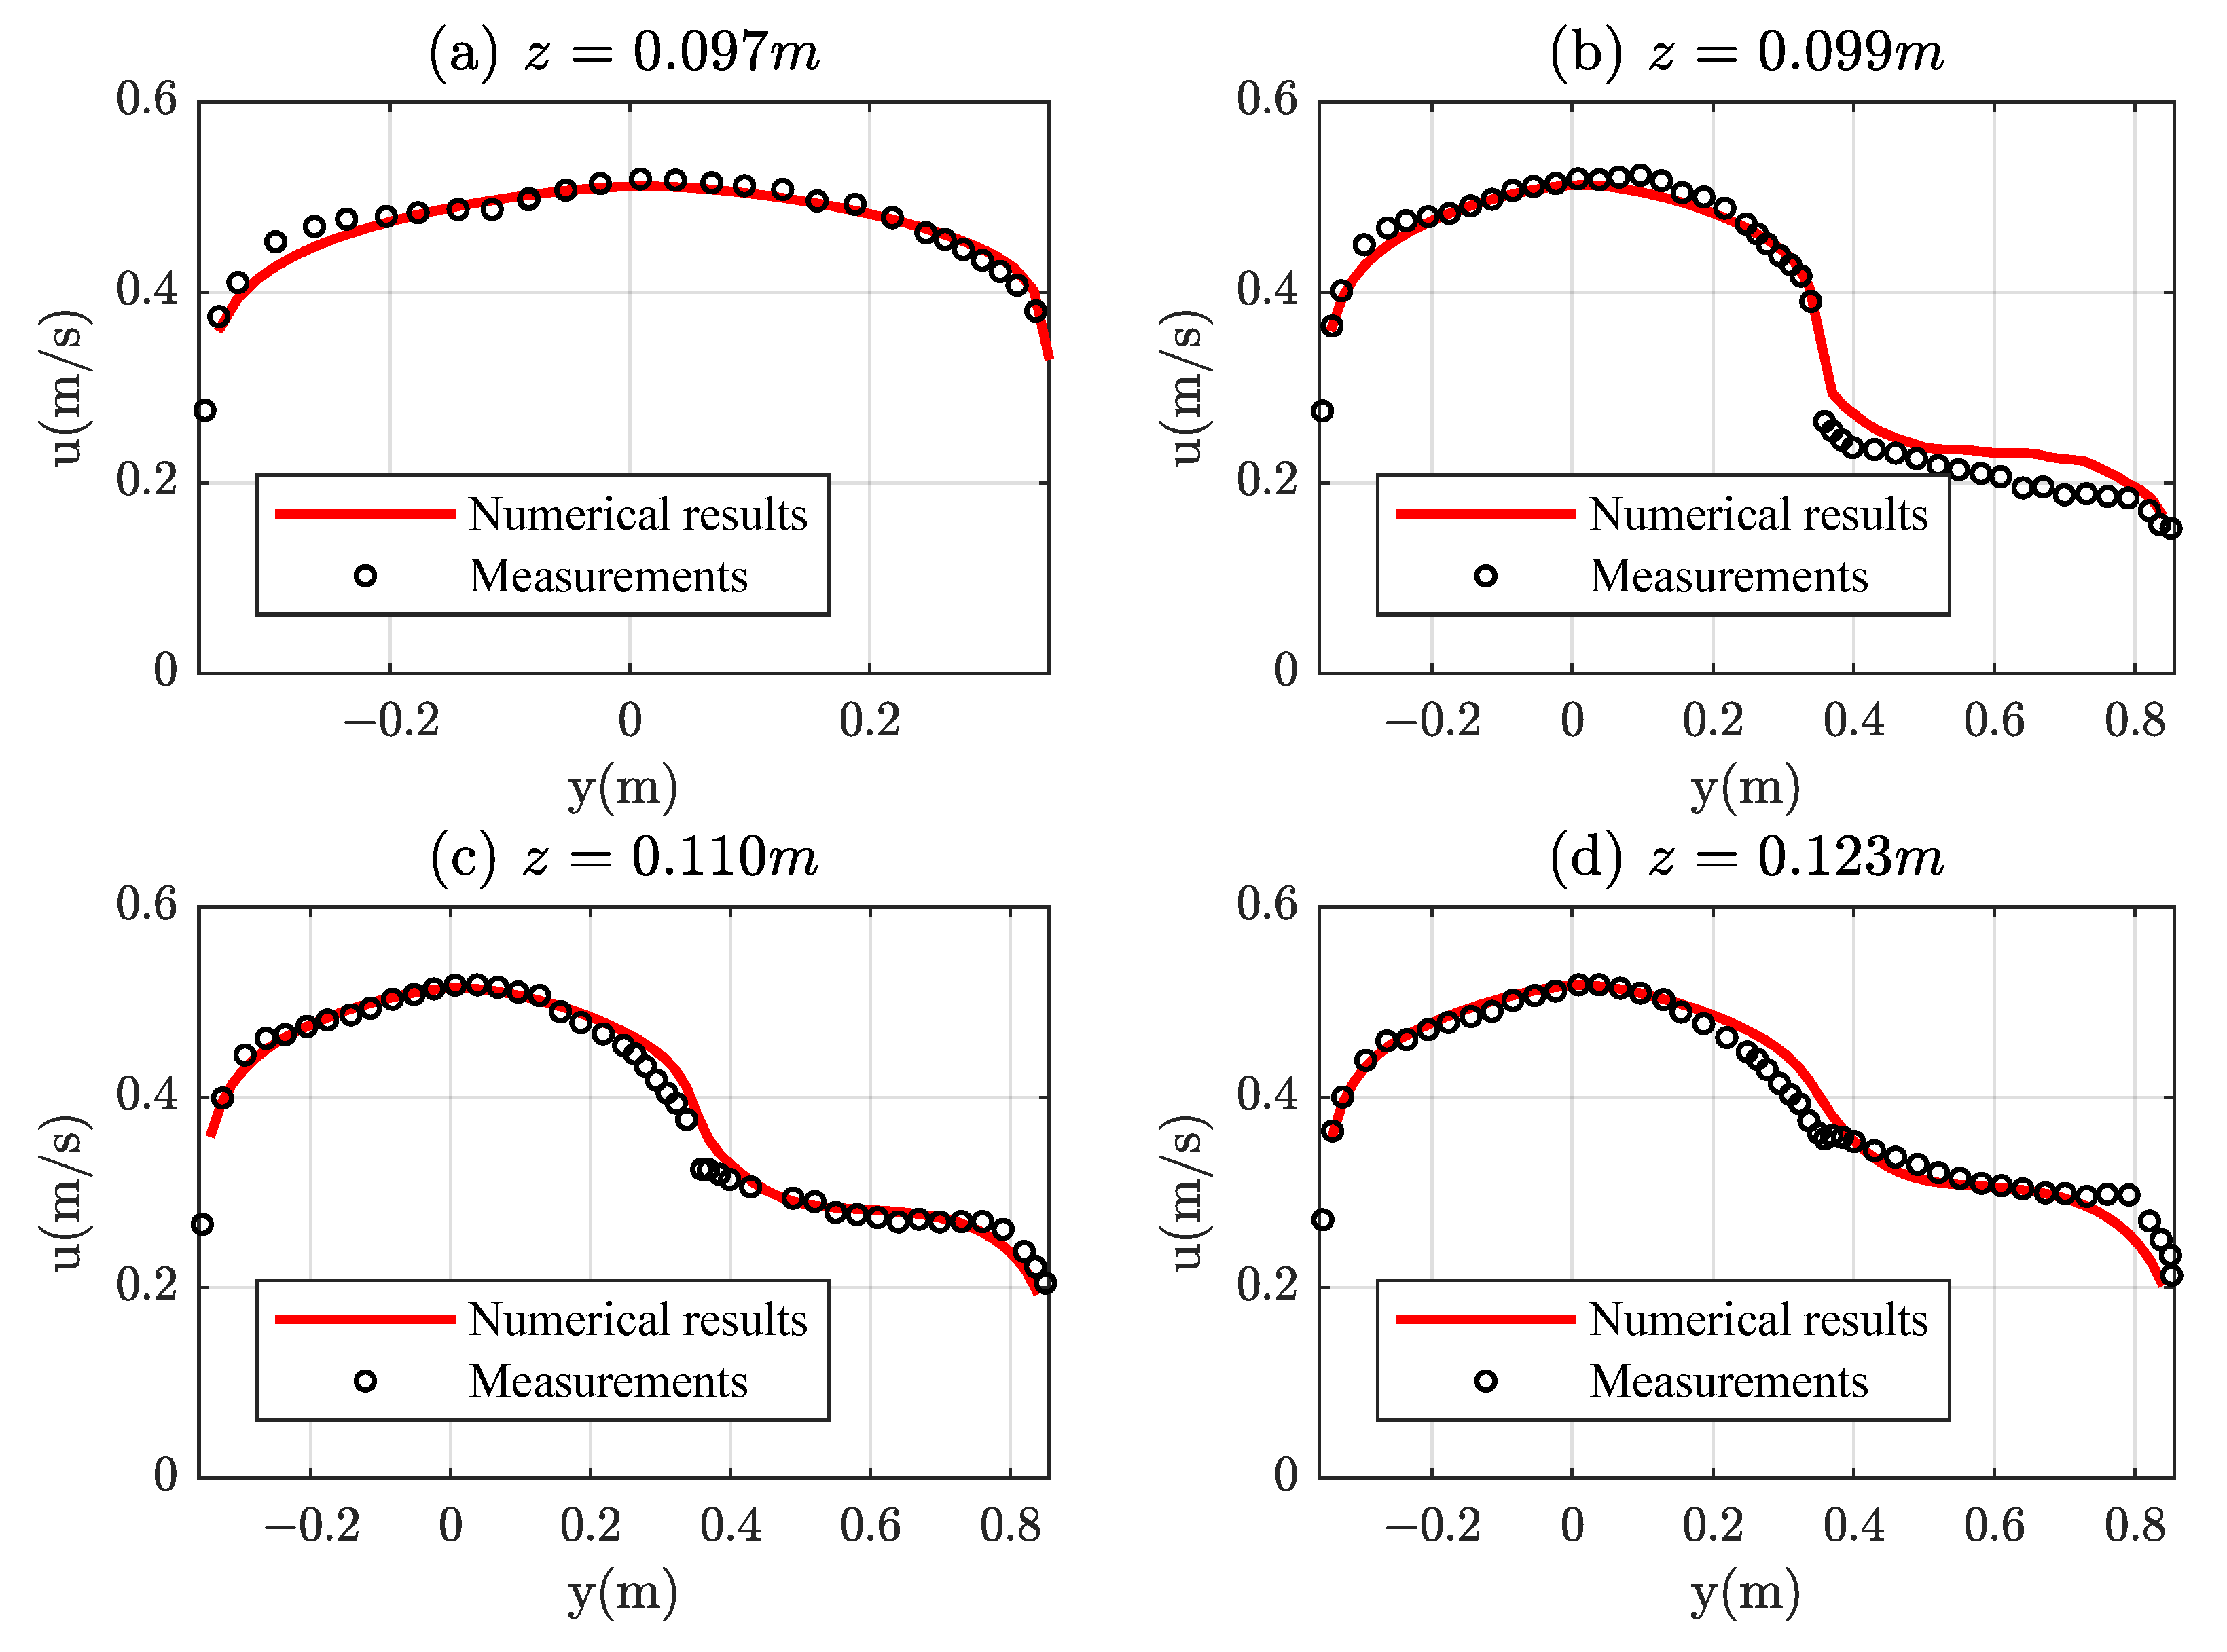
Finally, experimental tests from [17,38] on compound channels are considered. Rajaratnam and Ahmadi [38] carried out some experiments on an asymmetric channel with a width of m and made up by a m-wide main channel and a m-wide floodplain on the right side. All sidewalls were vertical and the floodplain height was m over main channel bed. Although no velocity distribution measurements were available, horizontal velocity profiles were measured at several heights ( m/s). The water depth for the selected test was m and the longitudinal slope . Figure 9 shows the horizontal velocity profiles predicted compared with the experimental data. In general, there is a high degree of congruity between computed and measured velocity in all the profiles.
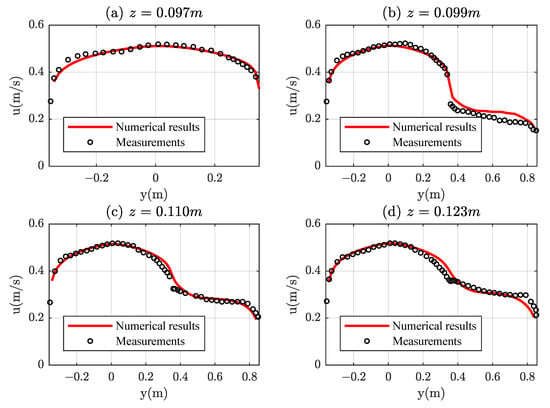
Figure 9.
Comparison of calculated and measured horizontal velocity profiles in a compound channel of the experiments of Rajaratnam and Ahmadi [38]: (a) m; (b) m; (c) m; and (d) m.
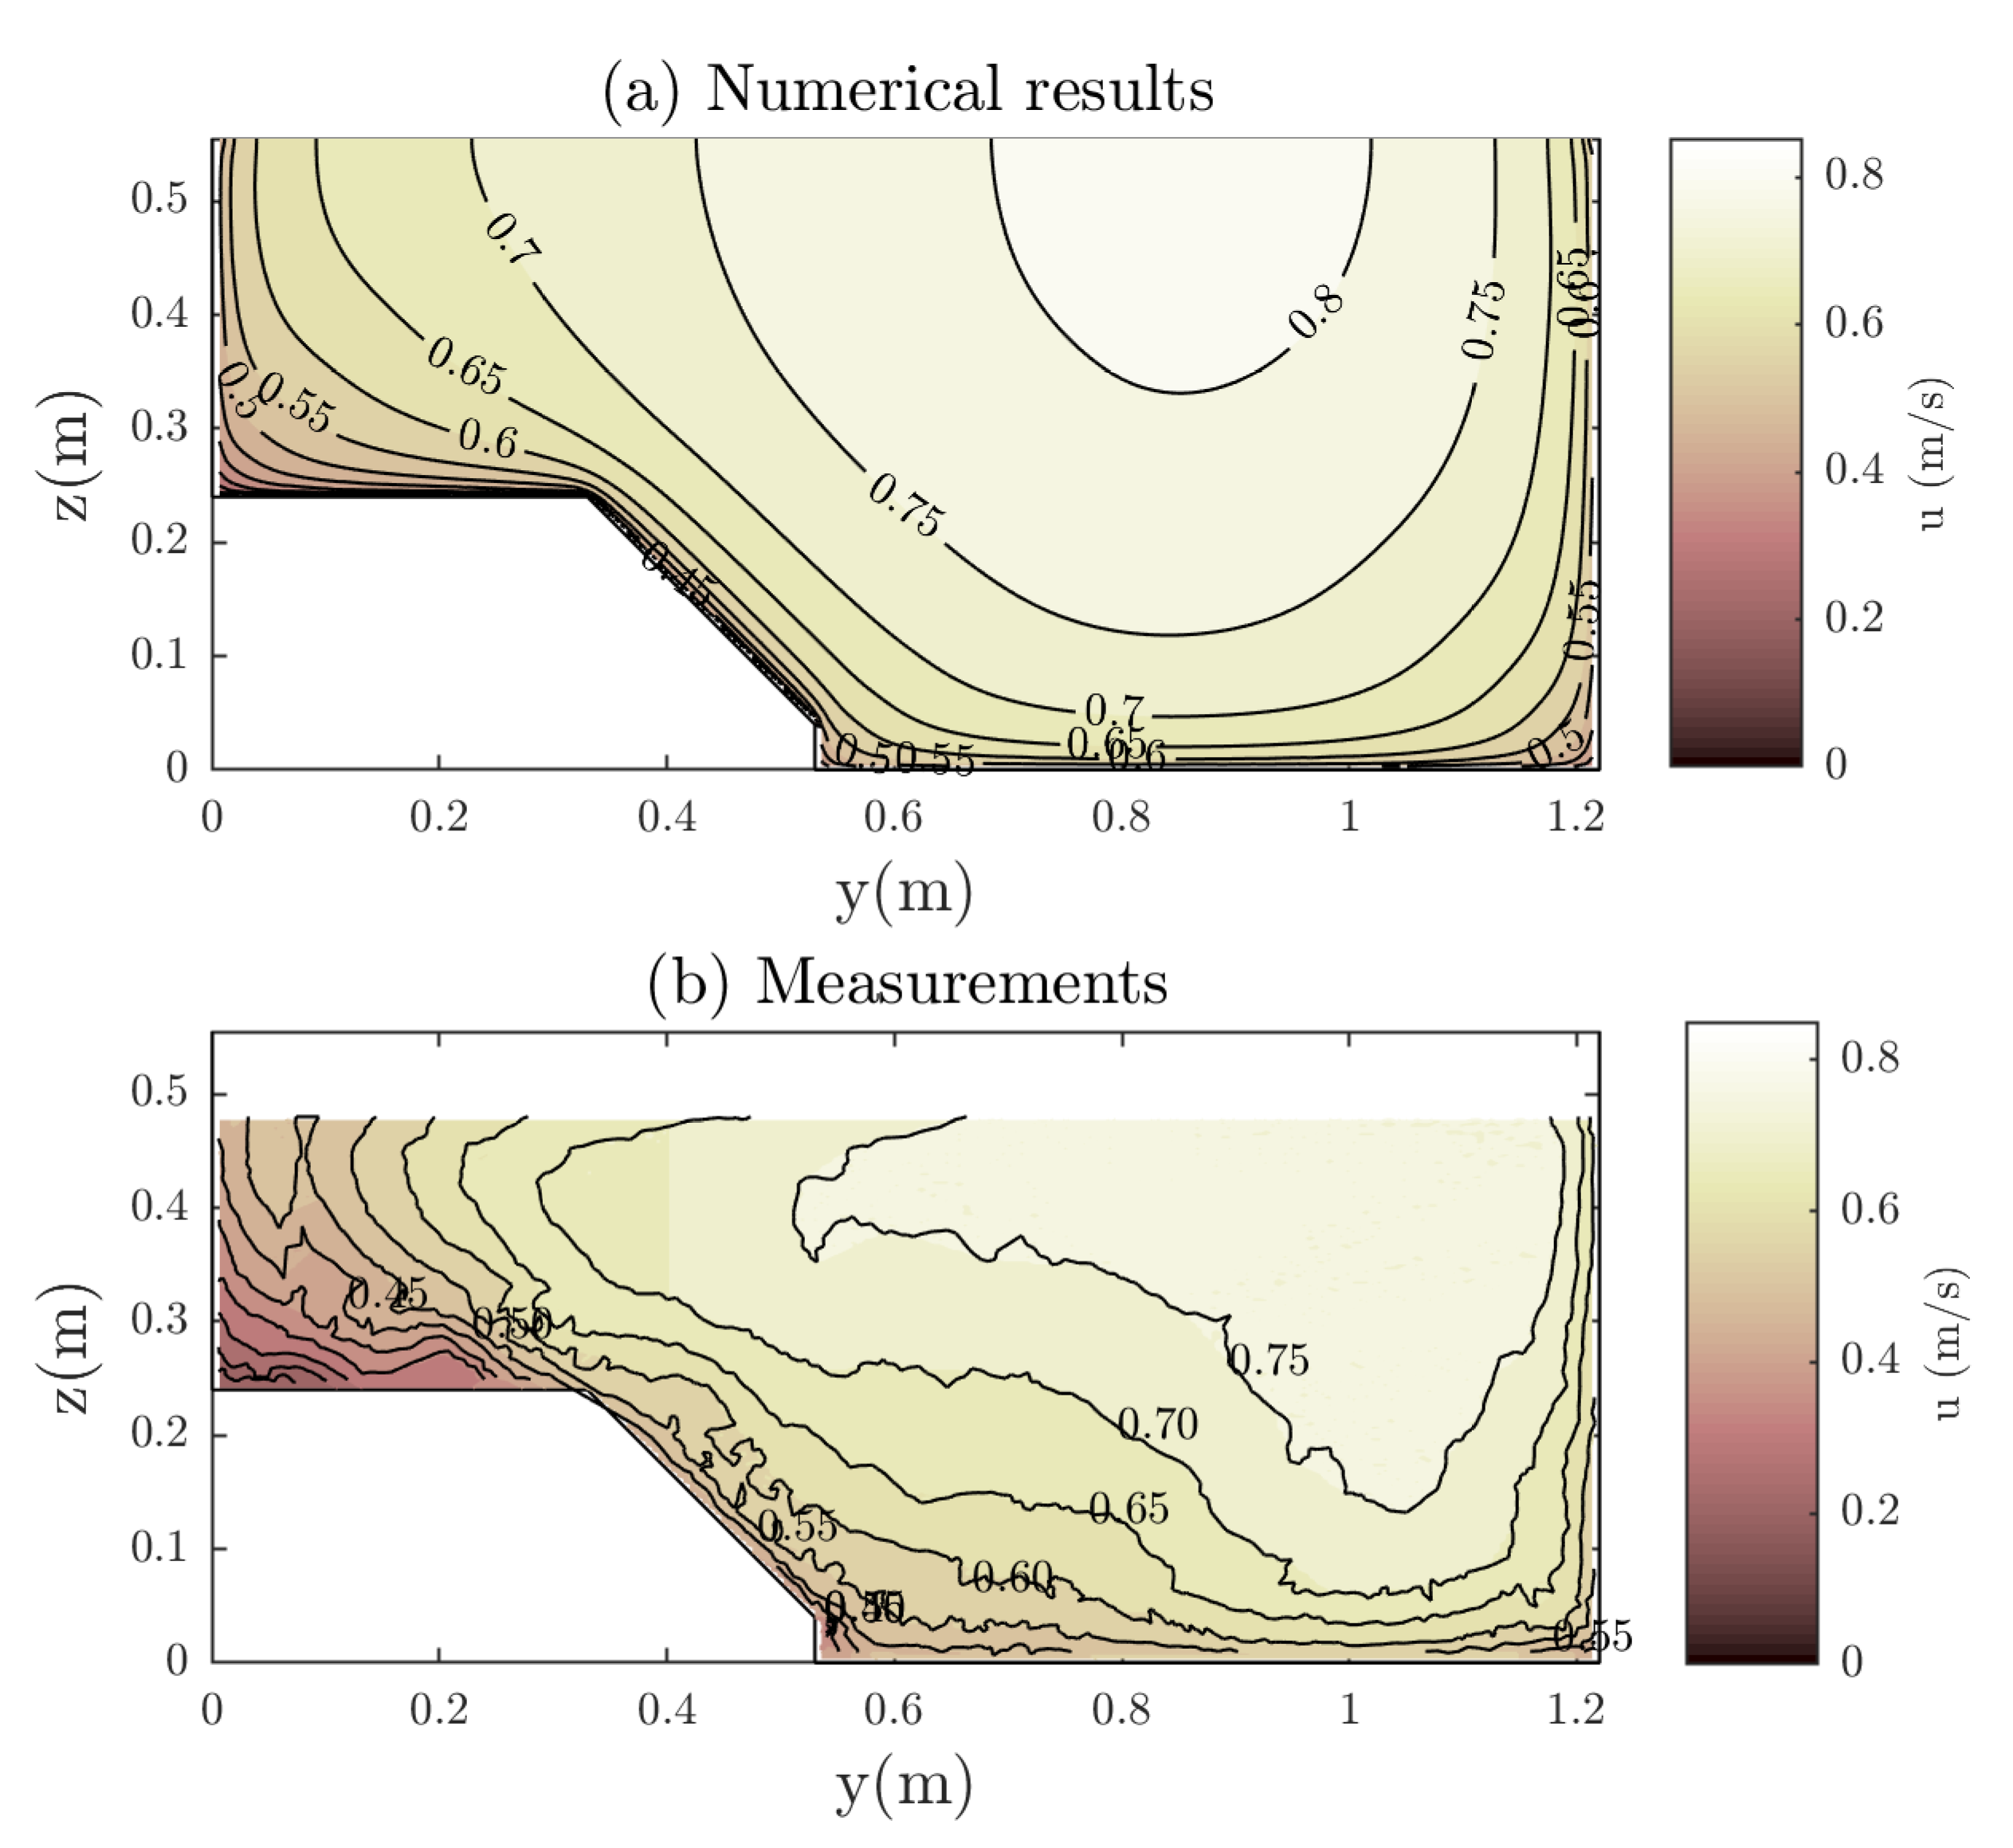
Additionally, the behavior of the model in a compound channel with variable bed roughness is assessed using the experiment by Kean et al. [17]. They considered a m wide asymmetrical compound section consisting of a main channel ( m) and a floodplain on the left ( m wide) with a longitudinal slope and a water depth m. The floodplain was m above the main channel bed and the slope was 1H:1V. The roughness was for walls and main channel bed and for the floodplain and slope. As the floodplain contained a similar-sized cobbles array not included by the model, the floodplain roughness has been increased to simulate a similar effect. Figure 10 shows the velocity distribution predicted compared with the experimental data. As a rule, the predicted velocity is in reasonable agreement with the magnitude and structure of the measured field ( m/s). Similar differences with experiments were observed and were attributed by Kean et al. [17] to secondary currents found experimentally. The discharge calculated by the model is and the measured one is ( difference).
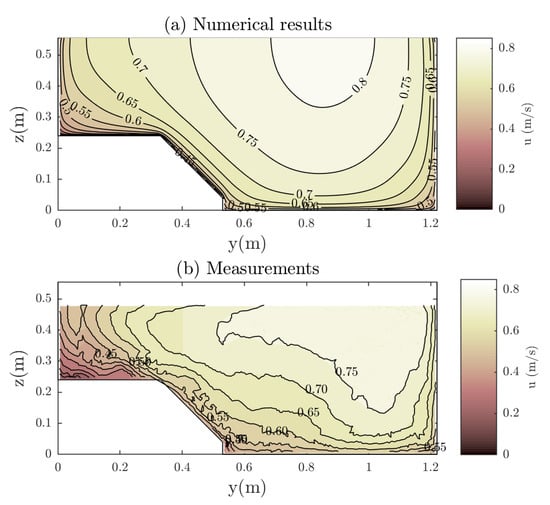
Figure 10.
Comparison of calculated and measured streamwise velocity distribution in a compound channel of the experiments of Kean et al. [17].
4.2. Boundary Shear Stress
In this section, many of the works considered by Khodashenas et al. [42] and others that include the measure of the local shear stress distribution are analyzed. The model is tested for a wide range of flow conditions using the measured boundary shear stress distributions in circular channels from [31,32], in rectangular channels [34], in trapezoidal channels [34,36] and in compound channels [37,38]. Throughout this section, the local boundary shear stress at point “i” is non-dimensionalized by its mean value along the wetted perimeter, i.e., , being represented against the dimensionless perimetric distance, , where s is the distance between any location on the channel boundary and its left water margin along the whole wetted perimeter P. Following Khodashenas et al. [42], two performance indicators are also used to quantitatively measure the performance of the method results as compared to measurements: (i) the relative error, ; and (ii) the root mean square error, .
4.2.1. Circular Channels
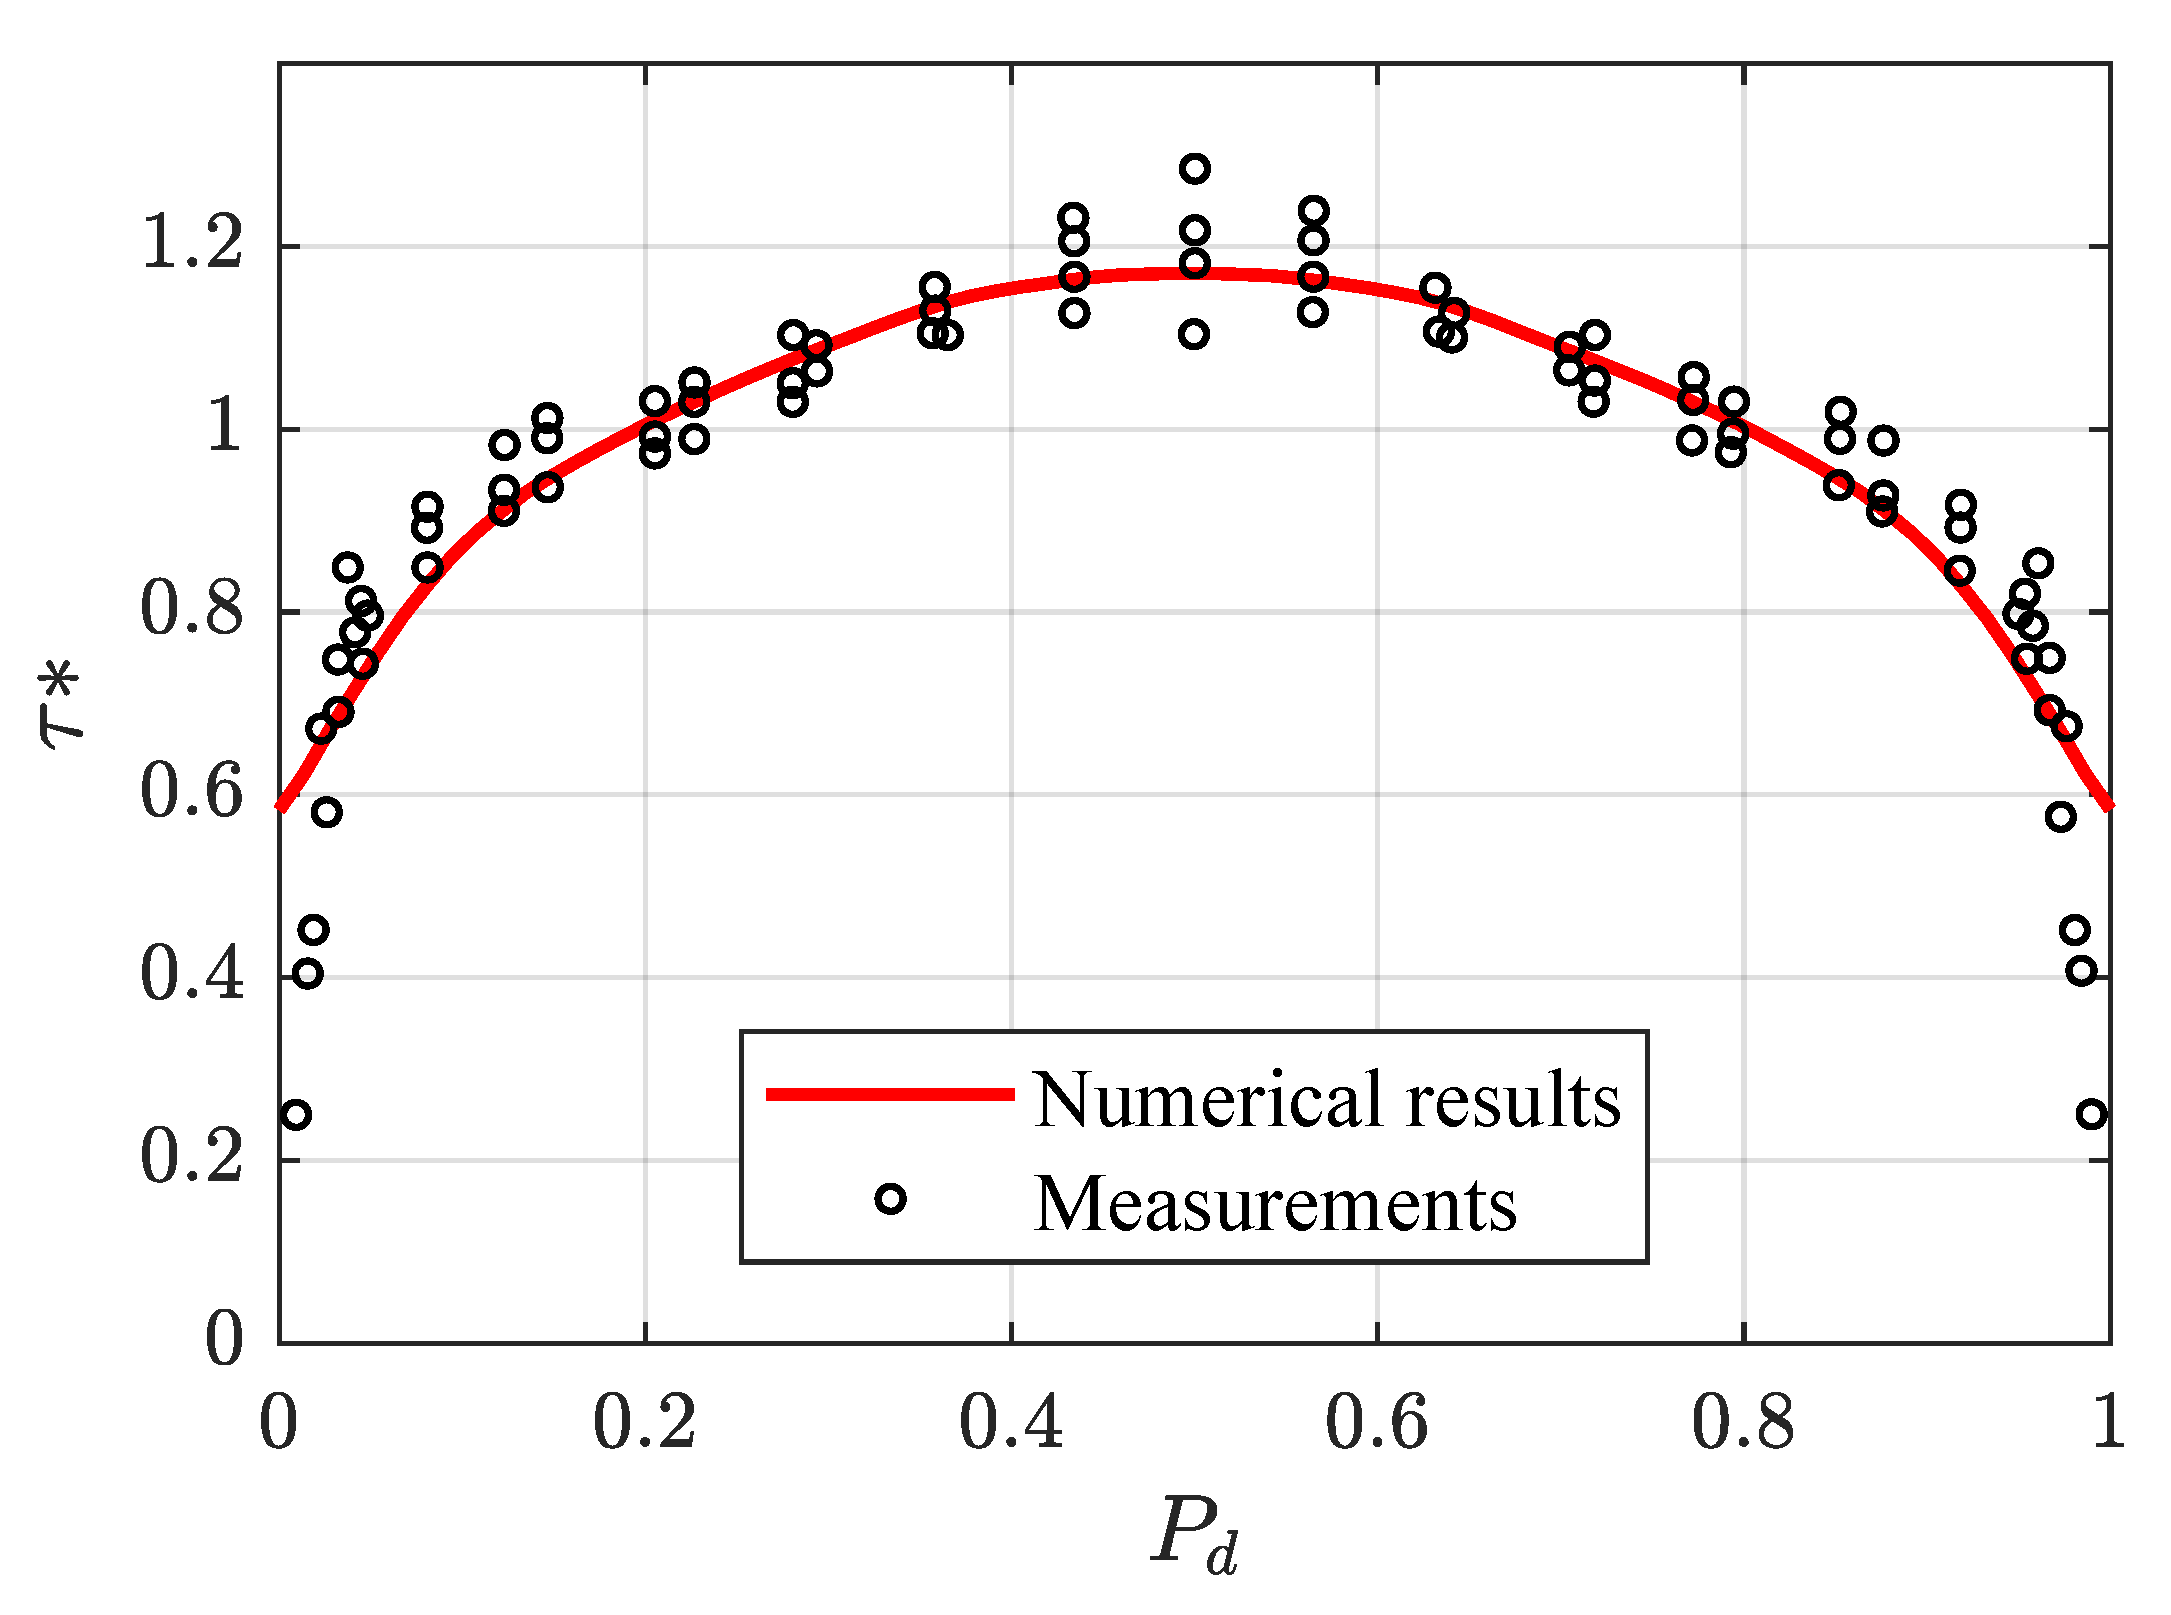
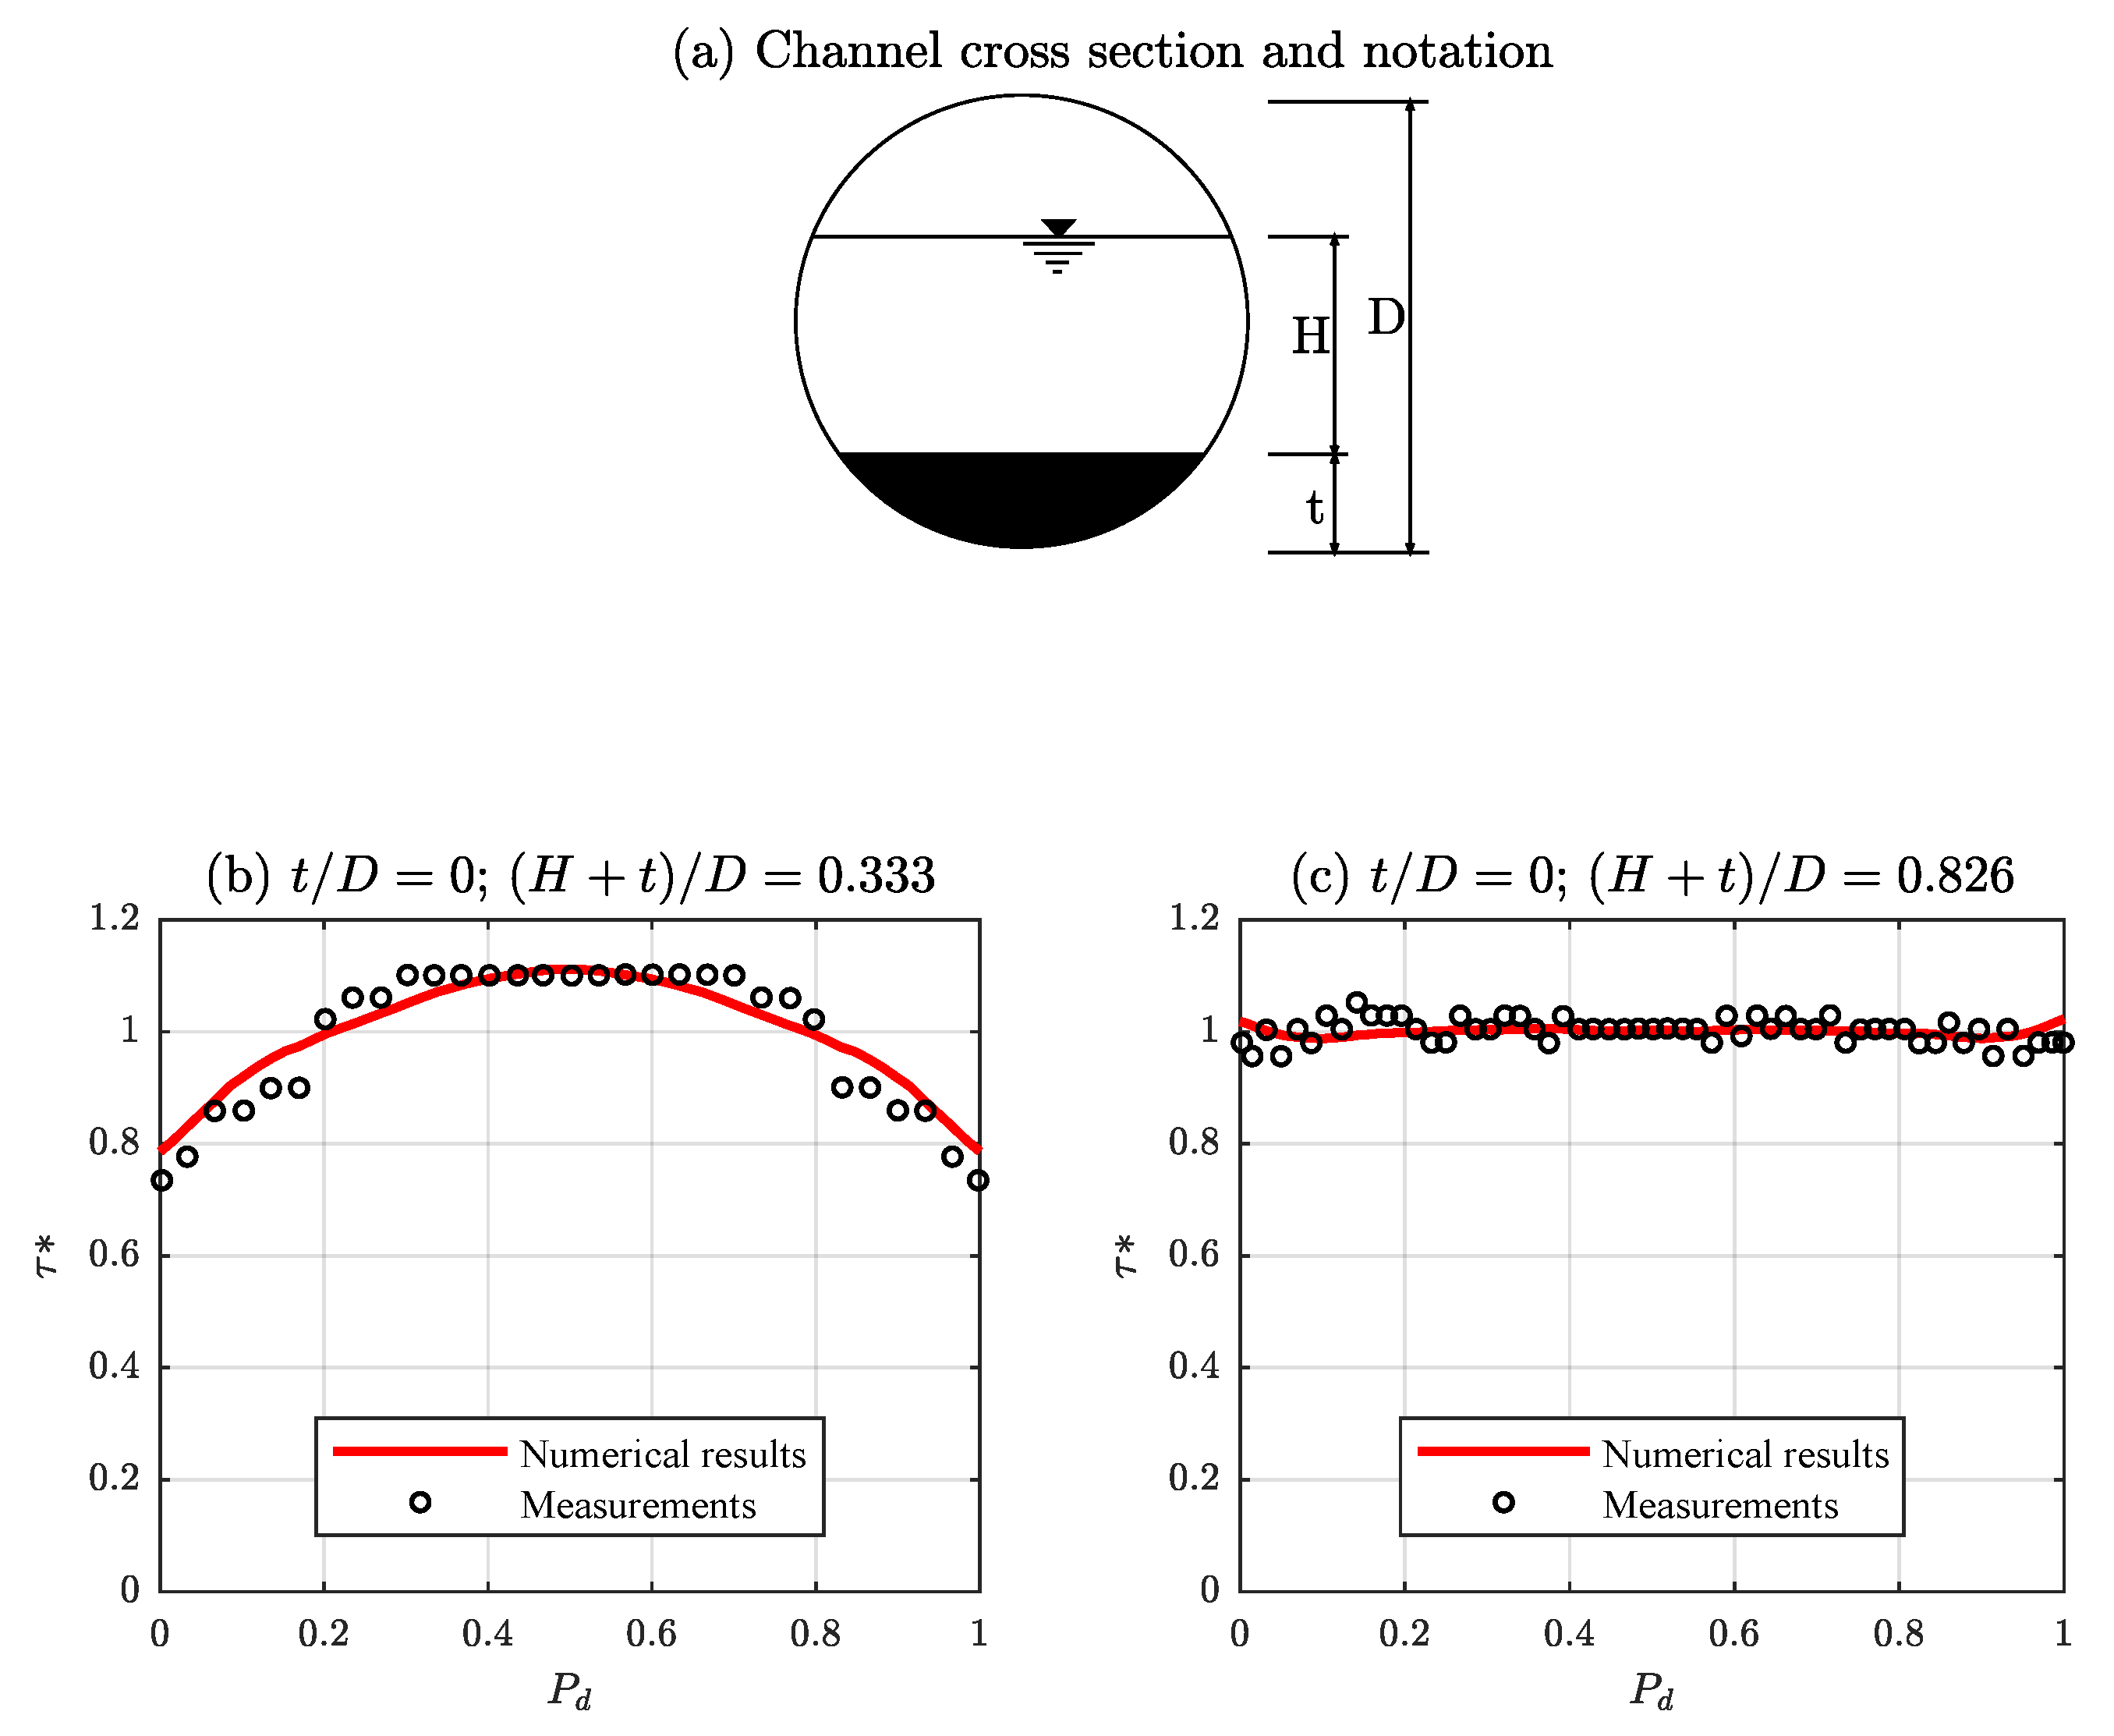
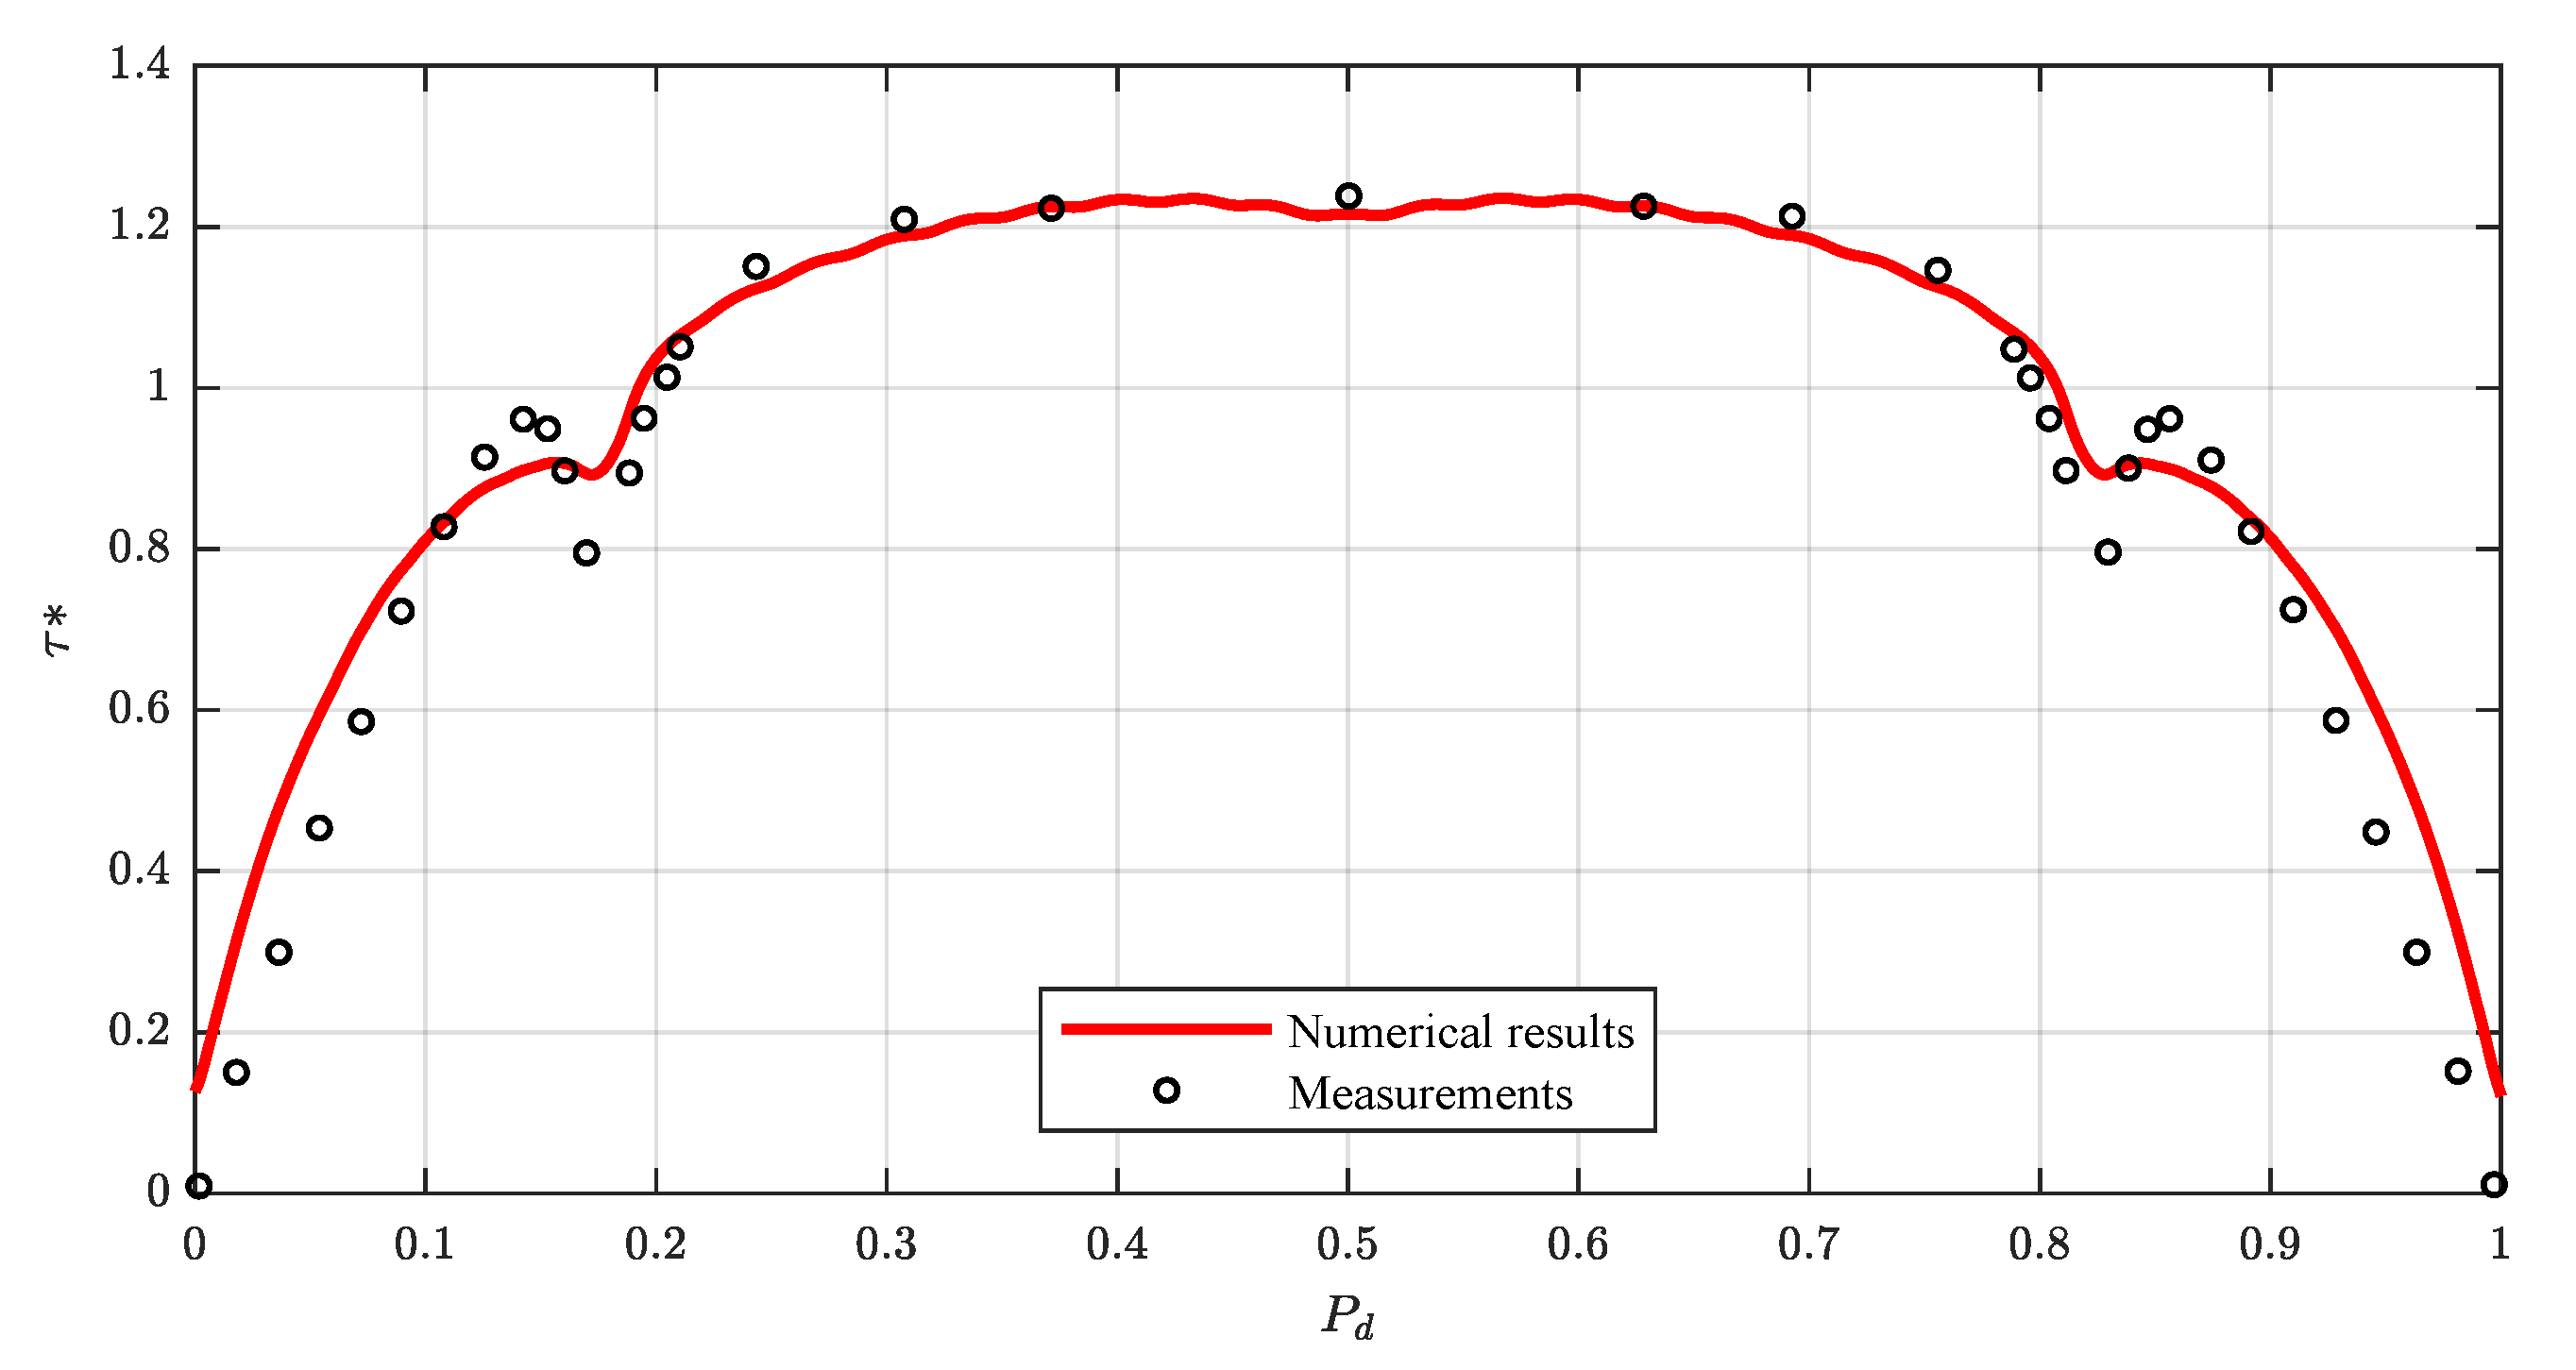
In Figure 11, the boundary shear stress distribution predicted by the model is compared with the experimental data of Replogle and Chow [32] for partially full circular conducts. The geometrical and hydraulic parameters were diameter m, water depth m and . The predicted boundary shear stress distribution using the new method agrees well with the experimental data, being the errors and , which indicate a good performance of the model when compared with other methods, as shown in [42]. Likewise, the model is applied to the experimental data of Knight and Sterling [31] for partially full pipes with , diameter m and a flat bed with a thickness t. For non flat bed cases, the considered water depths were m and m and even though the shear stress distribution measured varies between the two cases, there is a good agreement between model results and experimental data in both experiments, as shown in Figure 12. The results of the performance indicators are and in the first case and and in the second one. Table 2 shows the behavior for flat bed cases. Despite the different conditions, there is a satisfactory agreement between the model results and the measurements in all cases.
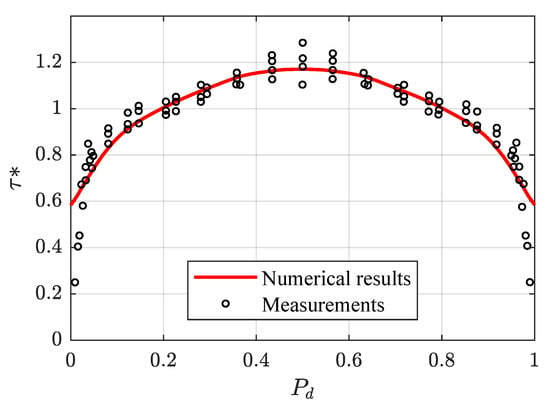
Figure 11.
Comparison of calculated and measured boundary shear stress distributions in a rough circular conduit of the experiments of Replogle and Chow [32].
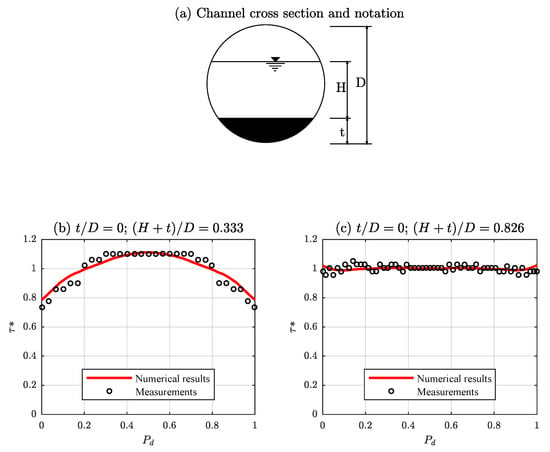
Figure 12.
(a) Channel cross section and notation; and (b,c) comparison of calculated and measured boundary shear stress distributions in a smooth circular conduit of the experiments of Knight and Sterling [31].

Table 2.
Model behavior for flat bed cases by Knight and Sterling [31].
4.2.2. Rectangular Channels
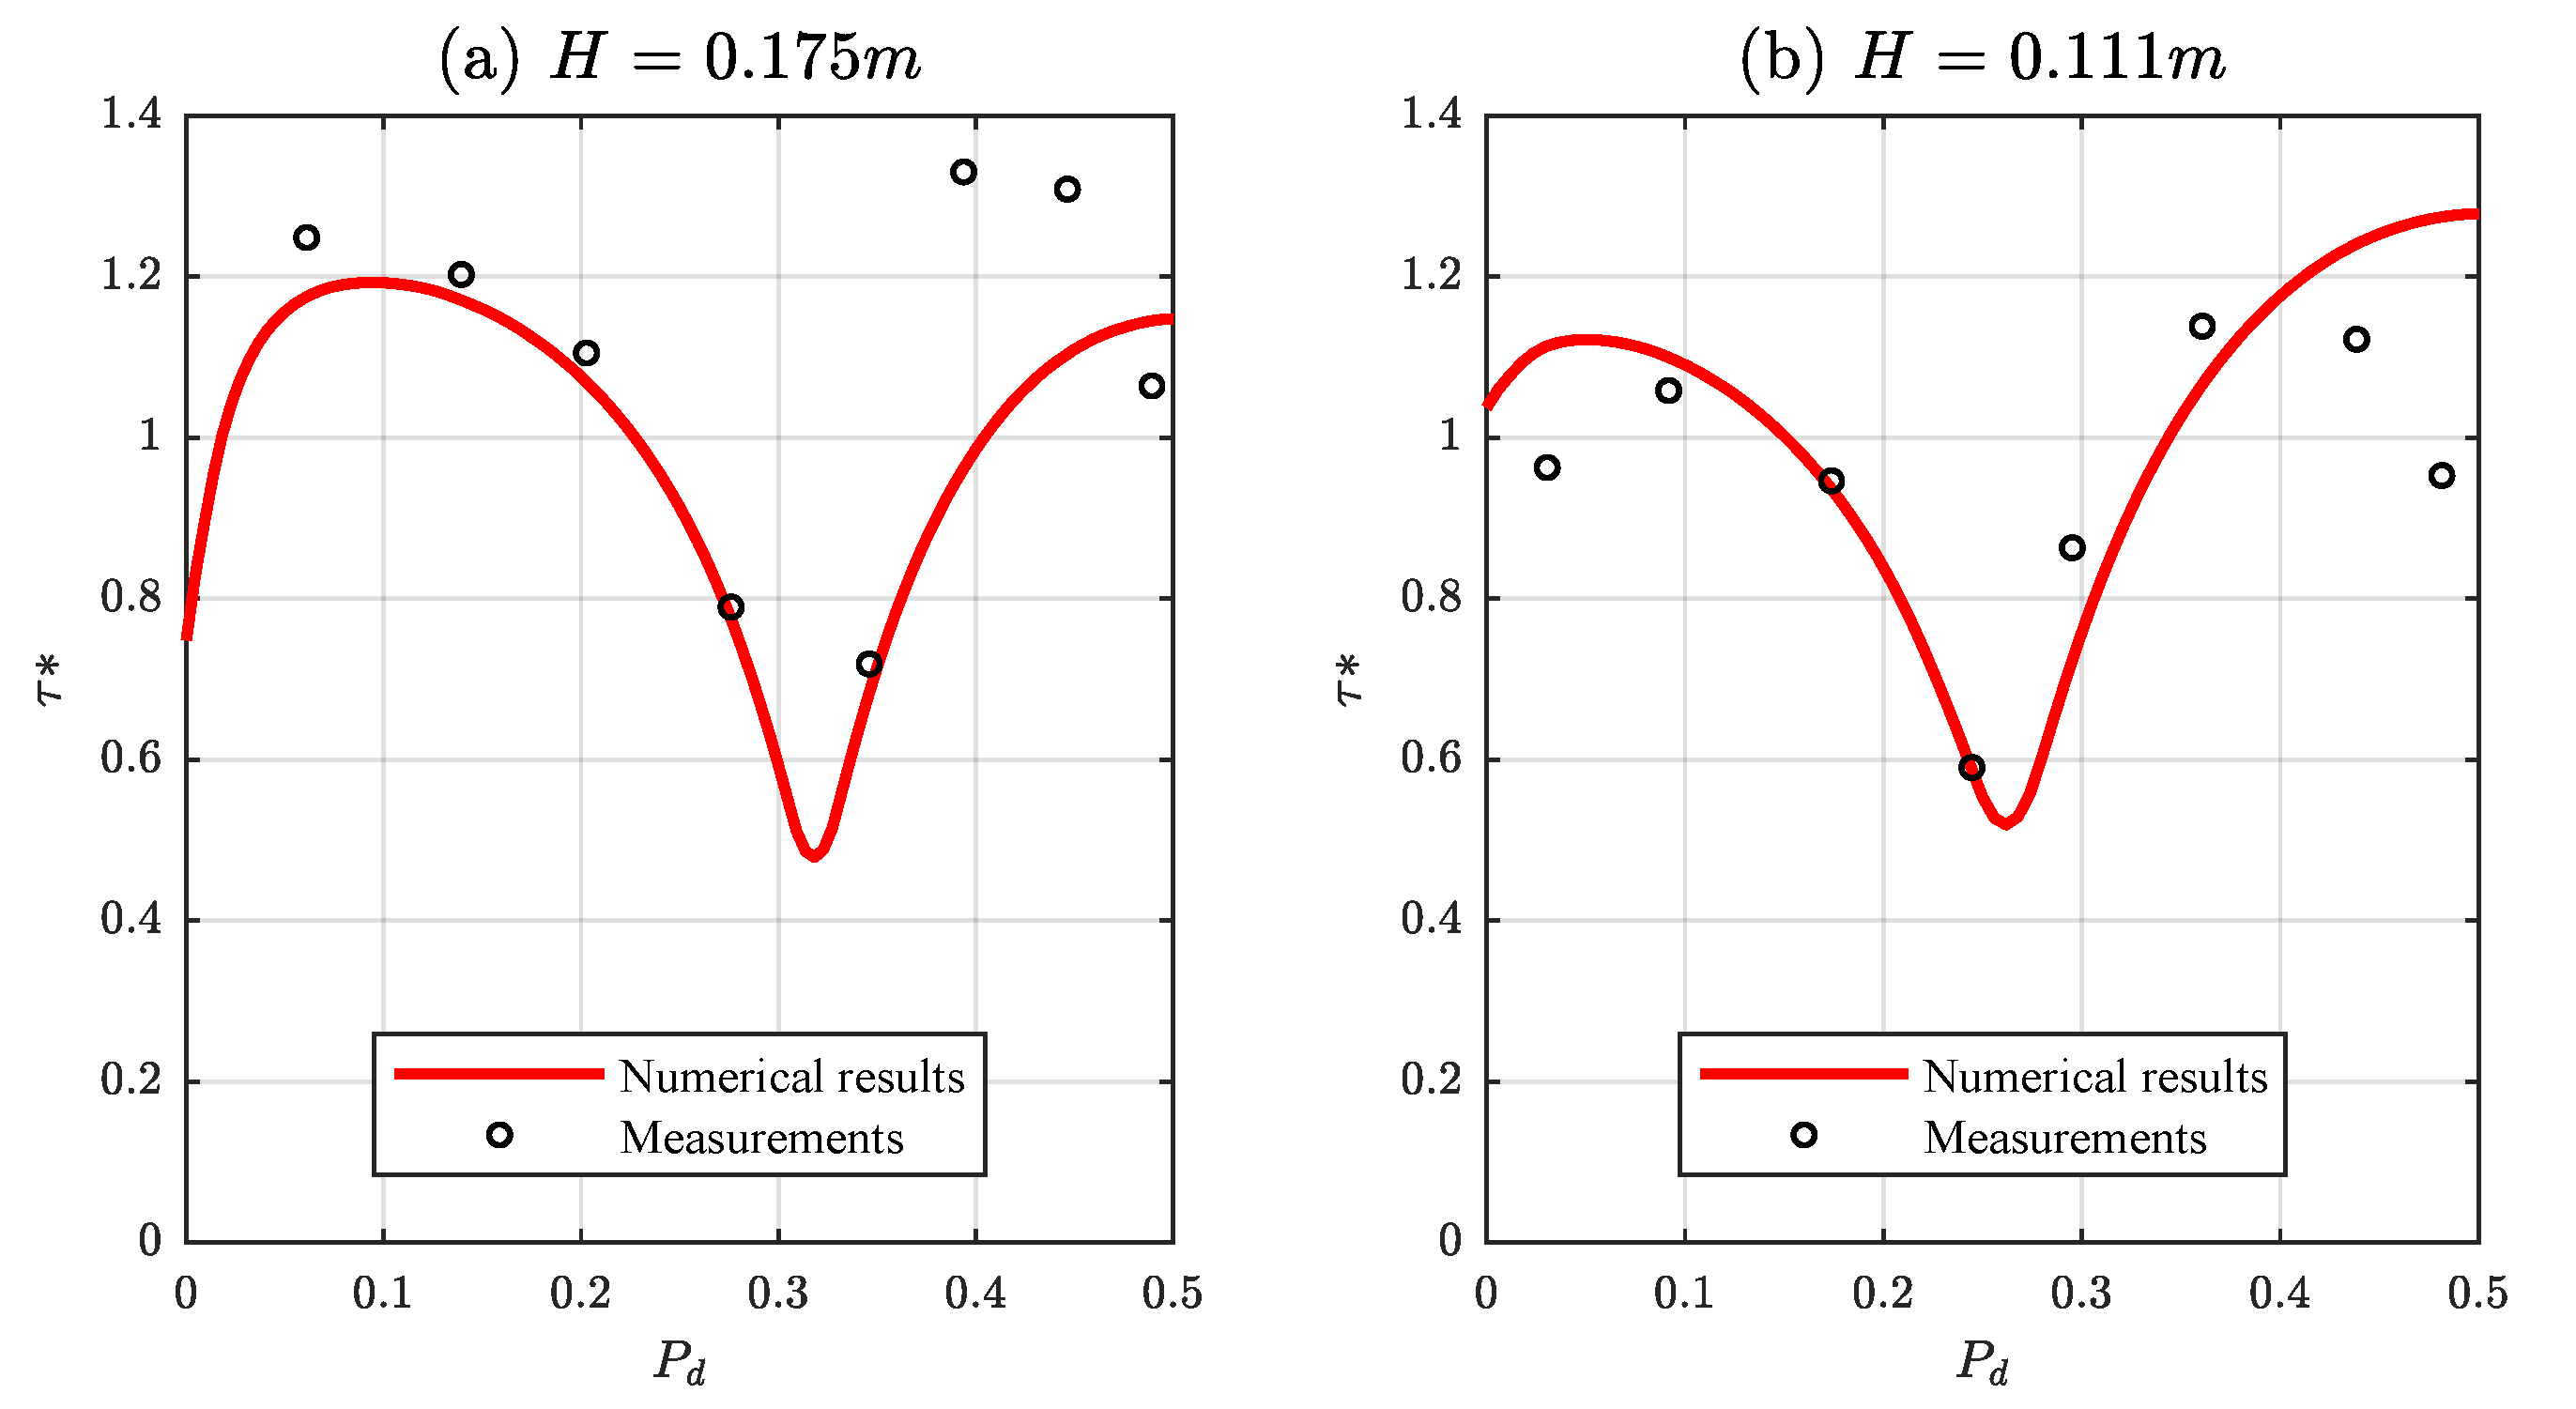
For rectangular channels, the available data including shear stress distribution are less common. Figure 13 compares calculated shear stress distribution with the measurements obtained by Ghosh and Roy [34] in two experiments carried out on a rectangular channel (width m and hydraulic slope ) with water depths m and m, respectively. The boundary shear stresses are in good agreement in both cases, being and in the first case and and in the second one. However, small discrepancies are observed which may be due to secondary flows [34].
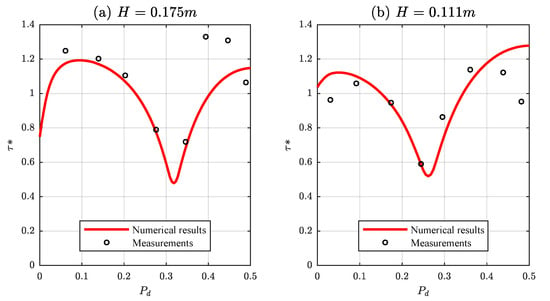
Figure 13.
Comparison of calculated and measured boundary shear stress distributions in a rectangular channel of the experiments of Ghosh and Roy [34]: (a) m; and (b) m.
4.2.3. Trapezoidal Channels
In addition, Figure 14 compares the predicted boundary shear stress distribution with the experimental data of Lane [36] collected in a smooth trapezoidal channel, based on m, m, and channel sidewall slopes of 1V:0.5H. A quite good agreement between the model results and the measurements is achieved (, ).
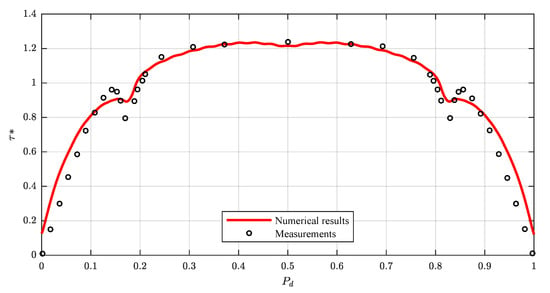
Figure 14.
Comparison of calculated and measured boundary shear stress distributions in a smooth trapezoidal channel of the experiments of Lane [36].
4.2.4. Compound Channels
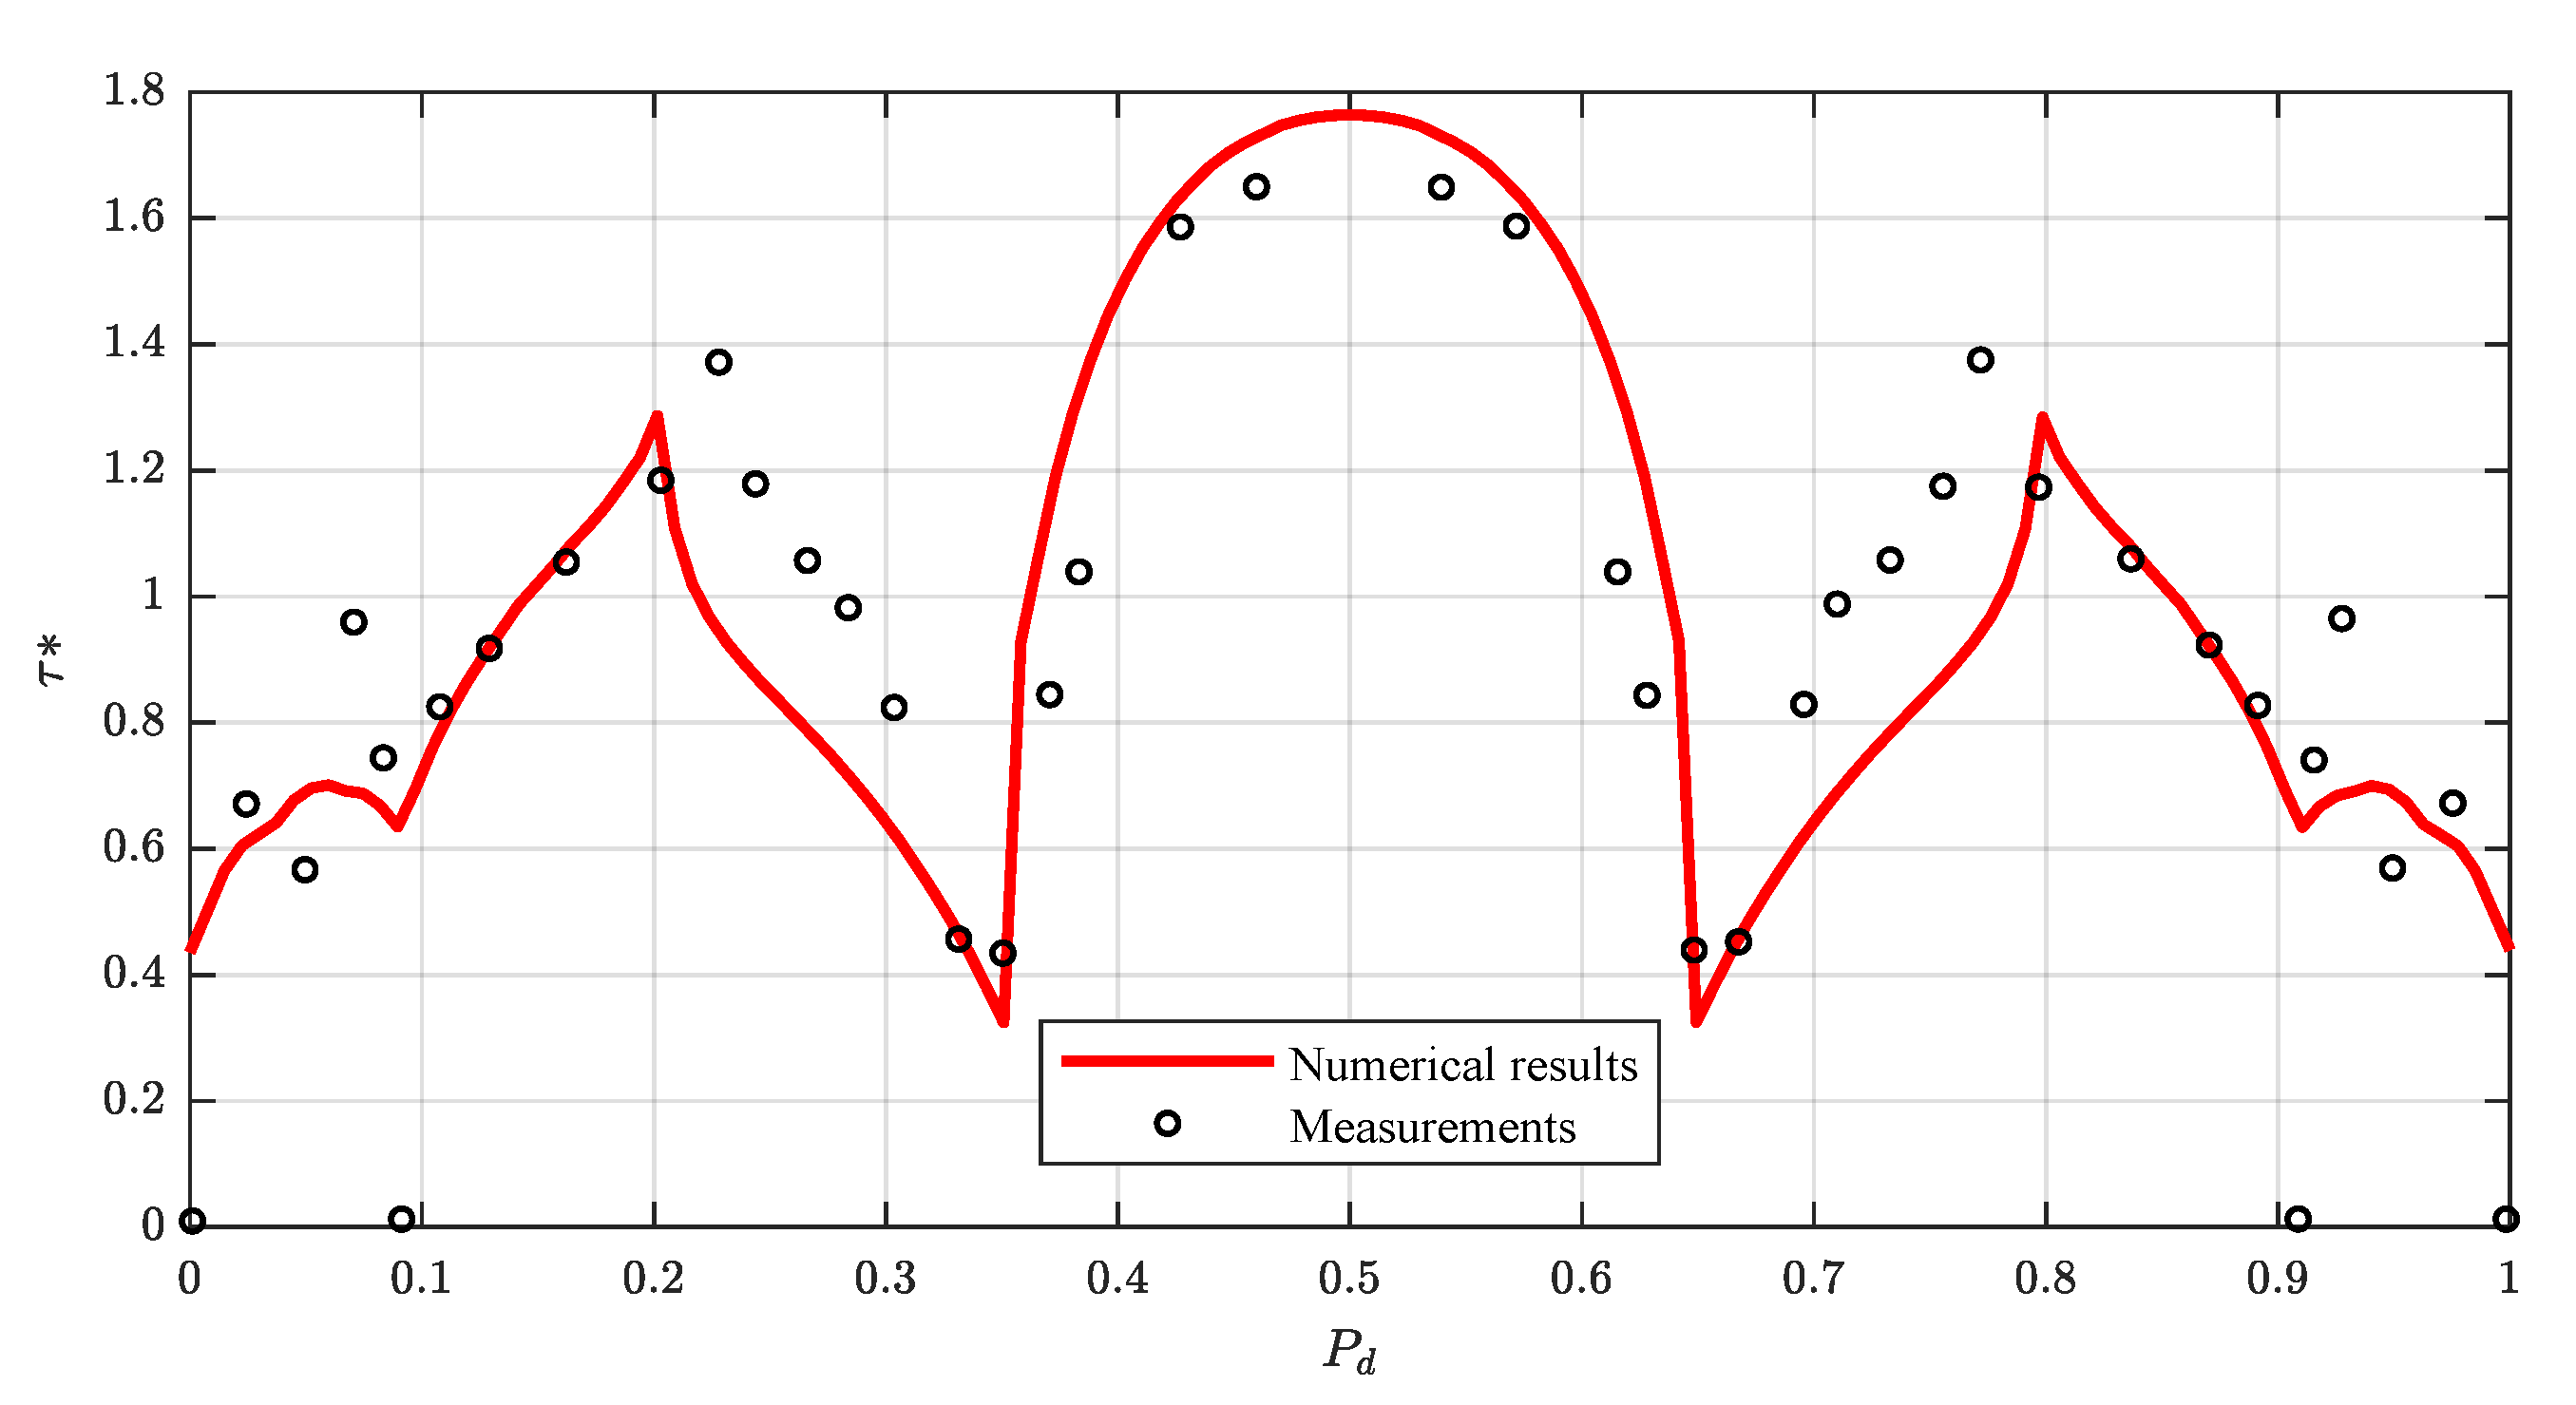
The work by Ghosh and Mehta [37] in a symmetrical rough-bed compound channel with a m wide main channel and two m wide floodplains is here regarded. The floodplains height was m above main channel bed, the water depth m, the hydraulic slope and the main channel sidewalls were vertical, whereas the slope of the floodplain sidewalls was 1V:0.58H. The predicted boundary shear stress distribution is compared with the experimental data in Figure 15. The numerical model provides reliable results throughout the whole wetted perimeter except for some local discrepancies. This can be attributed to secondary currents and to the momentum transfer between the main channel and its floodplain. Nevertheless, the results are satisfactory ( and ).
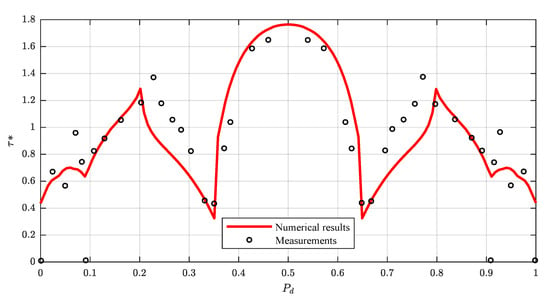
Figure 15.
Comparison of calculated and measured boundary shear stress distributions in a rough compound channel of the experiments of Ghosh and Mehta [37].
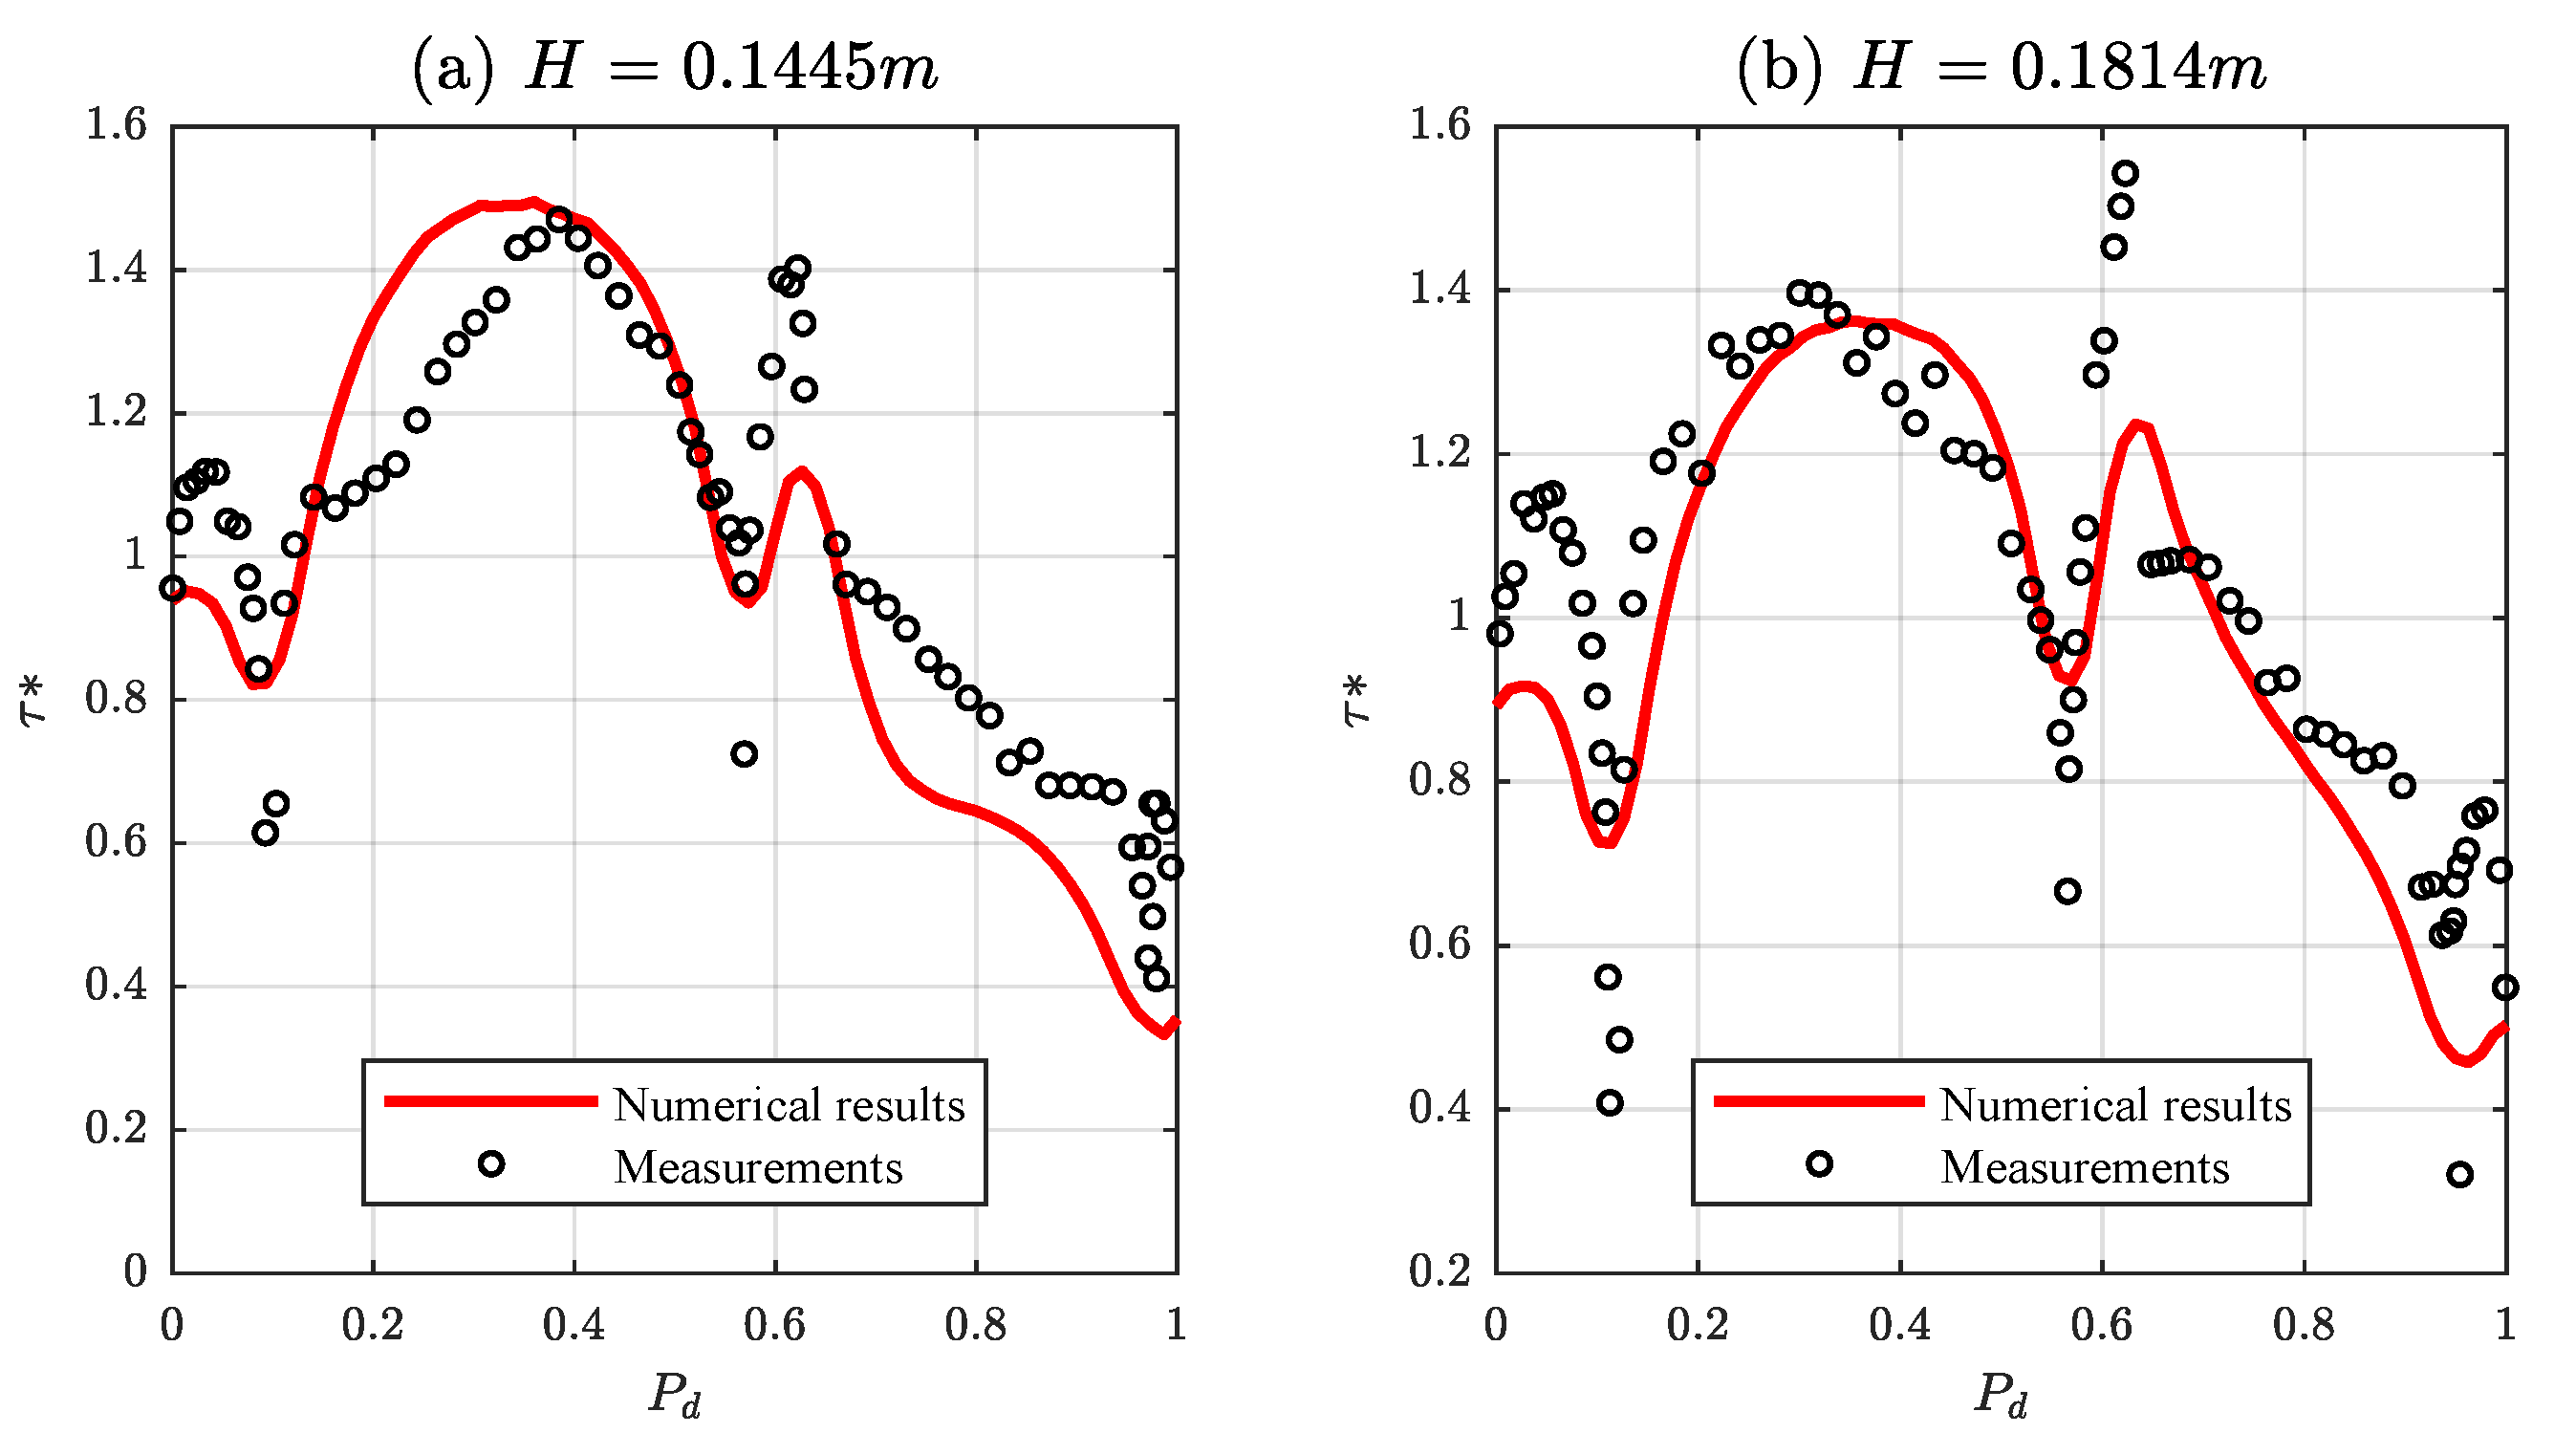
Furthermore, Rajaratnam and Ahmadi [38] performed some experiments on a m wide asymmetric compound channel consisting of a m wide main channel and a m floodplain on the right. The model is applied for the experiments with greater water depth ( m with ; and m with ). Figure 16 shows the comparison between predicted and experimental shear stress. In general, the results agree satisfactorily with the experimental data: and for the first case and and for the second one. However, there are local points with small differences where the shear stress is underestimated, in the vertical walls or in the floodplain, and it is overestimated in the center of the channel.
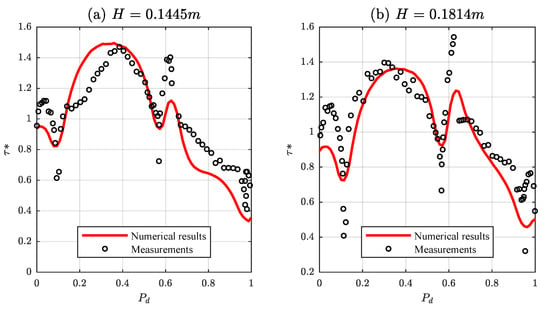
Figure 16.
Comparison of calculated and measured boundary shear stress distributions in a compound channel of the experiments of Rajaratnam and Ahmadi [38]: (a) m; and (b) m.
4.3. Influence of Free Surface Boundary Layer
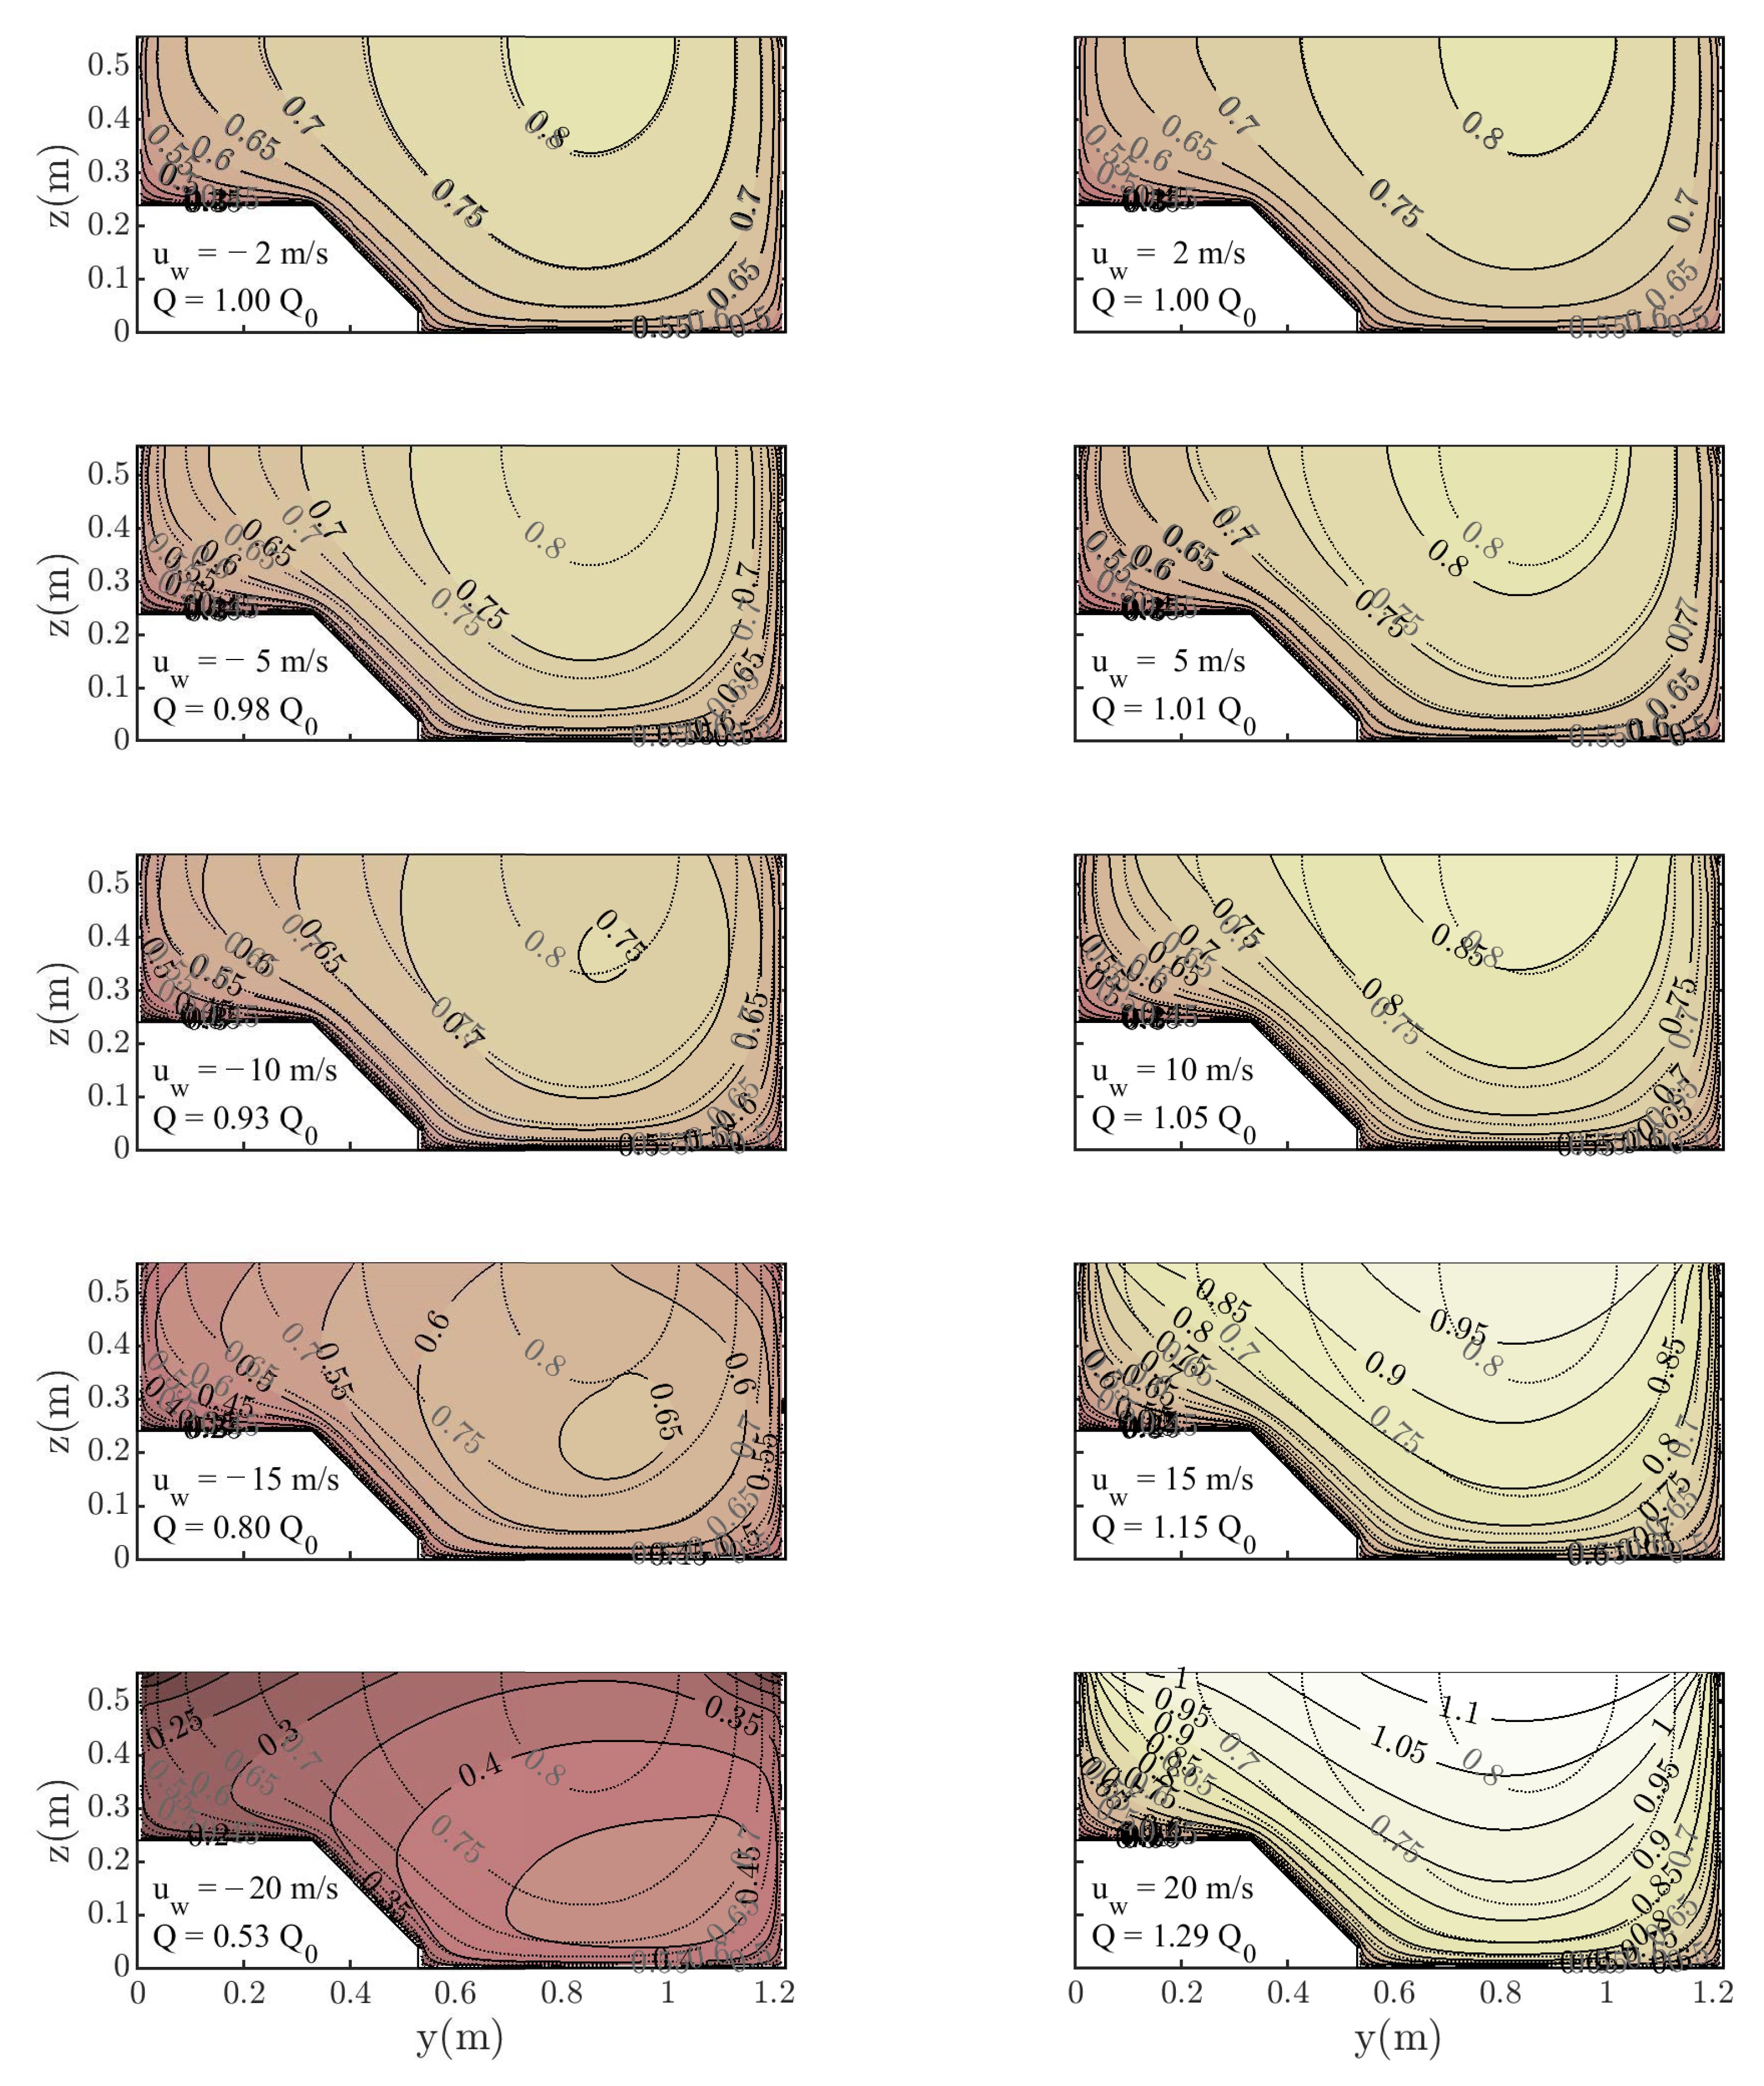
All the above presented numerical results incorporate the free surface boundary condition given by an additional shear stress at the interface between water and air. However, this effect can be negligible for low values of the water velocity at free surface with air at rest, as is the case with all the experimental data in the literature, and there is no difference with null shear stress boundary condition. To study the effect that wind speed could have, which is common in real open channels, the qualitative influence of wind on the velocity field and boundary shear stress distribution is analyzed without experimental data, although the problem has been known for a long time [43]. To do this analysis, the experiment by Kean et al. [17] is taken as a basis, checking how wind velocity affects the numerical results. Winds either against the flow direction (negative values) or in the same direction as the flow (positive values) are analyzed and compared with the basis case, . Note that the analyzed values, m/s, agree with the formulation for the drag coefficient given by Equation (12). For higher wind speeds, other formulations collected by Wróbel-Niedźwiecka et al. [27] should be implemented.
As shown in Figure 17 for low wind speeds, m/s, the velocity distribution in the cross section differs little from the base distribution, so the effect of the free surface shear stress could be neglected. However, for wind speeds above that value, differences become more noticeable. For winds against the flow direction, dip phenomenon occurs even when no secondary currents are considered by the numerical model. The location of the maximum velocity occurs below the water surface with the dip position heavily dependent on the wind speed. This phenomenon completely modifies the flow pattern and the predicted flow rate, decreasing the flow rate by up to of the original for m/s.
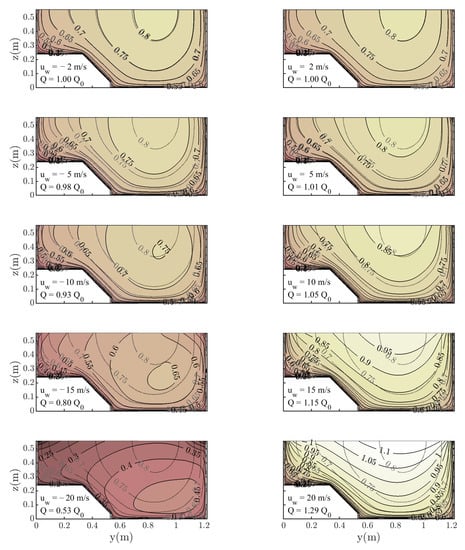
Figure 17.
Effect of wind speed on the velocity field for the experiment of Kean et al. [17]. Grey lines are the results for the case m/s where the calculated flow rate is m2/s.
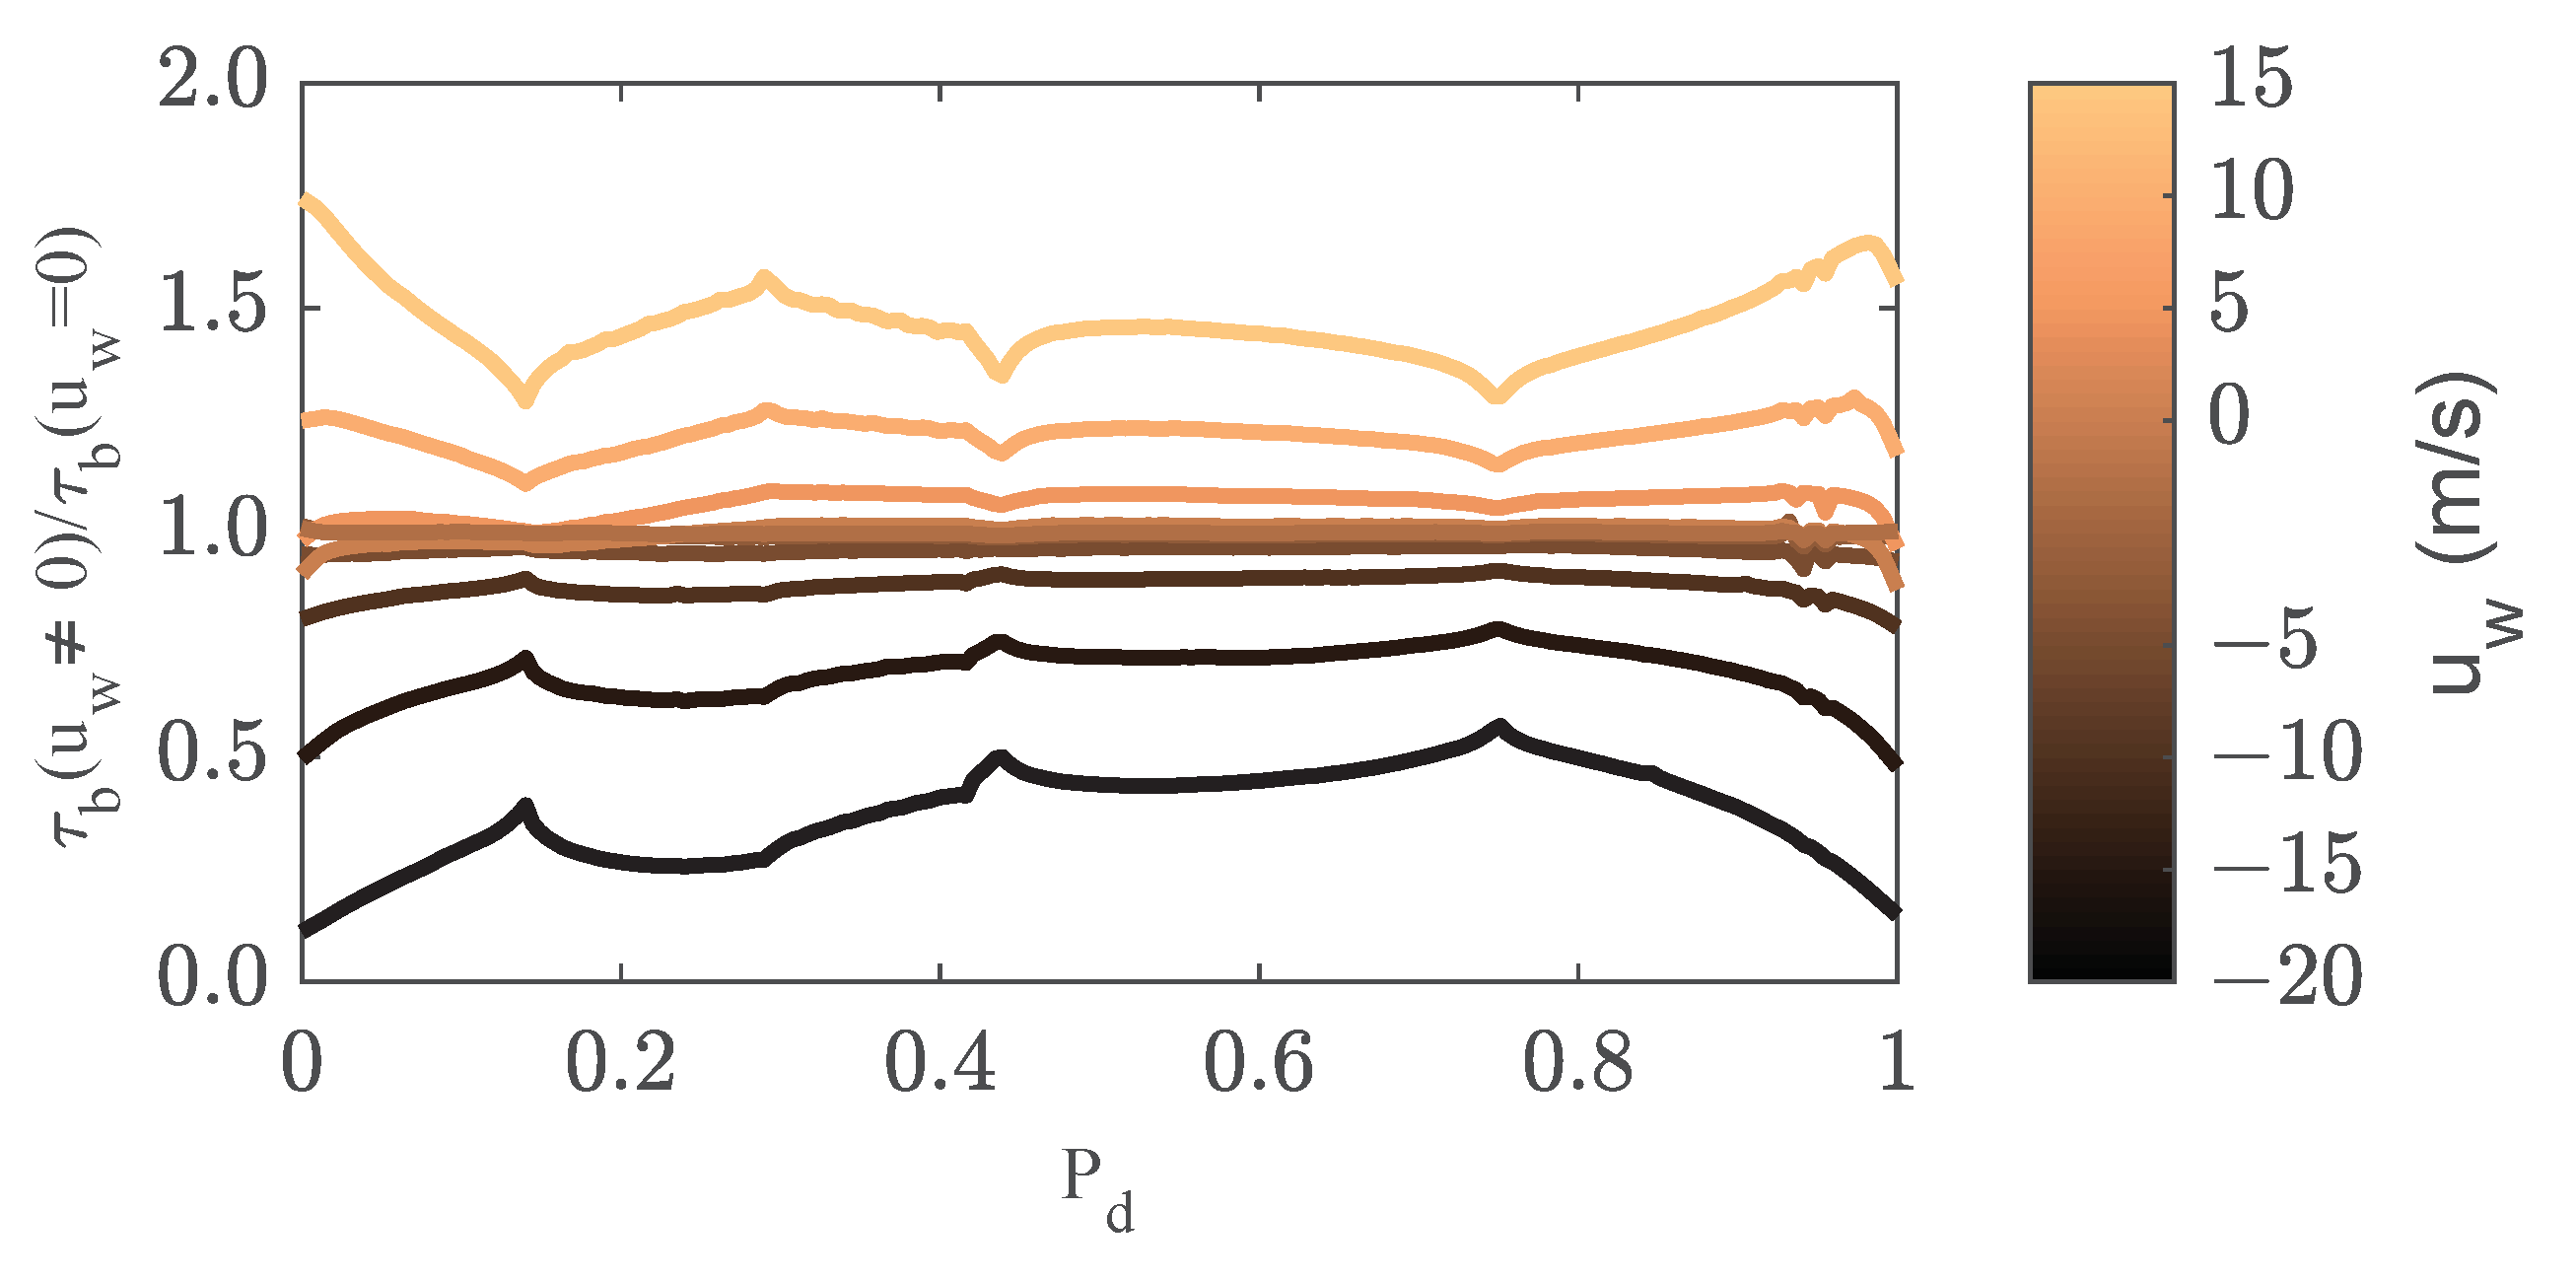
Conversely, for winds in the same direction as the flow, the higher is the wind speed, the larger is the predicted the flow rate, with a maximum increment of (less variation than in the case of negative wind speeds). These results highlight that, for real open channels with considerable wind speeds, the effect of the free surface boundary layer must be considered for an adequate characterization of the velocity distribution and flow rate. However, these results should be analyzed and verified with experimental data. Obviously, the modification of the velocity distribution leads to a change in the boundary shear stress. Figure 18 represents the boundary shear stress along the wetted perimeter in comparison with the same at the basis case with null velocity. Again, for lower wind speeds, the bed stress barely changes. However, for highest values, m/s, the bed shear stress is increased by up to for positive wind values and reduced by up to in the case of negative speeds. This variation is more noticeable near the water surface, where free surface shear stress acts closer to the contours. Given these results, it seems clear that the effect of wind speed cannot be neglected in those cases requiring of accurate estimations of velocities, flow rates or bed shear stress, and, therefore, the free surface should be implemented and validated.
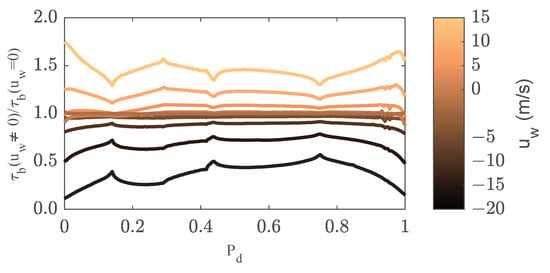
Figure 18.
Bed shear stress considering wind effects respect the case with null wind for the experiment of Kean et al. [17].
5. Conclusions
An enhanced treatment of the boundary conditions both at the bottom and at the free surface for 2D RANS streamwise velocity models in open channel flow is presented, yielding a simple, economical and fully predictive numerical model to compute the longitudinal velocity and the boundary shear stress distributions in a free surface stream. The new treatment avoids some of the drawbacks of previous methods. Instead of applying the momentum balance over each sub-area, the new methodology estimates the boundary shear stress only focusing on the near-contour region by reconciling the numerical and theoretical resolutions of the ray velocity profiles where both resolutions could be applied. This modification reduces computation load, creating a more efficient approach. Another new feature is that it integrates the free surface boundary layer due to wind effects. Wind can modify the velocity distribution and boundary shear stress and should be taken into account in the PDE problem and the balance equation as it can compensate or promote the downstream component of the weight of water in each sub-area. Its effects are properly considered in the new method by correctly applying the free surface boundary condition in the PDE problem. Previous results show the significant influence that wind speed could have on the flow. The solution is obtained though an iterative procedure that resolves the governing equations by the finite element method employing error control. The procedure successfully predicts behavior, without requiring parameter adjustments to achieve better results or closer agreement with measurements.
The validation was performed by comparing results to measurements of the streamwise velocity and boundary shear stress distributions available in the literature. Different cross-sections were used (circular, rectangular, trapezoidal and compound section), and the results are satisfactory for all of them. Generally, numerical results are in reasonable agreement with the magnitude and distribution of the velocity and boundary shear stress measurements in all cases. The comprehensive validation process and its results support the reliability of flow models employing the ray–isovel turbulence closure to correctly estimate the velocity distribution and boundary shear stress for any type of section and roughness. Discrepancies between numerical results and measured velocity distributions are mainly due to secondary currents, which are not considered in these models. Despite this simplification, the proposed treatment properly reproduces the measurement patterns.
Author Contributions
Conceptualization, Á.G. and J.G.; Data curation, J.A.F.; Formal analysis, J.A.F. and Á.G.; Funding acquisition, J.G.; Investigation, J.A.F. and Á.G.; Methodology, J.A.F. and Á.G.; Project administration, J.G.; Software, J.A.F. and Á.G.; Supervision, Á.G. and J.G.; Validation, J.A.F.; Visualization, J.A.F.; Writing—original draft, J.A.F. and Á.G.; and Writing—review and editing, Á.G. and J.G. All authors have read and agreed to the published version of the manuscript.
Funding
Juan Alfonso Figuérez, as an employee of the company Hidralab, would like to thank the financial support by Hidralab and MINECO through a 2016–2020 grant for the PhD formation in companies (DI-15-08150).
Data Availability Statement
Some or all data, models, or code used during the study were provided by a third party (Hidralab). Direct requests for these materials may be made to the provider as indicated in the funding.
Conflicts of Interest
The authors declare no conflict of interest.
References
- Chaudhry, M.H. Open-Channel Flow; Springer: Columbia, SC, USA, 2008. [Google Scholar]
- Yen, B.C. Channel Flow Resistance: Centennial of Manning’s Formula; Water Resources Publications, LLC: Highlands Ranch, CO, USA, 1991. [Google Scholar]
- Chow, V.T. Open-Channel Hydraulics; McGraw-Hill: New York, NY, USA, 1959. [Google Scholar]
- Knight, D.W.; Shiono, K. River Channel and Floodplain Hydraulics. In Floodplain Processes; Anderson, M.G., Walling, D.E., Bates, P.D., Eds.; John Wiley and Sons Ltd.: New York, NY, USA, 1996; Chapter 5; pp. 139–181. [Google Scholar]
- Shiono, K.; Knight, D.W. Turbulent open-channel flows with variable depth across the channel. J. Fluid Mech. 1991, 222, 617–646. [Google Scholar] [CrossRef]
- Abril, J.B.; Knight, D.W. Stage-discharge prediction for rivers in flood applying a depth-averaged model. J. Hydraul. Res. 2004, 42, 616–629. [Google Scholar] [CrossRef]
- Liao, H.; Knight, D.W. Analytic stage–discharge formulae for flow in straight trapezoidal open channels. Adv. Water Resour. 2007, 30, 2283–2295. [Google Scholar] [CrossRef]
- Knight, D.W.; Omran, M.; Tang, X. Modeling Depth-Averaged Velocity and Boundary Shear in Trapezoidal Channels with Secondary Flows. J. Hydraul. Eng. 2007, 133, 39–47. [Google Scholar] [CrossRef]
- Tang, X.; Knight, D.W. A general model of lateral depth-averaged velocity for open channel flows. Adv. Water Resour. 2008, 31, 846–857. [Google Scholar] [CrossRef]
- Shimizu, Y.; Tsujimoto, T. Numerical analysis of turbulent open-channel flow over a vegetation layer using a k–ϵ turbulence model. J. Hydrosci. Hydraul. Eng. 1994, 11, 57–67. [Google Scholar]
- Kean, J.W.; Smith, J.D. Flow and boundary shear stress in channels with woody bank vegetations. In Riparian Vegetation and Fluvial Geomorphology; AGU, Water Science and Application Series: Washington, DC, UDA, 2004; Chapter 8; pp. 237–252. [Google Scholar]
- Thomas, T.; Williams, J. Large eddy simulation of turbulent flow in an asymmetric compound open channel. J. Hydraul. Res. 1995, 33, 27–41. [Google Scholar] [CrossRef]
- Liu, X.; Garcia, M.H. Three-dimensional numerical model with free water surface and mesh deformation for local sediment scour. J. Hydraul. Eng. 2008, 134, 203–217. [Google Scholar] [CrossRef]
- Pu, J.H. Turbulent rectangular compound open channel flow study using multi-zonal approach. Environ. Fluid Mech. 2019, 19, 785–800. [Google Scholar] [CrossRef]
- Pu, J.H.; Pandey, M.; Hanmaiahgari, P.R. Analytical modelling of sidewall turbulence effect on streamwise velocity profile using 2D approach: A comparison of rectangular and trapezoidal open channel flows. J. Hydro Environ. Res. 2020, 32, 17–28. [Google Scholar] [CrossRef]
- Houjou, K.; Shimizu, Y.; Ishii, C. Calculation of boundary shear stress in open channel flow. J. Hydrosci. Hydraul. Eng. 1990, 8, 21–37. [Google Scholar]
- Kean, J.W.; Kuhnle, R.A.; Smith, J.D.; Alonso, C.V.; Langendoen, E.J. Test of a method to calculate near-bank velocity and boundary shear stress. J. Hydraul. Eng. 2009, 135, 588–601. [Google Scholar] [CrossRef]
- Cassan, L.; Roux, H.; Dartus, D. Velocity distribution in open channel flow with spatially distributed roughness. Environ. Fluid Mech. 2020, 20, 321–338. [Google Scholar] [CrossRef]
- Einstein, H.A. The Bed-Load Function for Sediment Transportation in Open Channel Flows; Technical Bulletin No. 1026; Soil Conservation Services U.S. Department of Agriculture: Washington, DC, USA, 1950; 78p. [Google Scholar]
- Yalin, M.S. Mechanics of Sediment Transport, 1st ed.; Pergamon: Oxford, NY, USA, 1977. [Google Scholar]
- Naot, D.; Rodi, W. Calculation of Secondary Currents in Channel Flow. J. Hydraul. Eng. 1982, 108, 948–968. [Google Scholar]
- Pu, J.H.; Wei, J.; Huang, Y. Velocity Distribution and 3D Turbulence Characteristic Analysis for Flow over Water-Worked Rough Bed. Water 2017, 9, 668. [Google Scholar] [CrossRef]
- Ligrani, P.M.; Moffat, R.J. Structure of transitionally rough and fully rough turbulent boundary layers. J. Fluid Mech. 1986, 162, 69–98. [Google Scholar] [CrossRef]
- Nikuradse, J. Stromungsgesetze in Rauhen Rohren (English Translation: Laws of Flow in Rough Pipes; National Advisory Committee for Aeronautics: Washington, DC, USA, 1933. [Google Scholar]
- Cooper, J.R.; Tait, S.J. The spatial organisation of time-averaged streamwise velocity and its correlation with the surface topography of water-worked gravel beds. Acta Geophys. 2008, 56, 614–642. [Google Scholar] [CrossRef]
- Lashkarbolouk, H.; Kirkpatrick, M.; Williamson, N.; Armfield, S.W.; Lin, W. Direct Numerical Simulation and Large Eddy Simulation of Wind Shear Effects on non-Stratified Open Channel Flow. In Proceedings of the 21st Australasian Fluid Mechanics Conference, North Terrace, Australia, 10–13 December 2018. [Google Scholar]
- Wróbel-Niedźwiecka, I.; Drozdowska, V.; Piskozub, J. Effect of drag coefficient formula choice on wind stress climatology in the North Atlantic and the European Arctic. Oceanologia 2019, 61, 291–299. [Google Scholar] [CrossRef]
- Wu, J. Wind stress and surface roughness at air-sea interface. J. Geophys. Res. 1969, 74, 444–455. [Google Scholar] [CrossRef]
- PDE Solutions Inc: Flexpde 7. 2016. Available online: http://www.pdesolutions.com (accessed on 28 October 2020).
- Khodashenas, S.R.; Paquier, A. A geometrical method for computing the distribution of boundary shear stress across irregular straight open channels. J. Hydraul. Res. 1999, 37, 381–388. [Google Scholar] [CrossRef]
- Knight, D.W.; Sterling, M. Boundary Shear in Circular Pipes Running Partially Full. J. Hydraul. Eng. 2000, 126, 263–275. [Google Scholar] [CrossRef]
- Replogle, J.A.; Chow, V.T. Tractive-Force Distribution in Open Channels. J. Hydraul. Div. 1966, 92, 169–191. [Google Scholar] [CrossRef]
- Wang, H.; Beckingham, L.K.; Johnson, C.Z.; Kiri, U.R.; Chanson, H. Interactions between Large Boundary Roughness and High Inflow Turbulence in Open Channel: A Physical Study into Turbulence Properties to Enhance Upstream Fish Migration; Hydraulic Model Report CH103/16; School of Civil Engineering, The University of Queensland: St. Lucia, Australia, 2016. [Google Scholar]
- Ghosh, S.N.; Roy, N. Boundary shear distribution in open channel flow. J. Hydraul. Div. 1970, 96, 967–994. [Google Scholar] [CrossRef]
- Yuen, Y. A Study of Boundary Shear Stress, Flow Resistance and Momentum Transfer in Open Channels with Simple and Compound Trapezoidal Cross-Section. Ph.D. Thesis, University of Birmingham, Birmingham, UK, 1989. [Google Scholar]
- Lane, E.W. Progress report on studies on the design of stable channels by the bureau of reclamation. Proc. ASCE 1953, 79, 1–30. [Google Scholar]
- Ghosh, S.N.; Mehta, P.L. Technical Note. Boundary Shear Distribution in A Compound Channel with Varying Roughness Distribution. Proc. Inst. Civ. Eng. 1974, 57, 159–163. [Google Scholar] [CrossRef]
- Rajaratnam, N.; Ahmadi, R. Hydraulics of Channels with Flood-Plains. J. Hydraul. Res. 1981, 19, 43–60. [Google Scholar] [CrossRef]
- Knight, D.W. Boundary shear in smooth and rough channels. J. Hydraul. Div. 1981, 107, 839–851. [Google Scholar] [CrossRef]
- Nezu, I.; Nakagawa, H. Cellular secondary currents in straight conduit. J. Hydraul. Eng. 1984, 110, 173–193. [Google Scholar] [CrossRef]
- Chiu, C.L. Velocity distribution in open channel flows. J. Hydraul. Eng. 1989, 115, 576–594. [Google Scholar] [CrossRef]
- Khodashenas, S.R.; Abderrezzak, K.E.K.; Paquier, A. Boundary shear stress in open channel flow: A comparison among six methods. J. Hydraul. Res. 2008, 46, 598–609. [Google Scholar] [CrossRef]
- Plate, E.J.; Goodwin, C.R. The Influence of Wind on Open Channel Flow; Hydraulic Engineering Reports (ASCE); ASCE: Reston, VA, USA, 1965; pp. 391–423. [Google Scholar]
Publisher’s Note: MDPI stays neutral with regard to jurisdictional claims in published maps and institutional affiliations. |
© 2021 by the authors. Licensee MDPI, Basel, Switzerland. This article is an open access article distributed under the terms and conditions of the Creative Commons Attribution (CC BY) license (https://creativecommons.org/licenses/by/4.0/).

