Article

Calcite Dissolution and Bioneutralization of Acidic Wastewater in Biosand Reactors

by
Gareth Alistair Holtman
1,2,
Rainer Haldenwang
2 and
Pamela Jean Welz
1,*
1
Applied Microbial and Health Biotechnology Institute (AMHBI), Cape Peninsula University of Technology, Cape Town 7530, South Africa
2
Department of Civil Engineering, Cape Peninsula University of Technology, Cape Town 7530, South Africa
*
Author to whom correspondence should be addressed.
Water 2022, 14(21), 3482; https://doi.org/10.3390/w14213482
Submission received: 15 September 2022 / Revised: 21 October 2022 / Accepted: 28 October 2022 / Published: 31 October 2022
(This article belongs to the Section Wastewater Treatment and Reuse)

Abstract

:
Acidic wastewaters such as winery wastewater require treatment to increase the pH before discharge into the environment. Biosand filters have been shown to reduce the organic load while simultaneously providing a buffering function. Previous research has shown increases in pH which was assumed to mainly take place via dissolution of calcite from the sand particles. This study investigated the possible role of biotic mechanisms for pH adjustment in sand column experiments by comparing results obtained from irradiated (biotic) and non-irradiated (biotic and abiotic) sand columns extracted from biosand filters used to treat winery wastewater. The columns were fed with either synthetic winery wastewater or filtered water (control). It was shown that the specific hydroxide concentrations in the eluant from the non-irradiated columns was significantly (p < 0.05) higher than in the eluant from the irradiated columns (1.1 × 10⁻⁵ vs. 4.0 × 10⁻⁶ M/kgsand−1), indicating the presence of both biotic (average 4.5 ± 0.13%) and abiotic (average 95.5 ± 0.16%) pH increases. Using multivariate statistical tools to analyze a combination of parameters linked with biotic and abiotic pH adjustment, significant differences (ANOVA, p < 0.05) were found between the four treatment groups (irradiated/non-irradiated SWW and control) and the groups showed good clustering in cluster plots (group average) linkages, and principal component analysis plots.

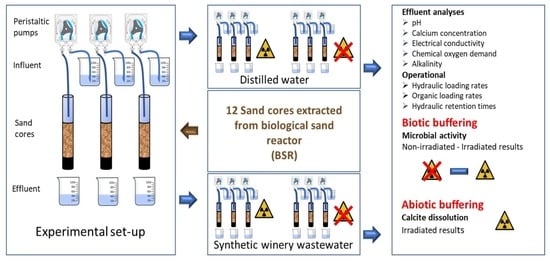
Graphical Abstract

1. Introduction

The process of making wine results in the generation of 0.2 to 14 L of typically organic rich, acidic, and sometimes saline winery wastewater (WW) for each litre of wine produced [1,2,3]. It has been shown that biosand reactors (BSRs) containing locally available dune sand have higher organic removal rates (ORR) and spatial footprints than other passive systems treating WW [4]. These systems are inexpensive to install and maintain and are well suited for remediation of WW for irrigation purposes because they are able to reduce the organic load while simultaneously increasing the pH and sodium adsorption ratio (SAR) of acidic WW [1,4,5].
Calcite and aragonite are mineralised forms of calcium carbonate (CaCO3) that make up limestone. In a previous study conducted with BSRs, it was assumed that dissolution of calcite was the primary abiotic WW buffering mechanism [1] because the sand particles consisted of quartz (81%) and calcite (18%) as the dominant minerals [5,6]. Apart from buffering acidic WW, irrigation with WW containing calcium (Ca2+) from CaCO3 dissolution can potentially improve the quality of sodic soils by increasing the SAR [7,8].
Calcite dissolution reactions (Equations (1)–(3)) are reversible and take place at the solid-liquid interface [9]. The reactions are mediated by the pH and the partial pressure of carbon dioxide (CO2). The first reaction (Equation (1)) involves protonation of CaCO3 to Ca2+ and bicarbonate (HCO3). In the other reactions, carbonic acid (H2CO3) and water (H2O) are the reactants responsible for CaCO3 dissolution (Equations (2) and (3), respectively).
CaCO3 + H+ ↔ Ca2+ + HCO3
CaCO3 + H2CO3 ↔ Ca2+ + 2HCO3
CaCO3 + H2O ↔ Ca2+ + HCO3 + OH
More traditionally, the addition of limestone, calcite, or other CaCO3-rich residues such as eggshells, seashells or concrete aggregates have been applied for passive remediation of acid mine drainage (AMD) [10,11], with various buffering and metal precipitation reactions taking place [12,13]. Calcite dissolution is also used for the mineralisation of desalinated potable water [9]. This is usually achieved by the addition of sulfuric acid (H2SO4) or by flushing with CO2 to form H2CO3, but it has recently been shown that dissolution using acetate (CH3COO) results in superior potable water quality [9]. The excellent dissolution kinetics achieved with CH3COO [9] suggest that WW may be an ideal calcite dissolution agent because (i) volatile fatty acids (VFAs) constitute up to 60% of the organic fraction of WW [2] and (ii) VFAs are formed during organic biodegradation in BSRs, with CH3COO being the major contributor to the chemical oxygen demand (COD) in the final effluent [14].
The rate of CaCO3 dissolution is also correlated with particle size as smaller particles provide larger overall reaction surface areas [5,11]. In the case of AMD, the Ca2+ can react with sulfate (SO42−) to form gypsum (CaSO4) on the particle surfaces, slowing dissolution reaction kinetics [13]. In addition, efficiency of passive calcite-based systems for treatment of iron (Fe)-rich AMD can be restricted by coating of the particles with Fe oxides [11]. These reactions should theoretically be limited in the case of WW because Fe and SO42− concentrations are lower and acidity is more likely associated with the presence of organic acids [2].
Changes in pH can also be microbially mediated (bioneutralization). For example, generation of alkalinity (Alk.) and increased pH has been associated with consumption of H+ by microbial denitrification, SO42− reduction, and reduction of metals stimulated by the addition of organic carbon (OC) as an electron donor [15]. Concurrent biotic and abiotic neutralisation of acidic saline waters has been demonstrated in bioreactors containing either compost or municipal organic waste and limestone, where limestone dissolution accounted for 78–91% of Alk., and bacterial SO42− reduction for 9–22% [16]. In alkaline leachates and other higher pH waters, reverse reactions (Equations (1)–(3)) can lead to CaCO3 precipitation, with concomitant pH decreases [17]. The reaction rates can be increased by aeration and microbial release of CO2 from organic substrates viz. concurrent biotic and abiotic mechanisms [17]. Haloalkalophilic bacterial fermentative generation of organic acids has also been associated with bioneutralization of alkaline bauxite residues [18,19].
Passive biochemical reactors (PBRs) for remediation of AMD typically contain organic microbial electron donors such as wood chips, chicken manure, leaf compost, and lignocellulosic waste and inorganic buffering agents such as calcite [20]. Such systems operate best at pH values between 5 and 8 [20]. If some cases, Fe reducing bacteria may compete for substrate with the SO42− reducing bacteria, retarding SO42− reduction rates [20]. Similar principles have been applied for the rehabilitation of degraded soils with high metal concentrations by re-saturating dried sulfuric soils [21]. The reduced conditions lead to the formation of metal sulfides, which is enhanced by the action of SO42− reducing bacteria in the presence of electron donors from lignocellulosic organic matter [21].
In lab-scale BSRs containing sand with no detectable calcite, the pH of acidic WW increased from inlet to outlet, strongly suggesting that biotic neutralization mechanisms exist in BSRs [22]. It is plausible that electron donors for reduction reactions are supplied by the major organics ethanol (C2H5OH), VFAs, sugars, (poly)phenolics and other minor organics, the quantities of which vary on a seasonal basis and from winery to winery [2].
In order to verify the hypothesis that both biotic and abiotic buffering of WW (and other acidic organic wastewaters) occur in BSRs, sand columns were extracted from pilot scale BSRs that had been operational for >2 years and contained functionally adapted microbial communities. Half of the columns were irradiated, and both irradiated and non-irradiated columns were fed with either (i) filtered water (controls), or (ii) synthetic WW (SWW). Buffering in irradiated columns was assumed to be completely abiotic, while biotic buffering was determined by comparing the results obtained from the non-irradiated with those obtained from the irradiated columns.

2. Materials and Methods

2.1. Column Experiments: Set-Up

Twelve core sand samples were extracted from pilot vertical flow BSRs that had been operational at a winery in the Western Cape, South Africa for over 2 years [5] (Figure 1). The composition of the dune sand from the quarry site (approximately 81% quartz and 18% calcite) has been described previously in detail [5,6]. Cores were extracted from the surface of the BSRs using acrylic pipes (40 mm OD and 30 mm ID) which were sharpened on one end to promote penetration into the sand. The pipes were pushed carefully into the sand with as little disruption to the structure of the material as possible. After extraction of approximately 350 mm sand, the cores were capped. Nine of the 12 cores were sterilized by irradiation at 30 kGy at a commercial facility as previously described [23].
The cores were then set-up and used in flow-through column experiments (see graphical abstract for set-up). They were fitted with end pieces that retained the sand but did not impede the flow of liquid through the columns. Influent was pumped using individual infusing pumps via tubing ending in T-pieces onto the top of the sand and allowed to flow passively through the sand via gravity.

2.2. Operation of Column Experiments

In order to determine whether buffering (neutralization) of WW and possibly other acid wastewaters in BSRs is due to abiotic (notably via calcite dissolution), biotic (microbial) or combined biotic/abiotic factors, the irradiated and non-irradiated column replicates were fed each 24 h for 48 h with 400 mL of either: (i) filtered water (control), or (ii) synthetic WW with a pH 3.07. In addition, secondary negative controls consisting of fresh sand were fed with SWW (as per ii). The SWW components were added to give total COD (COD) concentrations of 1000 mg/L, made up of 500 mgCOD/L C2H5OH, 400 mgCOD/L acetic acid and 50 mgCOD/L gallic acid, 50 mgCOD/L vanillin, as previously described [23,24]. Each experiment was conducted in triplicate. In order to ensure robust microbial activity, the non-irradiated column experiments commenced within 4 h of coring. Each set of experimental replicates (n = 3) was fed with autoclaved influent from the same receptacle to ensure influent consistency. In order to reduce downstream microbial activity, the eluant was collected into separate autoclaved sealed beakers held within cooler boxes containing dry ice. The design operational parameters are provided in Table 1. The flow rate was set to mimic the hydraulic loading rate (HLR) of the BSRs from which they were extracted, which allowed full saturation of the sand in the columns without excessive pooling. The design HLR was calculated as previously described [1].

2.3. Eluant Sampling and Analytical Procedures

Composite eluant samples were taken after 24 h (0–24 h) and after 48 h (24–48 h). The pH was determined according to the manufacturer’s instructions using a CyberScan pH300 meter (Eutech Instruments, Singapore) and appropriately calibrated pH probe PHWP300/02K (Eutech Instruments, Singapore). The pH was converted into OH concentrations before calculating the means and standard deviations from the mean. The electrical conductivity (EC) was determined using a hand-held Oakton ECTestr 11+ multi-range, cup-style pocket conductivity meter (Eutech Instruments, Singapore Cat No: 35665-35). This instrument is capable of reading conductivity with a range of 0 μS/m to 20.00 mS/m. The COD concentrations were determined on the same day of the sampling using a Merck (Merck®, Whitehouse Station, New Jersey, USA) Spectroquant® Pharo instrument and Merck Spectroquant® cell tests (cat. no. 1.14895.0001). Total Alk. was measured using the Merck titrimetric method with titration pipette MQuant catalogue number (1.111109.0001), according to the manufacturer’s instructions. The organic composition of the eluants was determined using high pressure liquid chromatography (HPLC) as previously described [23,24]. At the end of the experiments, the sand in each column was allowed to drain for 24 h, dried and weighed (range 310–404 g) and the physicochemical results were specifically adjusted to account for the unavoidable variability in the amount of sand within each column to give specific values (per kg of sand).

2.4. Statistical Analysis

T-tests were performed using Microsoft Excel (Microsoft, Redmond, Washington, USA). Paired 2 sample for means T-tests were used to determine (i) significant differences between irradiated and non-irradiated experimental results, and (ii) correlations between physicochemical parameters for each column replicate. Two sample T-tests assuming unequal variances were used to determine significant differences between treatments (control and SWW). Differences were deemed significant if t-crit < t-stat and p < 0.05. Standard deviations (SD) were calculated as SD from the mean. Multivariate statistical analyses (principal component analyses (PCA), analysis of similarity (ANOSIM), and cluster analyses (group average linkage) on normalised physicochemical data using Primer 7®software (Primer-e, Auckland, New Zealand).
All statistical differences were deemed significant if p < 0.05 and p ≥ 0.001 and highly significant if p < 0.001. These criteria are applied throughout the manuscript when referring to “significant” or “highly significant”.

3. Results and Discussion

3.1. Operational Parameters

In order to closely mimic the physicochemical and microbial structures within the BSRs in the column experiments, the content of each column was kept intact from coring through experimentation. Although every effort was made to retrieve similar amounts of sand in each column (height approximately 350 mm), some variability in the weight of sand in each column was unavoidable (Table 2). This translated into some differences in the HLR and HRT in the columns, albeit in a relatively narrow range (Table 2). The measured HLR and HRT (Table 2) that were achieved were close to the design values (Table 1) based on the actual flow rates in the BSR from which the cores were extracted. The cores therefore provided a good approximation of the “real world” situation.

3.2. Organic Biodegradation in Irradiated and Non-Irradiated Columns

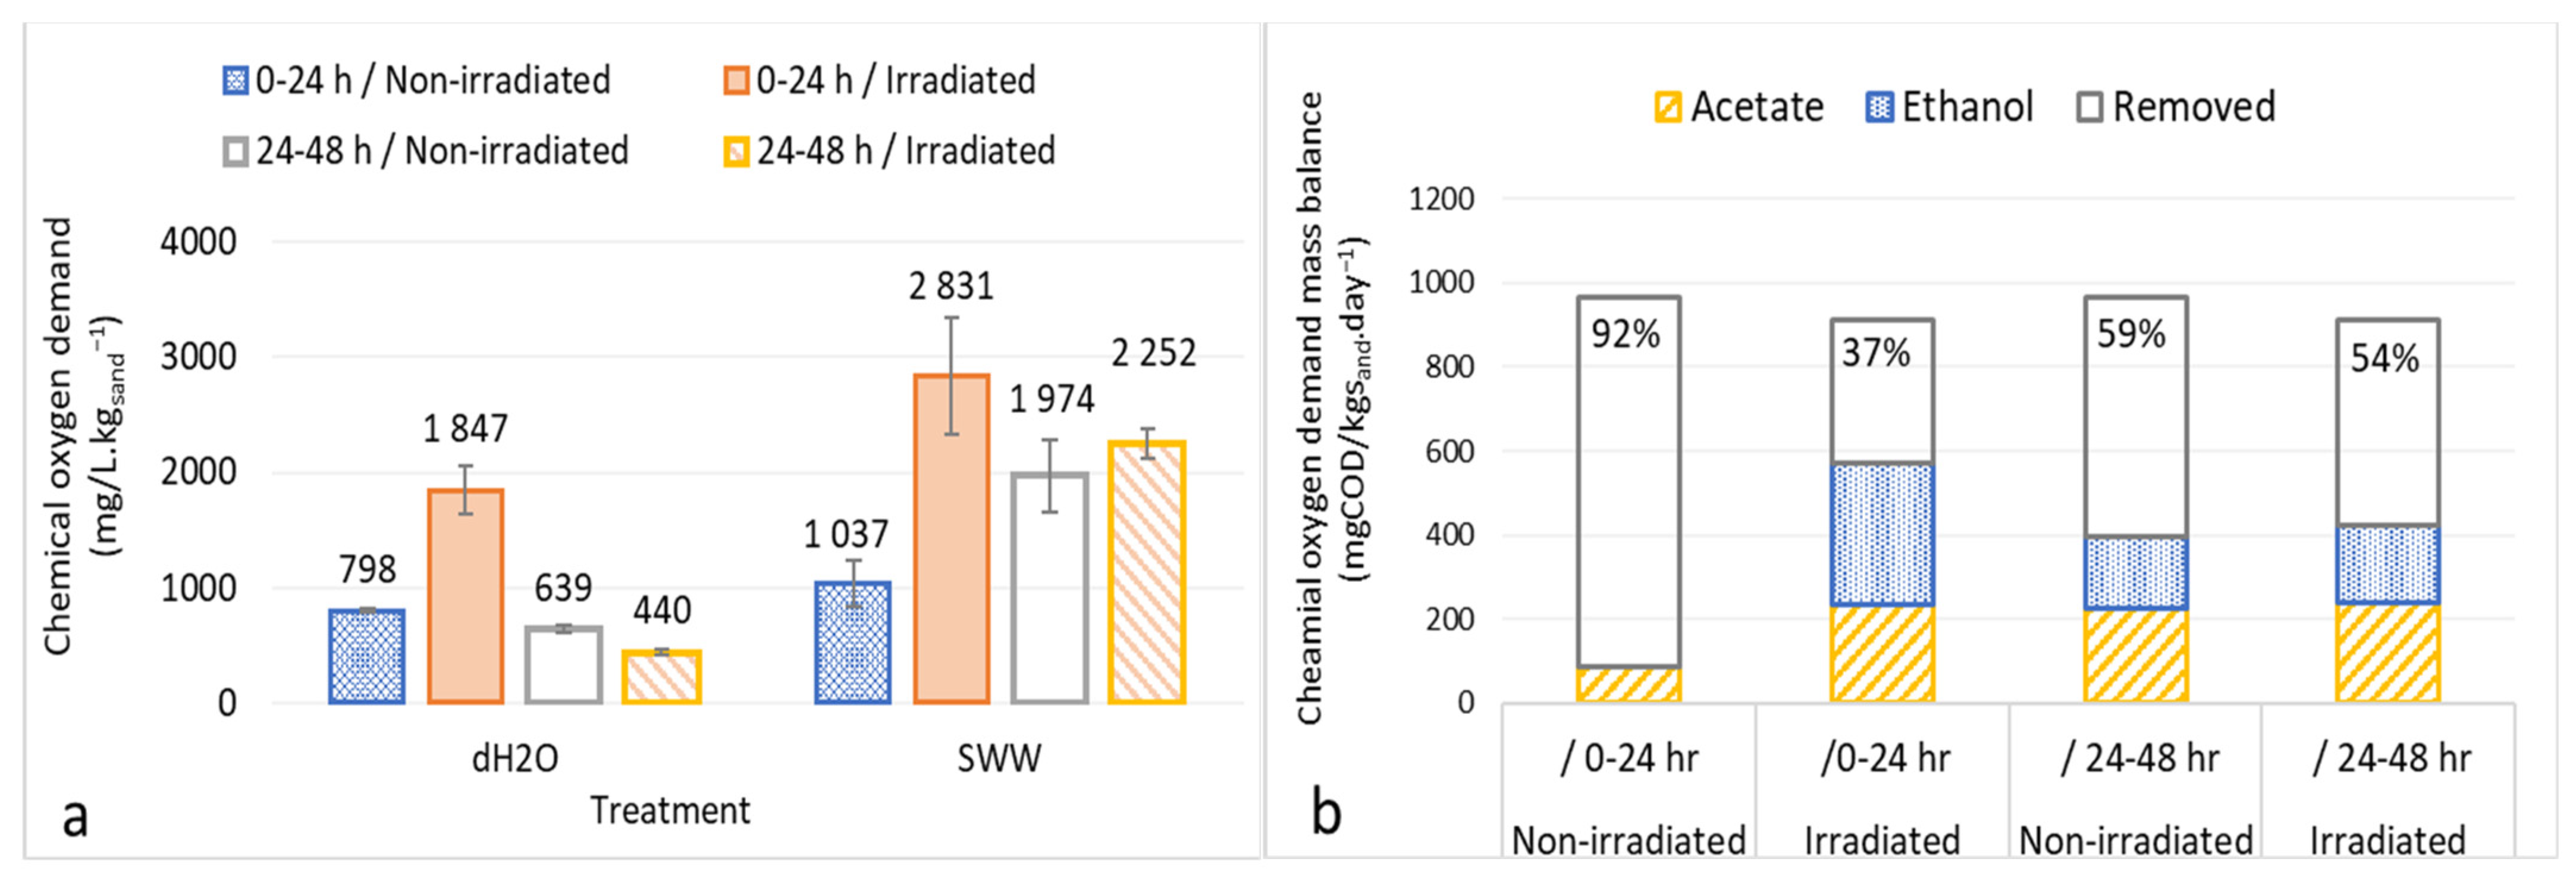
Residual organics and inorganics were unavoidably present in the cores extracted from the working BSRs. Consequently, although no organics were added to the columns, residual COD leached into the column eluants (Figure 2a), adding to the experimental complexity. This can be seen by: (i) the high average specific COD concentrations (spCOD) measured in the eluants from the control columns collected in the first 24 h, and (ii) the fact that the average spCOD was higher in the eluants collected over first 24 h (2527 mgCOD/L.kgsand−1) than provided in the influent (2831 mgCOD/L.kgsand−1) over the same period in the columns fed with SWW (Figure 2a).
The large and highly significant differences in average spCOD in the eluant collected from the irradiated columns of 1049 and 1804 mgCOD/L.kgsand−1, from the control columns and those fed with SWW, respectively, proved that good biodegradation rates were achieved in all the non-irradiated columns. However, no significant differences were found in the eluants that were collected after the first 24 h (24–48 h). It was therefore assumed that there was a temporal loss of sterility in the irradiated columns. Radiation is the preferred method for sterilizing sand, soil and sediment as it has minimal effects on the physicochemical properties of the substrate compared with other methods such as autoclaving [23,25,26]. Although sterile procedures were used and the radiation levels (30 kGy) were theoretically sufficient, factors such as shading and the presence of radiation resistant bacteria or spores can result in renewed microbial growth over time in substrates such as sand [23,25,26]. In summary, the highly significant differences in the spCOD measurements in the eluants from all the irradiated and non-irradiated columns over the first 24 h confirmed biotic activity and the relevance of the biotic/abiotic experiment, but indicated that interpretation of the physicochemical results are less relevant after 24 h.
For the columns fed with SWW, the OLR for the irradiated and non-irradiated columns were 772 ± 46 (range 726–819) gCOD/L.kgsand.day−1 and 760 ± 8.4 (range 752–768) gCOD/L.kgsand.day−1, respectively, providing a reasonable approximation of the design values (831 gCOD/L.kgsand.day−1) calculated for the operational BSR. Selected organics were measured in the eluant samples to substantiate organic biodegradation. Samples were screened for sugars, glycerol, C2H5OH, VFAs (CH3COO, propionate, butyrate), and selected phenolics (vanillin, gallic acid, vanillic acid, catechol). If present, the concentrations were measured. In the eluant from the control columns, random and negligible amounts of fructose and glycerol were detected (<8 mg/L average per experimental triplicate and CH3COO was also detected (0–32 mg/L), but only in the eluants collected during the first 24 h. No particular trends were discernible between replicates. This was not unexpected as the columns had been extracted from different spatial locations within the BSRs and some variability was inevitable.
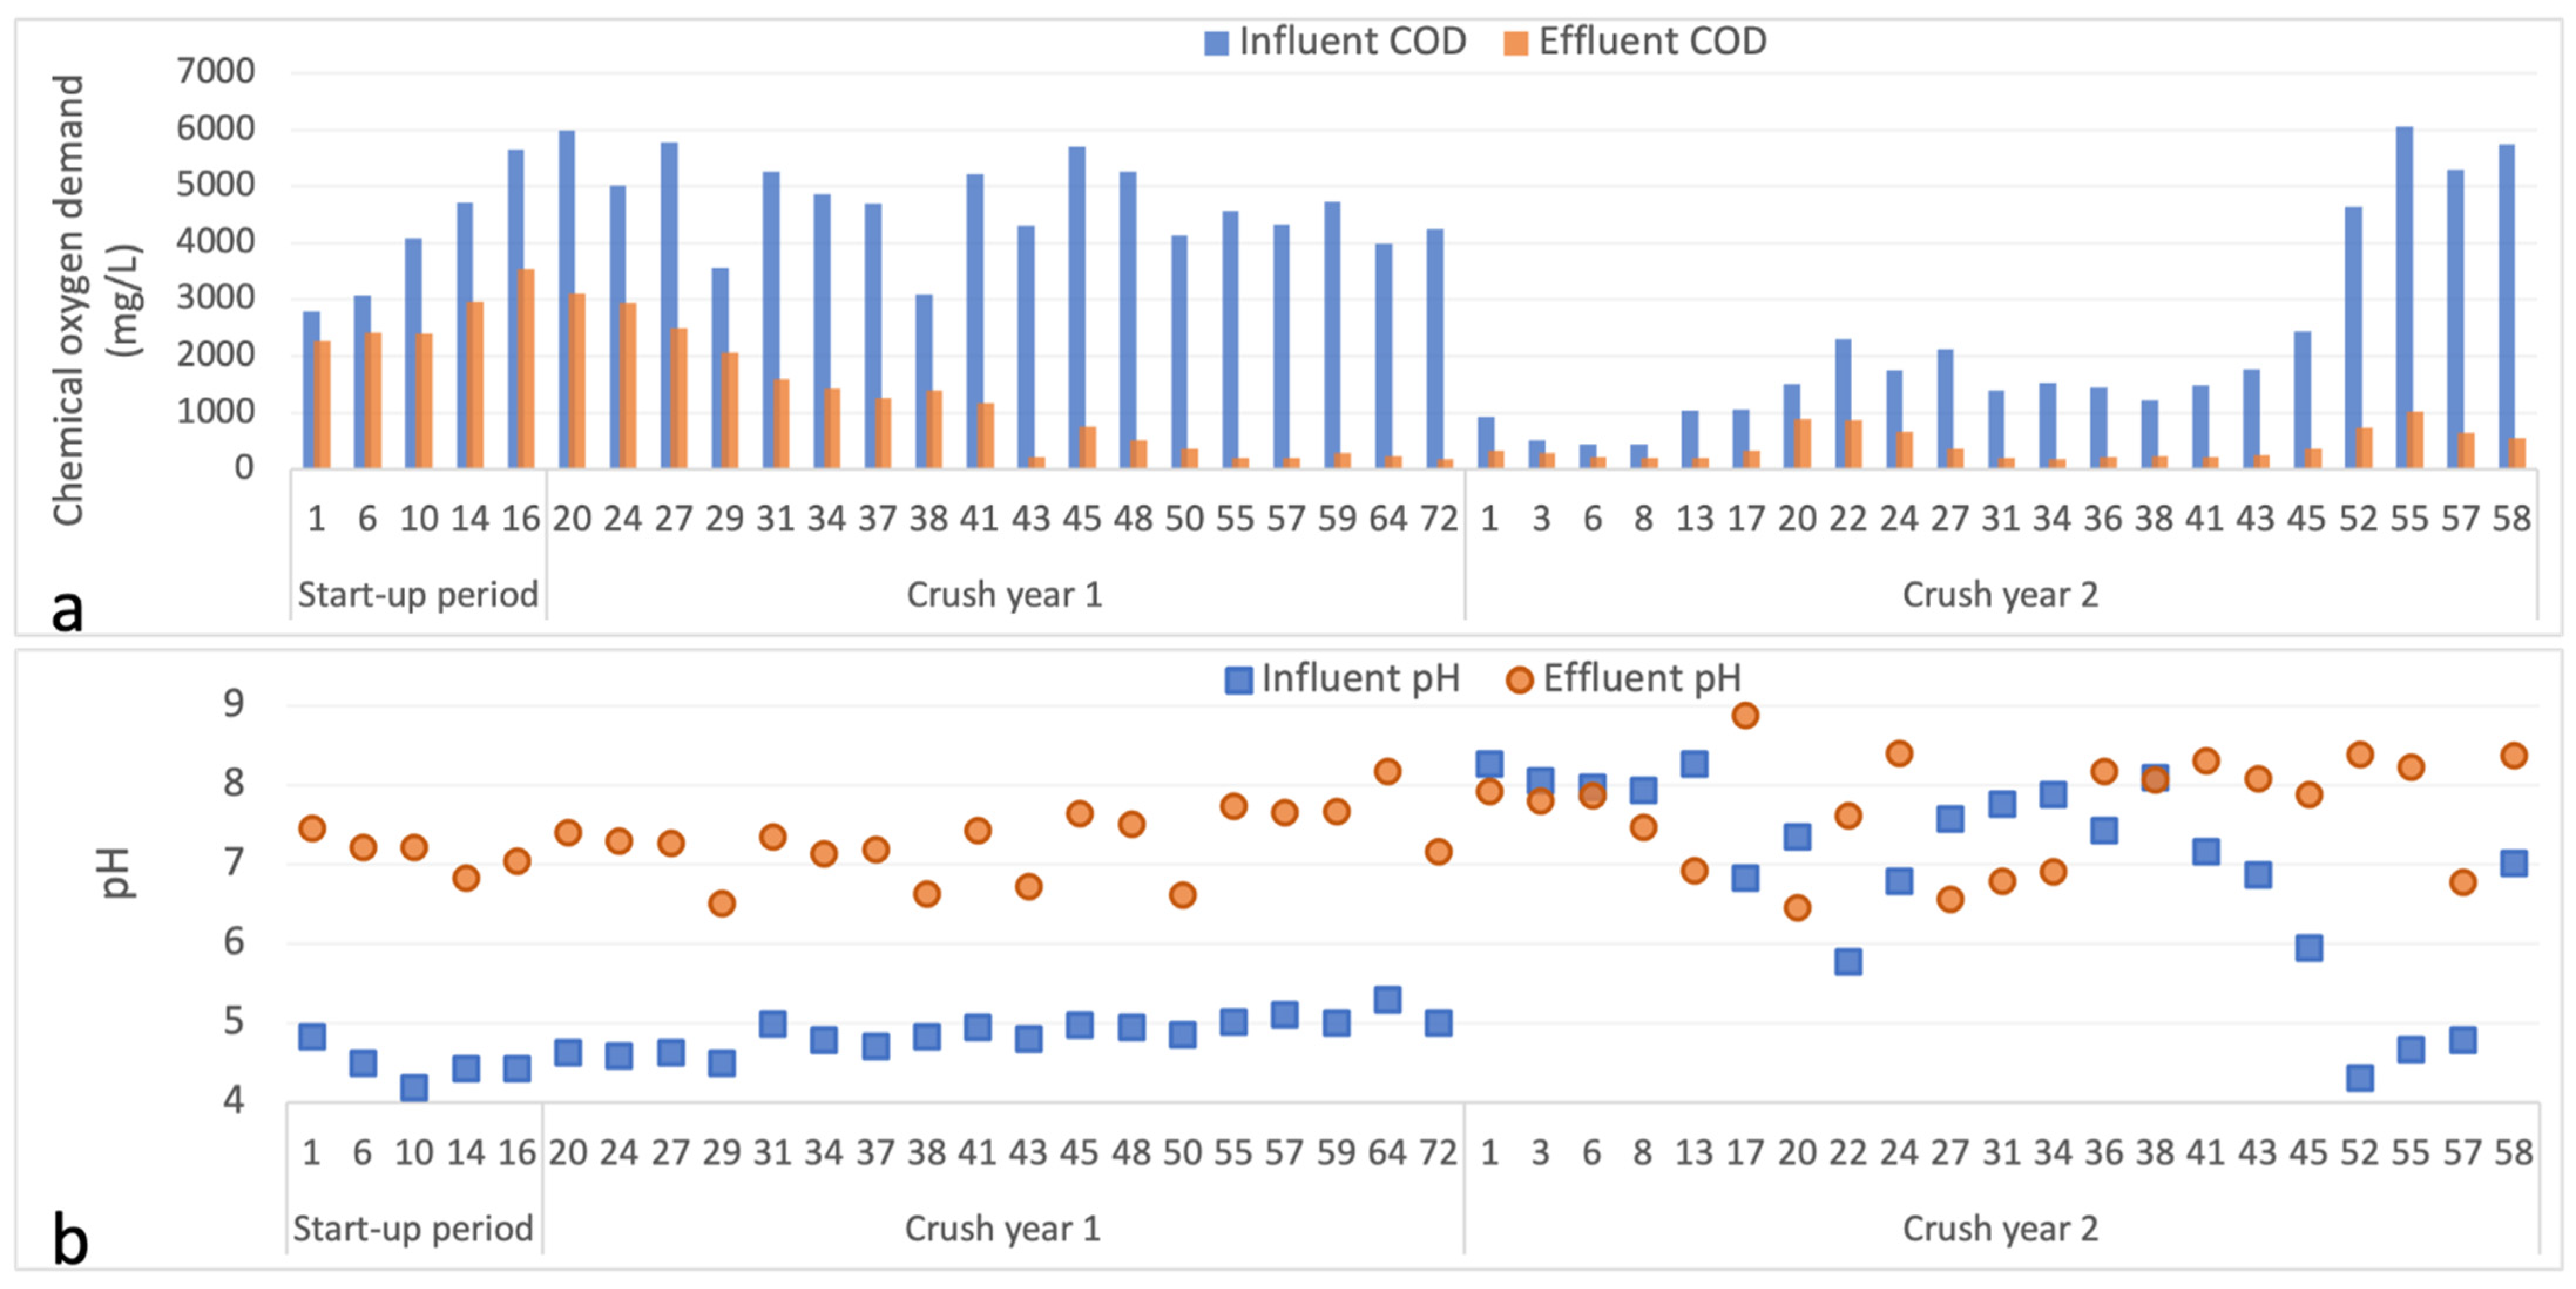
For the columns fed with SWW, mass balances were determined for the amounts of C2H5OH and CH3COO that were added in the influent and collected in the eluants. Over the first 24 h, all of the C2H5OH was removed in the non-irradiated columns, with 92% spCOD removal, while only 26% of the C2H5OH was removed in the irradiated columns, with only 37% spCOD removal (Figure 2b). These removal rates are likely over-estimated as existing WW from the BSR system would have eluted out first from the columns. The C2H5OH and CH3COO biodegradation rates were similar in the eluants collected from the irradiated and non-irradiated columns between 24 and 48 h (overall 54% and 59%, respectively). By way of comparison, when operated in continuous mode, the COD removal rates achieved during the crush periods in the vertical flow BSR system that the cores were extracted from ranged from 37% to 95% in year 1 of operation (including the start-up period), and 42% to 90% in year 2 of operation (Figure 3a).
The C2H5OH/CH3COO mass balances therefore proved unequivocally that biodegradation was taking place preferentially within the non-irradiated columns during the first 24 h and that there was a temporal loss of sterility in the irradiated columns.
It was not possible to identify the exact biotic neutralization mechanisms that took place within the cores due to: (i) the complexity and variability of the substrate (WW residuals) already existing within the pore spaces of the extracted cores, (ii) the possible presence of multiple biotic neutralization mechanisms, and (iii) the fact that elucidation of these mechanisms would require addition and monitoring of a range of different chemicals such as sulfates and nitrates which was not feasible in the context of this study.

3.3. Analysis of Eluant Hydroxide Ion, Alkalinity and Calcium Concentrations and Electrical Conductivity

In the pilot BSR system, the influent pH ranged from 4.2 to 8.3, but the eluant pH was maintained in the range of 6.5 to 8.9 (Figure 3b). In comparison, the eluant pH values from the columns ranged from 7.9 to 8.8 with influent pH values of 6.7 and 3.07 for the control (filtered water) and SWW, respectively, demonstrating similar functionalities between the BSR and columns.
Due to the loss of sterility in the columns after 24 h and the fact that the focus of the study was on determining the presence of biotic pH adjustment mechanisms, the discussion on the physicochemical analyses is mainly concentrated on the results obtained within the first 24 h. Details on the primary abiotic neutralization mechanism, namely, calcite dissolution, as well as the changes in the sizes and shapes of the calcite particles has previously been described in detail [5].
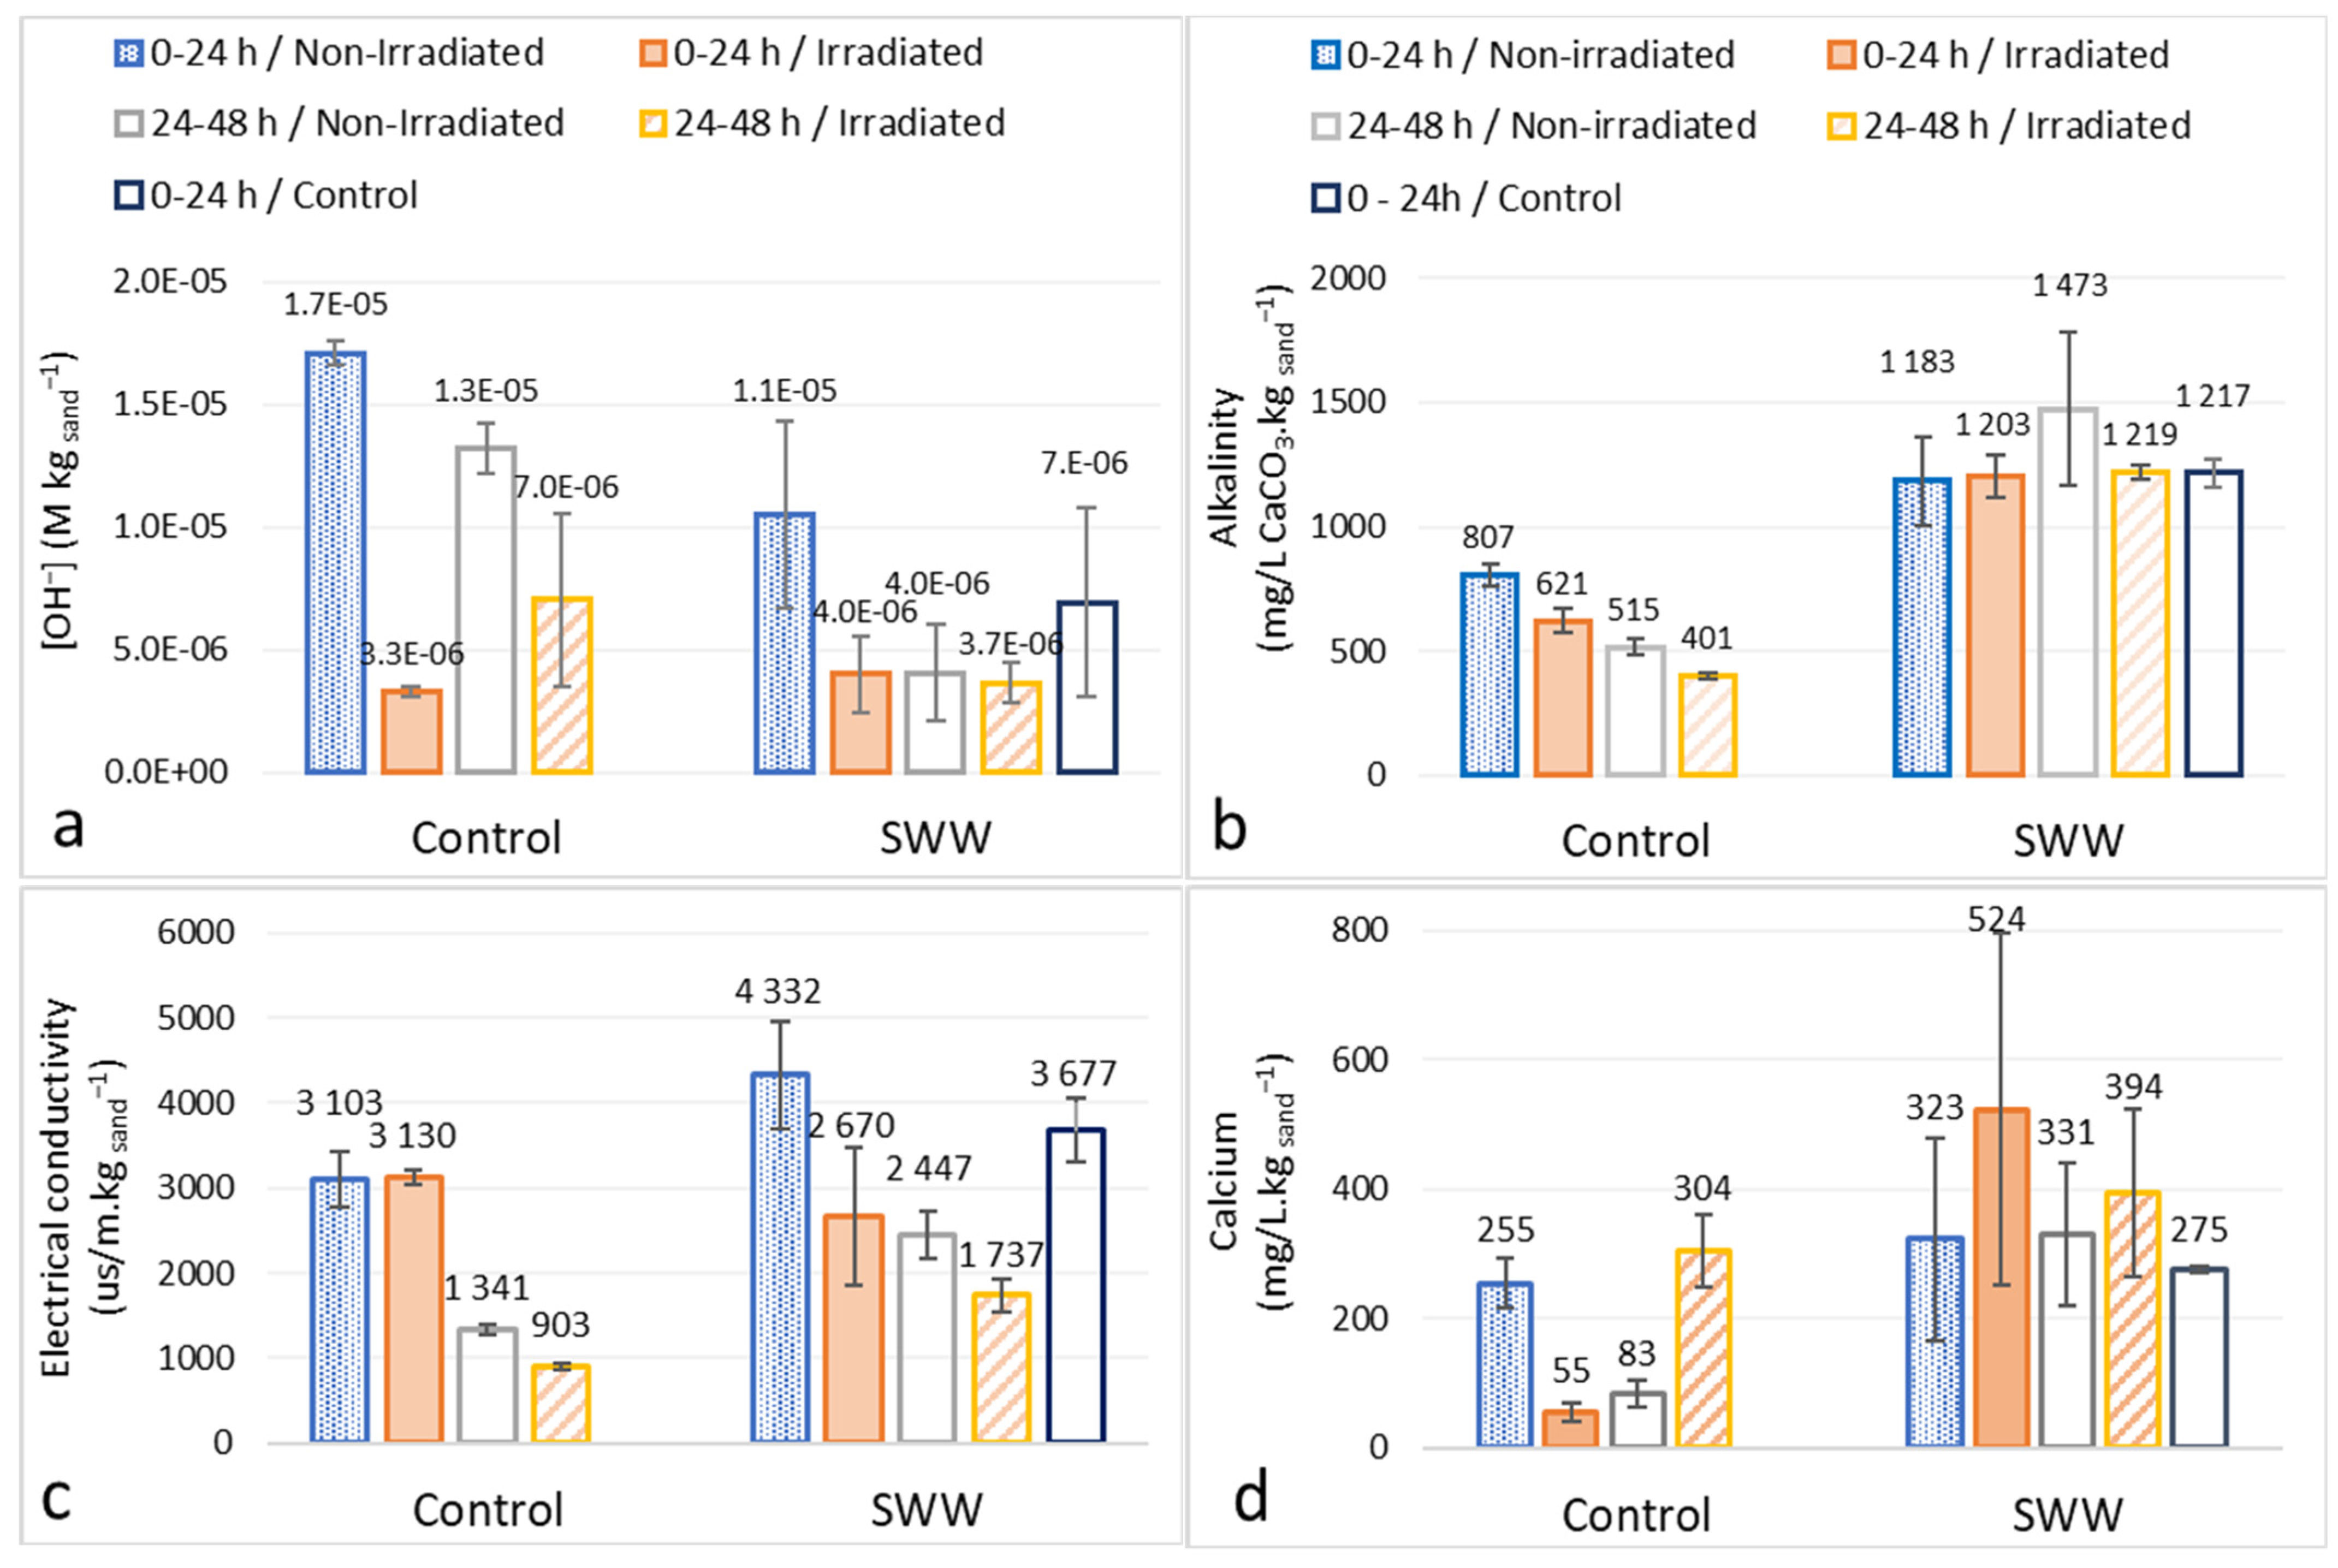
The specific OH concentrations (spOH) (Figure 4a) were significantly higher in the eluants collected from the non-irradiated than the irradiated columns for the control columns as well as those fed with SWW during the first 24 h of the experiment, clearly demonstrating a biotic component to increased pH. This was substantiated by the fact that there was no significant difference in the spOH in the eluants from the irradiated and non-irradiated samples collected between 24 and 48 h. It was hypothesized that the temporal loss of sterility in the irradiated columns allowed both biotic and abiotic pH adjustments to take place simultaneously in all columns after 24 h (in contrast to only abiotic mechanisms in the irradiated columns initially). The average biotic and abiotic contributions to spOH increases were calculated as 4.5 ± 0.13% and 95.5 ± 0.16%, respectively. This is likely an over-estimate as some microbial growth in the irradiated columns may have commenced before 24 h.
With the exception of spCa and spAlk. (Pearsons’ = 0.821), there were no significant correlations between the inter-related spOH, spAlk. spEC and specific Ca (spCa), the parameters most likely to reflect pH adjustment via calcite dissolution and/or biotic factors. There were no significant differences in the specific alkalinity (spAlk.), but highly significant differences in the specific EC (spEC) measurements in the 0–24 h eluants from the irradiated and non-irradiated columns fed with SWW (Figure 4b,c). In the case of spAlk. and specific SpCa, the measurements were significantly higher in the eluants from columns fed with SWW than from the control columns, indicating good solubilisation of calcite by the SWW as previously shown with CH3COO [9].
It has previously been shown that with fresh sand, abiotic calcite dissolution kinetics and mass balances can be accurately calculated using the Ca concentrations in the eluant from sand columns as a proxy for CaCO3 dissolution [5]. Using the calculated mass-balances from the column experiments in conjunction with historical calcium loss data obtained from the sand in a pilot BSF system in-situ at a winery, it was also shown the calcite would not be expended within the feasible lifespans of such BSF systems treating WW [5]. However, in this study, the eluant spCa concentrations were highly variable, and did not exhibit a distinct pattern (Figure 4d), indicating the complex nature of this ‘real world’ study using sand extracted from pilot BSRs, necessitated by the need to obtain functional microbial communities acclimated to WW.
It has also been previously been shown that laboratory-scale BSRs containing river sand with minimal calcite (<0.3% Ca) were able to increase the pH of diluted WW from 4.2 to 7.7 [6,22]. The lack of calcite in this system suggested that biotic pH adjustment was the primary WW neutralization mechanism, but this was not substantiated and only a limited number of samples were taken. This study has shown unequivocally that biotic pH adjustment can occur in BSRs treating WW. This is noteworthy because increases in the pH of acidic WW (and possibly other acidic organic effluents) may continue once calcite has been expended or can occur in instances where calcite-poor sands are employed. However, the use of calcite-containing sand is still recommended because the addition of Ca to the final effluent reduces the SAR and protects the receiving environment from becoming sodic if the effluent is used for irrigation purposes [1]. In such systems, the SAR and effluent pH should be monitored to the ensure that the receiving soils are protected, as previously described [5].
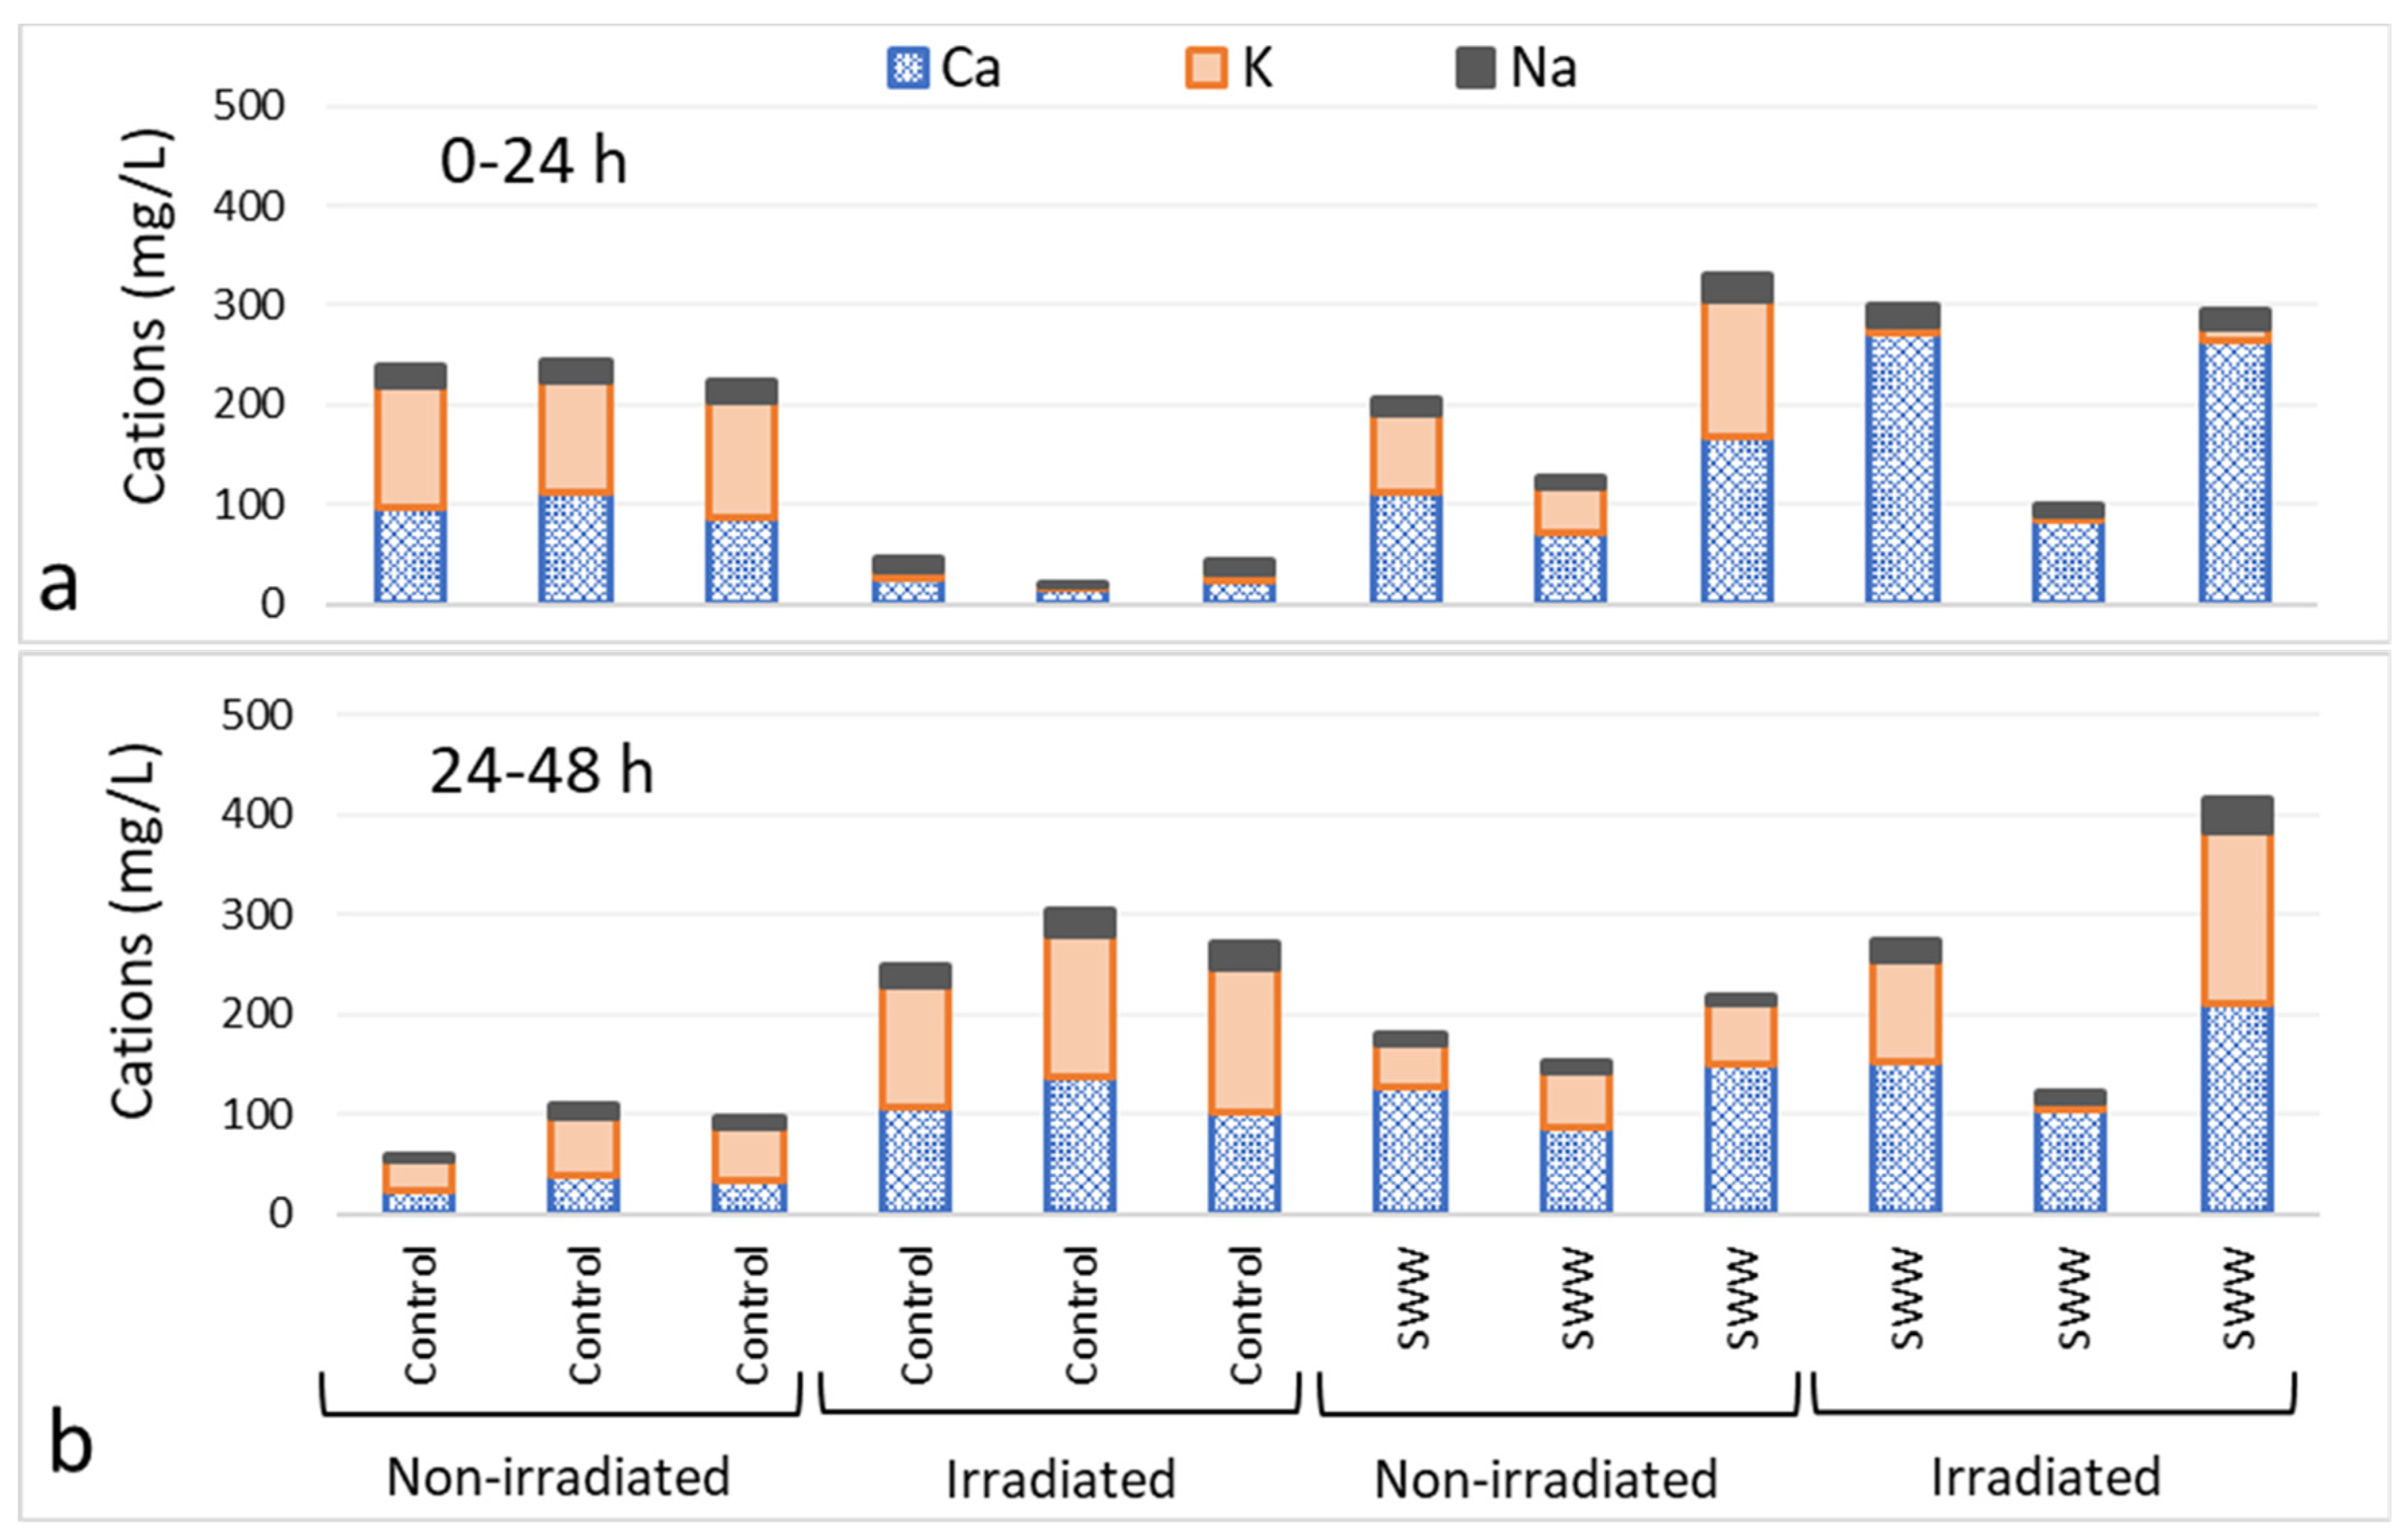
Not only were residual organics present in the pore water of the columns, but also other dissolved solids, most notably Na and K, which are commonly found in high concentrations in WW. By examining the Ca, Na and K concentrations measured in the eluant of all the replicates for the first (Figure 5a) and second (Figure 5b) 24-h period, it is clear that there was considerable variation in the character of the interpore WW, and that complex biotic and abiotic interactions were responsible for leaching of inorganics from the columns. As alluded to previously, univariate statistical analyses only showed a significant correlation between spCa and spAlk, demonstrating the effect of confounding variables on the study results.
In summary, the trends towards: (i) higher values of indicator parameters in the eluant from columns fed with SWW in comparison to those fed with filtered water and (ii) differences in values of indicator parameters in eluants from irradiated and non-irradiated columns, showed that: (i) SWW increased the solubilisation and leaching of Ca and other dissolved salts from the columns, (ii) solubilisation and/or leaching was increased by both biotic and abiotic interactions (iii) both biotic and abiotic mechanisms were responsible for pH increases in the eluant from inlet to outlet in non-irradiated columns.
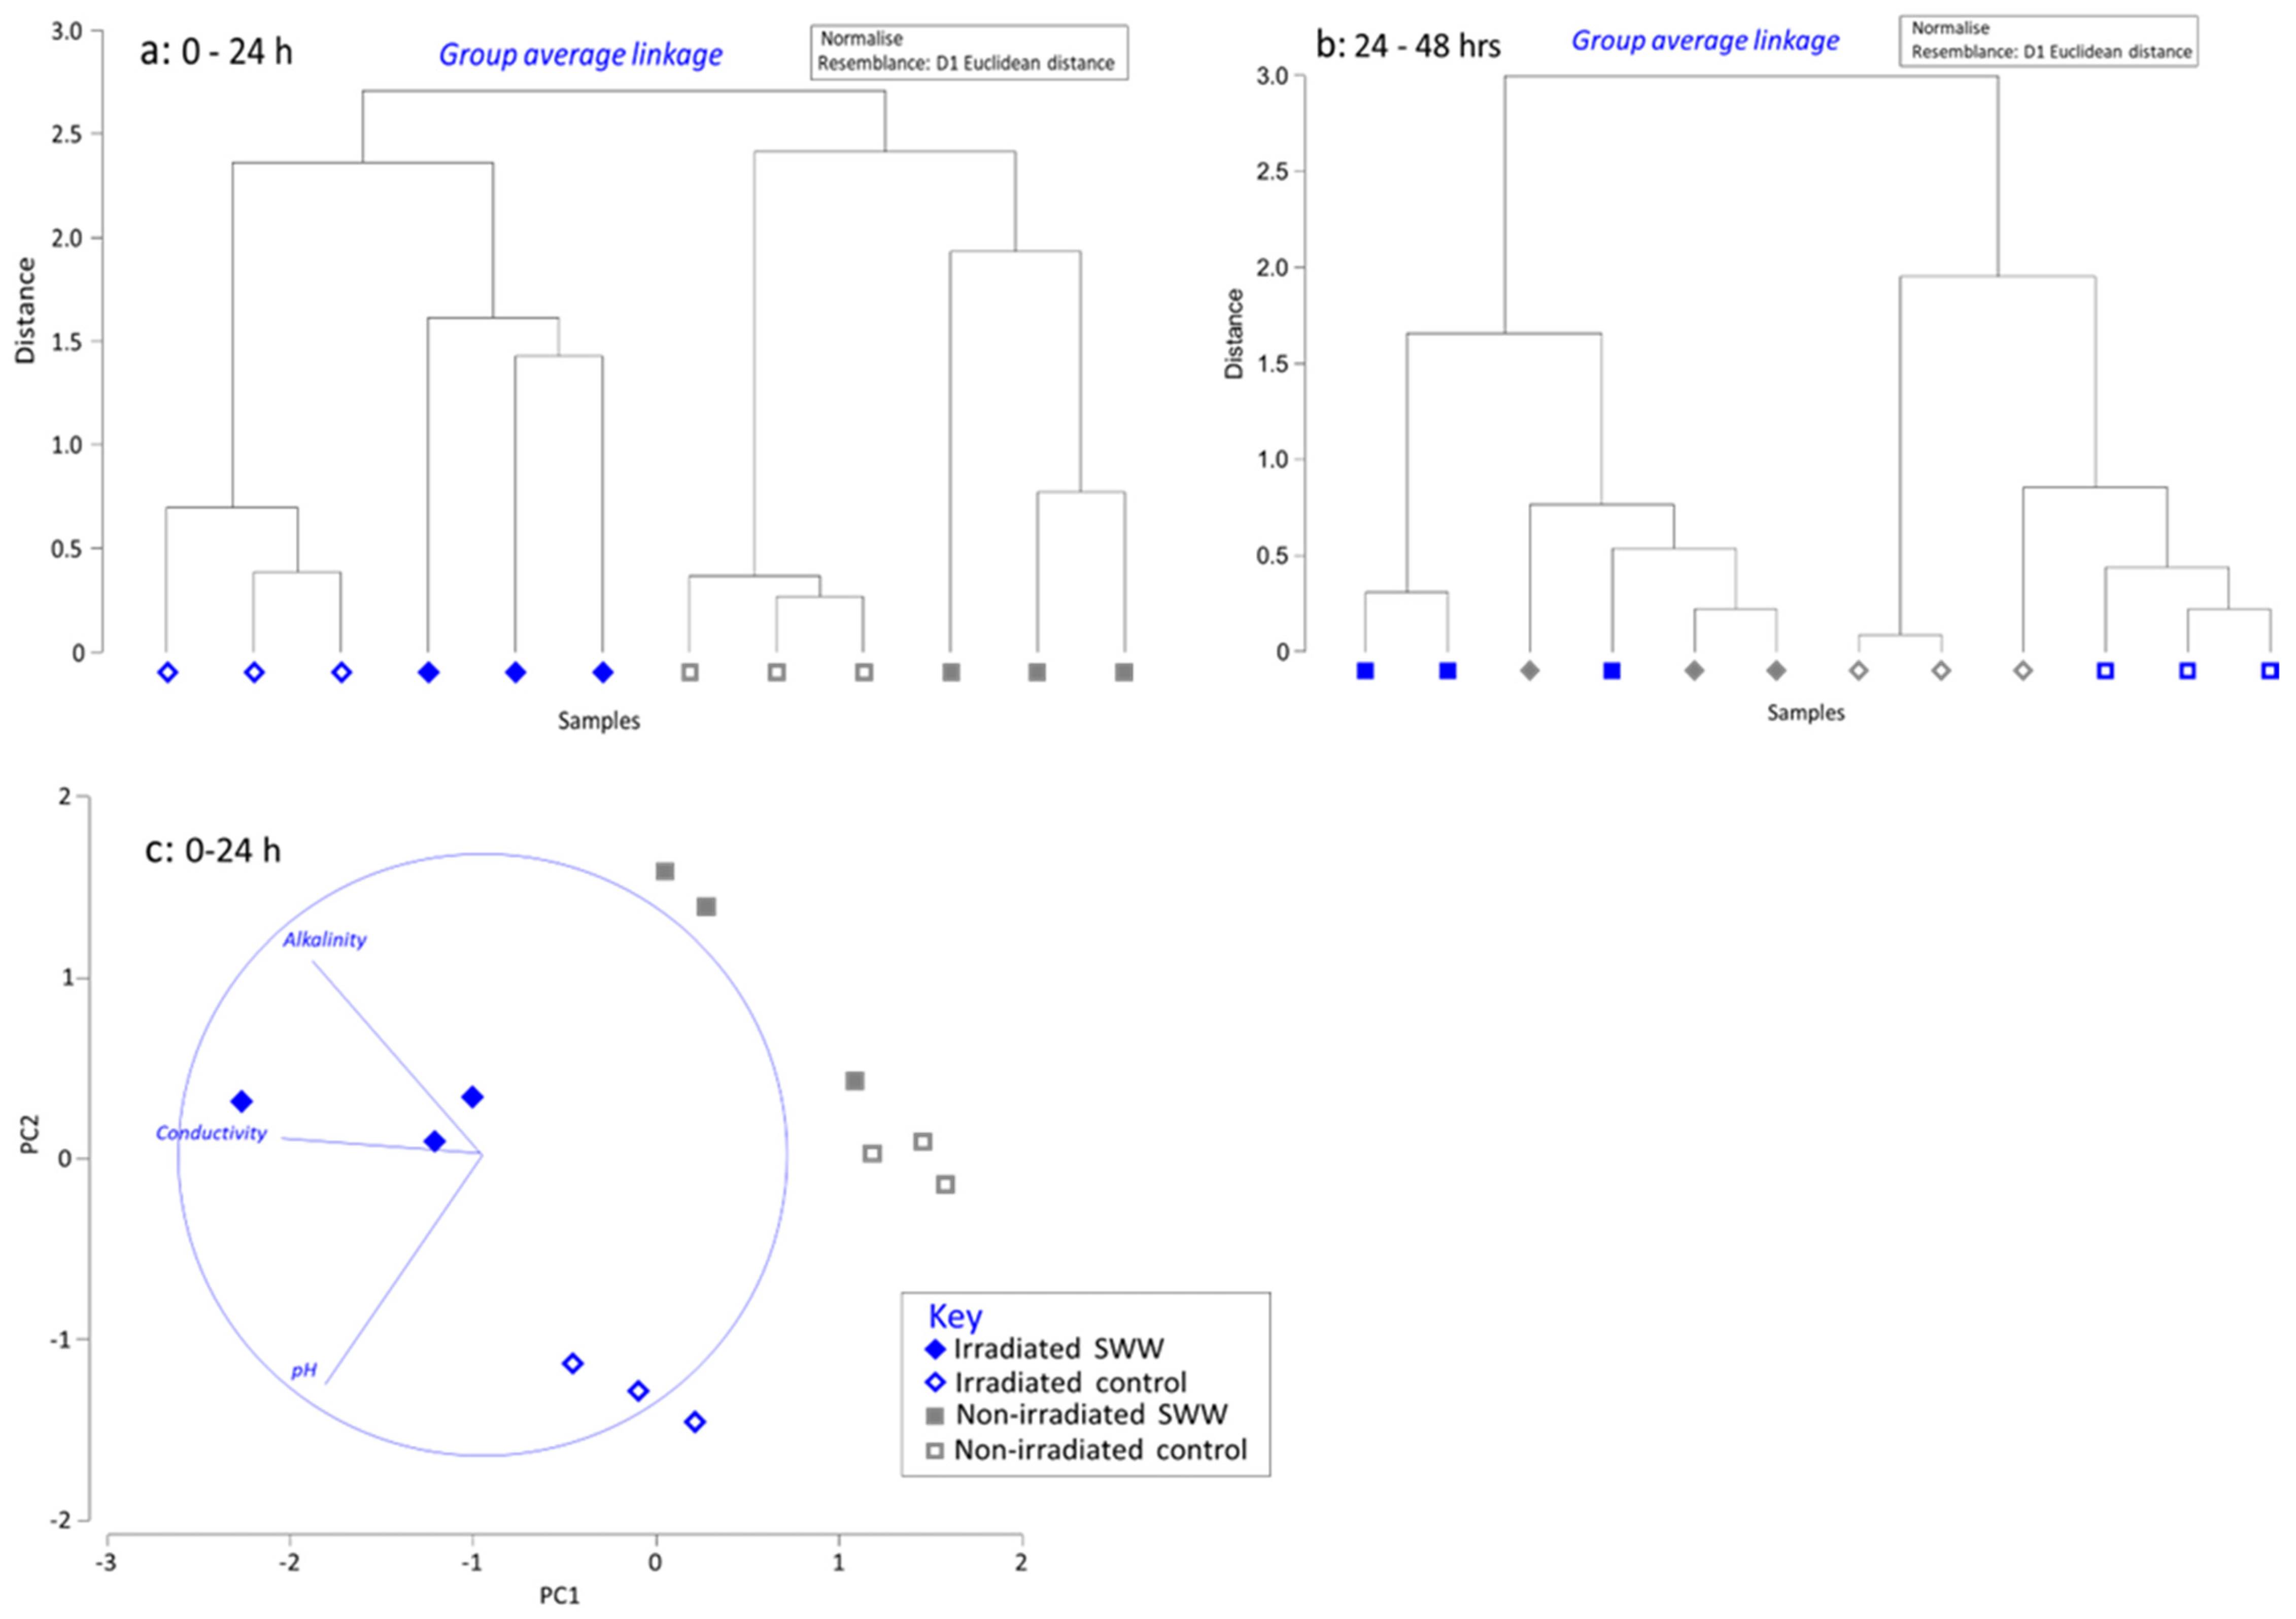
However, due to the presence of confounding variables as a consequence of the organic and inorganic residuals within the columns, results were not consistent for the indicator parameters used to demonstrate biotic and abiotic pH adjustment mechanisms. Multivariate statistical analyses were therefore used to assess the indicator parameters spAlk., spEC and spOH simultaneously (Figure 6).
For combined spOH, spAlk and spEC eluant measurements, there were significant (ANOVA) inter-group differences and intra-group similarities (irradiated SWW, non-irradiated SWW, irradiated control, non-irradiated control). In samples taken during the first 24 h of the experiment, the replicates fell into four distinct clusters (Figure 6a). In samples taken between 24 and 48 h, the irradiated and non-irradiated groups formed two initial clusters, but there was less distinction between the different treatments (SWW or control) (Figure 6b). Despite the loss of sterility, it was expected that the irradiated and non-irradiated column eluants would have different characteristics over the course of the experiment because of the higher biotically induced leaching of residuals in the first 24 h from the non-irradiated columns (Figure 5). Overall, the multivariate analyses, including the PCA (Figure 6c), validated the assumptions made using the univariate analyses results.

Author Contributions

Conceptualization, G.A.H., R.H. and P.J.W.; methodology, G.A.H., R.H. and P.J.W.; software, G.A.H. and P.J.W.; validation, G.A.H. and P.J.W.; formal analysis, G.A.H. and P.J.W.; investigation, G.A.H., R.H. and P.J.W.; resources, R.H. and P.J.W.; data curation, G.A.H. and P.J.W.; writing—original draft preparation, G.A.H. and P.J.W.; writing—review and editing, G.A.H., R.H. and P.J.W.; visualization, G.A.H.; supervision, R.H. and P.J.W.; project administration, G.A.H. and P.J.W.; funding acquisition, G.A.H. and P.J.W. All authors have read and agreed to the published version of the manuscript.

Funding

This research was funded by the Wine industry network of expertise and technology (Winetech) grant number CSUR 13091742538.

Data Availability Statement

The data presented in this manuscript is available on request from the co-responding author.

Acknowledgments

The authors would like to thank the Wine industry network of expertise and technology (Winetech), Jacques Rossouw and Reckson Mulidzi from the Agricultural Research Council and previously from Distell, respectively, for assistance with site selection, and the (unnamed) winery involved.

Conflicts of Interest

The authors declare no conflict of interest.

References

  1. Holtman, G.A.; Haldenwang, R.; Welz, P.J. Biological sand filter system treating winery effluent for effective reduction in organic load and pH neutralisation. J. Water Process. Eng. 2018, 25, 118–127. [Google Scholar] [CrossRef]
  2. Welz, P.J.; Holtman, G.; Haldenwang, R.; Le Roes-Hill, M.; Roes-hill, M. Characterisation of winery wastewater from continuous flow settling basins and waste stabilisation ponds over the course of 1 year: Implications for biological wastewater treatment and land application. Water Sci. Technol. 2016, 74, 2036–2050. [Google Scholar] [CrossRef] [PubMed] [Green Version]
  3. Liu, T.; Nadaraja, A.V.; Friesen, J.; Gill, K.; Lam, M.I.; Roberts, D.J. Narrow pH tolerance found for a microbial fuel cell treating winery wastewater. J. Appl. Microbiol. 2021, 131, 2280–2293. [Google Scholar] [CrossRef] [PubMed]
  4. Holtman, G.A.; Haldenwang, R.; Welz, P.J. Comparison of continuous and pulse mode of operation of pilot biosand reactors treating winery effluent. Ecol. Eng. 2022, 182, 106706. [Google Scholar] [CrossRef]
  5. Holtman, G.A.; Haldenwang, R.; Welz, P.J. Effect of Particle Character and Calcite Dissolution on the Hydraulic Conductivity and Longevity of Biosand Filters Treating Winery and Other Acidic Effluents. Water 2022, 14, 2603. [Google Scholar] [CrossRef]
  6. Welz, P.J.; Mbasha, W.; Smith, I.; Holtman, G.; Terblanche, G.; Le Roes-Hill, M.; Haldenwang, R. The influence of grain physicochemistry and biomass on hydraulic conductivity in sand-filled treatment wetlands. Ecol. Eng. 2018, 116, 21–30. [Google Scholar] [CrossRef]
  7. Kaira, W.M.; Kimpiab, E.; Mpofu, A.B.; Holtman, G.A.; Ranjan, A.; Welz, P.J. Anaerobic digestion of primary winery wastewater sludge and evaluation of the character of the digestate as a potential fertilizer. Biomass Convers. Biorefinery 2022, 1–13. [Google Scholar] [CrossRef]
  8. Singh, A.; Kumar, A.; Yadav, R.K.; Minhas, P.S.; Saini, U. Long-Term Effect of Alkali and Partially Neutralized Irrigation Water on Soil Quality. J. Soil Sci. Plant Nutr. 2022, 22, 1252–1266. [Google Scholar] [CrossRef]
  9. Kim, Y.C.; Yoon, H. Exploitation of acetic acid for calcite dissolution in small-capacity desalination plants. Desalination 2021, 516, 115227. [Google Scholar] [CrossRef]
  10. Larraguibel, A.; Navarrete-Calvo, A.; García, S.; Armijos, V.F.; Caraballo, M.A. Exploring sulfate and metals removal from Andean acid mine drainage using CaCO3-rich residues from agri-food industries and witherite (BaCO3). J. Clean Prod. 2020, 274, 123450. [Google Scholar] [CrossRef]
  11. Turingan, C.O.A.; Singson, G.B.; Melchor, B.T.; Alorro, R.D.; Beltran, A.B.; Orbecido, A.H. Evaluation of efficiencies of locally available neutralizing agents for passive treatment of acid mine drainage. Minerals 2020, 10, 845. [Google Scholar] [CrossRef]
  12. Le Bourre, B.; Neculita, C.M.; Coudert, L.; Rosa, E. Manganese removal processes and geochemical behavior in residues from passive treatment of mine drainage. Chemosphere 2020, 259, 127424. [Google Scholar] [CrossRef]
  13. Offeddu, F.G.; Cama, J.; Soler, J.M.; Dávila, G.; McDowell, A.; Craciunescu, T.; Tiseanu, I. Processes affecting the efficiency of limestone in passive treatments for AMD: Column experiments. J. Environ. Chem. Eng. 2015, 3, 304–316. [Google Scholar] [CrossRef] [Green Version]
  14. Welz, P.J.; le Roes-Hill, M. Biodegradation of organics and accumulation of metabolites in experimental biological sand filters used for the treatment of synthetic winery wastewater: A mesocosm study. J. Water Process. Eng. 2014, 3, 155–163. [Google Scholar] [CrossRef]
  15. Coral, T.; Placko, A.-L.; Beaufort, D.; Tertre, E.; Bernier-Latmani, R.; Descostes, M.; De Boissezon, H.; Guillon, S.; Rossi, P. Biostimulation as a sustainable solution for acid neutralization and uranium immobilization post acidic in-situ recovery. Sci. Total Environ. 2022, 822, 153597. [Google Scholar] [CrossRef] [PubMed]
  16. Biermann, V.; Lillicrap, A.M.; Magana, C.; Price, B.; Bell, R.W.; Oldham, C.E. Applicability of passive compost bioreactors for treatment of extremely acidic and saline waters in semi-arid climates. Water Res. 2014, 55, 83–94. [Google Scholar] [CrossRef] [Green Version]
  17. Gomes, H.I.; Rogerson, M.; Burke, I.T.; Stewart, D.I.; Mayes, W.M. Hydraulic and biotic impacts on neutralisation of high-pH waters. Sci. Total Environ. 2017, 601, 1271–1279. [Google Scholar] [CrossRef]
  18. You, F.; Ma, Y.; Huang, L. Pre-culturing soil microbial inoculum in plant residues enhanced the resilience of tolerant bacteria and bioneutralization efficacy in alkaline bauxite residues. Sci. Total Environ. 2022, 822, 153627. [Google Scholar] [CrossRef]
  19. Santini, T.C.; Wang, J.C.; Warren, K.L.; Pickering, G.; Raudsepp, M.J. Simple Organic Carbon Sources and High Diversity Inocula Enhance Microbial Bioneutralization of Alkaline Bauxite Residues. Environ. Sci. Technol. 2021, 55, 3929–3939. [Google Scholar] [CrossRef]
  20. Rakotonimaro, T.V.; Neculita, C.M.; Bussière, B.; Zagury, G.J. Comparative column testing of three reactive mixtures for the bio-chemical treatment of iron-rich acid mine drainage. Miner. Eng. 2017, 111, 79–89. [Google Scholar] [CrossRef]
  21. Kölbl, A.; Bucka, F.; Marschner, P.; Mosley, L.; Fitzpatrick, R.; Schulz, S.; Lueders, T.; Kögel-Knabner, I. Consumption and alteration of different organic matter sources during remediation of a sandy sulfuric soil. Geoderma 2019, 347, 220–232. [Google Scholar] [CrossRef]
  22. Ramond, J.B.; Welz, P.J.; Tuffin, M.I.; Burton, S.G.; Cowan, D.A. Assessment of temporal and spatial evolution of bacterial communities in a biological sand filter mesocosm treating winery wastewater. J. Appl. Microbiol. 2013, 115, 91–101. [Google Scholar] [CrossRef] [PubMed] [Green Version]
  23. Welz, P.J.; Ramond, J.B.; Cowan, D.A.; Burton, S.G. Phenolic removal processes in biological sand filters, sand columns and microcosms. Bioresour. Technol. 2012, 119, 262–269. [Google Scholar] [CrossRef] [PubMed]
  24. Welz, P.J.; Ramond, J.B.; Cowan, D.A.; Prins, A.; Burton, S.G. Ethanol degradation and the benefits of incremental priming in pilot-scale constructed wetlands. Ecol. Eng. 2011, 37, 1453–1459. [Google Scholar] [CrossRef]
  25. Bank, T.L.; Kukkadapu, R.K.; Madden, A.S.; Ginder-Vogel, M.A.; Baldwin, M.E.; Jardine, P.M. Effects of gamma-sterilization on the physico-chemical properties of natural sediments. Chem. Geol. 2008, 251, 1–7. [Google Scholar] [CrossRef] [Green Version]
  26. McNamara, N.P.; Black, H.I.J.; Beresford, N.A.; Parekh, N.R. Effects of acute gamma irradiation on chemical, physical and biological properties of soils. Appl. Soil Ecol. 2003, 24, 117–132. [Google Scholar] [CrossRef]
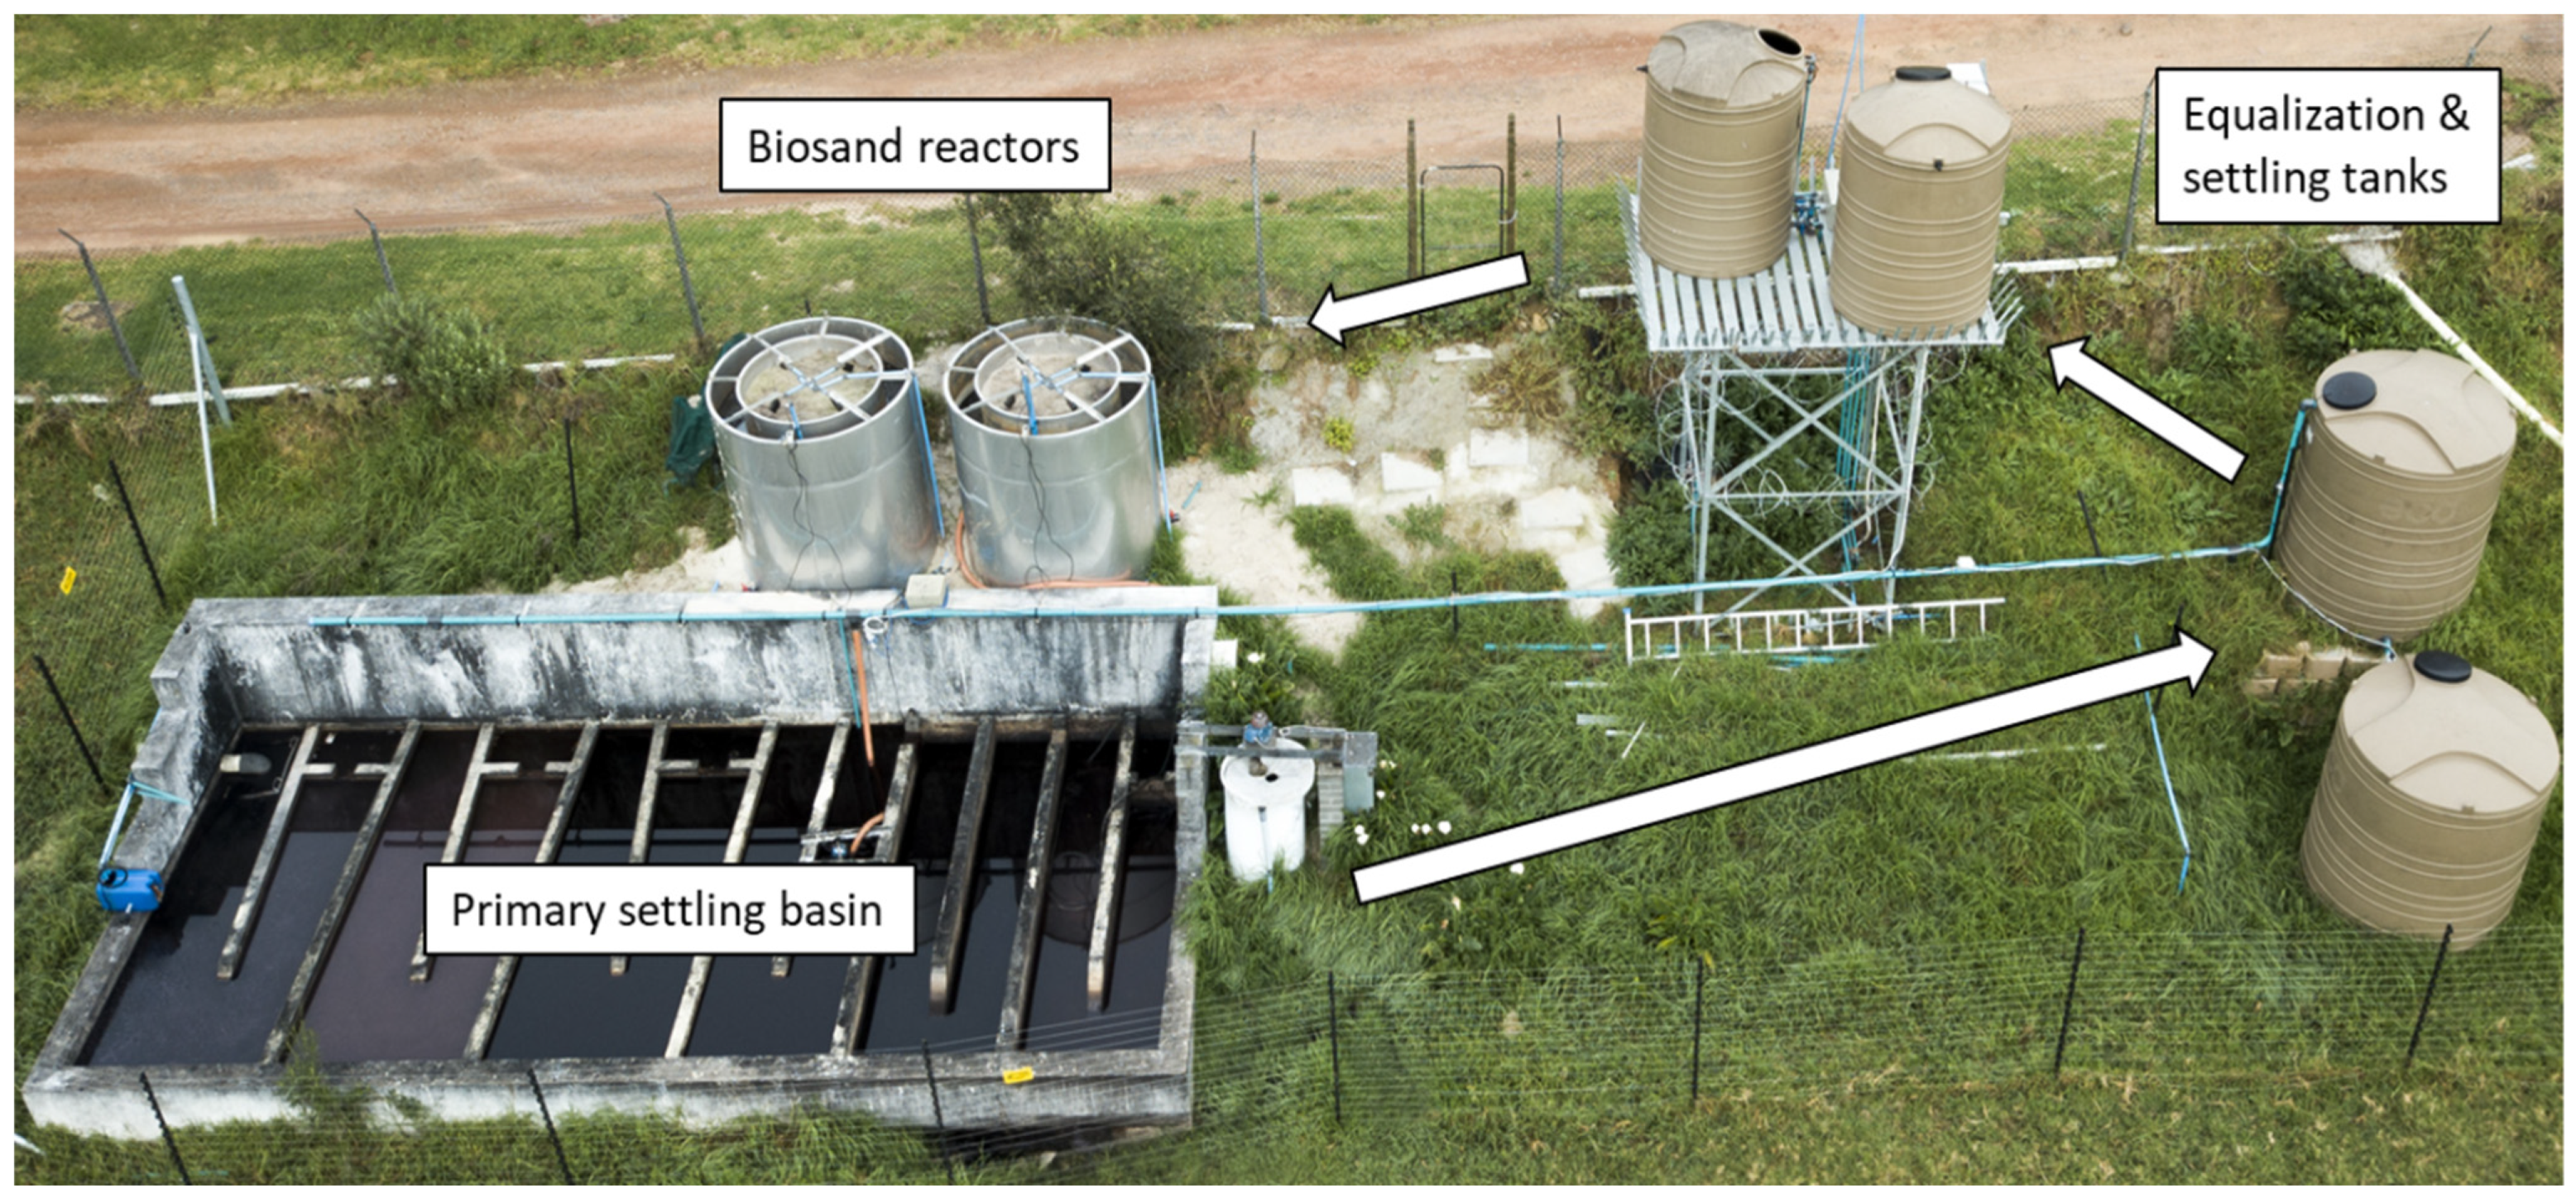
Figure 1. Set up of pilot biosand reactor system treating winery wastewater.
Water 14 03482 g001
Figure 2. Specific chemical oxygen demand measurements for all the column replicates (a) and mass balance for ethanol and acetate added to the columns feed with synthetic winery wastewater (b).
Water 14 03482 g002
Figure 3. Chemical oxygen demand (a) and pH (b) measurements from the pilot biological sand reactor system (adapted from [4]).
Water 14 03482 g003
Figure 4. Average specific concentrations of hydroxide ions (a), alkalinity (b), electrical conductivity (c) and calcium (d) in column eluent (n = 3 replicates, error bars represent standard deviation from the mean).
Water 14 03482 g004
Figure 5. Major cations measured in the eluant from each column replicate for the first (a) and second (b) day of the experiment. Figure (a) is vertically aligned with (b).
Water 14 03482 g005
Figure 6. Cluster plots of selected physicochemical parameters showing the different treatment groups in eluant samples taken between 0–24 h (a) and 24–48 h (b), and principal component analyses of the same data from eluant samples taken between 0–24 h (c).
Water 14 03482 g006
Table 1. Percentage calcium in sand from cores taken from biosand reactors treating winery wastewater.
InfluentFlow Rate
(mL/h)
HLR
(L/m3sand.day−1)
OLR
(gCOD/m3sand.day−1)
HRT
(h)
Control8.3808NA8.7
SWW8.3808NA8.7
Note: SWW = synthetic winery wastewater HLR = hydraulic loading rate OLR = organic loading rate HRT = hydraulic retention time NA = not applicable.
Table 2. Measured operational parameters (average ± SD and range, n = 3).
Sand Height
(mm)
Sand Weight
(g)
HLR
(L/m3sand.day−1)
HRT
(h)
Control356 ± 8.4383 ± 9.7796 ± 198.81 ± 0.21
(346–361)(375–394)(784–818)(8.57–8.94)
Control IR352 ± 6.8380 ± 8.7805 ± 168.71 ± 0.17
(344–357)(370–386)(793–822)(8.52–8.84)
SWW358 ± 22373 ± 30792 ± 488.87 ± 0.53
(337–380)(344–404)(745–840)(8.35–9.41)
SWW IR363 ± 4396 ± 4.5779 ± 8.68.99 ± 0.10
(359–367)(391–400)(771–788)(8.89–9.09)
SWW cont.316 ± 5376 ± 0896 ± 14.27.83 ± 0.15
(311–321)(376–376)(881–910)(7.70–7.95)
Note: HLR = hydraulic loading rate; HRT = hydraulic loading rate; IR = irradiated; SWW = synthetic winery wastewater; SWW cont. = control with new, unused sand.
Publisher’s Note: MDPI stays neutral with regard to jurisdictional claims in published maps and institutional affiliations.