Article

Pore Size Distribution Derived from Soil–Water Retention Characteristic Curve as Affected by Tillage Intensity

by
Jalal David Jabro
* and
William Bart Stevens
Northern Plains Agricultural Research Laboratory, Agricultural Research Service, U.S. Department of Agriculture, Sidney, MT 59270, USA
*
Author to whom correspondence should be addressed.
Water 2022, 14(21), 3517; https://doi.org/10.3390/w14213517
Submission received: 29 August 2022 / Revised: 26 October 2022 / Accepted: 31 October 2022 / Published: 3 November 2022
(This article belongs to the Special Issue Soil Science and Hydrology: Water at the Crossroad of Two Disciplines)

Abstract

:
Tillage practices can influence the pore size distribution (PSD) of the soil, affecting soil physical and hydraulic properties as well as processes that are essential for plant growth, soil hydrology, environmental studies and modeling. A study was conducted to assess the effect of no-tillage (NT) and conventional tillage (CT) on PSD derived from soil–water retention curves (SWRCs) using the van Genuchten’s equation (vG) at 0–15 cm and 15–30 cm depths in a sandy loam soil. Values of PSD or slopes (C(h)) were calculated from the SWRCs by differentiating the vG equation. Soil water retention curves under both tillage systems and within two depths were determined using the evaporation HYPROP method. The vG equation was well fitted to measured soil water retention data. The diameter (D) of soil pores retaining water at various matric suctions (|h|) of water in soils was calculated by the capillary equation. A significant effect of tillage on soil PSD was observed in the macro-pore (D > 1000 μm, at |h| < 3 hPa) and meso-pore (D between 10 and 1000 μm, at |h| between 300 and 3 hPa) size classes, while the micro-pores size class (D < 10 μm, at |h| > 300 hPa) was unaffected at the 0–15 and 15–30 cm depths. Larger values of C(h) or PSD in CT were associated with greater soil loosening induced by the CT operations and greater proportion of large pores (structural porosity) occurred in soils under CT compared to soils under NT. Macro-pore and meso-pore proportions were significantly greater in soils under CT than in soils under NT within both soil depths. The hydraulic parameters of the vG equation and its derivative function can be used to compare soil–water retention curves and pore size distributions between soils under untilled and tilled conditions.

1. Introduction

Knowledge of the soil–water retention curve (SWRC) and pore size distribution is crucial for many soil–water flow modeling, irrigation management, and hydrological and environmental studies [1,2,3,4,5]. The SWRC is a non-linear relationship between soil–water potential and volumetric water content [1,2,5]. As water content decreases, soil matric potential decreases negatively and as a result, water is held more strongly to soil matrix. The shape of the curve is related to particle size and pore size distributions in the soil [2,6].
Tillage practices can considerably change soil physical and hydraulic properties including SWRC parameters, pore size distribution, and total porosity due to soil mechanical disturbance [5,7,8,9,10].
Hill et al. [11] found that after two years of continuous corn at one study site, soils under reduced tillage management retained more water, regardless of matric potential than soils that were conventionally tilled. Meanwhile, no significant differences were found among tillage treatments after eight years of continuous corn at the second location. They also found that conventional tillage resulted in a greater proportion of large pores compared with soils under conservation tillage. More recently, Josa et al. [12] studied the influence of different tillage systems on soil macro-pore size and shape in the surface layer. They found a higher proportion of macro-pores distribution and variability in conventional tillage compared to no-tillage in the topsoil layer. Conversely, Galdos et al. [13] determined that soil macro-porosity was higher in no-tillage (19.7%) than conventional tillage (14.3%), whereas, Pranagal et al. [14] found that soil macro-porosity (>20 μm) and pore size distribution were not significantly affected by tillage at 0–10 cm and 10–20 cm depths in loam and silt loam soils over a 7-yr period. In another study, Azooz et al. [15] concluded that the volume fraction of total porosity with pores >150 μm in diameter were greater under no-tillage than under conventional tillage in silt loam and sandy loam soils. Pena-Sancho et al. [16] concluded that tillage had a significant effect on the shape of the SWRC curve, pore size distribution, and other soil hydraulic properties. Furthermore, Weninger et al. [17] studied the effect of tillage on pore system in silt textured soils. Their pore size distribution results revealed a distinct lack of large pores in untilled soils compared to conventionally tilled soils.
Recently, Jabro and Stevens [5] found that the estimated hydraulic parameters of a SWRC for a sandy loam soil were greater under conventional tillage than under no-tillage due to soil loosening induced by tillage operations, thereby forming macro-pores and increasing pore volume.
To our knowledge, there are no or limited studies that evaluate the effect of different tillage practices on soil hydraulic properties under a corn-soybean rotation in the Northern Great Plains region of the USA. Further, the above conflicting results indicate the need for additional research to understand how different tillage practices can influence the SWRC’s estimated hydraulic parameters, pore size distribution, and other hydraulic properties. Thus, the objective of this study was to evaluate the effect of no-tillage (NT) and conventional tillage (CT) practices on pore size distribution (PSD) derived from the SWRC using the van Genuchten’s equation (vG) in a sandy loam soil within the 0–15 and 15–30 cm depths. We hypothesized that soil PSD values would differ between untilled and conventionally tilled soils.

2. Materials and Methods

2.1. Site Characteristics and Experimental Design

The 4-yr study was initiated in 2014 on a Lihen sandy loam soil (sandy, mixed, frigid Entic Haplustoll) at a North Dakota State University irrigated research farm in western North Dakota (ND), USA (48.1640 N, 103.0986 W, altitude 560 m). It was a portion of a long-term comprehensive cropping systems study. The average amounts of sand, silt, and clay were approximately 71, 16, and 13% for the 0–15 cm depth and 74, 14, and 12% for the 15–30 cm depth, respectively. The soil structure ranged between weak fine platy to massive or single grain in the A-horizon [5,18].
Research plots for the original cropping systems study were arranged as a split-plot of rotation and tillage treatments in a randomized complete block design with each phase of the rotation and tillage present each year. The whole plot treatment was the crop rotation of corn (Zea mays L.)-soybean (Glycine max [L.]) and subplot treatments were two tillage practices including no-tillage (NT) and conventional tillage (CT) in sub-plots (24 m long by15 m wide) that were randomly replicated in five blocks [5,18,19]. The two tillage management systems used in this study were CT and NT or direct seeding. The CT treatment comprised of one pass with a tandem disk at 7 cm deep. Two passes were then made with a ripper with 7 shanks spaced 60 cm apart. The shanks were fitted with shatter blocks and shatter wings to help loosen the soil between the shanks. A tine leveler and rolling mulcher were mounted behind the ripper shanks. The ripper was set to till 30 cm deep. The tilled plots received a finishing pass with a cultipacker [18,19].
Furthermore, Jabro et al. [18,19] provided detailed information regarding tillage operations, planting, fertilizer applications, corn and soybean varieties, irrigation amounts, weed control, and other farming activities.

2.2. Soil Sampling, Sample Preparation, Procedure and Measurement

Undisturbed soil cores were collected from 0–15 cm and 15–30 cm depths using stainless steel cylinders (8 cm in diameter and 5 cm in height) in corn rows at one sample per plot in the fall of 2014, 2015, 2016, and 2017 (total of 5 measurements or replications per tillage for each depth and year). Soil water retention curves were determined using the evaporation HYPROP method [20,21]. Details regarding soil core sampling, dates of sampling, sample preparation, HYPROP procedure and measurements were provided in Jabro and Stevens [5].

2.3. The van Genuchten and Capillary Rise Equations

The van Genuchten (vG) equation [22] is often used to define the SWRC function in unsaturated soils. The vG equation is expressed as:
θ = [ θ s θ r ) ] [ 1 1 + ( α | h | ) n ] 1 1 n + θ r ,   for   h < 0
θ = θ s ,   for   h 0
where θ is the water content (cm3 cm−3), h is the matric potential (cm), θs is the water content at saturation (cm3 cm−3), θr is the residual water content (cm3 cm−3), α is the scaling parameter (cm−1), n is a fitting dimensionless parameter, related to curve shape, porosity and pore size distribution.
Detailed definitions of Equation (1) were given in Jabro and Stevens [5].
Differentiation of Equation (1) with respect to matric potential (h), provides a quantitative measure of change in slope of the SWRC, as:
d θ d h = θ s θ r [ 1 + ( α | h | ) n ] 1 1 n [ 1 1 n 1 + ( α | h | ) n ] ( α | h | ) n n h
The d θ d h is generally termed the differential or specific water capacity [23,24] that is estimated from the SWRC and is related to soil–water storage and availability to plants. The slope is defined as the rate at which water content decreases per unit suction increase ( C ( h ) = d θ d h ) , noted as the specific water capacity, cm−1). The α parameter is inversely related to the maximum value of slope (C(h)) in Equation (3) according to [25,26].
Equation (3) can be used to calculate the slope of the SWRC for any given h value. Soil hydraulic parameters to be used for the study site in Equation (3) are presented in Table 1. This approach has been widely used for quantifying pore size distribution in various soils [8,26,27,28].
The maximum equivalent diameter (D) of soil pores retaining water at potential (h) of water in soils was calculated by the capillary equation [26,29,30] as:
D = 4 σ cos λ | h | g ρ w
where D is the soil pore diameter (cm), σ is the surface tension of water, λ is the contact angle between water and pore wall or the wetting angle, h is soil water potential (cm), g is acceleration due to gravity, ρw is the density of water. For water at 20 °C, σ is 72.86 dyne/cm or g/s2, λ is 0 and cos λ is 1, g is 980.7 cm/s2, and ρw is 0.998 g/cm3. By inserting these constant values, Equation (4) can be simplified as:
D 0.3 | h |
Further, Equation (5) can be rewritten as:
D 3000 | h |
where D is the soil pore diameter (μm). Equation (6) can be used to calculate the diameter of the largest equivalent pore size for soils or porous media at any given soil water potential.

2.4. Statistical Analyses

A mixed model was used to assess the effect of tillage on soil hydraulic parameters of SWRCs [31]. Tillage treatment was considered a fixed effect and replication a random effect. A paired t-test using of SAS software [31] was also used to compare the slopes of the curves and pore size distribution results between two tillage systems. The least significant differences were used to compare between tillage treatments means at p ≤ 0.05.

3. Results and Discussion

Averages of measured SWRC data obtained by the HYPROP system and their fitted hydraulic parameters across 2014, 2015, 2016, and 2017 at 0–15 cm and 15–30 cm depths under NT and CT soil conditions in irrigated corn rows are presented in this manuscript.
Detailed information and discussion regarding the effect of tillage on soil hydraulic parameters of the vG equation for 2014, 2015, 2016, and 2017, their averages, and on the available water capacity were given in Jabro and Stevens [5].

3.1. Soil Water Characteristic Curves and Fitting Parameters

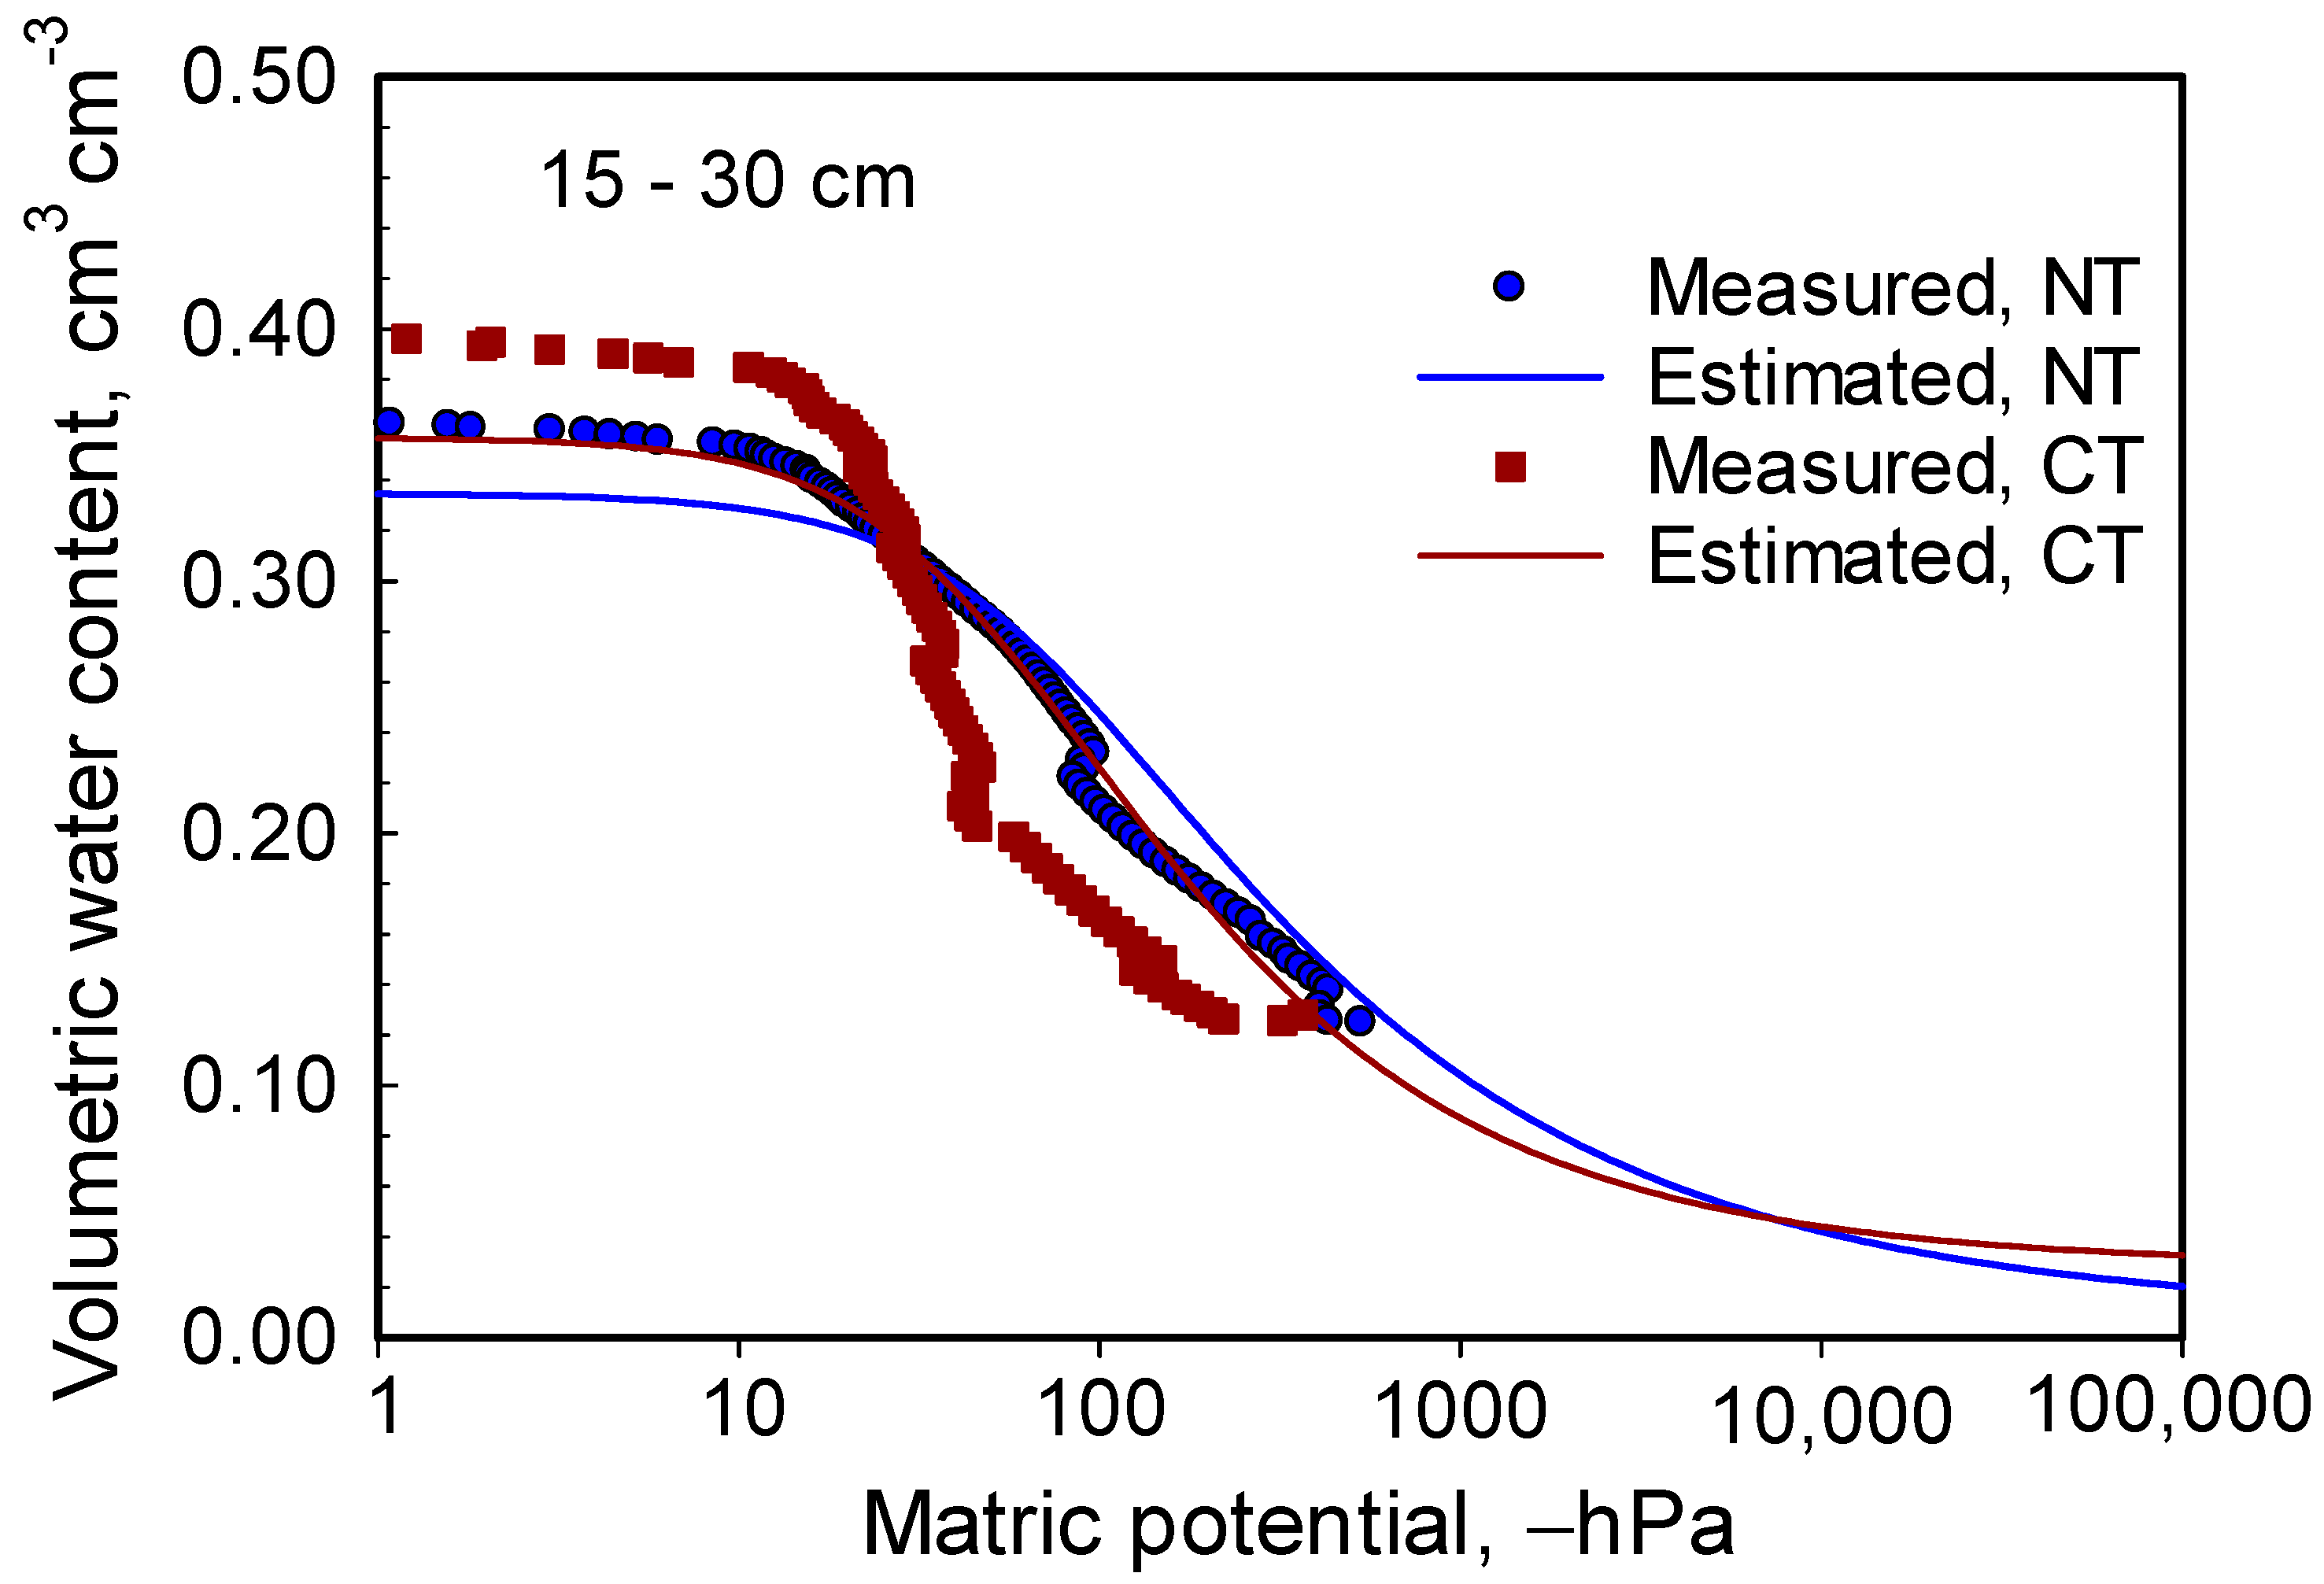
Measured and fitted soil–water retention data for NT and CT at 0–15 cm and 15–30 cm depths are depicted in Figure 1 and Figure 2, respectively. Noticeable differences in soil–water retention curves existed between two tillage systems within each depth. The paired t-test indicated that significant differences were found between α values of the NT and CT estimated SWRC curves at the 15–30 cm depth (Table 1).
The estimated soil vG parameters of the SWRCs determined by fitting the measured data to the vG equation (Equation (1)) for NT and CT systems at 0–15 and 15–30 cm depths are given in Table 1. Results of analysis of variance showed that the vG parameters α and θs were significantly affected by tillage at the 15–30 cm depth whereas no significant differences were observed between two tillage systems at the 0–15 cm surface depth (Table 1). It appears that tillage has more impact on α and θs variations in the subsurface layer than in the surface layer of a sandy loam soil used in this study [5]. These parameters were significantly larger under CT than under NT due to the soil loosening effect inflicted by tillage operations, thereby forming higher proportion of larger pores in CT than in NT practices in the tilled top soil layer [5,11,12,18].

3.2. Selection and Estimation of Pore Size Distribution (PSD)

Soil pores vary in size and are generally divided into macro-pores and micro-pores based on their relationship with soil water and their sizes [2]. Macro-pores are large pores that have drained when the soil reaches field capacity. They are air-filled and associated with movement of excess water due to gravitational force. In contrast, micro-pores are small pores that remain filled with water at field capacity and are related to unsaturated flow and matric potential [2,23,32]. However, Luxmoore [33] added a middle category designated as meso-pores, which are smaller than macro-pores and are able to hold water against gravity and supply plants with water.
Soil pore diameters calculated from SWRCs are often used to divide pores sizes into different categories [26]. Although there is no standard size separation between large pores and small pores, many classifications are available in the literature that vary in sizes and separations. In this study, a classification suggested by [33] that portioned soil porosity into three categories was selected to quantify pore size: micro-pores that have a diameter <10 μm, which lose water at matric suctions >300 hPa, meso-pores with diameter between 10 and 1000 μm, which lose water at suctions between 300 and 3 hPa, and macro-pores with a diameter >1000 μm, which lose water at suctions <3 hPa. The pore diameter (D) at a given matric potential (h) was estimated using Equation (6).
As matric potential decreases negatively, soil macro-pores and meso-pores empty first prior to losing water from micro-pores, therefore, micro-pores and meso-pores often supply the majority of plant available water in most soils [1,2,23].
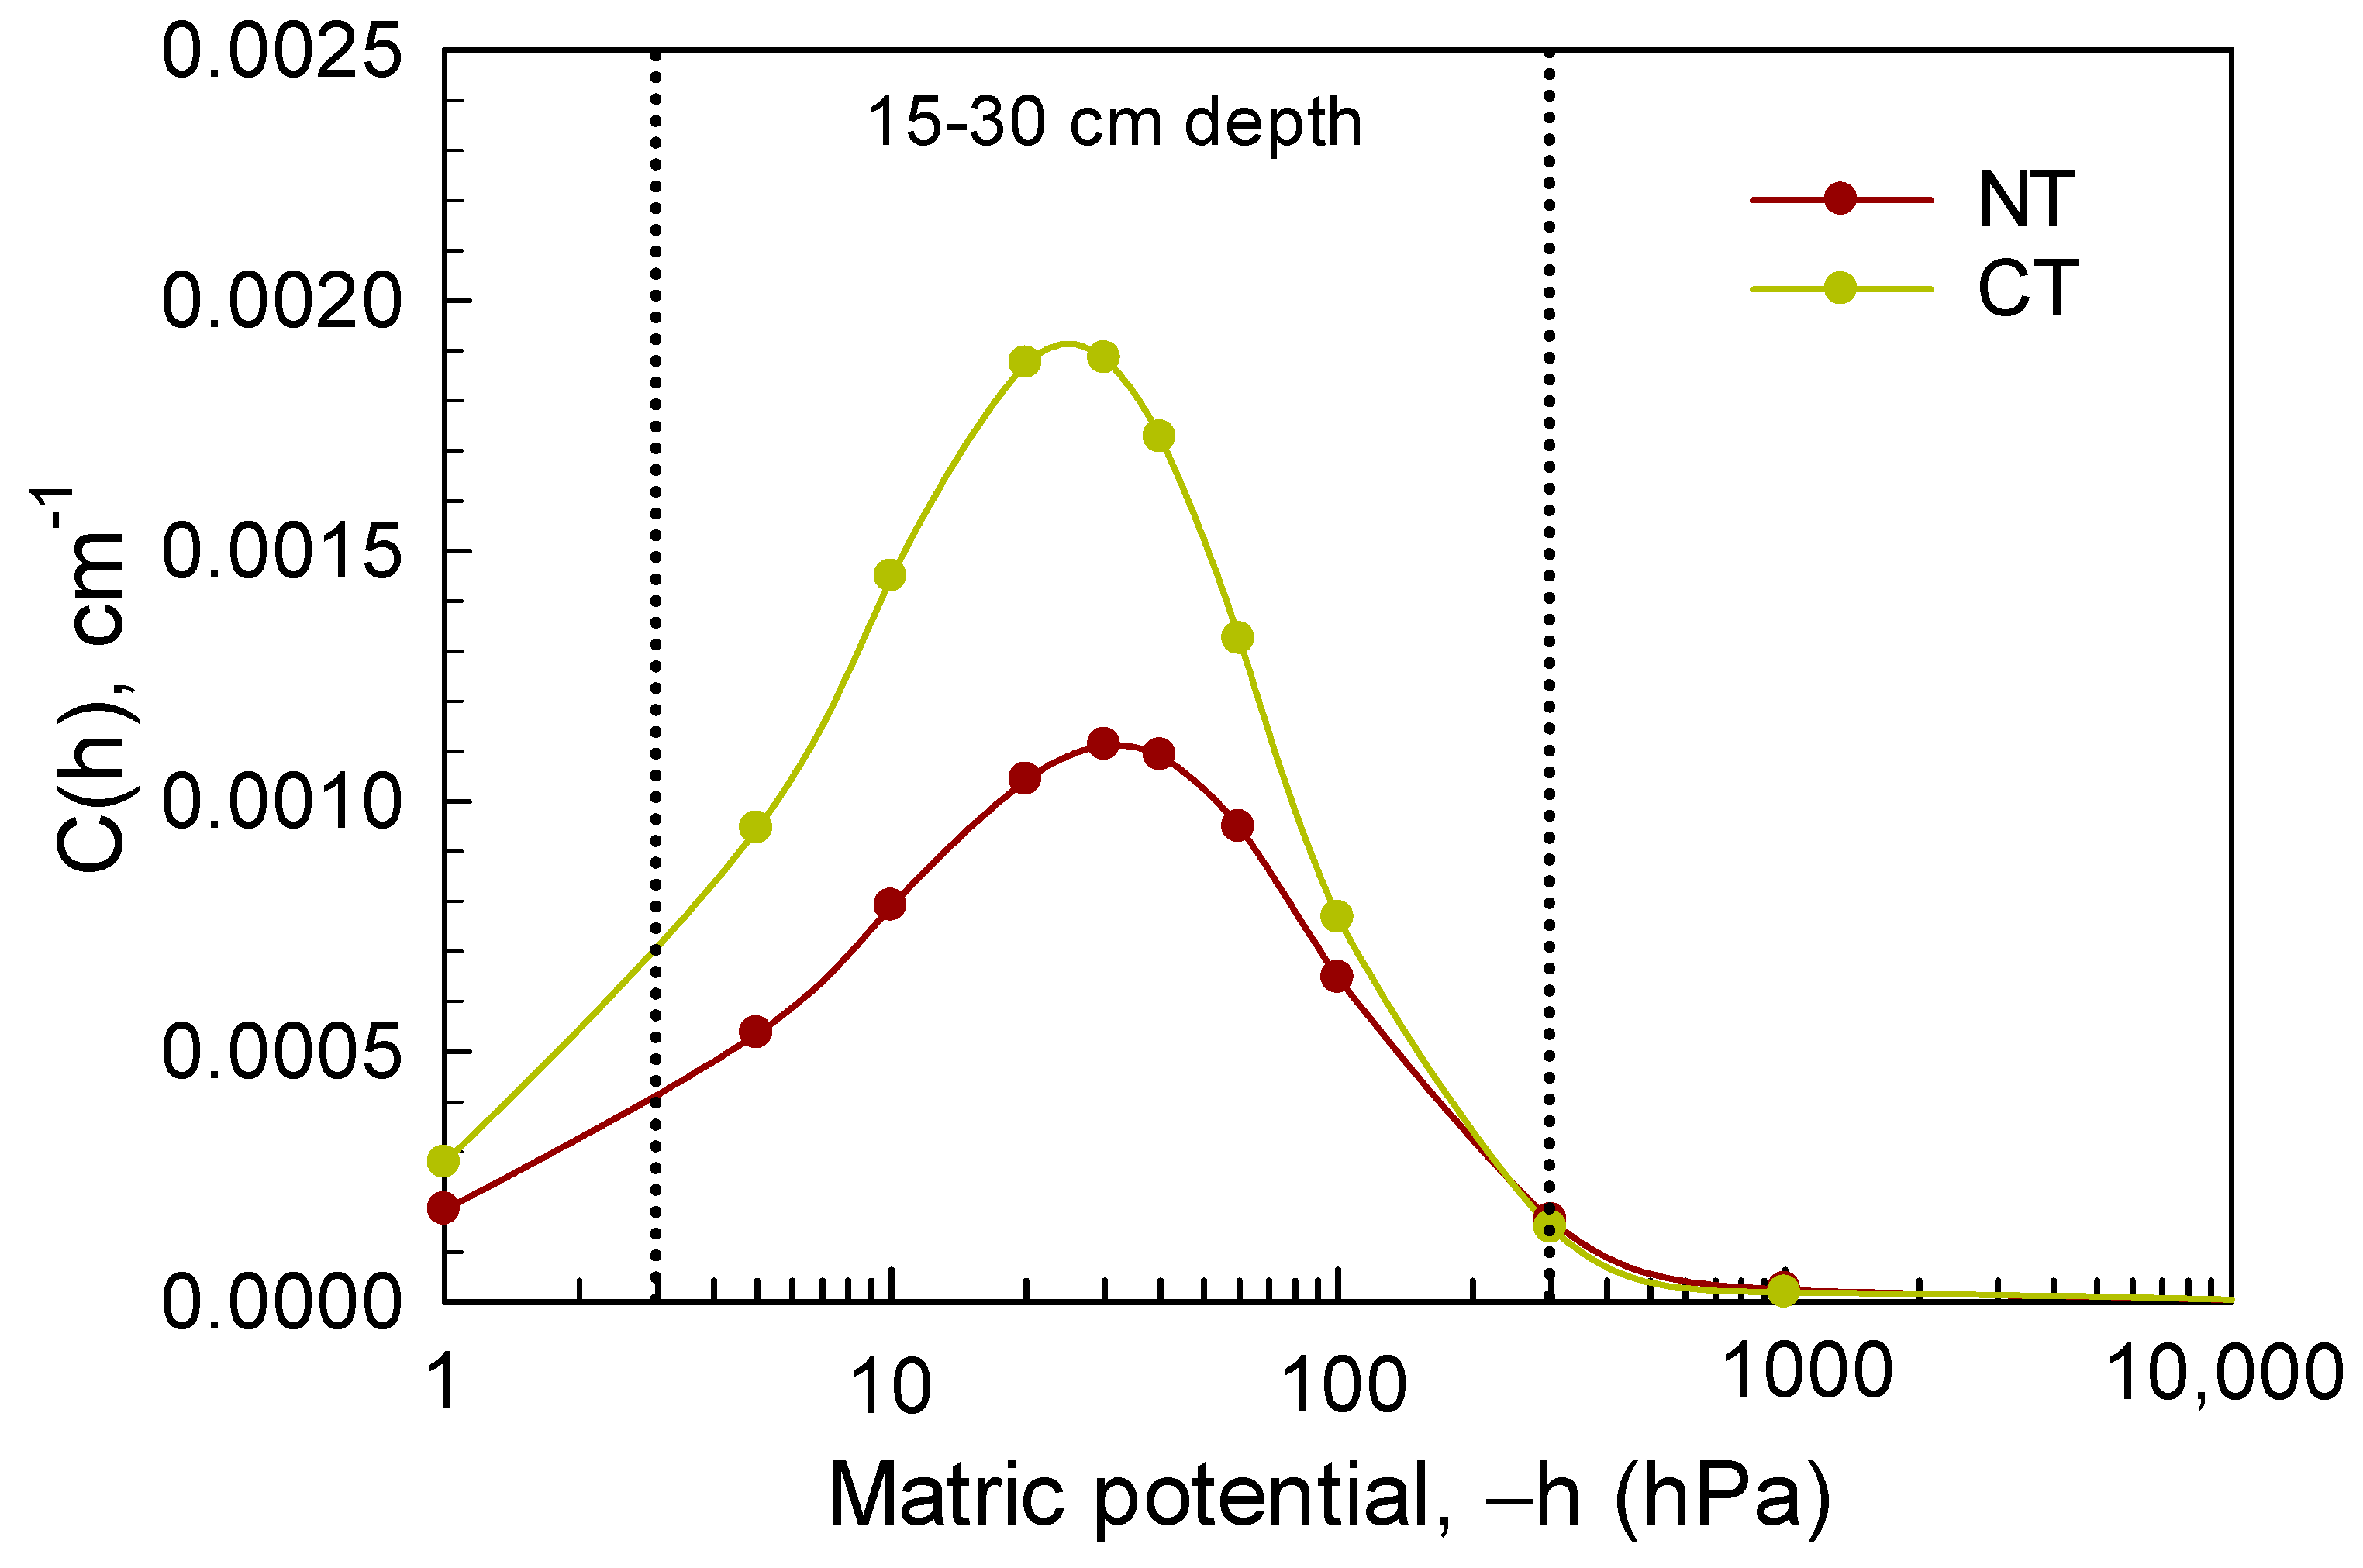
Soil–water retention curves have also been used to calculate PSD [23]. The specific water capacity (C(h), cm−1) was calculated using Equation (3) and soil hydraulic parameters listed in Table 1. The results from Equation (3) were plotted against soil matric potentials to show the PSDs for both NT and CT practices at 0–15 cm and 15–30 cm depths (Figure 3 and Figure 4). The PSD relationships were well described by a unimodal of van Genutchen function. The majority of soil porosity values were within the meso-pore class (1000–10 μm) at matric suctions between 3 and 300 hPa for both tillage systems at both depths. Whereas soil macro-pores and micro-pores represented smaller fractions of total porosity within each tillage system and depth (Figure 3 and Figure 4). The peaks of the PSD curves represent the matric suction values at which the greatest number of soil pores emptied [1,10,23] and are equivalent to the points with largest slopes, usually defined as inflection points of the SWRCs. The largest slopes (C(h)) for the NT and CT curves at 0–15 cm depth were 0.00154 and 0.00215 cm−1, respectively, at a matric suction value of about 20 hPa and a corresponding pore diameter of 150 μm. Meanwhile, the largest slopes for the NT and CT curves at 15–30 cm depth were 0.00113 and 0.00189 cm−1, respectively, at a matric suction value of about 30 hPa and a corresponding pore diameter of 100 μm (Figure 3 and Figure 4). The C(h) could also be plotted with the soil pore diameter (D) calculated from Equation (6) as the x-axis, but there is little to be gained by adding these two curves [23]. At both soil depths, larger slope values in CT were associated with greater soil loosening and forming higher proportion of larger size pores in CT due to a mechanical effect of this tillage than in NT, indicating that soils under CT produced higher structural porosity (large and medium pores) and lower matrix porosity (small pores) than soils under NT [5,11,12,18,34].
A paired t-test was also used to compare PSDs (C(h)) for micro-pore, meso-pore, and macro-pore classes between NT and CT systems at the 0–15 cm and 15–30 cm depths. Statistical results indicated that significant differences in PSD were found between CT and NT systems for macro-pores and meso-pores at both depths. However, the micro-pore fraction did not vary significantly between the two tillage systems at either depth (Table 2). The positive mean difference (Md) values indicated that CT produced greater macro- and meso-pore volumes than NT at both depths.
Further, soil macro-, meso-, and micro-pore volumes were estimated for both NT and CT management practices at 0–15 and 15–30 cm depths (Table 3). Soil meso- and macro-pore volumes were greater under CT than NT at 0–15 cm and 15–30 cm depths, while soil micro-pore volume was lower in CT than in NT at both depths (Table 3).
The findings of this study agree with those found by [11,12,17,28,34,35], who reported that soils under conventional tillage have larger structural pores and greater PSDs compared to untilled soils. The findings also confirm the hypothesis of this study that PSD values differed between soils under NT and CT management in sandy loam soils.

4. Conclusions

In this study, the differential functions of the van Genutchen (vG) equation [22] for fitted soil–water retention curves (SWRCs) were used to quantify the soil pore size distribution (PSD) under CT and NT practices at 0–15 cm and 15–30 cm depths in a sandy loam soil.
The vG equation and its derivative function are useful for comparing SWRCs, hydraulic parameters and PSDs between soils affected by various tillage practices. Regardless of the type of tillage, knowledge of PSD in soils can be beneficial for estimating water flow, soil–water storage and availability to plants.
Results from this study concurred with previous research studies and confirmed that tillage practices have major impact on SWRC slopes or PSD, soil pore volume, types of soil pores, and plant water availability due soil loosening and mechanical disturbance by various tillage operations.
This work improves our understanding of how various farming management practices (i.e., tillage) affect water storage in the soil, water availability to plants, environmental quality and soil health. The study also provides useful and currently lacking information regarding the effects of tillage intensity on physical and hydraulic properties of soils in the Northern Great Plains region of the USA. This information can aid growers in determining better irrigation management practices.
Findings from this study also indicate that more studies are needed on different textured soils to better understand the effects of tillage intensity on soil structure or PSD and other soil physical and hydraulic properties.

Author Contributions

Conceptualization, J.D.J.; methodology, J.D.J.; formal analysis, J.D.J.; investigation, J.D.J.; resources, J.D.J. and W.B.S.; data curation, J.D.J.; writing—original draft preparation, J.D.J.; writing—review and editing, J.D.J. and W.B.S.; visualization, J.D.J. All authors have read and agreed to the published version of the manuscript.

Funding

This research received no external funding. However, it was funded by the employer (United States Department of Agriculture, USDA).

Institutional Review Board Statement

Not applicable.

Informed Consent Statement

Not applicable.

Data Availability Statement

Not applicable.

Acknowledgments

The authors gratefully acknowledge the contributions of Dale Spracklin for processing soil samples, measuring soil–water retention curves and summarizing the data and William Iversen for his assistance with and data summarization using Excel.

Conflicts of Interest

The authors declare no conflict of interest.

References

  1. Hillel, D. Soil and Water, Physical Principle and Processes; Academic Press: New York, NY, USA, 1971. [Google Scholar]
  2. Hillel, D. Introduction to Soil Physics; Academic Press: New York, NY, USA, 1982. [Google Scholar]
  3. Hartge, K.-H.; Horn, R. Essential Soil Physics. An Introduction to Soil Processes, Functions, Structure and Mechanics; Schweizerbart Science Publisher: Stuttgart, Germany, 2016. [Google Scholar]
  4. Liang, X.; Liakos, V.; Wendroth, O.; Vellidis, G. Scheduling irrigation using an approach based on the van Genuchten model. Agric. Water Manag. 2016, 176, 170–179. [Google Scholar] [CrossRef] [Green Version]
  5. Jabro, J.D.; Stevens, W.B. Soil-water characteristic curves and their estimated hydraulic parameters in no-tilled and conventionally tilled soils. Soil Tillage Res. 2022, 219, 105342. [Google Scholar] [CrossRef]
  6. Tuller, M.; Or, D.; Dudley, L.M. Adsorption and capillary condensation in porous media- liquid retention and interfacial configurations in angular pores. Water Resour. Res. 1999, 35, 1949–1964. [Google Scholar] [CrossRef]
  7. Ahuja, L.R.; Fiedler, F.; Dunn, G.H.; Benjamin, J.G.; Garrison, A. Changes in soil water retention curves due to tillage and natural reconsolidation. Soil Sci. Soc. Am. J. 1998, 62, 1228–1233. [Google Scholar] [CrossRef]
  8. Bhattacharyya, R.; Prakash, V.; Kundu, S.; Gupta, H.S. Effect of tillage and crop rotations on pore size distribution and soil hydraulic conductivity in sandy clay loam soil of the Indian Himalayas. Soil Tillage Res. 2006, 86, 129–140. [Google Scholar] [CrossRef]
  9. Kool, D.; Tong, B.; Tian, Z.; Heitman, J.L.; Saur, T.J.; Horton, R. Soil water retention and hydraulic conductivity dynamics following tillage. Soil Tillage Res. 2019, 193, 95–100. [Google Scholar] [CrossRef] [Green Version]
  10. Wang, H.; Wankui, N.; Xiangning, L.; Lan, L.; Kangze, Y.; Yongpeng, N. Predicting the pore size distribution curve based on the evolution mechanism of soil-water characteristic curve. Environ. Earth Sci. 2022, 81, 23. [Google Scholar] [CrossRef]
  11. Hill, R.L.; Horton, R.; Cruse, R.M. Tillage effects on soil water retention and pore size distribution of two Mollisols. Soil Sci. Soc. Am. J. 1985, 49, 1264–1270. [Google Scholar] [CrossRef]
  12. Josa, R.; Gorchs, G.; Ginovart, M.; Sole-Benet, A. Influence of tillage on soil macropores size shape of top layer and crop development in sub-humid environment. Biologia 2013, 68, 1099–1103. [Google Scholar] [CrossRef]
  13. Galdos, M.V.; Piresb, L.F.; Cooperc, H.V.; Calonegod, J.C.; Rosolemd, C.A.; Mooney, S.J. Assessing the long-term effects of zero-tillage on the macroporosity of Brazilian soils using X-ray Computed Tomography. Geoderma 2019, 337, 1126–1135. [Google Scholar] [CrossRef] [PubMed]
  14. Pranagal, J.; Lipiec, J.; Domżał, H. Changes in pore size distribution and aggregate stability of two soils under long term tillage systems. Int. Agrophys. 2005, 19, 165–174. [Google Scholar]
  15. Azooz, R.H.; Arshad, M.A.; Franzluebbers, A.J. Pore size distribution and hydraulic conductivity affected by tillage in northwestern Canada. Soil Sci. Soc. Am. J. 1996, 60, 1197–1201. [Google Scholar] [CrossRef]
  16. Pena-Sancho, C.; Lopez, M.V.; Gracia, R.; Moret-Fernandez, D. Effect of tillage on the soil water retention curve during a fallow period of a semiarid dryland. Soil Res. 2017, 55, 114–123. [Google Scholar] [CrossRef] [Green Version]
  17. Weninger, T.; Kreiselmeier, J.; Chandrasekhar, P.; Julich, S.; Feger, K.-H.; Schwärzel, K.; Bodner, G.; Schwen, A. Effects of tillage intensity on pore system and physical quality of silt-textured soils detected by multiple methods. Soil Res. 2019, 57, 703–711. [Google Scholar] [CrossRef]
  18. Jabro, J.D.; Stevens, W.B.; Iversen, W.M.; Sainju, U.M.; Allen, B.L. Soil cone index and bulk density of a sandy loam under no-till and conventional tillage in a corn-soybean rotation. Soil Tillage Res. 2021, 206, 104842. [Google Scholar] [CrossRef]
  19. Jabro, J.D.; Iversen, W.M.; Stevens, W.B.; Sainju, U.M.; Allen, B.L. Tillage effects on drainage fluxes and nitrate leaching through unsaturated zone under irrigated corn-soybean rotation. Appl. Eng. Agric. 2019, 35, 293–300. [Google Scholar] [CrossRef]
  20. Schindler, U.; Durner, W.; von Unold, G.; Muller, L. Evaporation method for measuring unsaturated hydraulic properties of soils: Extending the measurement range. Soil Sci. Soc. Am. J. 2010, 74, 1071–1083. [Google Scholar] [CrossRef]
  21. Schindler, U.; Doener, J.; Muller, L. Simplified method for quantifying the hydraulic properties of shrinking soils. J. Plant Nutr. Soil Sci. 2015, 178, 136–145. [Google Scholar] [CrossRef]
  22. van Genuchten, M.T. A closed form equation for predicting the hydraulic conductivity of unsaturated soils. Soil Sci. Soc. Am. J. 1980, 44, 892–898. [Google Scholar] [CrossRef] [Green Version]
  23. Taylor, S.A.; Ashcroft, G.L. Physical Edaphology-The Physics of Irrigated and Nonirrigated Soils; W.H. Freeman and Company: San Francisco, CA, USA, 1972. [Google Scholar]
  24. Klute, A. Water Retention. In Methods of Soil Analysis. Part 1. Physical and Mineralogical Methods, 2nd ed.; American Society of Agronomy and Soil Science Society of America: Madison, WI, USA, 1986; pp. 635–662. [Google Scholar]
  25. Wosten, J.H.M.; van Genuchten, M.T. Using texture and other soil properties to predict unsaturated soil hydraulic functions. Soil Sci. Soc. Am. J. 1988, 52, 1762–1770. [Google Scholar] [CrossRef]
  26. Startsev, A.D.; McNabb, D.H. Skidder traffic effects on water retention, pore size distribution, and van Genuchten parameters of Boreal forest soils. Soil Sci. Soc. Am. J. 2001, 65, 224–231. [Google Scholar] [CrossRef]
  27. Antinoro, C.; Arnone, E.; Noto, L.V. The use of soil retention curve models in analyzing slope stability in differently structured soils. Catena 2017, 150, 133–145. [Google Scholar] [CrossRef]
  28. Jensen, J.L.; Schjønning, P.; Watts, C.W.; Christensen, B.T.; Munkholm, L.J. Soil water retention: Uni-modal models of pore-size distribution neglect impacts of soil management. Soil Sci. Soc. Am. J. 2019, 83, 18–26. [Google Scholar] [CrossRef] [Green Version]
  29. Lawal, H.M.; Lawal, A.B. Pore size distribution and soil hydro physical properties under different tillage practices and cover crops in a typic haplusult in northern Nigeria. Trop. Subtrop. Agroecosyst. 2017, 20, 111–129. Available online: http://www.revista.ccba.uady.mx/urn:ISSN:1870-0462-tsaes.v20i1.2263 (accessed on 23 July 2021).
  30. Dlapa, P.; Hriník, D.; Hrabovský, A.; Ivan Šimkovic, I.; Hubert Žarnovičan, H.; Sekucia, F.; Kollár, J. The Impact of land-use on the Hierarchical Pore Size Distribution and Water Retention Properties in Loamy Soils. Water 2020, 12, 339. [Google Scholar] [CrossRef] [Green Version]
  31. SAS Institute. The SAS System for Windows; Version 9.2; SAS Institute: Cary, NC, USA, 2011. [Google Scholar]
  32. Radulovich, R.; Solorzano, E.; Sollins, P. Soil macropore size distribution from water breakthrough curves. Soil Sci. Soc. Am. J. 1989, 53, 556–559. [Google Scholar] [CrossRef] [Green Version]
  33. Luxmoore, R.J. Micro-, meso-, macroporosity of soil. Letter to the editor. Soil Sci. Soc. Am. J. 1981, 45, 671–672. [Google Scholar] [CrossRef]
  34. Castillini, M.; Fornaro, F.; Garofalo, P.; Giglio, L.; Rinaldi, M.; Ventrella, D.; Vitti, C.; Vonella, A.V. Effects of no-tillage and conventional tillage on physical and hydraulic properties of fine textured soils under winter wheat. Water 2019, 11, 484. [Google Scholar] [CrossRef] [Green Version]
  35. Haruna, S.I.; Anderson, S.H.; Nkongolo, N.V.; Zaibon, S. Soil hydraulic properties: Influence of tillage and cover crops. Pedosphere 2018, 28, 430–442. [Google Scholar] [CrossRef]
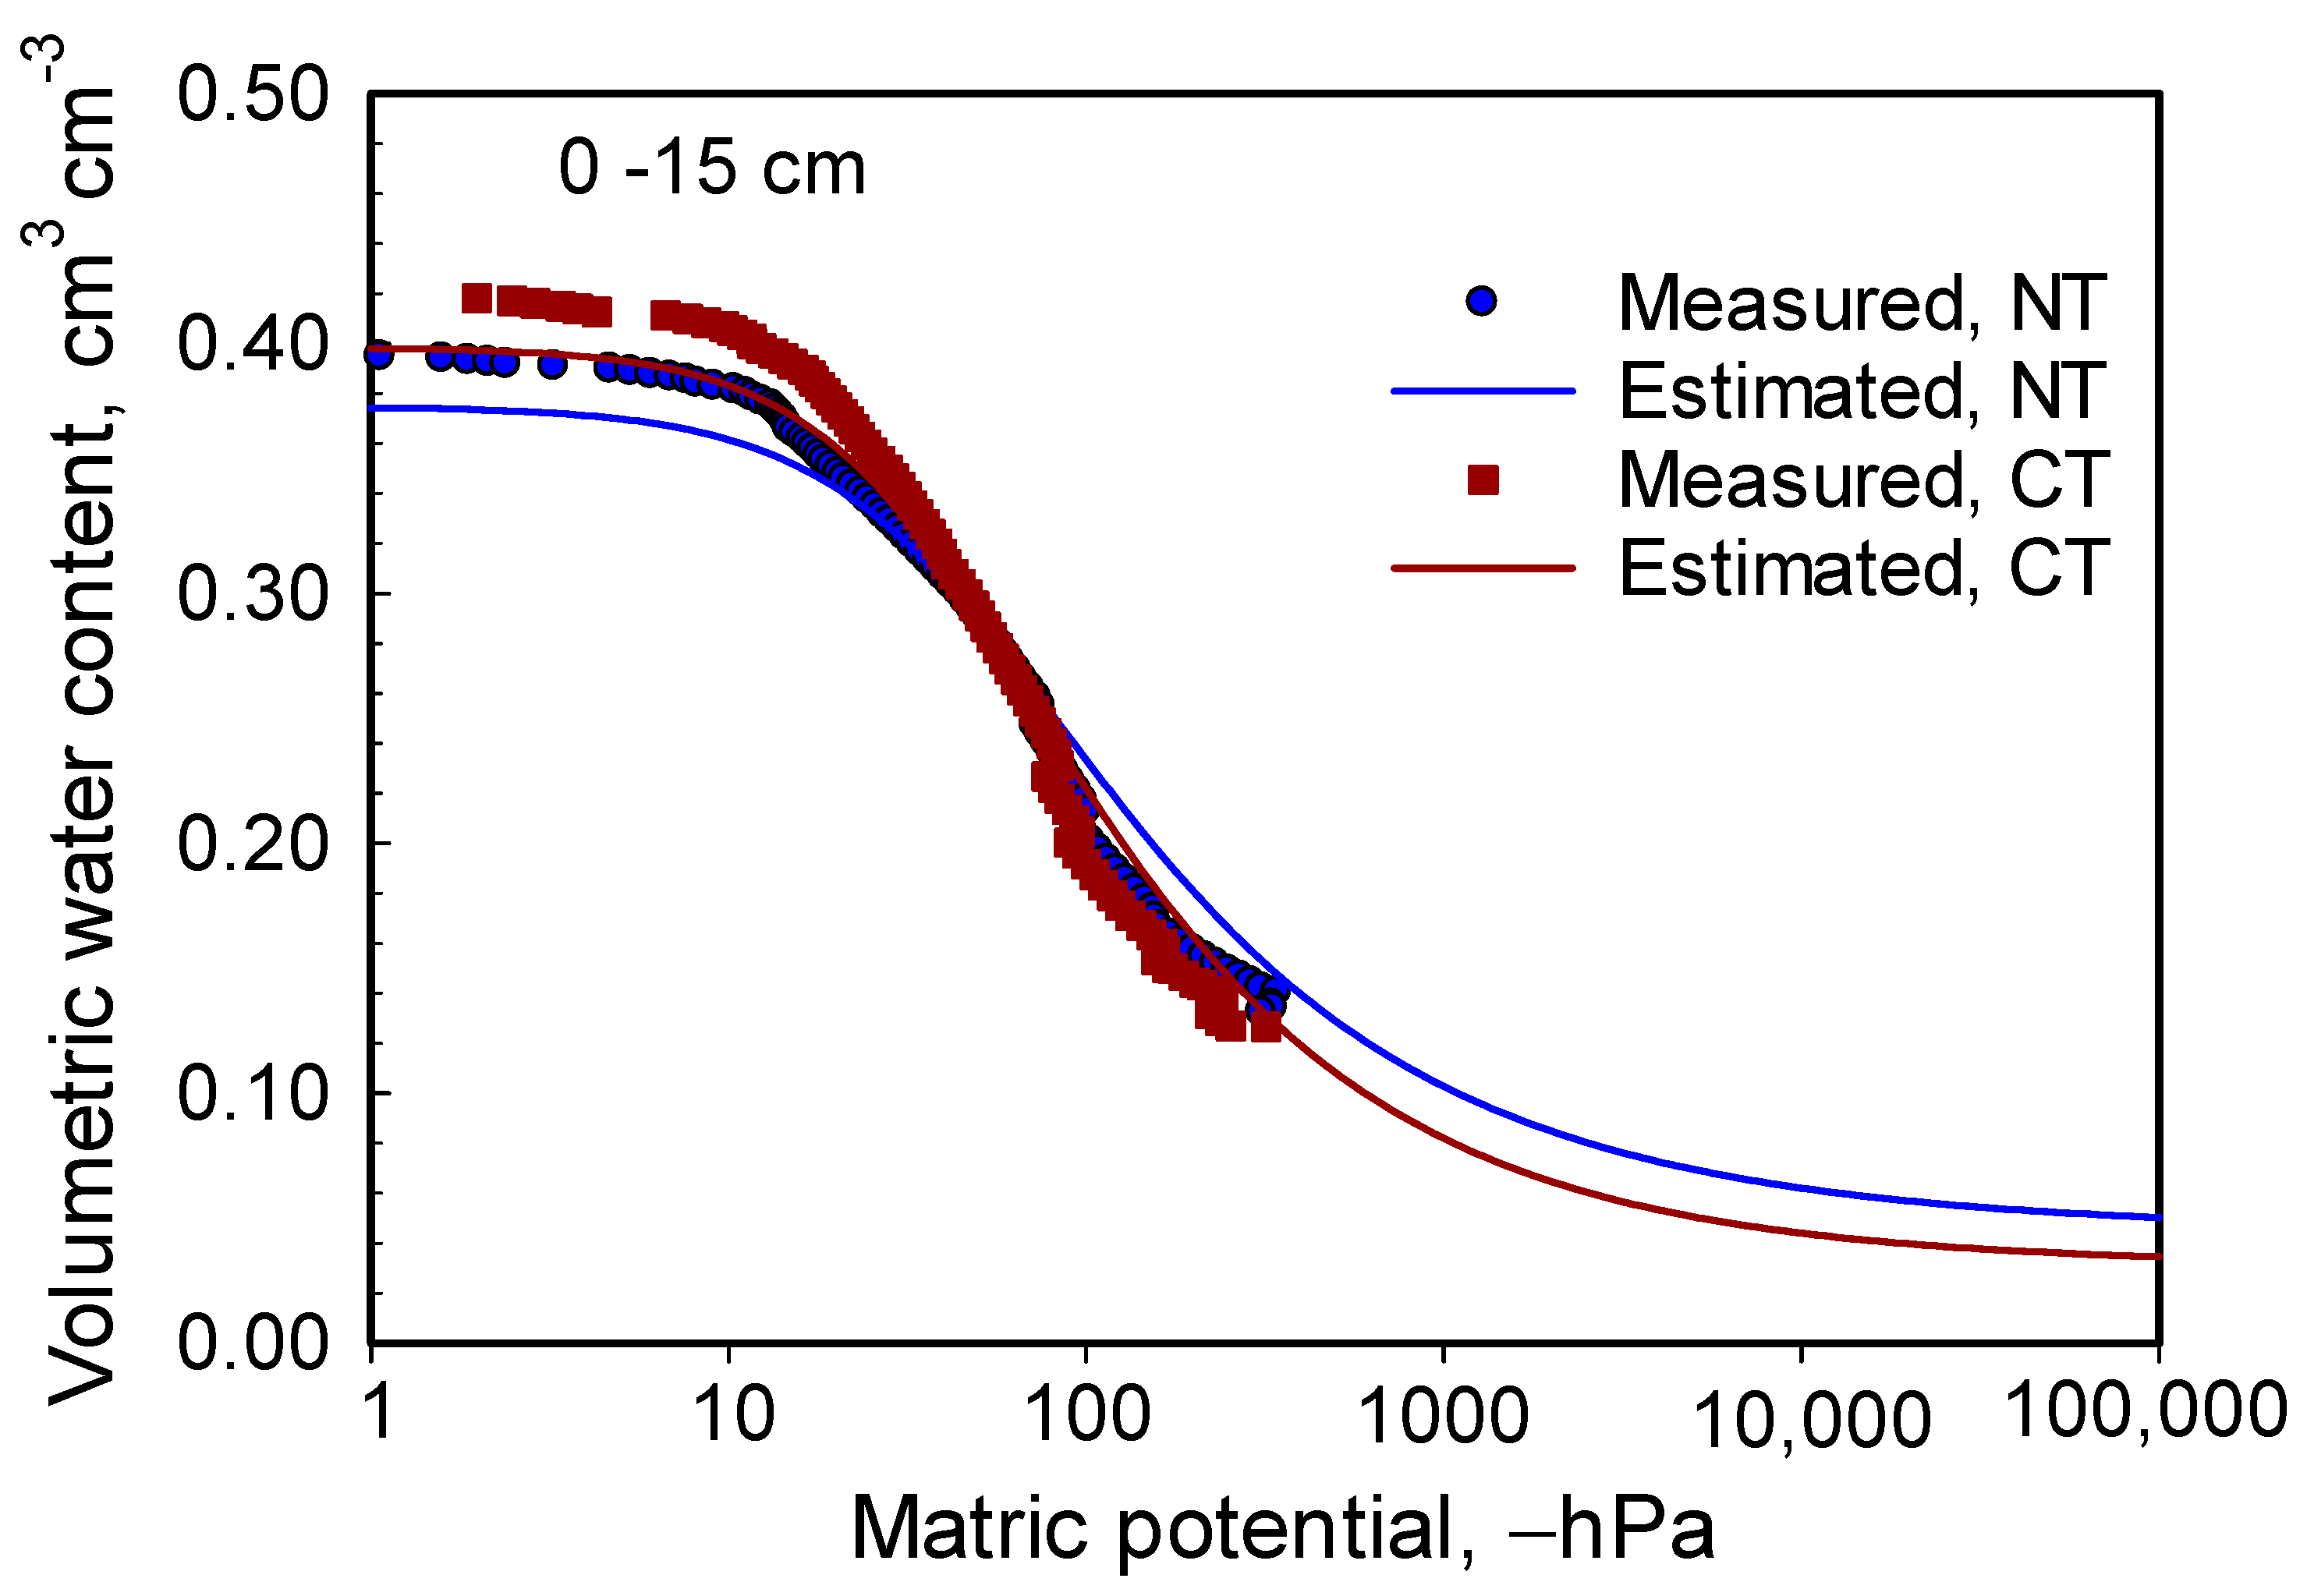
Figure 1. Soil–water retention curves for no-till (NT) and conventional tillage (CT) at a 0–15 cm soil depth.
Water 14 03517 g001
Figure 2. Soil–water retention curves for no-till (NT) and conventional tillage (CT) at a 15–30 cm soil depth.
Water 14 03517 g002
Figure 3. Unimodal pore size distribution showing the slope (C(h)) as a function of matric potential (h) for no-tillage (NT) and conventional tillage (CT) at 0–15 cm soil depth. The dotted lines represent size separation of soil pores.
Water 14 03517 g003
Figure 4. Unimodal pore size distribution showing the slope (C(h)) as a function of matric potential (h) for no-tillage (NT) and conventional tillage (CT) at 15–30 cm soil depth. The dotted lines represent size separation of soil pores.
Water 14 03517 g004
Table 1. Parameters of the van Genuchten model of the soil–water retention curve for a sandy loam soil at 0–15, and 15–30 cm depths averages under no-tillage (NT) and conventional tillage (CT). The α parameter is related to the inverse matric potential at inflection point (cm−1); n is associated with pore size distribution; θr is the residual water content (cm3 cm−3); and θs is water content at saturation (cm3 cm−3). Each value is an average of 20 measurements (average of 4 years of data and 5 replications per treatment at each depth). After Jabro and Stevens (2022).
DepthTillageαnθrθs
(cm−1) (cm3 cm−3)(cm3 cm−3)
0–15NT0.0229 (0.0064)1.737 (0.255)0.0724 (0.034)0.3906 (0.0289)
CT0.0263 (0.0065)1.823 (0.349)0.0649 (0.031)0.4164 (0.0285)
15–30NT0.0172 a (0.0059)1.736 (0.250)0.0539 (0.034)0.3581 a (0.0127)
CT0.0238 b (0.0049)1.842 (0.363)0.0606 (0.036)0.3973 b (0.0311)
Note(s): Different letters within a soil depth indicates significant at p ≤ 0.05. Numbers between parentheses represent standard deviations.
Table 2. Results of paired t-test analysis (mean difference, Md) comparing pore size distribution (PSD) between untilled (NT) and conventionally tilled (CT) soils at 0–15 and 15–30 cm depths for macro-, meso-, and micro-pore classes.
Pore Size ClassDepth
(cm)
Mean Difference,
Md (cm−1)
t-Valuep > t
Macro-pores0–150.0000912.790.0386
15–300.0001453.240.0230
Meso-pores0–150.0003474.480.0029
15–300.0004744.380.0032
Micro-pores0–15−0.00000115−2.460.0699
15–30−0.00000491−1.770.1509
Table 3. Soil pore volume of macro-, meso-, and micro-pore classes of untilled (NT) and conventionally tilled (CT) soils at 0–15 and 15–30 cm depths.
Depth, cmTillageMicropores §Mesopores §Macropores §Total Porosity
>300 hPa300–3 hPa<3 hPa
cm3/cm3
0–15NT0.14820.24120.00120.3906
CT0.12850.28640.00150.4164
15–30NT0.14270.21470.00070.3581
CT0.12420.27200.00110.3973
Note(s): § Macropore volume was estimated as the difference between volumetric water contents at matric suctions between saturation and <3 hPa; mesopore volume was estimated as the difference between volumetric water contents at matric suctions between 300 and 3 hPa; and micropore volume was estimated as the difference between total porosity (saturation) and volumes of macropores and mesopores.
Publisher’s Note: MDPI stays neutral with regard to jurisdictional claims in published maps and institutional affiliations.