Article

Possible Factors Driving Groundwater Quality and Its Vulnerability to Land Use, Floods, and Droughts Using Hydrochemical Analysis and GIS Approaches

1
Geology Department, Faculty of Science, Suez University, Suez 43518, Egypt
2
Academy of Scientific Research and Technology (ASRT), Cairo 11516, Egypt
3
Division of Geological Applications and Mineral Resources, National Authority for Remote Sensing and Space Sciences (NARSS), Cairo 1564, Egypt
4
Institute of Applied Technology, Thu Dau Mot University, Thu Dau Mot 75000, Vietnam
5
Laboratory of Environmental Sciences and Climate Change, Institute for Computational Science and Artificial Intelligence, Van Lang University, Ho Chi Minh City 700000, Vietnam
6
Faculty of Environment, Van Lang University, Ho Chi Minh City 700000, Vietnam
7
College of Engineering, Civil Engineering Department, Najran University, Najran 66291, Saudi Arabia
8
Geology Department, Faculty of Science, Sohag University, Sohag 82524, Egypt
*
Author to whom correspondence should be addressed.
Water 2022, 14(24), 4073; https://doi.org/10.3390/w14244073
Submission received: 30 October 2022 / Revised: 5 December 2022 / Accepted: 7 December 2022 / Published: 13 December 2022
(This article belongs to the Special Issue The Impact of Climate Change and Land Use on Water Resources)

Abstract

:
Land use and climate change always induce significant changes in various parameters of the hydrologic cycle (e.g., surface runoff, infiltration, evapotranspiration). The Wadi El-Assiuti downstream area in the Eastern Desert of Egypt is one of the most promising areas for development that is suffering from insufficient water availability and inadequate water quality for different purposes. The main goal of this research is to evaluate the changes in groundwater quality, land use, and climate in association with geology and flooding during three periods within the years 1997–2019 in the downstream portion of Wadi El-Assiuti in the Eastern Desert of Egypt, using spatiotemporal variation associated with groundwater hydrochemical analysis and GIS techniques. About 133 groundwater samples were collected to examine groundwater quality changes over time. Different groundwater quality indices were calculated, and the results show that TDS levels of groundwater in the study area ranged between 1080–2780 mg/L, 672–4564 mg/L, and 811–6084 mg/L, while SAR levels varied within 6.15–15.34, 1.83–28.87, and 1.43–30.57 for the years 1997, 2007, and 2019, respectively. Both RSBC and SSP values exhibited significantly increasing trends over time. KR values were within 1.36–4.06 in 1997, 0.58–14.09 in 2007, and 0.35–14.92 in 2019; MAR values were within 6.9–45.2 in 1997, 20.79–71.5 in 2007, and 17.71–75.81 in 2019; and PI values were within 60.16–83 in 1997, 45.56–101.03 in 2007, and 42.51–148.88 in 2019. Across the entire study area, ongoing land use changes increased from 1.1% in 1997 to 4.1% in 2019. Findings pointed to the significant contribution of the deep Nubian Sandstone Aquifer to the groundwater aquifer at Wadi El-Assiuti through fractures and deep faults. Given the climatic conditions from 1997–2019, these changes may have affected water quality in shallow aquifers, especially with increasing evaporation. Realizing the spatiotemporal variation of the aquifer recharge system, land use development, and climate change clearly would help in water resource management. This study revealed that flooding events, deep-seated geologic structures, and land use development associated with human activities have the highest impact on groundwater quality.

1. Introduction

In arid and semiarid areas, groundwater is an increasingly important source for irrigation, industrial uses, and drinking water. As a result of Egypt’s geographic location in an arid and semiarid zone, it may be highly susceptible to climate change. Wadi El-Assiuti in Egypt’s Eastern Desert is one of the most suitable areas for development in which groundwater remains a key source of fresh water used in irrigation. Groundwater deterioration over time is the most critical problem that may hinder sustainable development in this area. Recently, many studies have been conducted to analyze and interpret the hydrologic impacts of climate change, land use [1,2,3,4,5,6], and in particular, many studies of Wadi El-Assiuti have considered hydrologic, geologic, and land use changes [7,8,9,10,11,12]. The groundwater quality in the desert areas on both sides of the Nile Valley, where there is less feeding from the Nile Valley, is related to many factors that can increase the degradation of groundwater over time. The human activities with the greatest impact on hydrologic processes have been land use changes [13]. The affected processes include changes in evapotranspiration and infiltration, which in turn alter subsurface and surface flow [14,15]. Irawan and Puradimaja [16] and Singh et al. [17] found that the deterioration of groundwater quality in many agricultural areas and around urban areas and industries has escalated conservation issues for many nongovernmental entities and governmental authorities. Water-quality data have been linked to changes in land cover and land use, and areas in the vicinity of rapid urban expansion and industrialization have been showing poor or unsuitable groundwater quality in particular [18]. Many studies demonstrate that vegetation ecosystem changes caused by land cover/land use change significantly influence the regional hydrologic cycle [19,20]. As a result, land cover/land use changes affecting hydrologic process within catchments have become important research areas in hydrology [21,22,23]. Land use changes are significantly indicated to be one of the main human-induced factors impacting the groundwater system [24,25]. In spite of the effect of land use and climate changes on water quality, this linkage has not been widely explored in Egypt but has long been recognized globally. Bhaduri et al. [26] concluded that land use changes are known to influence the hydrology of catchment areas.
In terms of human losses and economic damage, floods are considered one of the key devastating hazards in arid and semiarid areas, but often these areas lack sufficient data on key hydrologic processes [27]. Therefore, understanding groundwater quality responses to extreme flooding and drought in such areas is critical for water-resource management and sustainability. Various studies have been performed in Egypt to calculate and/or evaluate catchment areas and flash-flood discharge for different purposes, including hazard maps and runoff harvesting [28,29,30,31,32,33,34,35,36,37].
Data acquisition over long periods of time is the biggest challenge in such studies that require variable data over time, in addition to filling the spatial data gap, which has data deficiencies [38]. However, recently the use of advanced statistical predictive analysis and mathematical models has been found to be very promising in building flood-preparedness systems, forecasting the groundwater regime and filling the gaps in some spatial data [39,40,41].
According to Reed et al. [42], collecting timely and accurate datasets or other information on land use is important for the detection of land use change. Although different techniques and methods can be applied to collect land use data, remote sensing data and technologies can greatly facilitate the data collection process [43]. Since graphical approaches have limitations in their ability to comprehend hydrogeochemical processes, geostatistical methods and models have been employed with uncertainty quantification in several previous studies [44,45,46,47,48].
The main objectives of the present study are (1) delineating the groundwater quality changes over 23 years in 3-year intervals ranging from 1997 to 2019, and to (2) assess the impact of land use, climate changes and floods, and geologic structure on groundwater quality using different groundwater quality indices, GIS, and remote sensing tools.

2. Study Area Description and Topography

In terms of geography, Wadi El-Assiuti is in the EED within longitudes 31°16′–31°37′ E and latitudes 27°10′–27°25′ N (Figure 1). The climatic conditions of Wadi El-Assiuti are arid to semiarid, with hot and dry summers that are characterized as drought and mild winters that experience only rare rainfall [49]; the occasional heavy rainfall is of short duration [50]. Salama et al. [51] reported that through the last 10 years the highest mean temperature was 39 °C (recorded in July) and the lowest was 8 °C (recorded in January). The highest mean relative humidity recorded in the study area was 50% in December and the lowest was 24% in May. Wadi El-Assiuti runs southwestward for a distance of ~115 km, with its width varying in the range 5–25 km [50]. Altitudes of the Wadi El-Assiuti decrease southwestward along the wadi and range within 65–137 m [50], but the altitude of the limestone plateau bounded by the basin is 195–330 m above sea level.

3. Geological and Hydrological Setting

3.1. Geology

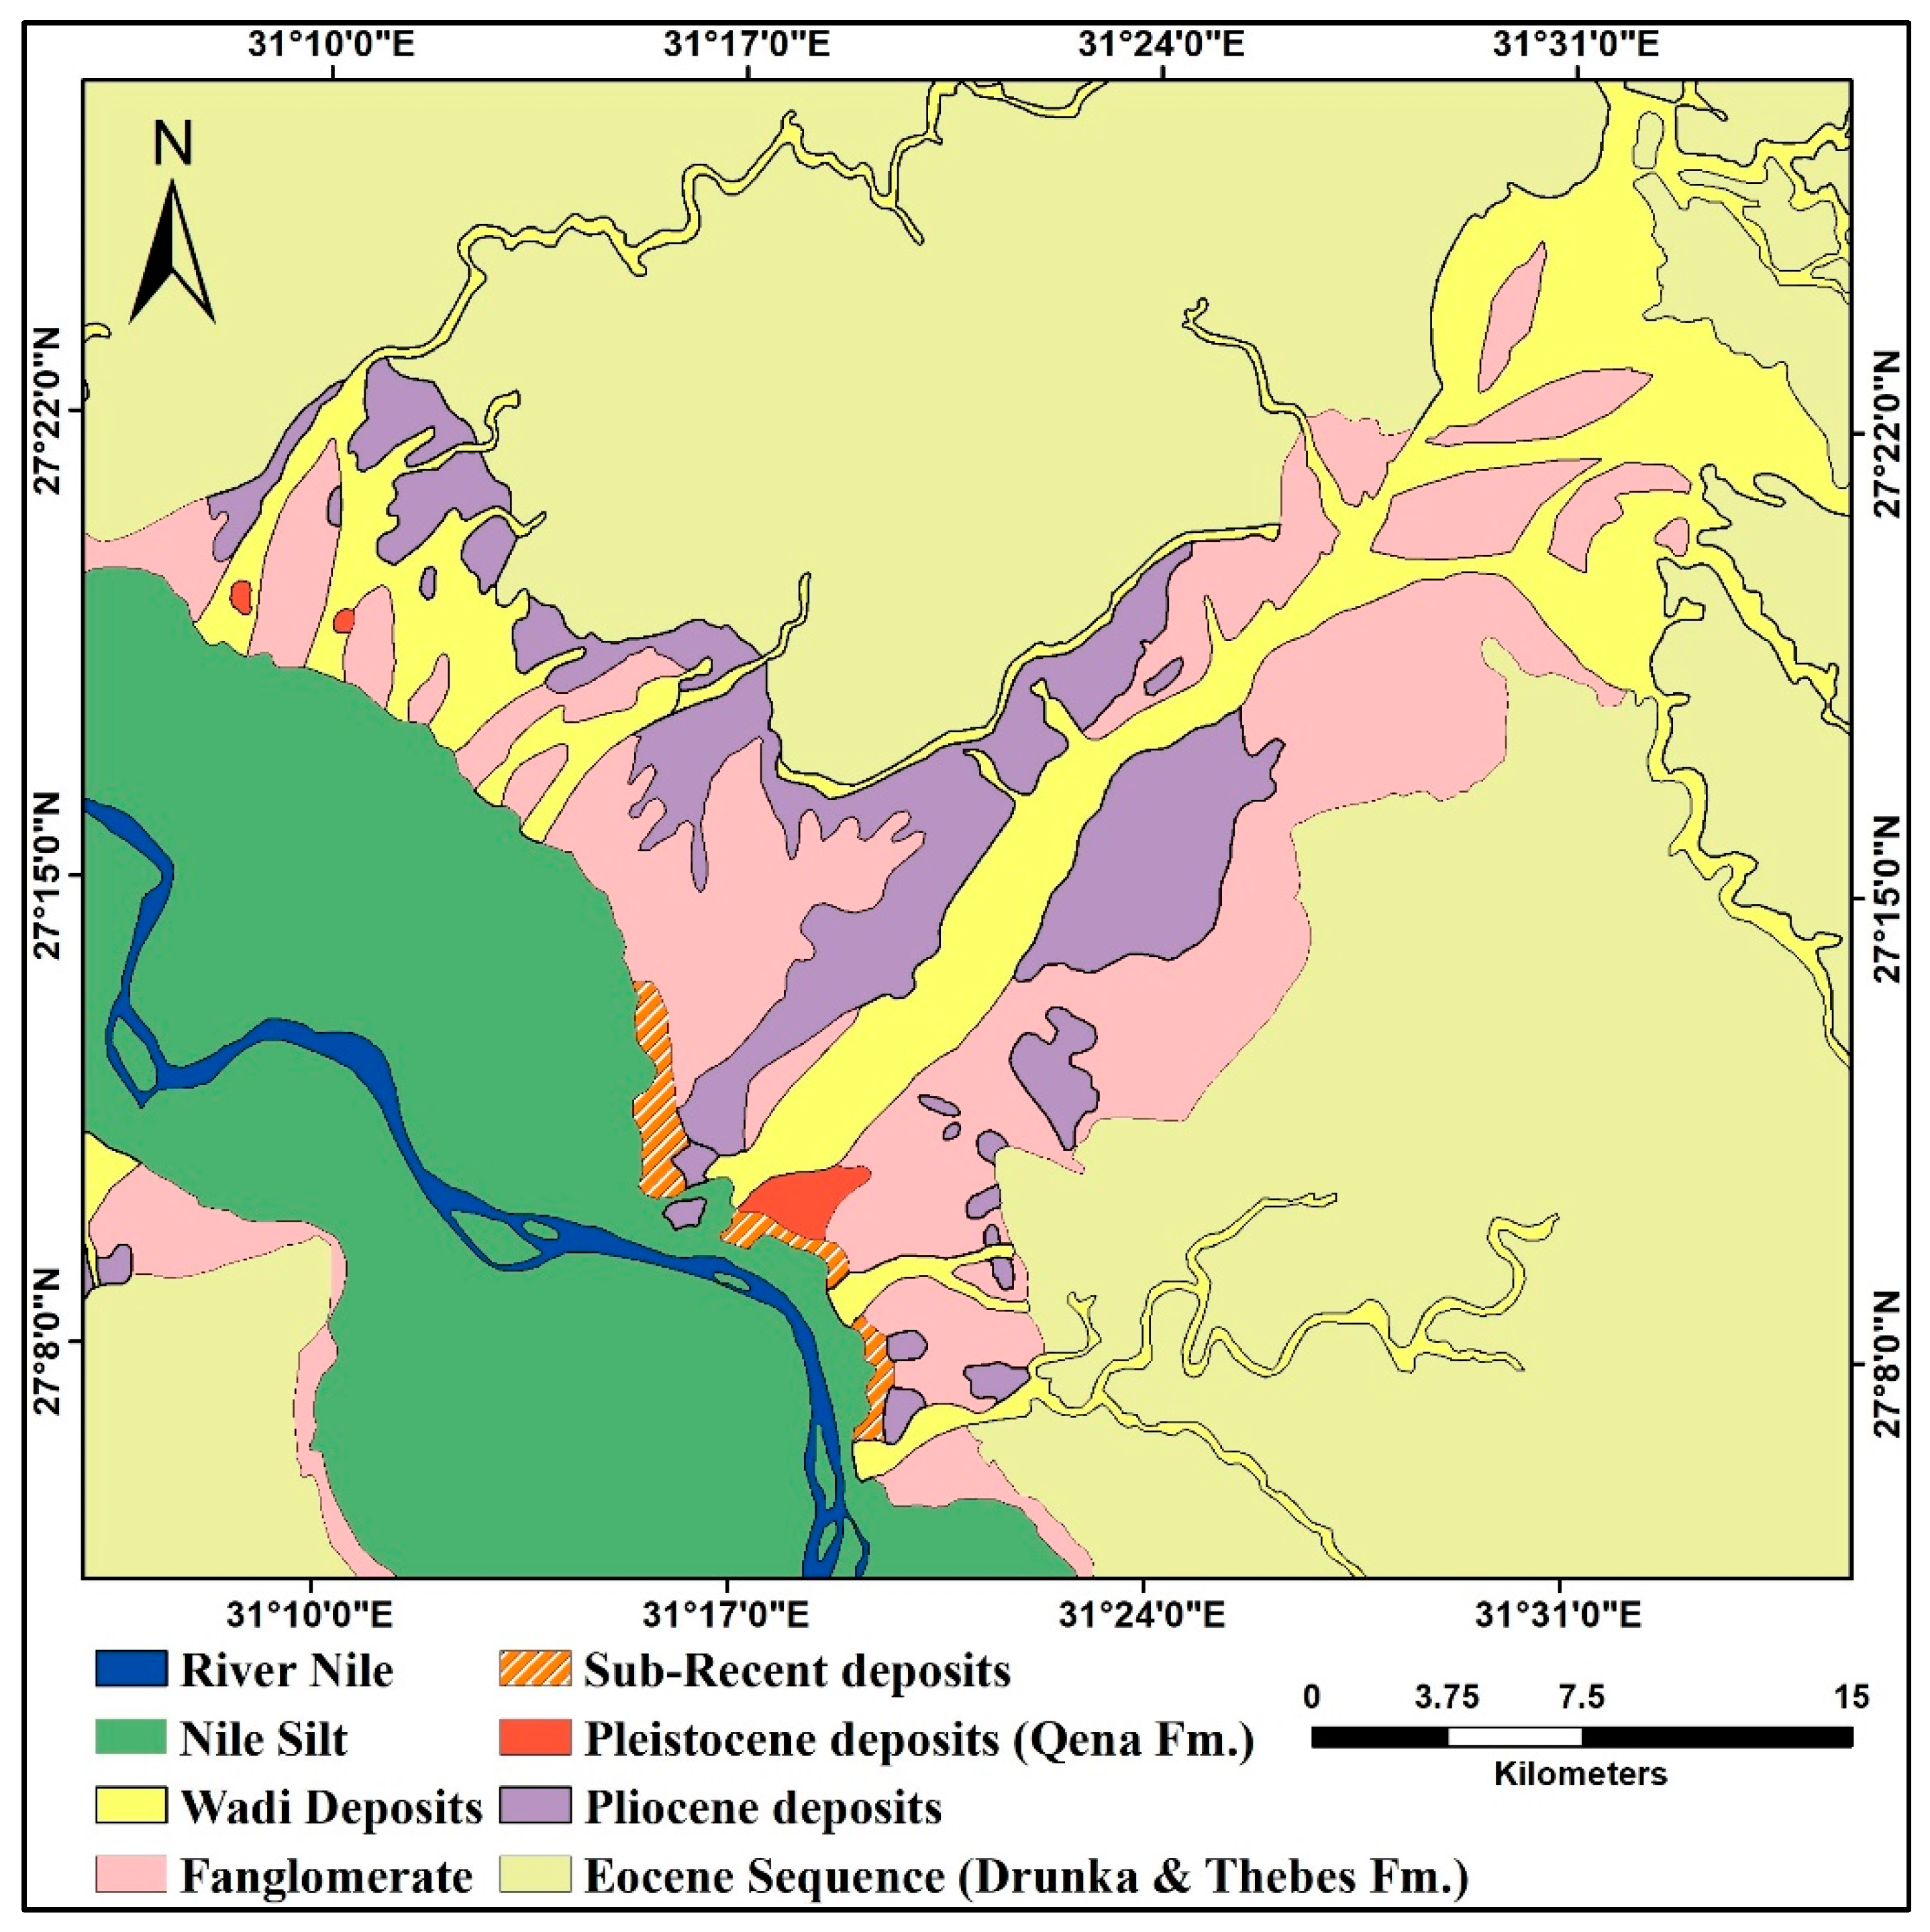
Various stratigraphic studies conducted by other researchers revealed that all the main rock types are sedimentary [52,53,54,55]. The surface of the Wadi El-Assiuti area consists of sedimentary units that are mainly Quaternary and Plio-Pleistocene in age (Figure 2). Eocene carbonate rocks form the boundary of the wadi on the north, south, and east sides; the western margin is considered to be the downstream wadi, overlooking the Nile floodplain. Said [53] distinguished the sediments in and around the outlet of Wadi El-Assiuti (by decreasing age order) into (i) the Eocene sequence, which, according to Mansour and Philobbos [52] can be classified from base to top into Thebes, Drunka, Manfalout, and Ibrahimi formations; (ii) exposed Pliocene sediments, which consist mainly of massive, brown to brick-red mudstones interbedded with thin, fine- to coarse-grained cross-laminated sandstone beds; (iii) exposed Pleistocene sand, clay, and gravel sediments that rest unconformably on the Pliocene sediments; and (iv) recent to sub-recent alluvial sediments, which cover much of the study area and consist mainly of unconsolidated sediments of terrestrial origin, represented by wadi-filling fanglomerates and sand deposits. Gravels of different sizes with fossils (macrofossils and Nummulites) embedded in sand, limy, and clayey matrix; all were derived from the adjacent limestone plateau during recent times and are the composition of wadi filling in the area. According to a Wadi El-Assiuti study by Yousef [56], the main fault systems (in decreasing order) are the northwest- (Clysmic), northeast-, and east–west-trending (Tethyan). The northwest-trending faults developed after the northeast-trending fault system.

3.2. Hydrogeology

Wadi El-Assiuti is considered one of the most important hydrographic basins in the EED. Various studies have been conducted to collect information about the hydrologic setting in the study area [11,57,58,59]. The thickness of wadi deposits in Wadi El-Assiuti were recorded as 5 m and 15 m thick in the east and west, respectively. The groundwater aquifers in and around Wadi El-Assiuti are dominated by the Plio-Pleistocene aquifer, which is surrounded by the Quaternary aquifer to the west and the Eocene-age fissured limestone aquifer. Studies and drilling in the northern part of the area indicate that the upper 250 m are composed of clayey silts and limestones with very low groundwater productivity. Therefore, in the northern part of the area the Plio-Pleistocene aquifer is dry, whereas in the south is a perched aquifer. The central part of Wadi El-Assiuti consists mostly of the Plio-Pleistocene aquifer, which is represented by successions of silty or sandy layers or lenses with intercalated clayey layers. These sediments overlie Pliocene clays and underlie Quaternary sediment. The hydraulic properties of this area were found to differ according to thicknesses and compositions both vertically and horizontally. The area can be classified into two zones: the semi-unconfined upper zone and the semi-confined lower zone. The Quaternary aquifer in the area is composed mainly of sand and gravel and forms the Wadi El-Assiuti outlet area. This aquifer is unconfined and is <10 m at the southwestern end and reaches >30 m in the northeast. According to Farrag [11], the groundwater in this area is mainly recharged via the Nile irrigation system and the Quaternary aquifer of the Nile Valley. Figure 3 represents the hydrogeologic East–West cross-section at the basin downstream.

4. Data and Methods

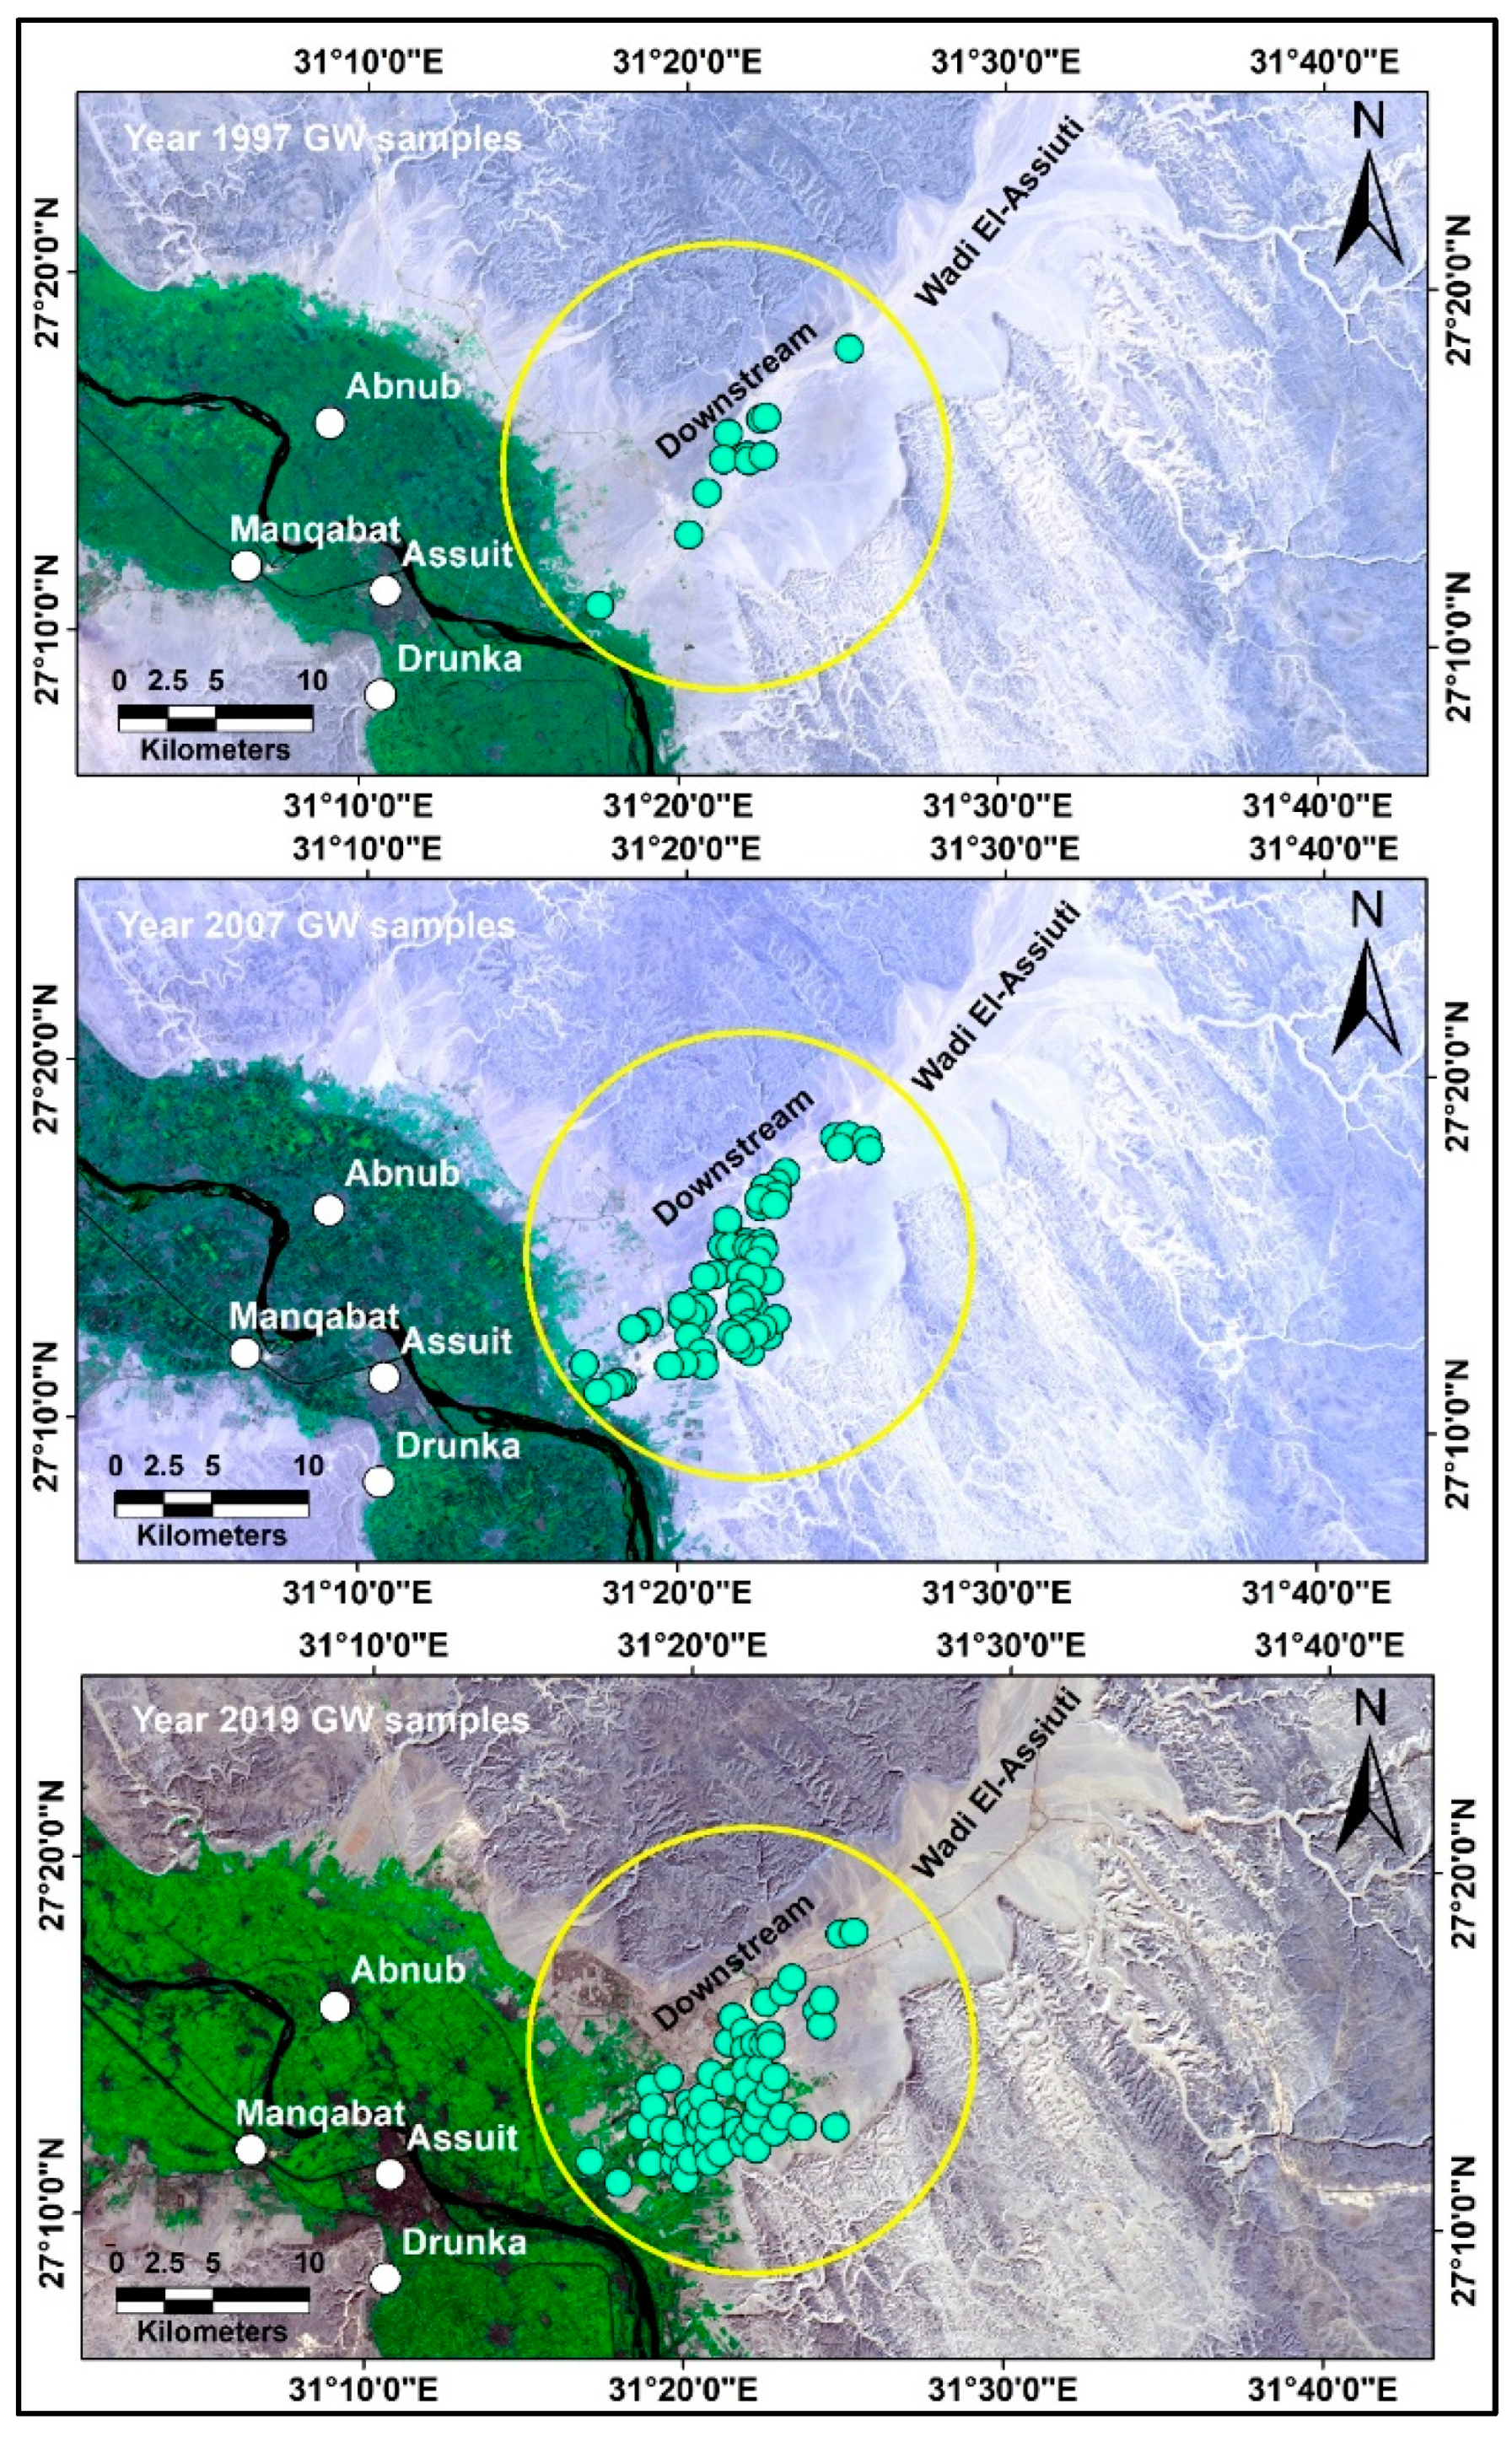
The present work at Wadi El-Assiuti depends on the analysis and interpretation of datasets including groundwater-quality data, hydrogeology, and climatologic data in addition to well-log data for the years 1997, 2007, and 2019. Samples to derive groundwater-quality data were collected along Wadi El-Assiuti during earlier research [7,58,60]. Locations of about 133 groundwater data points are shown on the map of Wadi El-Assiuti (Figure 1). The collected data were used for analysis and interpretation as well as for producing different comparative maps along the studied timespan. A GIS-based inverse-distance weighted interpolation method (IDW) was used as a geostatistical analysis tool for deriving groundwater quality indices.
Seven standard water quality indices were calculated: sodium-absorption ratio (SAR), residual sodium bi-carbonate (RSBC), soluble sodium percentage (SSP), Kelly’s ratio (KR), permeability index (PI), magnesium adsorption ratio (MAR), and total dissolved solids (TDS) (Table 1). Three Landsat satellite images (1997, 2007, and 2019) by the United States Geological Survey (U.S.G.S, 2018) were used to map land use changes during the specified period of time using change detection and supervised classification methods in a GIS platform (ArcMap 10.5) and a remote sensing technique (ESRI, 2015). The details of the satellite image data source are shown in Table 2. These images were enhanced by radiometric and atmospheric correction using ENVI 5.3 (2018).
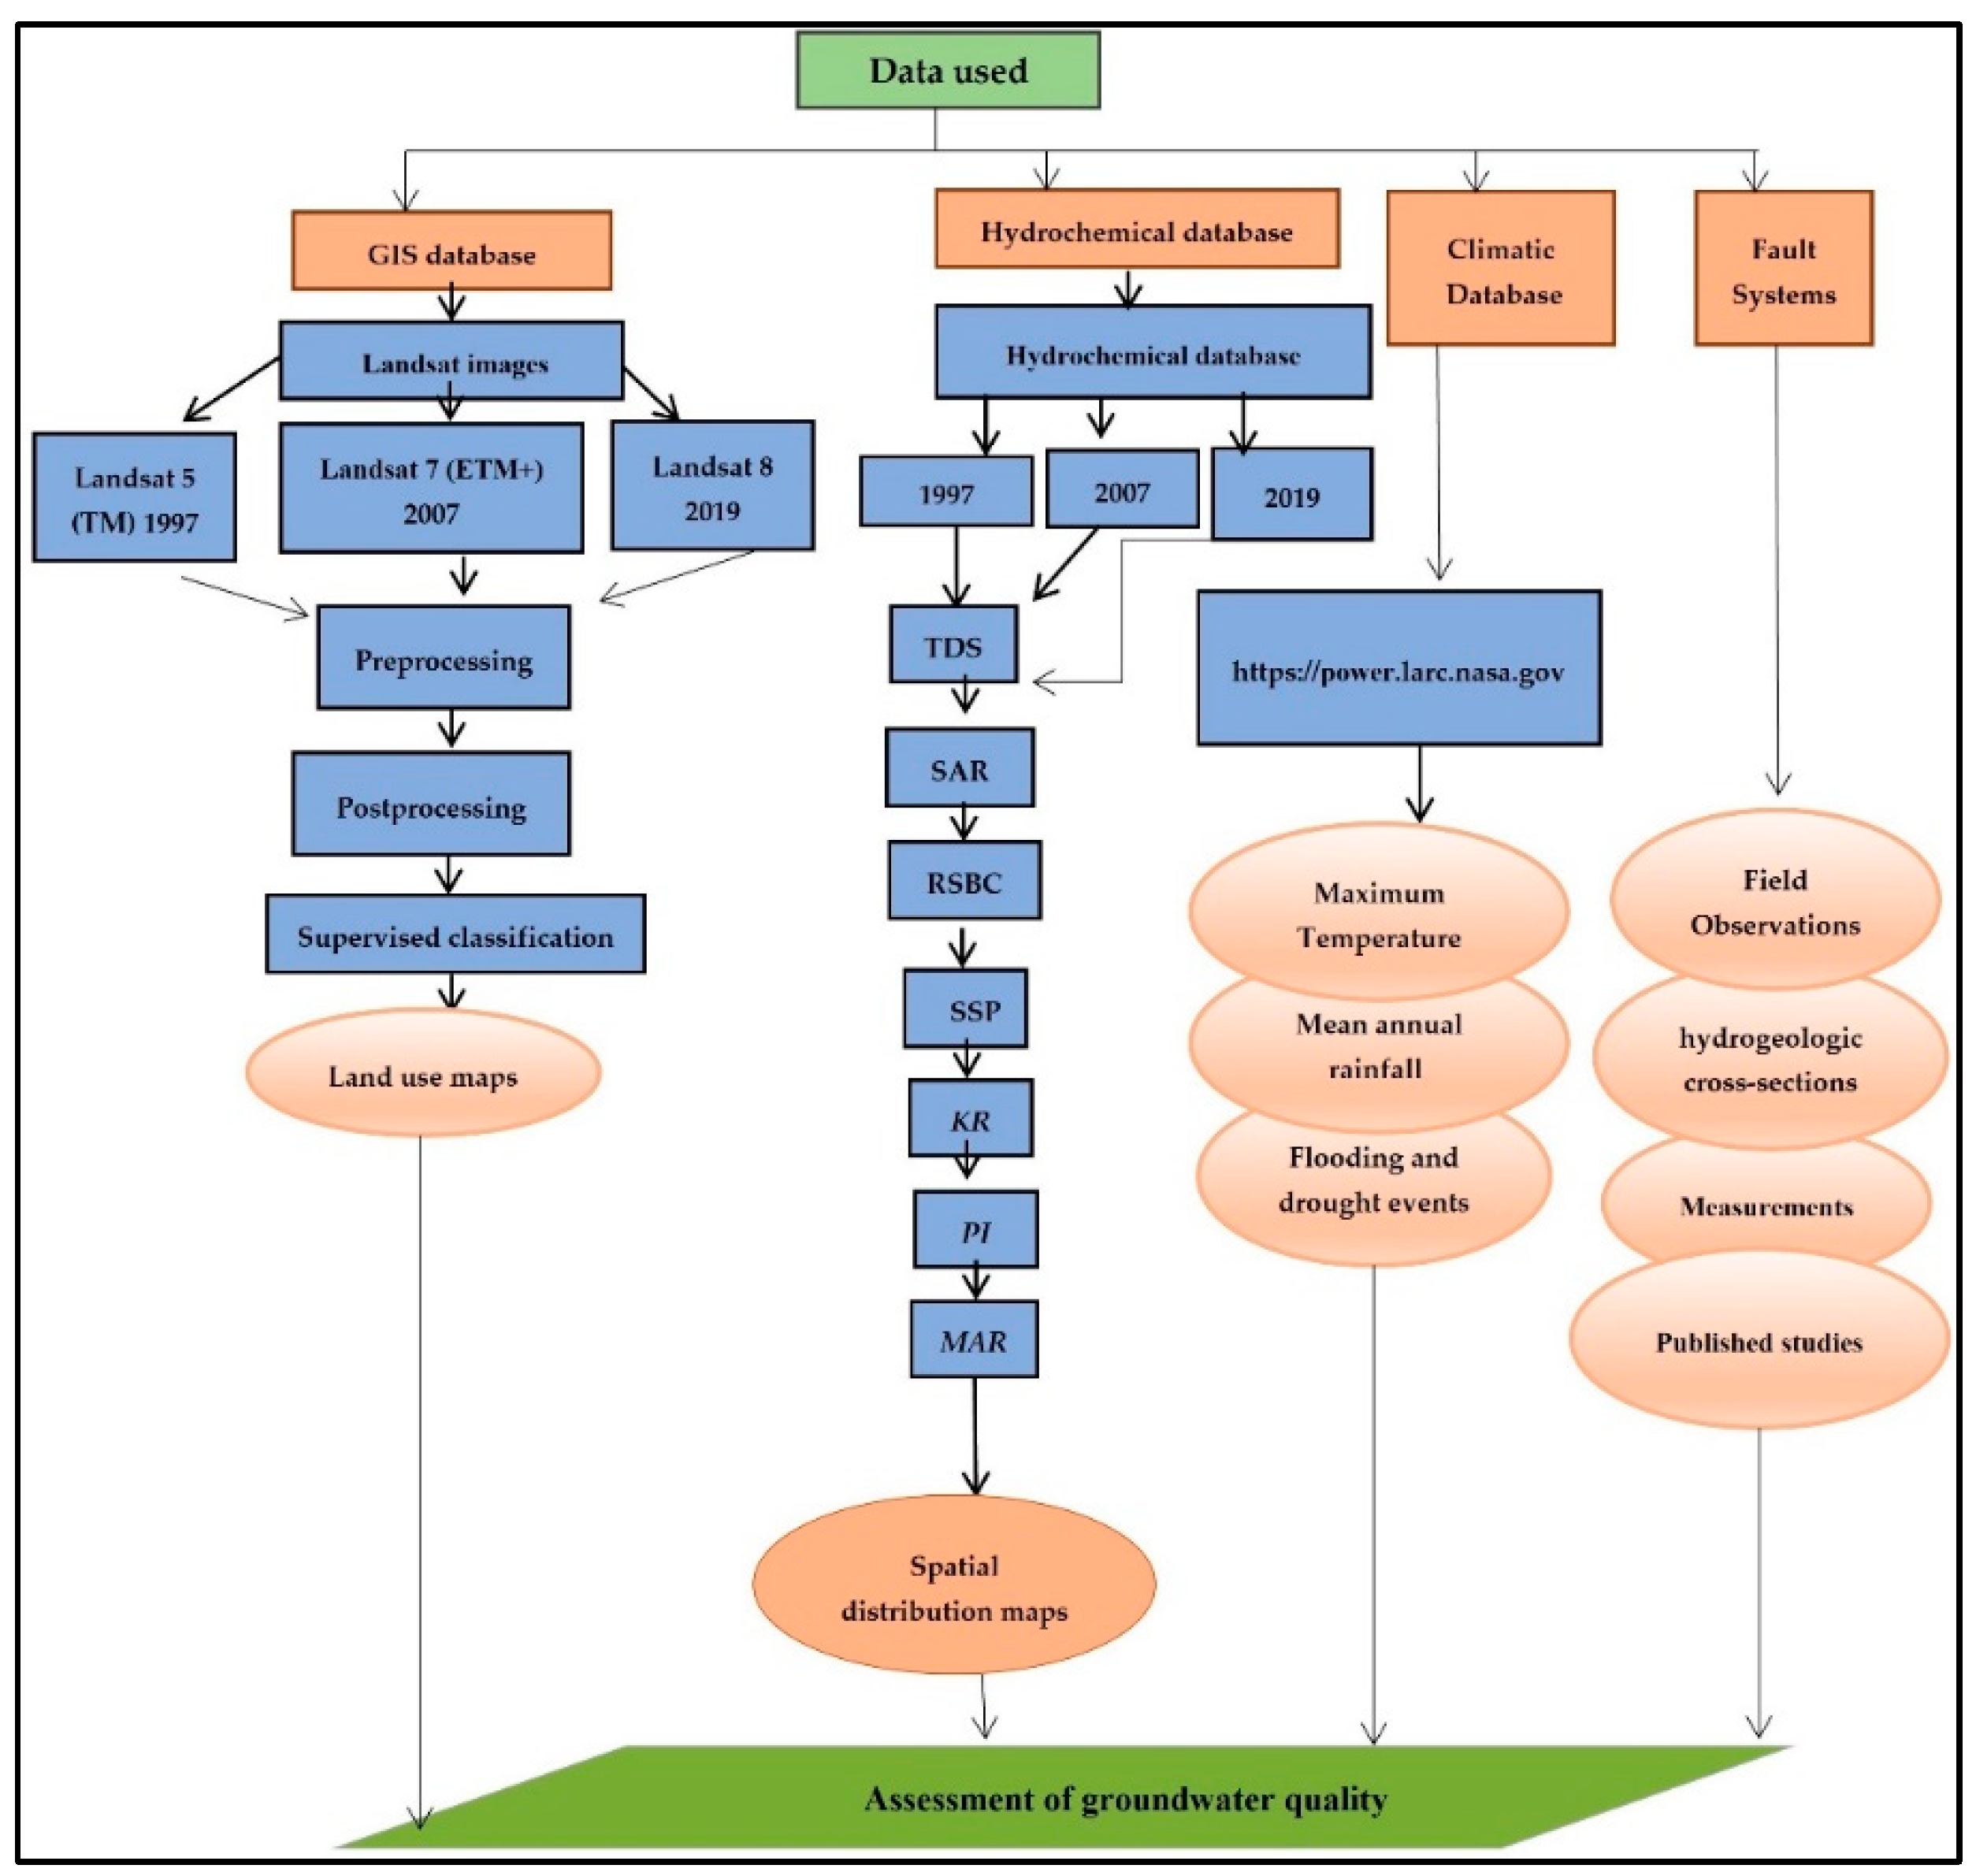
Climatic condition data for the specific study years (1997–2019) were acquired mainly from the U.S. Geological Survey (https://earthexplorer.usgs.gov, accessed on 20 October 2022) accessed on 20 August 2021. The nonparametric Mann–Whitney test was also applied to the groundwater quality and climatic condition data. Moreover, hydrogeologic cross-sections, field observations, and measurements as well as other researchers’ published studies of the study area were collected to determine the role of the fault system in alluvial groundwater recharge. Figure 4 shows a general flowchart showing the methodology of this study.

5. Results and Discussion

5.1. Linkages between Different Aquifers

According to Farrag [11], the groundwater under two zones of water-bearing layers (with different hydraulic potentialities within these zones) differs vertically and horizontally. The downstream groundwater occurs under semi-unconfined to semi-confined conditions. The static groundwater levels, ranging within <20–70 m [54,55], increased toward the north and decreased toward the southeast (Figure 3). However, the fluctuation of Quaternary groundwater in the outlet area of the Wadi El-Assiuti area is similar to the groundwater fluctuation condition in the Nile Valley. This indicates that the main recharge of Quaternary groundwater is the water from the Quaternary aquifer of the Nile and seepage from irrigation water. The differences among the collected samples indicate that groundwater well penetration may be responsible for the variations in groundwater salinity. Another possible controlling factor that significantly influences recharge is the active fault system at depth in the area throughout the northwest- and north–south-trending systems. Water quality variation could be attributed to recharge from the Nubian Sandstone Aquifer along deep fault systems. Yousef [56] noted that low salinities were recorded in the area along the deep fault system. However, previous research suggests significant evaporation from some shallow aquifers in part of the Wadi El-Assiuti [57].

5.2. Groundwater Quality Indices Trends

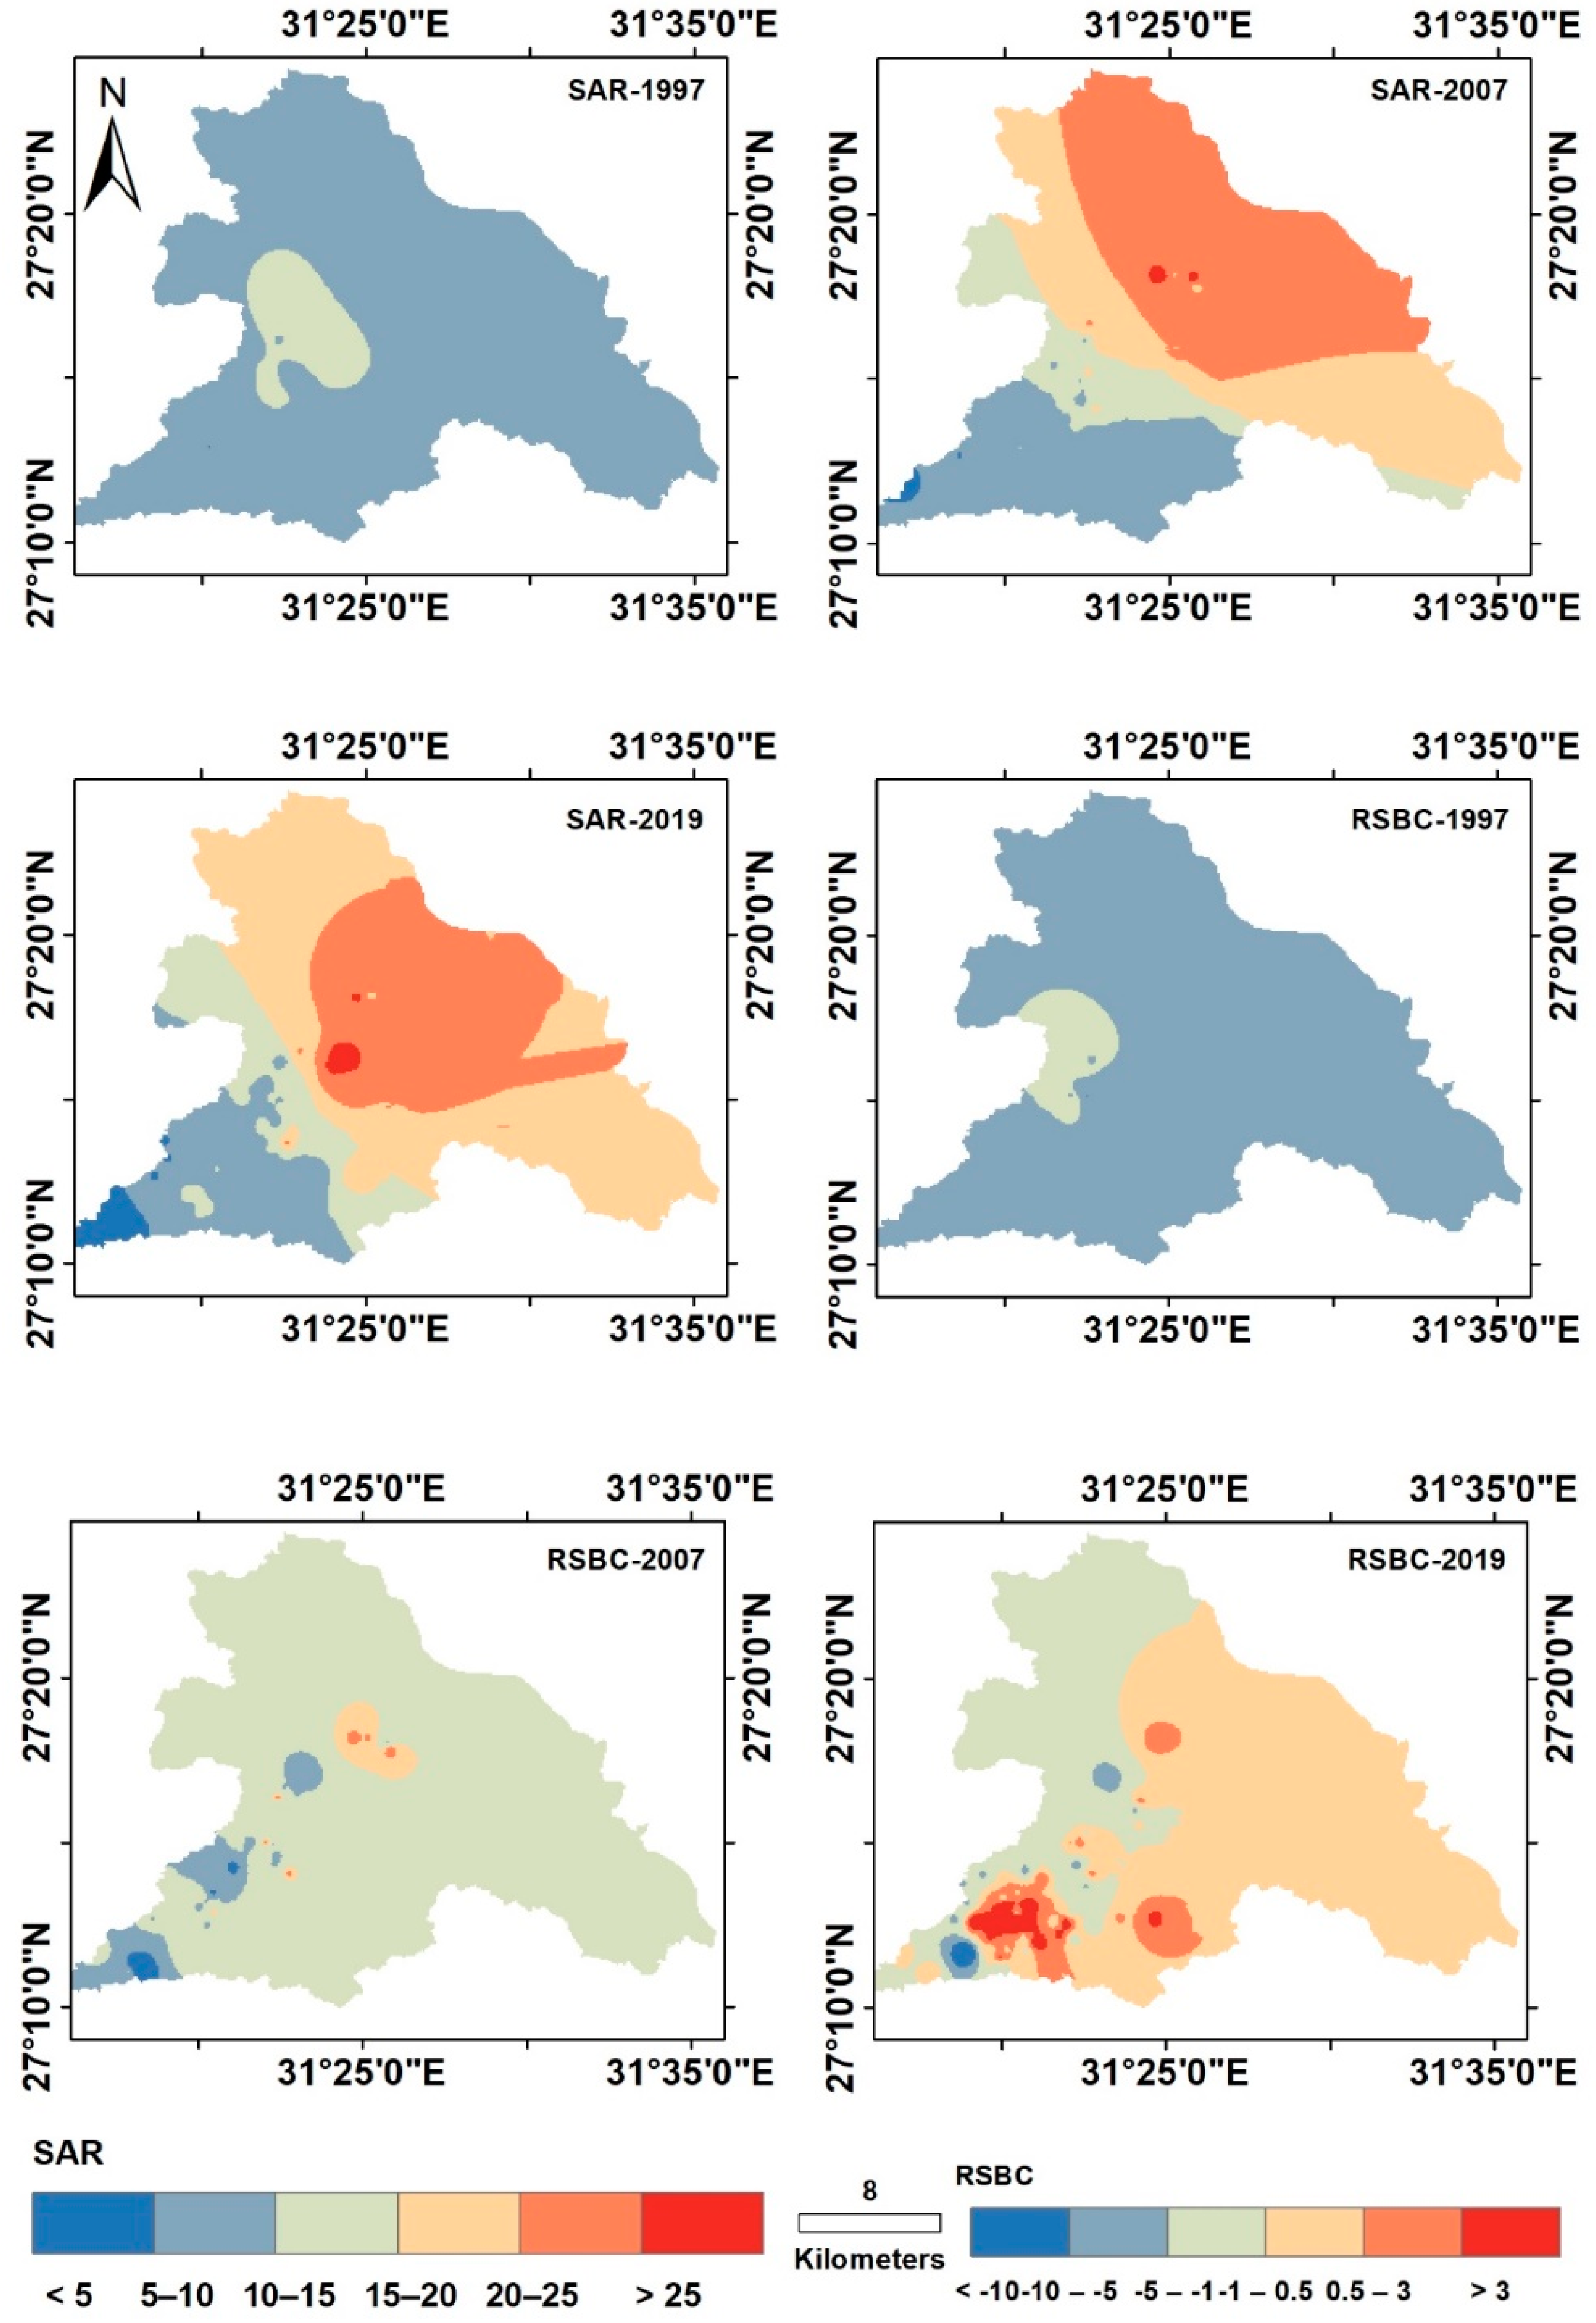
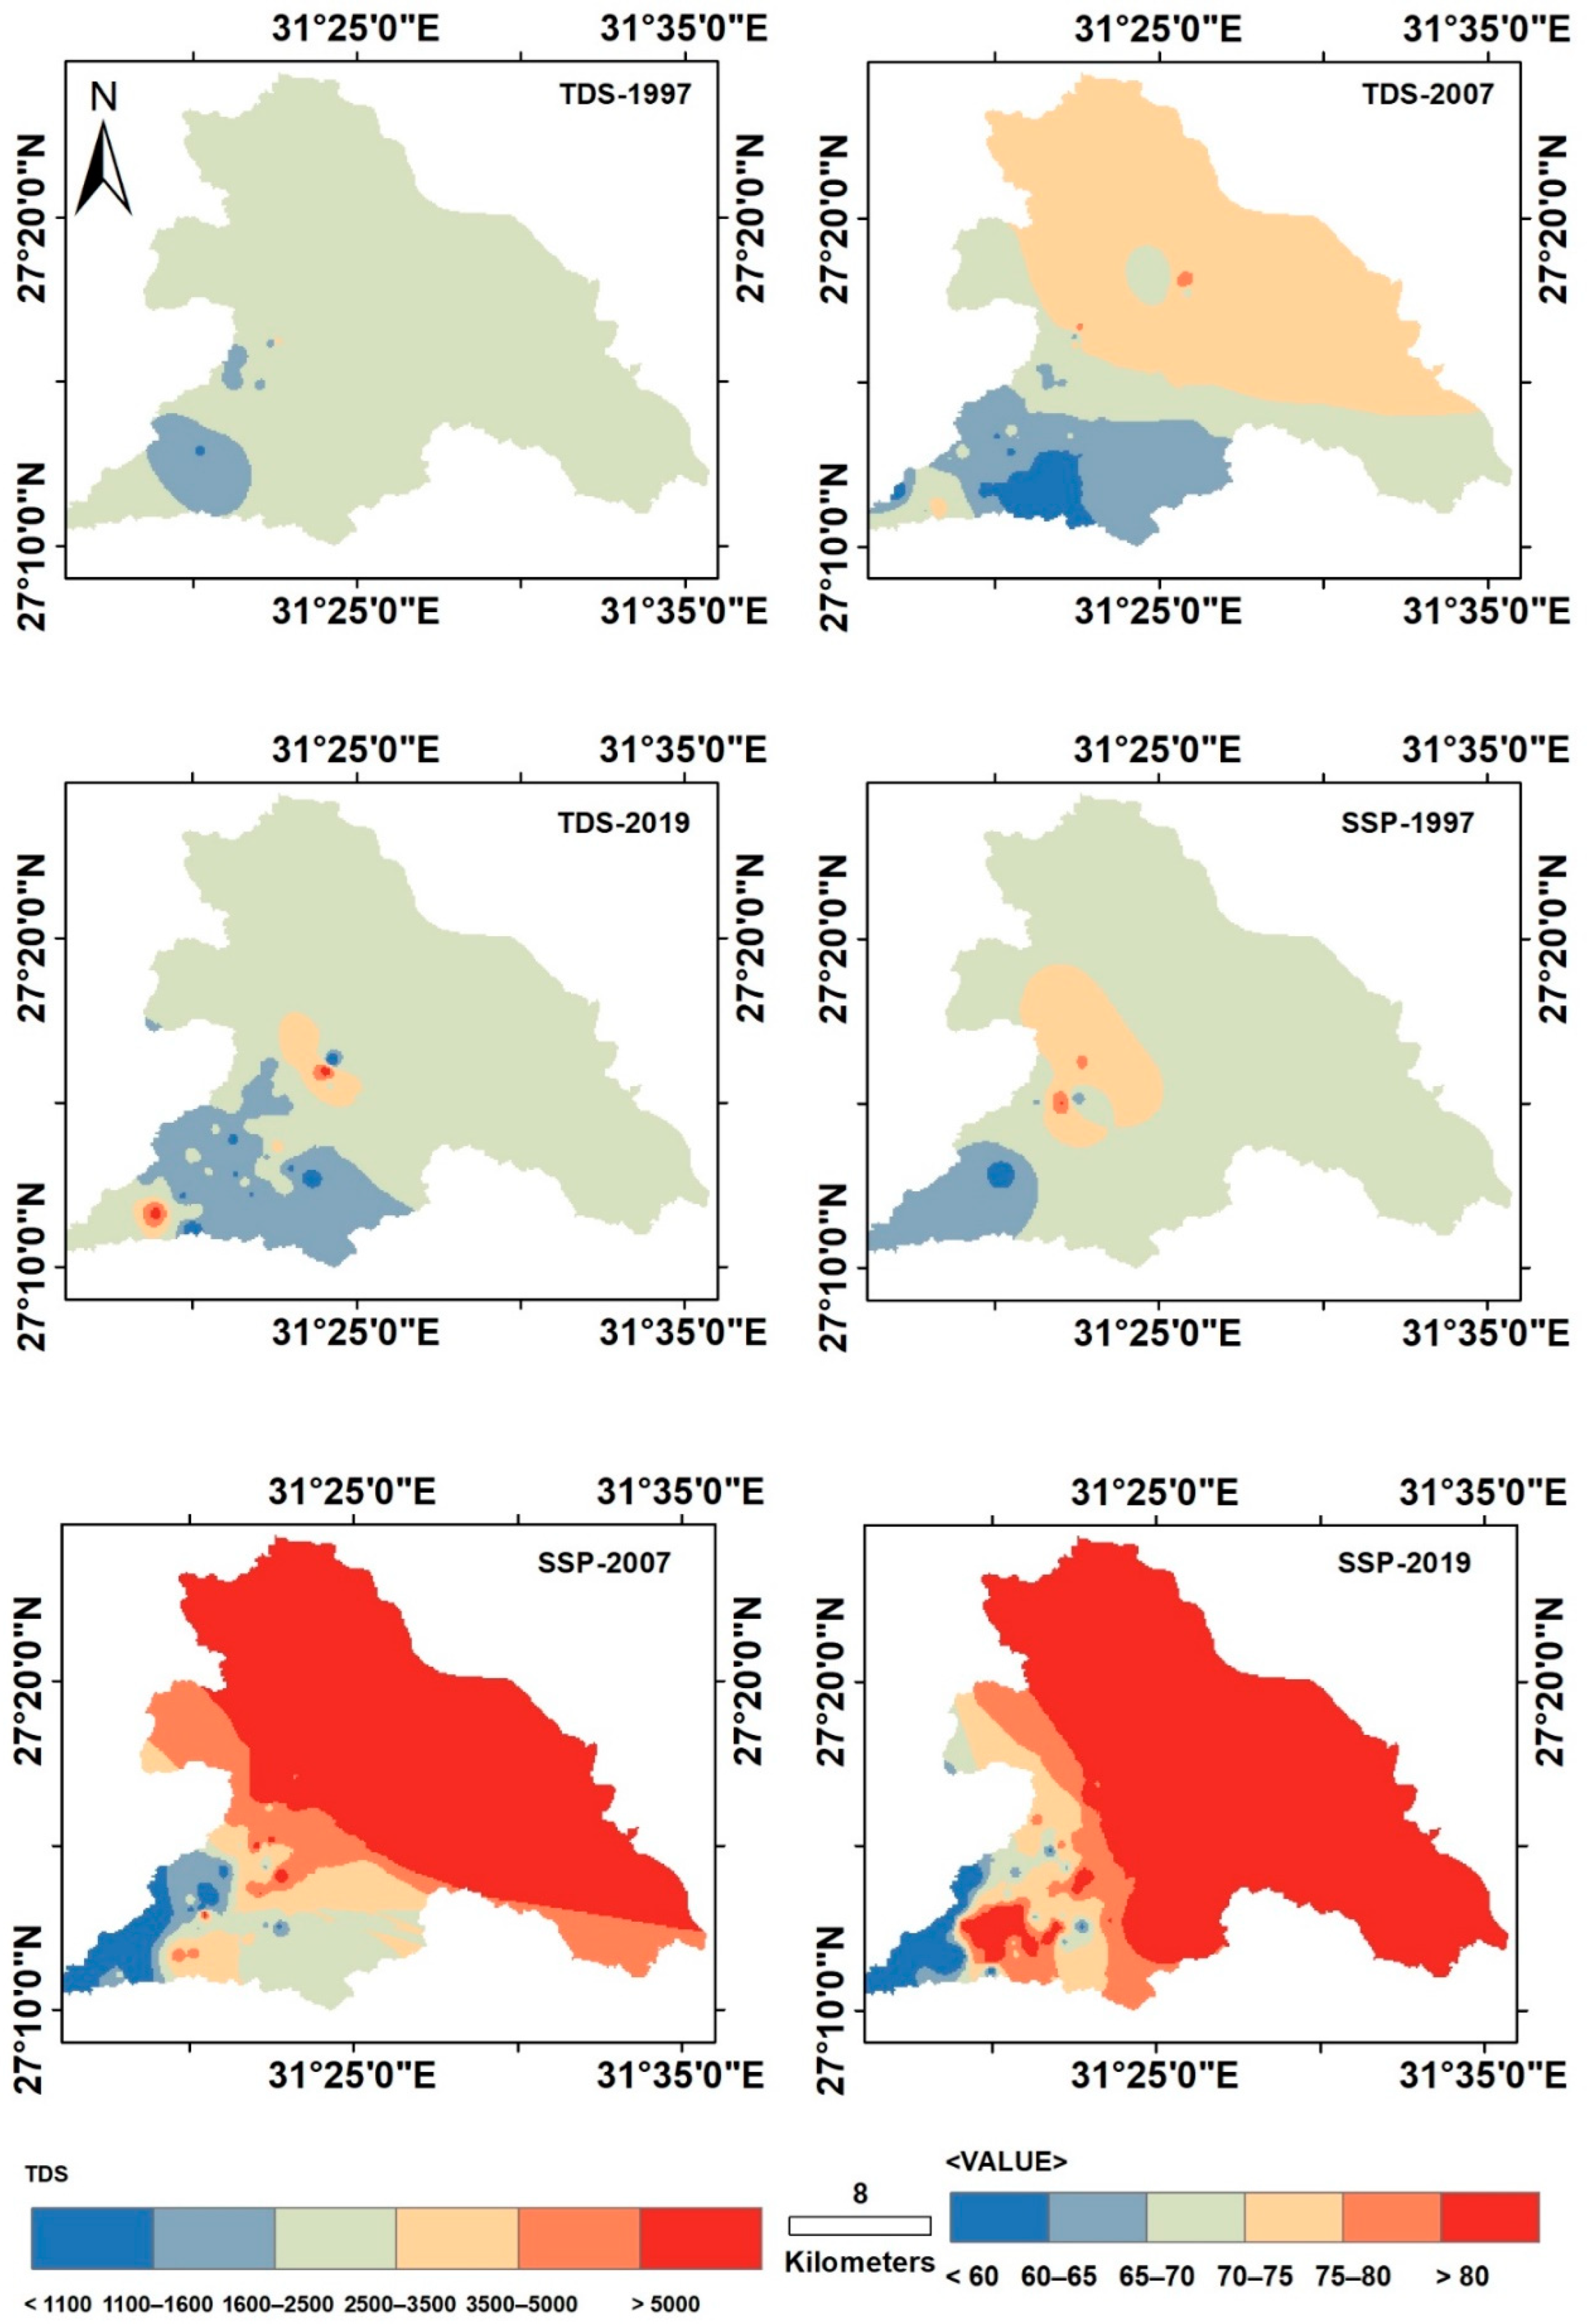
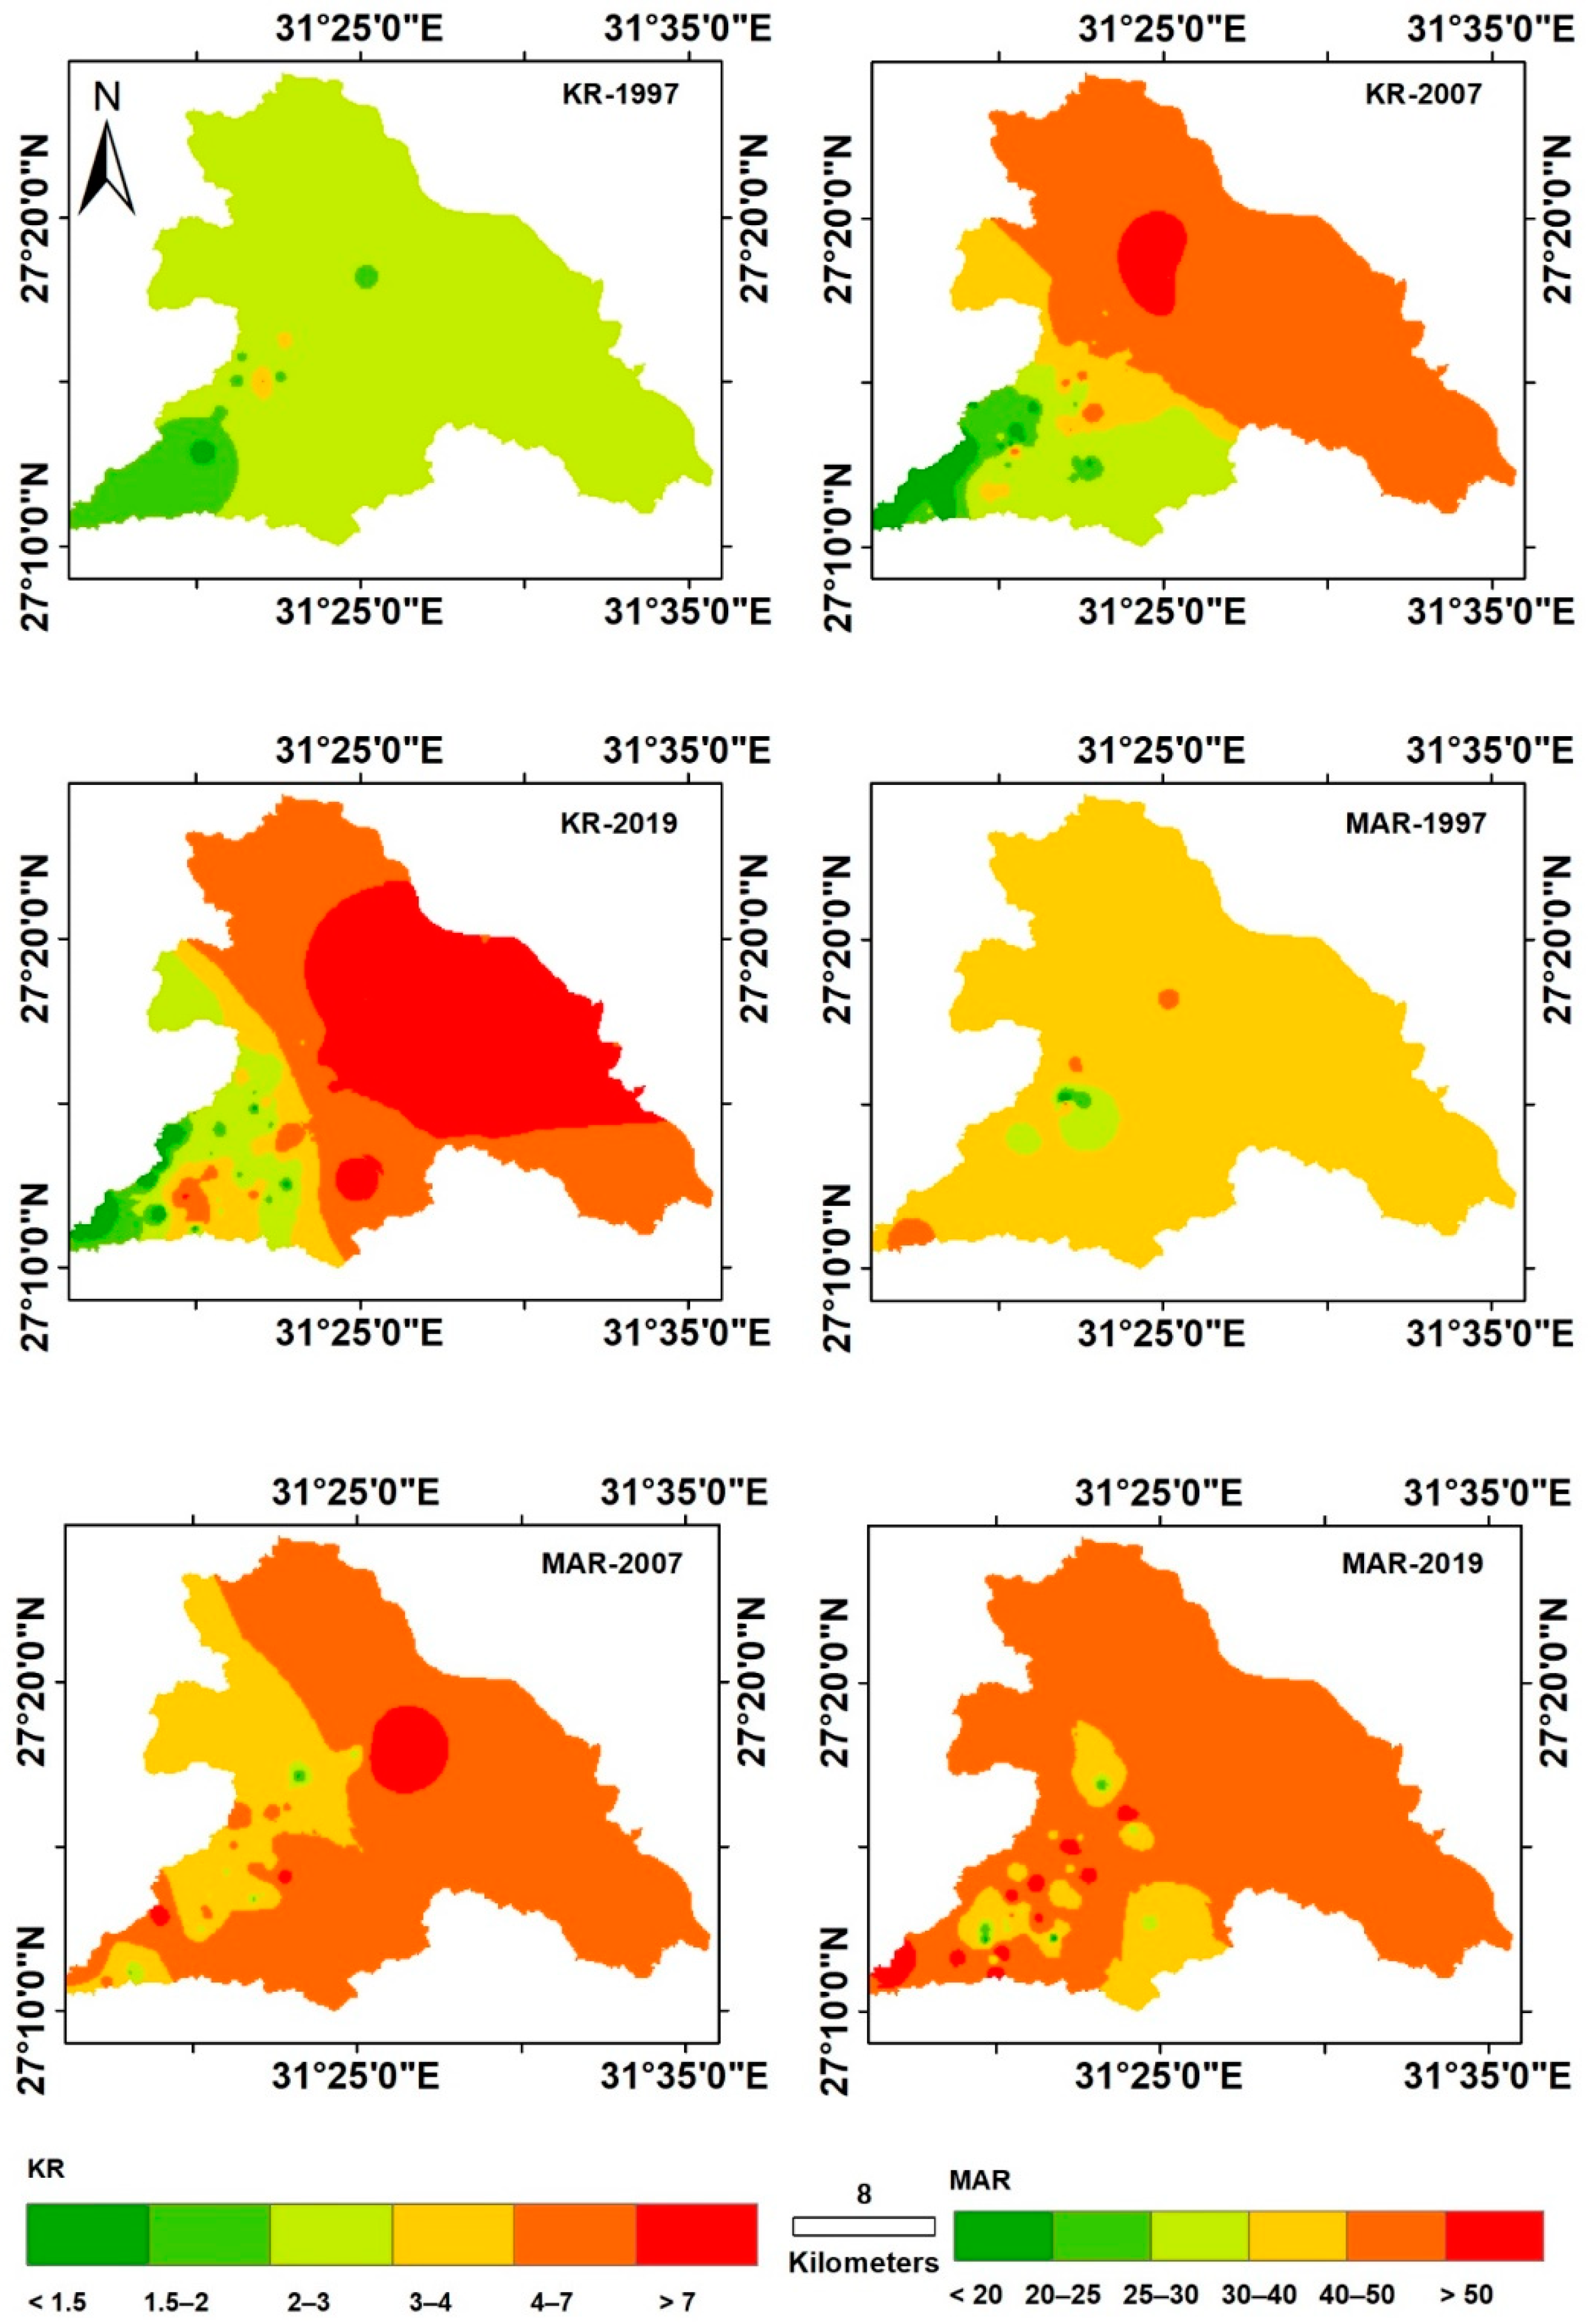
Our groundwater quality assessment involved calculation and evaluation of the indices TSD, SAR, RSBC, SSP, MAR, and PI (see Section 4). Chemical analysis data for our three study periods (1997, 2007, and 2019) were extracted from 23 years’ summary information on groundwater samples. Generally, water that has more than 1000 mg/L of dissolved solids has a disagreeable taste or otherwise makes the water unsuitable [61]. (TDS levels for water in the study area ranged within 1080–2780 mg/L during 1997, 672–4564 mg/L during 2007, and 811–6084 mg/L during 2019.) TDS values were observed to increase upstream in both 1997 and 2007, whereas in 2019 the TDS values increased in some locations within the upstream area. The levels of SAR ranged within 6.15–15.34 during 1997, 1.83–28.87 during 2007, and 1.43–30.57 during 2019. The SAR spatial distribution map shows a significant increase in SAR values from 1997 to 2019. During the years 1997, 2007, and 2019, ~73%, 63%, and 66% of samples were within the excellent class, respectively. SAR exhibited doubtful class percentages, showing increases for 1997, 2007, and 2019 as 0%, 14%, and 15%, respectively. RSBC values ranged within −9.38 to −1.94 during 1997, −17.9 to 1.95 during 2007, and −23.45 to 6.82 during 2019. However, SSP levels ranged within 58–80.44 during 1997, 38.73–93.39 during 2007, and 34.23–93.73 during 2019. Both RSBC and SSP values exhibited significantly increasing trends from 1997–2019; these trends are evident in the distribution maps, which were slightly low all across the study site in 1997 and then was extremely high in much of the area during 2019 (Figure 5). KR values were within the ranges 1.36–4.06 in 1997, 0.58–14.09 in 2007, and 0.35–14.92 in 2019; MAR values were within the ranges 6.9–45.2 in 1997, 20.79–71.5 in 2007, and 17.71–75.81 in 2019; and PI values were within the ranges 60.16–83 in 1997, 45.56–101.03 in 2007, and 42.51–148.88 in 2019 (Table 3). The KR, MAR, and PI spatial distribution patterns for the three periods (1997, 2007, and 2019) are similar to those observed for RSBC and SSP values, although MAR values show a slight decrease across the study area (Figure 5, Figure 6 and Figure 7).

5.3. Impacts of Land Use Changes on Groundwater in Wadi El-Assiuti

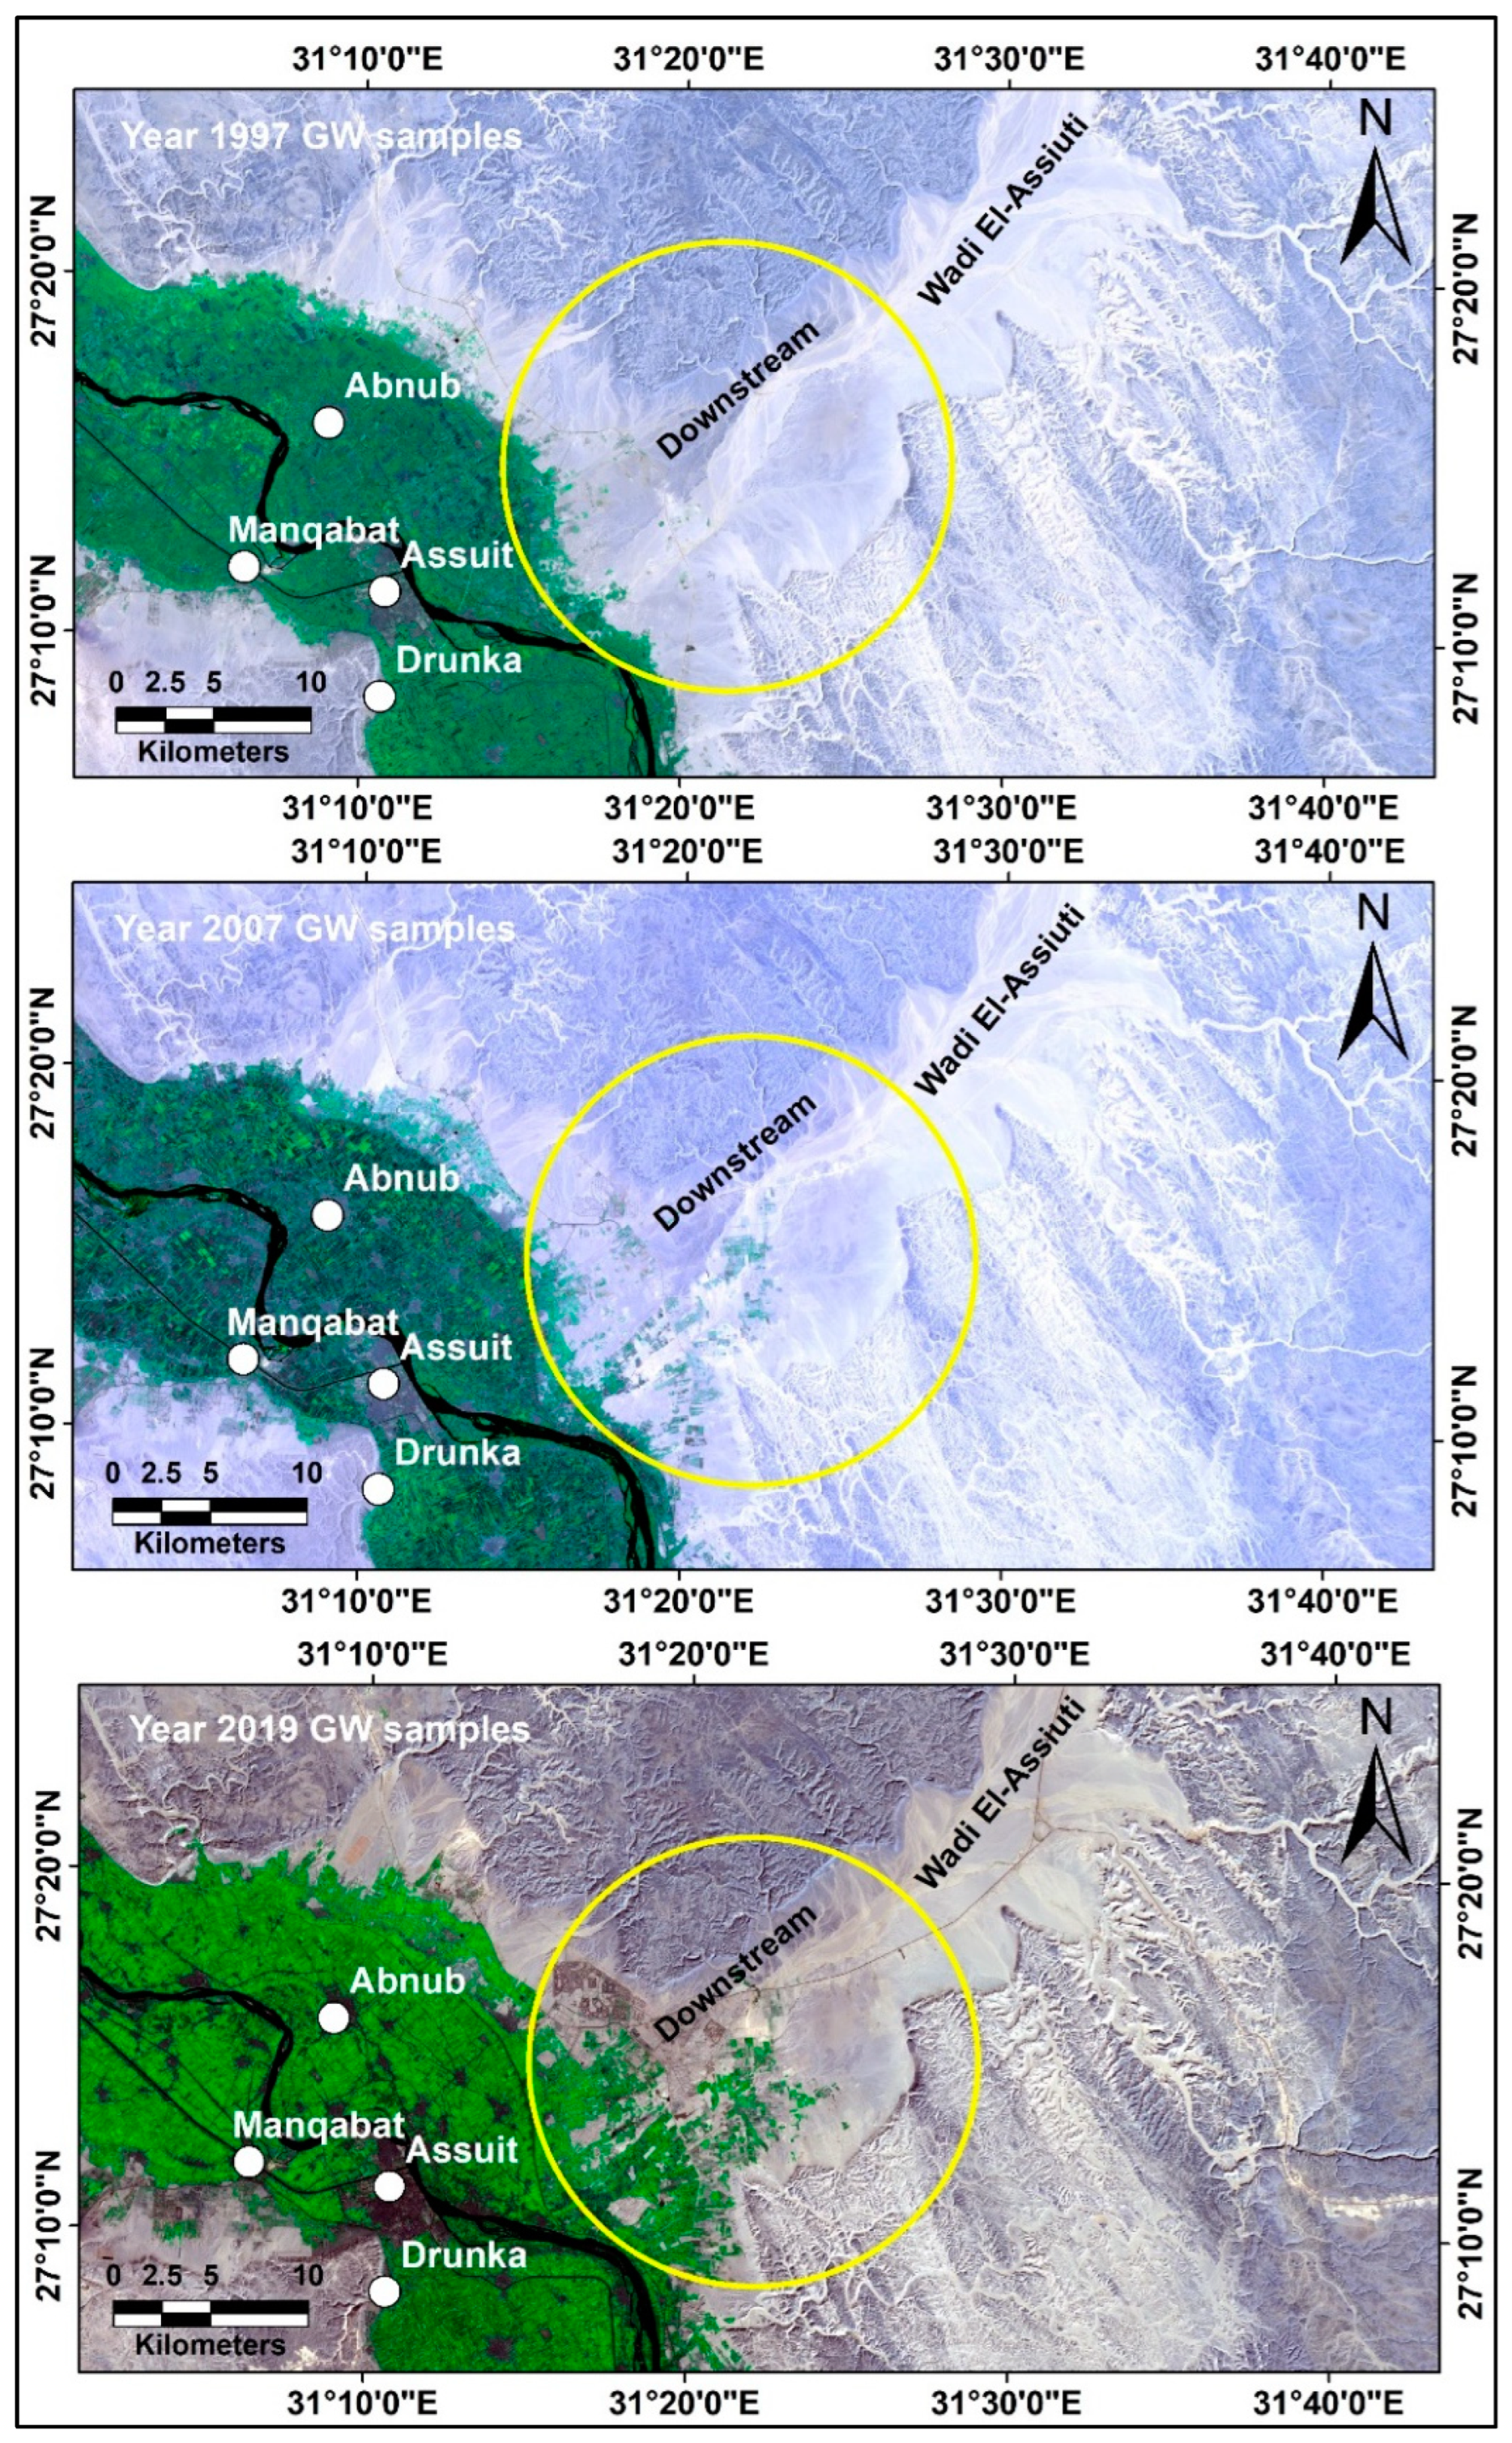
Various researchers [62,63] have studied the impact of the extensive expansion of aquiculture and other factors on soil and groundwater quality. Land use changes are significantly indicated to be one of the main human-induced factors impacting the groundwater system [24,25]. In spite of the effect of land use and climate changes on water quality, this linkage has not been widely explored in Egypt but has long been recognized globally. Bhaduri et al. [26] and Tang et al. [64] concluded that land use changes are known to influence the hydrology of the catchment area. For the last three decades, spatial distribution patterns of land use changes in the Wadi El-Assiuti region show the expansion of agricultural fields. Among the types of land use changes in the wadi from 1997 to 2019, extending agriculture across a wider area and using flooded water in irrigation has had the greatest impact on groundwater quality. Changes in groundwater recharge may have been caused by land use-related changes in irrigation practices causing excessive water extraction in the region, but the irrigation water, which is mostly applied floodwater, likely changed in infiltration rate (Figure 8). Thus, land use changes have had a major influence on groundwater quality downstream at Wadi El-Assiuti. Similarly, under the arid conditions that characterize the study area, land use changes affect aquifer recharge rates. Changes in the percentage of agricultural land use across the study area, which were acquired by satellite image classification, increased over the study periods: <1% in 1997, 3.8% in 2007, and 6.3% in 2019 (Table 4, Figure 9). The increase in agricultural land use (inside yellow circle) has increased the degradation of groundwater quality, a trend attributed to increased use of chemical fertilizers. However, pollution and change in discharge may also be a result of land use changes associated with intensive agriculture. Throughout the analysis of land use changes as percentages across the study periods, especially focusing on agricultural practices, we also were aware of other anthropogenic activities (such as urban expansion) that may have increased the degradation of groundwater quality in the area.

5.4. Impacts of Climate Change on Groundwater in Wadi El-Assiuti

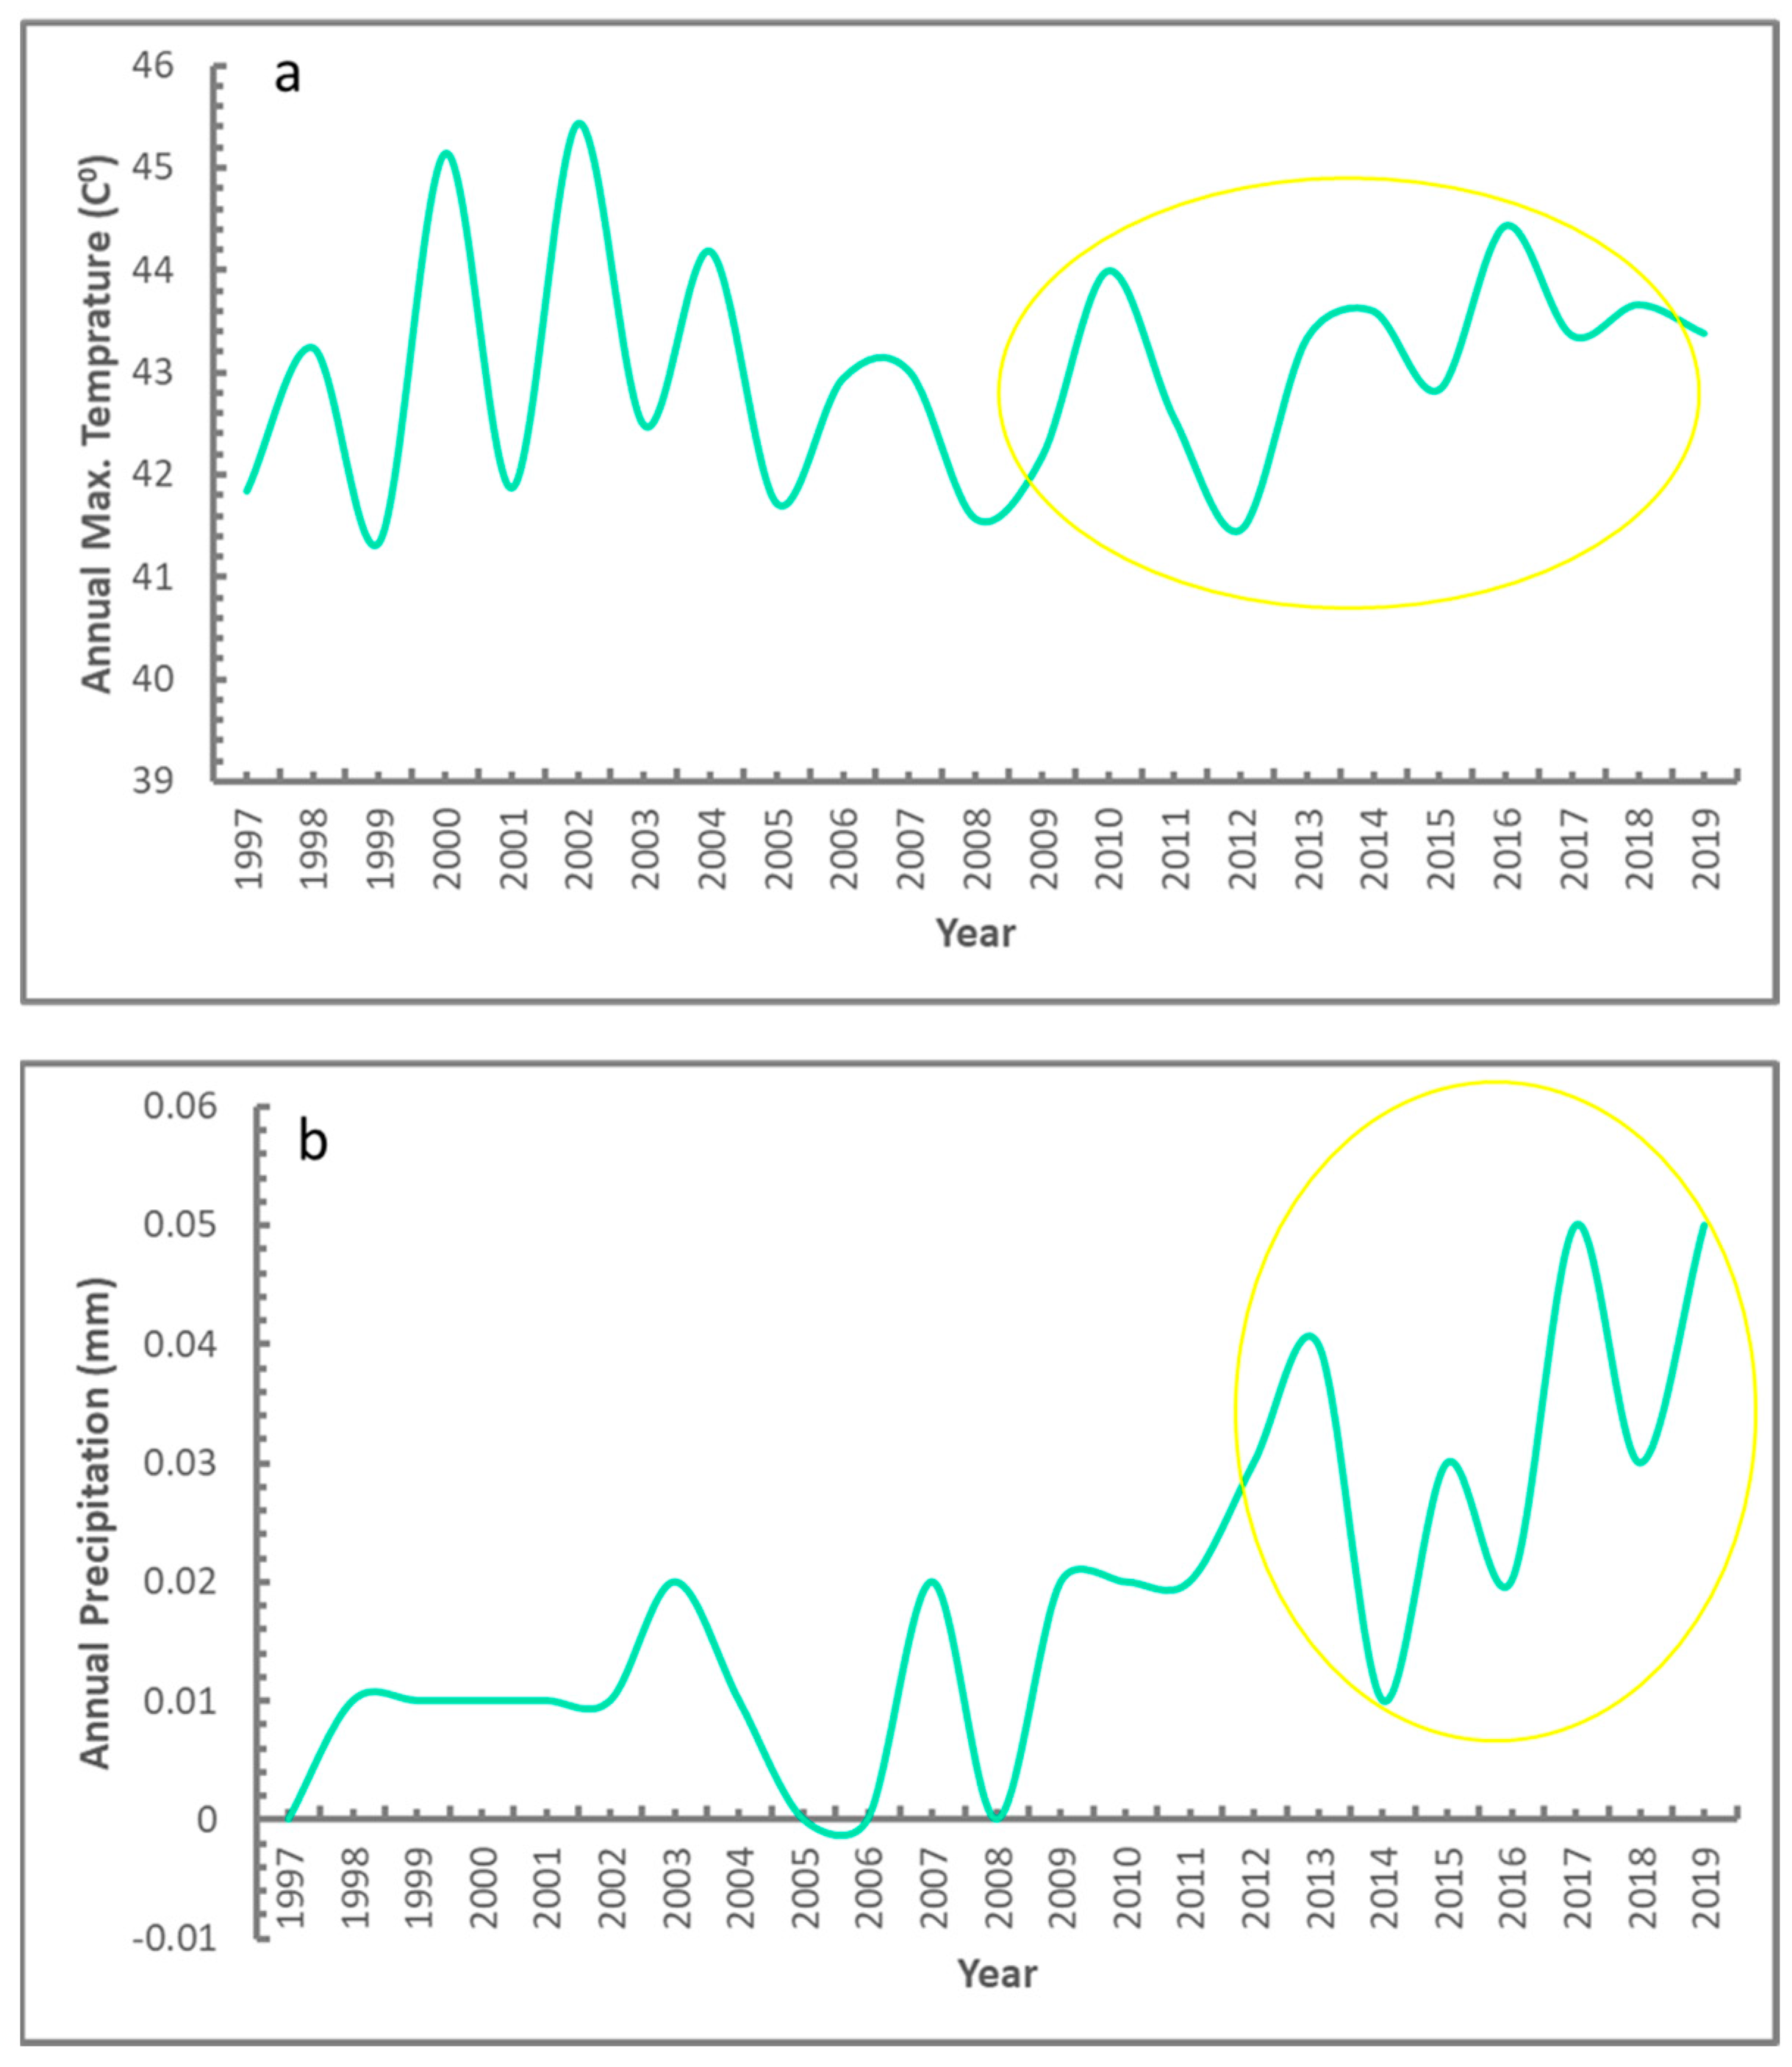
Owing to the lack of climate stations in the study area, details concerning climate conditions in Wadi El-Assiuti during 1997–2019 were obtained from the POWER project data-viewer website (https://power.larc.nasa.gov, accessed on 20 October 2022). The acquired information includes maximum atmospheric temperature and mean annual rainfall, from which we extracted annual climate indicators for the years 1997, 2007, and 2019 (Figure 10). Climate conditions for the area indicate an overall increase in both the atmospheric temperature and annual rainfall during the 23 years from 1997–2019. Near the beginning of the 21st century, especially during 2000 and 2003, the maximum atmospheric temperatures were higher than in later years. However, by comparing the annual maximum temperatures during the years 1997, 2007, and 2019, it is apparent that the top temperatures for the area were 41.84 °C, 43.01 °C, and 43.38 °C, respectively; for each of those years, the maximum atmospheric temperature was recorded in June. Higher temperatures lead to greater evaporation, which impacts the groundwater systems at least within a 10 m depth of the water table. However, the precipitation trend during the study period showed slight changes and increases in the precipitation rates. The increasing annual precipitation associated with increasing frequency of some extreme precipitation events has been causing flash floods. Increasing precipitation in the area could have led to increased aquifer recharge through surface runoff. These climatic conditions, linked with the geologic context, may have led to less residence time of water in the aquifer, thereby allowing greater water movement and water quality degradation, together with greater water–rock interaction. During the year 1997, the climatic condition and water quality parameters exhibited much lower values than in the years 2007 and 2019. However, the year 2019 showed significantly increased climate data parameters along with water quality degradation.
Land use and climate changes have implications for the groundwater-quality degradation in the area. The increasing temperature during 1997–2019 could have affected the hydrologic cycle through increasing evaporation from the shallow aquifers. In particular, given the increase in extreme and irregular climatic events, rainfall (yellow circle) and temperature have an even greater impact on water quality. The annual maximum atmospheric temperature was found to have risen +1.54 °C during 1997 and 2019. In all cases, the severe high temperatures of summer are linked to higher evapotranspiration. Comparison of precipitation during the study periods showed no major change in rainfall rate. The annual precipitation in 1997 was 0.03 mm, which declined to 0.004 mm, and in 2019 it began to increase again, reaching 0.03 mm. From the perspective of geology, including subsurface structural conditions, several investigators have emphasized groundwater-quality alterations induced by the seepage from different aquifers along the fault system.

5.5. Flooding and Drought

Flash floods in Egypt are commonly characterized as fast-flowing water combined with a short time available to respond, which increases risk to humans and property. Warner [65] concluded that flood severity and frequency in desert areas varies from year to year as much as the rainfall that causes the floods. However, rapid population growth has caused urbanization and land reclamation to spread quickly in the nearby desert along the Nile Valley. Therefore, water resources in the El-Assiuti Basin are generally limited owing to quality and quantity. In addition, socioeconomic parameters such as population and industry growth combined with recurrent drought and flood events cause periods of severe water insecurity. Thus, understanding groundwater quality responses to extreme flooding and drought in this area is critical for water resource management and sustainability. Eventually, extended drought can lead to unpredicted torrential rainstorms capable of developing severe floods [66]. Therefore, historical flash flood events were compiled for the study area (Table 5) [65,67,68].
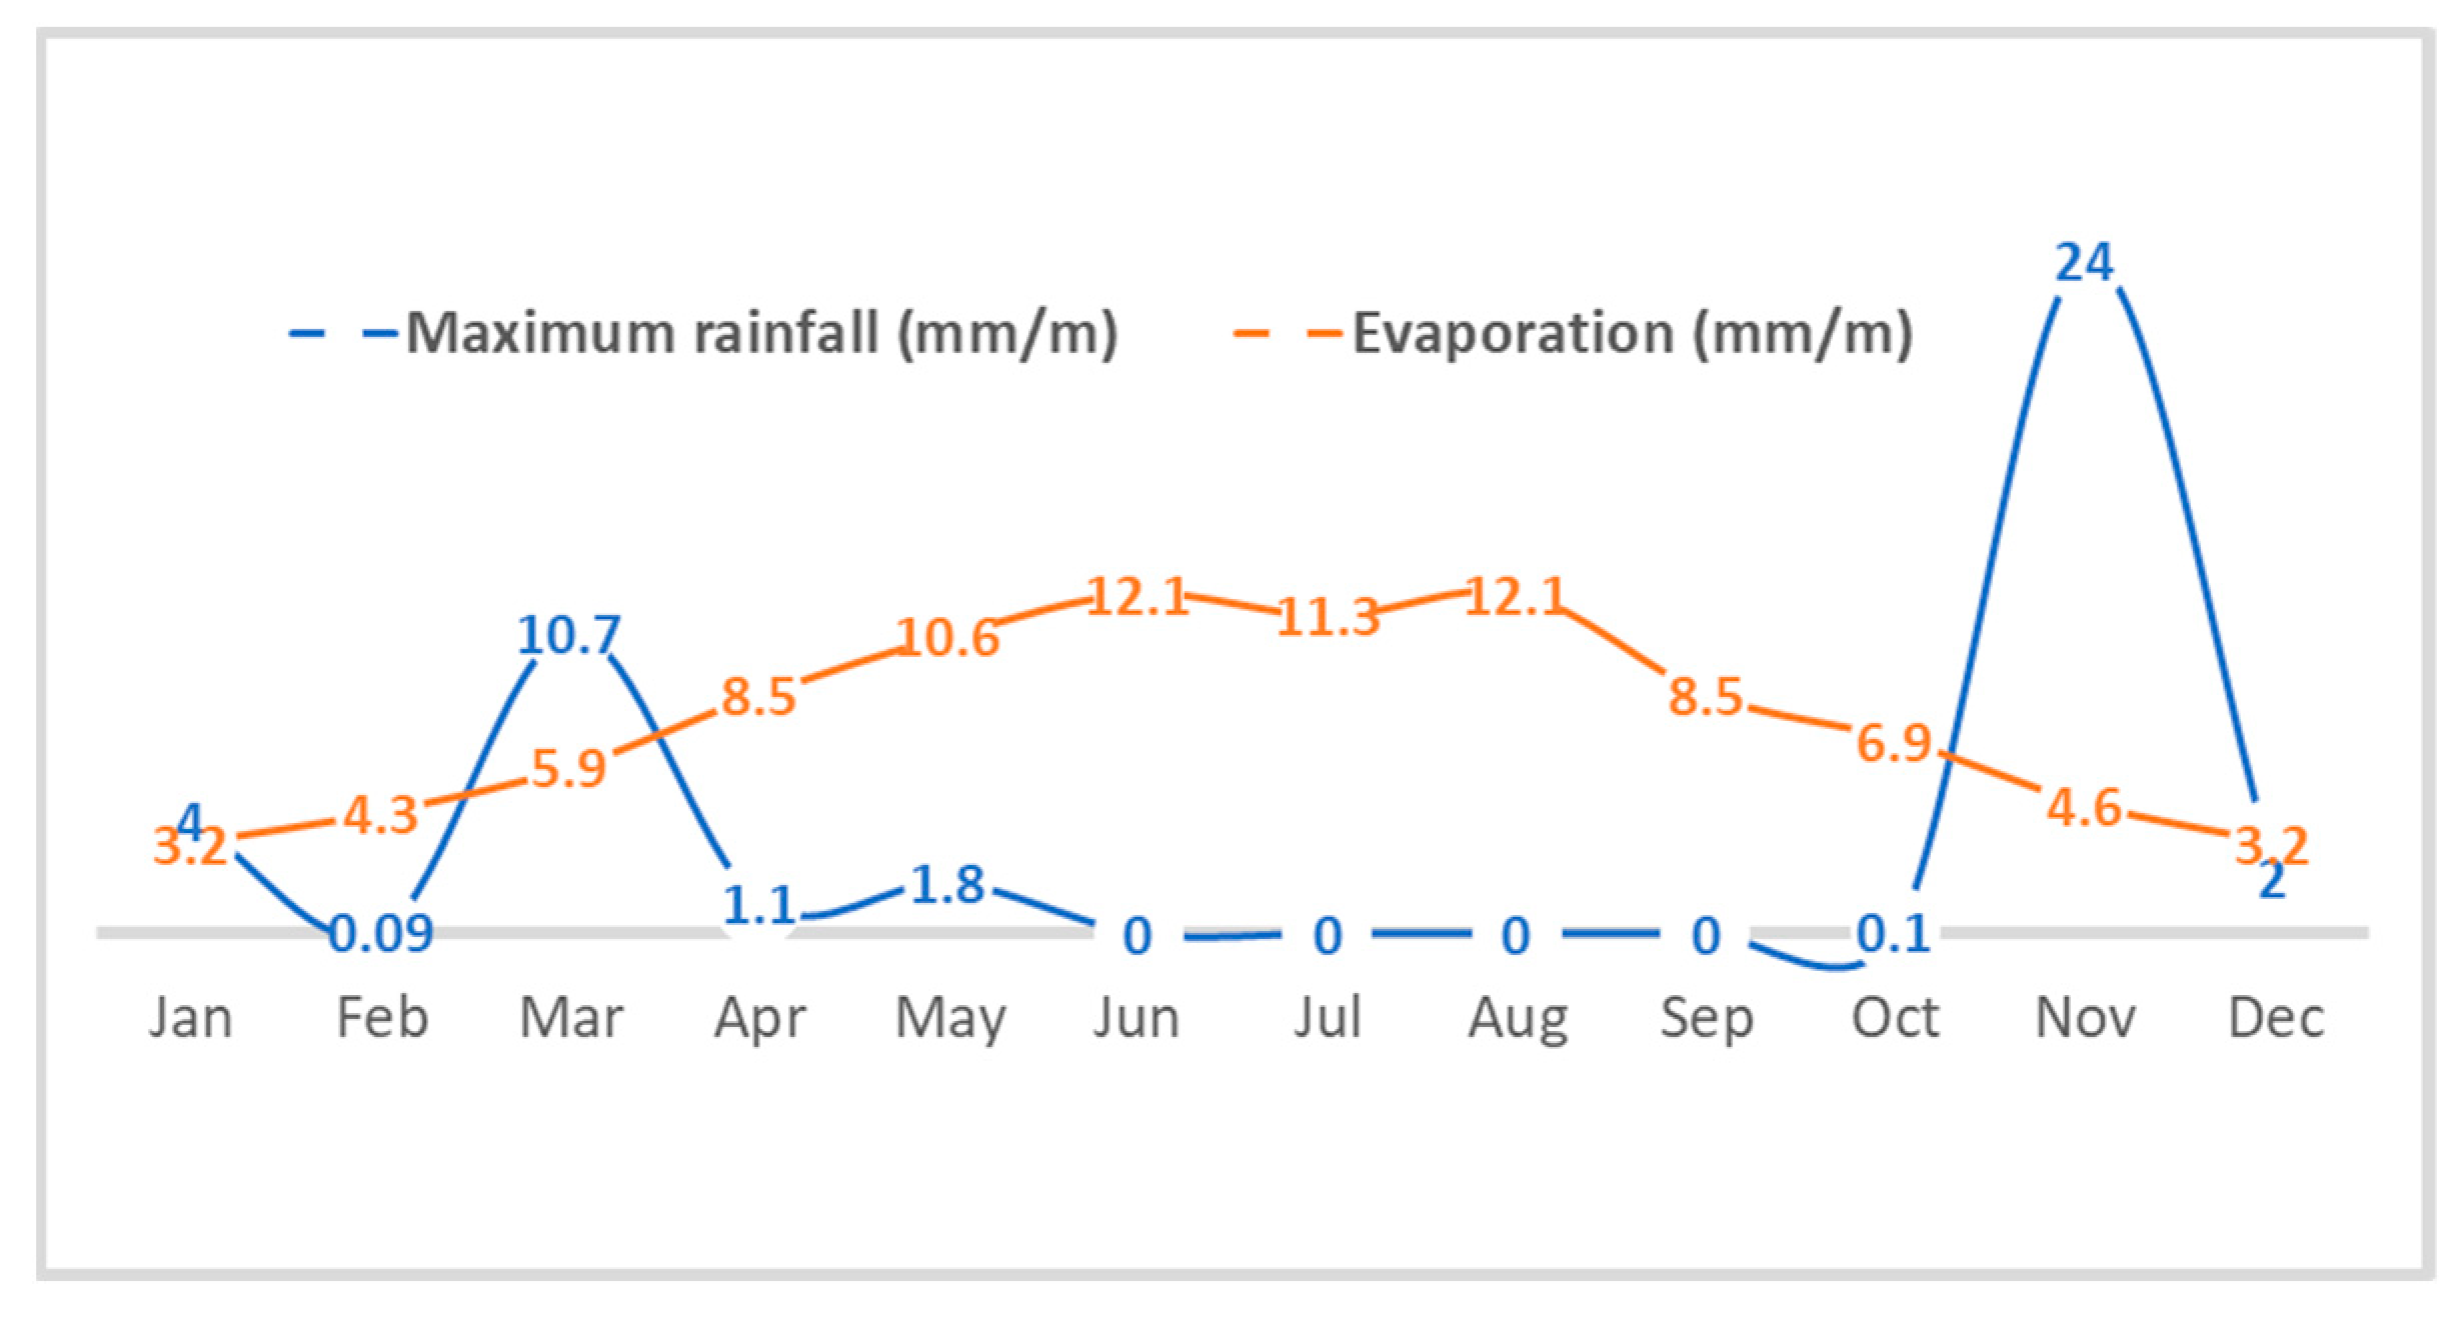
Average monthly rainfall and evaporation data for 1981–2010 [68] show that the maximum rainfall was in March and maximum evaporation was in November (Figure 11). From studying the eastern part of the watershed, Yousef [56] found that groundwater recharge from surface runoff and irrigation systems was indicated by increased delta values in the isotopic data, and also concluded that the rate of recharge to the Quaternary aquifer as surface runoff from the eastern watershed area was 16.16% and from the irrigation system was 6.71%. However, according to Sultan et al. [69], the contribution of surface runoff due to flooding increased groundwater recharge to 25% (1.08 × 10⁷ m3/yr).
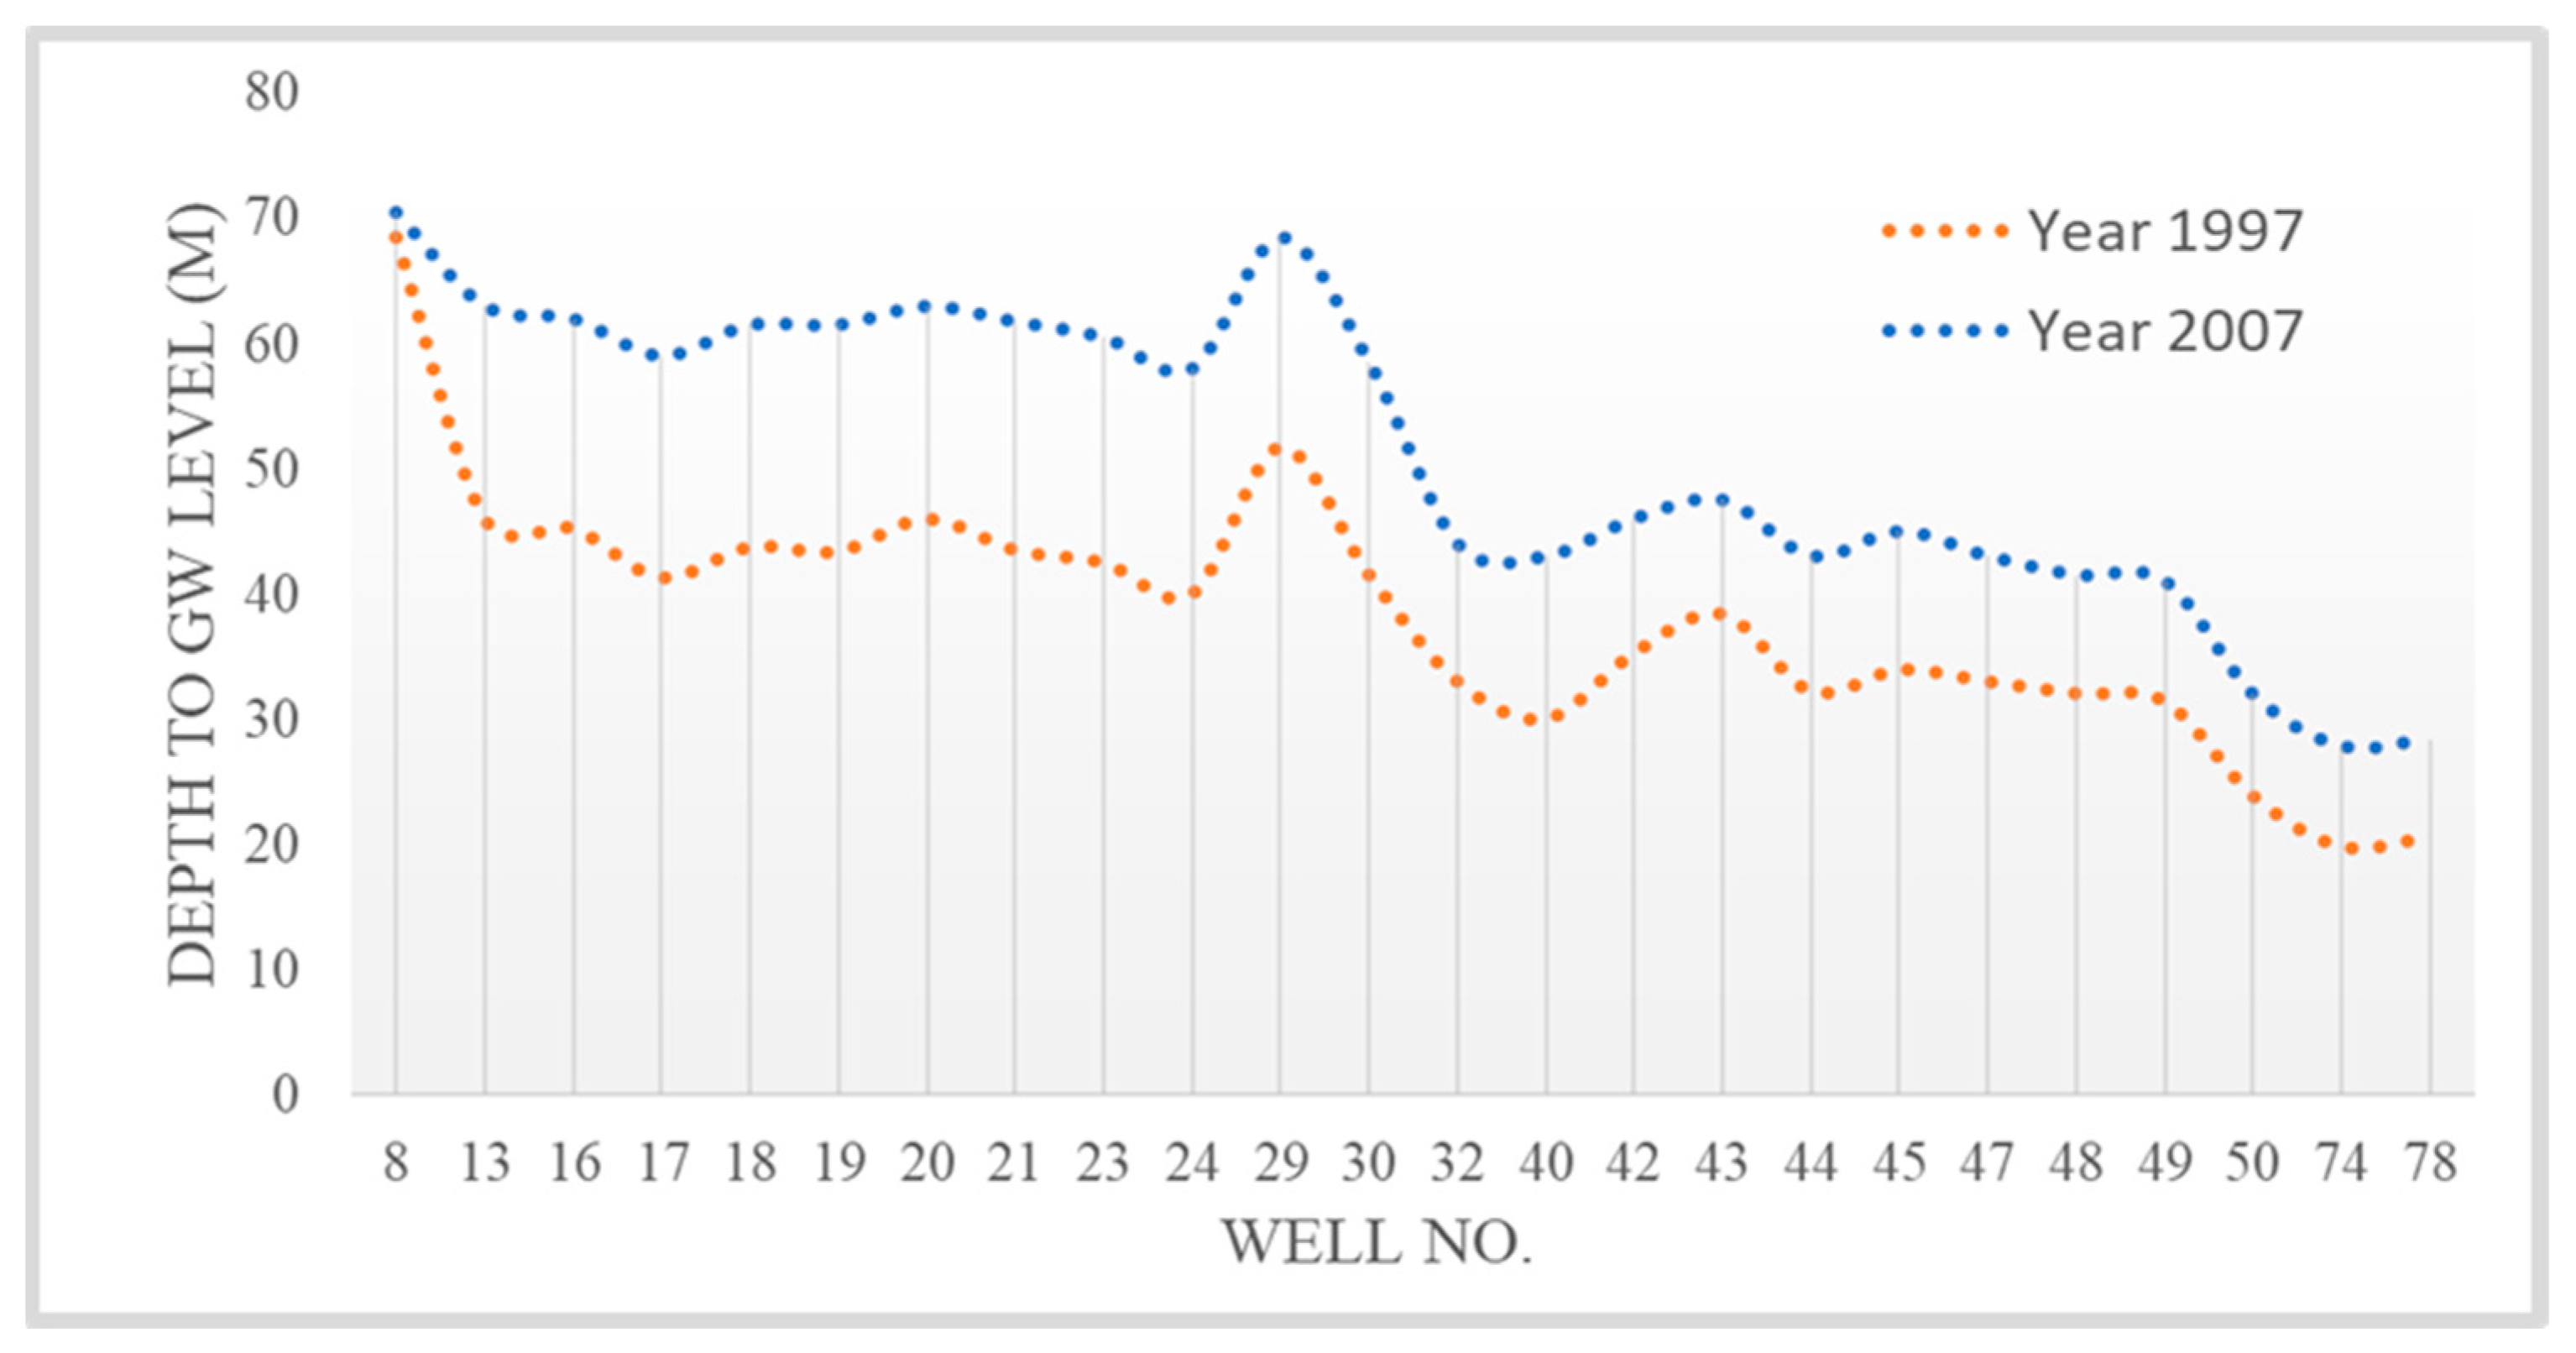
Aggressive change in groundwater level in Wadi El-Assiuti was found to be due to excessive pumping of groundwater for agricultural and domestic uses. Such increases in groundwater depth cause salinity problems and possibly technical problems for well design, which leads to groundwater deterioration. The change in groundwater depths during 1997–2007 ranged from 2–20 m (Figure 12), with a mean increase in depth of ~13.3 m [11].

5.6. Role of Fault System in Groundwater Recharge

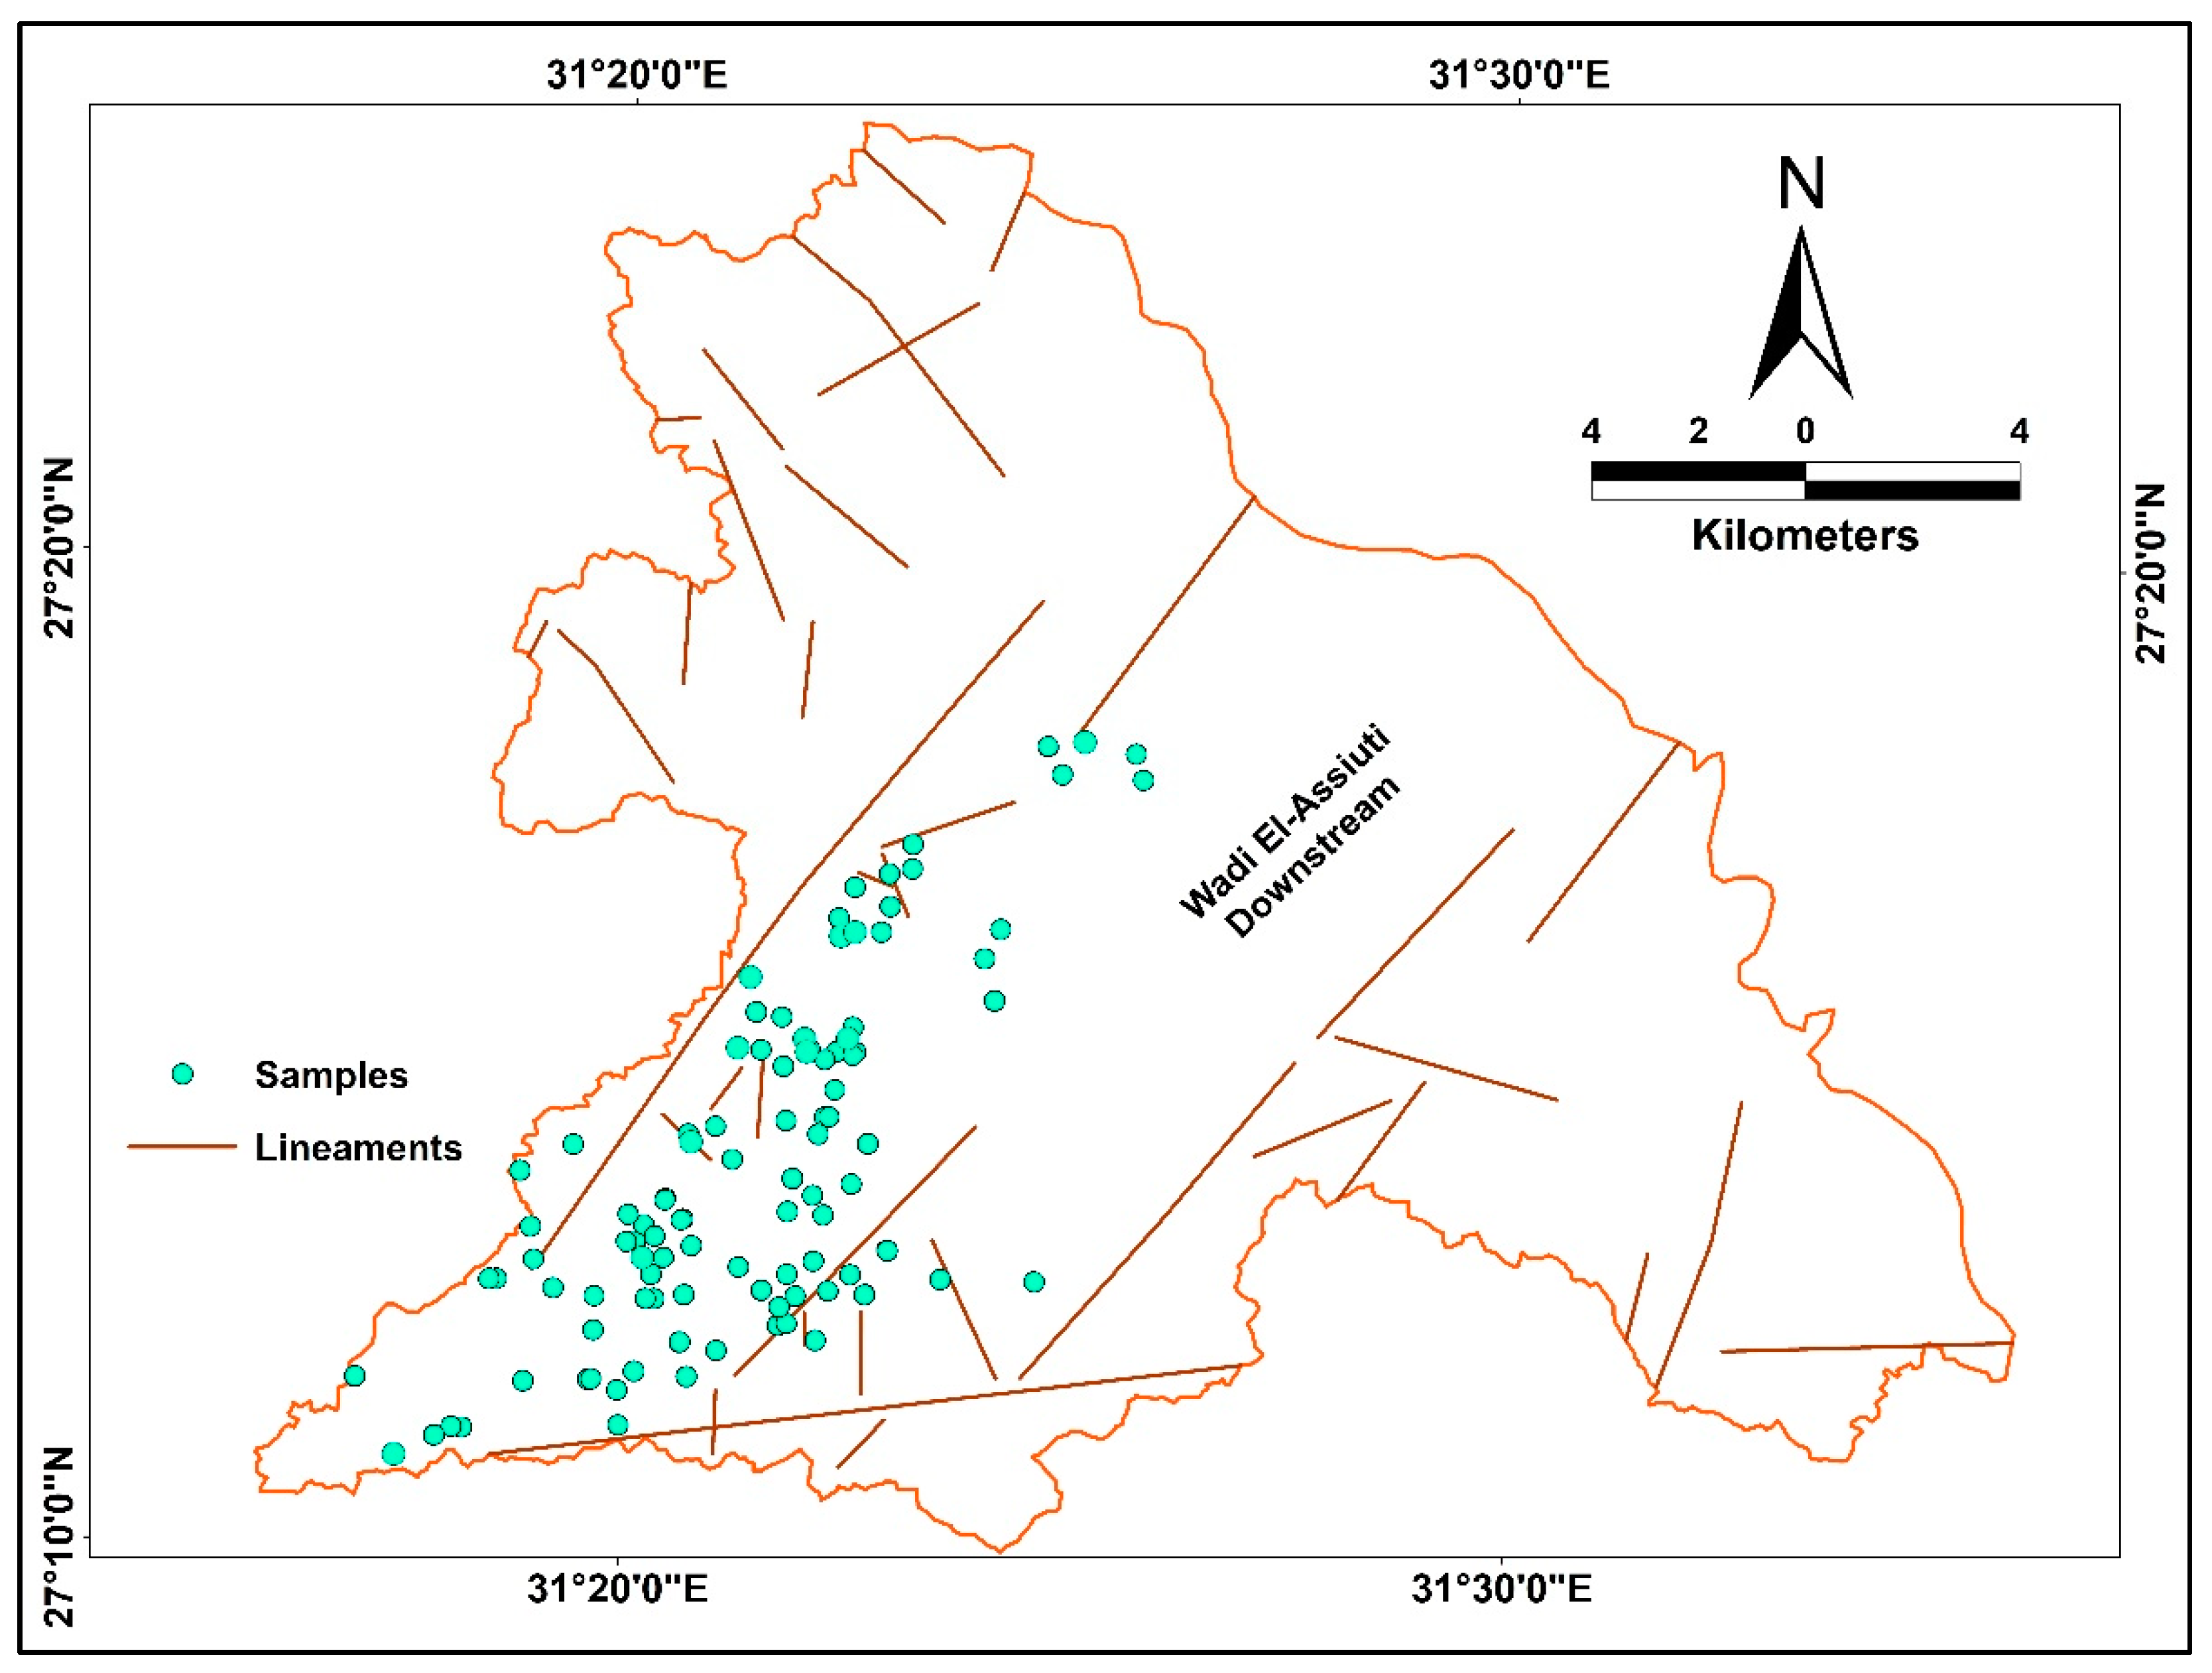
Based on hydrogeologic cross-sections, field observations, and measurements as well as other researchers’ published studies, investigation of groundwater in Wadi El-Assiuti was performed to determine the role of the fault system in alluvial groundwater recharge. This showed that drilling reached the Quaternary at ~280 m depth and the lower Eocene at ~600 m depth [56,70]. Therefore, the main Nile Valley fault systems (Clysmic, trending northwest; Tethyan, trending northeast; and a north–south system) are mainly in basement rock, and the major surface features reflect basement lines [69,71]. As a result of the northwest-trending fault system in the El-Assiuti Basin, most of the rock units are situated westward from the oldest to the youngest; Eocene rocks in the eastern region are followed westward by early Pleistocene, late Pleistocene, and Holocene sedimentary rock units and unconsolidated sediments.
It is observed that the low salinity of groundwater along the fault plains could be mainly due to recharge from the deep fault system. Farrag [11] indicated that the northeastern region of Wadi El-Assiuti is characterized by high chloride concentrations, which are mainly diffused from fluviomarine or marine sediments. Furthermore, the southwestern section, which is adjacent to the floodplain, has low chloride concentrations due to the possibility of groundwater recharge from the Nile Valley, which contains meteoric water.
The recharge from the Nubian Sandstone Aquifer to the upper aquifers in the western and eastern sides of the Nile valley was inferred by isotopic analysis of groundwater samples [72,73]. The rate of recharge to the groundwater in the Quaternary aquifer system from the Nubian Sandstone Aquifer through active northwest-trending faults is 75–77.13%, whereas from the El-Assiuti eastern watershed area it is 16.16%, and the irrigation system contribution is 6.71% [56,69]. According to Yan et al. [71], the vertical leakage of water upward to the alluvial aquifer system from the Nubian Sandstone Aquifer in the area is estimated to reach 25.7 × 10⁶ m3/yr. The vicinity of the Nile River is a highly productive area for groundwater, and good groundwater quality can be attained. The area has thick water-bearing deposits, with a high rate of recharge from the river and the deep Nubian Sandstone Aquifer via the fault system (Figure 13).

6. Conclusions

Groundwater information, land use data, and a climatic condition dataset were collected from different sources in the present work. Seven quarter quality indices were calculated with two climatic indicators (maximum air temperature and precipitation). Based on three years of land use remote sensing data and climate condition information, the impacts on groundwater quality were assessed. The results show marked differences in groundwater quality indices over the time span (1997–2019). A significant increase was observed in these indices from 1997 to 2019. The distribution maps show that most of the groundwater quality indices during 2019 were very high in the area.
Implications of our findings include that the depth to groundwater level decreases from the basin upstream toward downstream. Partial recharge from runoff with a contribution from the Nubian Sandstone Aquifer to the alluvial groundwater aquifer were existent in Wadi El-Assiuti. Therefore, deep-seated structures, flooding, and land use developments are the major players in groundwater quality. Land use changes revealed an increase in the agricultural area between 1997 to 2019. The nitrogen-based chemical fertilizers and flood irrigation used in agriculture can contribute to change and degradation of the groundwater quality in the area. Therefore, groundwater quality changes may be due to intensive agricultural activities, changes in climatic conditions, or other anthropogenic activities in the region. Anthropogenic activities, land use and climate changes, hydrodynamic movement, and geochemical rock–water interactions are the main controlling factors of groundwater quality. Overall, our study provides reliable information supporting the impact of climate and land use changes on other controlling factors as a driving factor for water quality degradation. Overall, the approaches proposed by the current study were successful in the assessment of the groundwater quality in the Wadi El-Assiuti basin; it is one of the promising areas of the Nile Basin for sustainable development and these approaches could also be implemented elsewhere as a robust and reliable methodology in similar settings in the Nile River basin areas and worldwide. It has also been suggested that a conjugate of hydrochemical analysis, climatic change, fault systems, and land use integrated with GIS techniques are the most appropriate methods to determine groundwater quality.

Author Contributions

Conceptualization, S.A.A.E.-M., A.M.M. and Q.B.P.; methodology, S.A.A.E.-M., A.M.M., H.A. and Q.B.P.; software, A.M.M. and S.A.A.E.-M.; validation, S.A.A.E.-M., A.M.M., H.A. and Q.B.P.; formal analysis, S.A.A.E.-M., A.M.M., H.A., N.T.T.L., D.T.A. and Q.B.P.; investigation, S.A.A.E.-M., A.M.M., H.A. and Q.B.P.; resources, S.A.A.E.-M., A.M.M., H.A. and Q.B.P.; data curation, S.A.A.E.-M., A.M.M., N.T.T.L. and D.T.A.; writing—original draft preparation, S.A.A.E.-M., A.M.M., H.A., N.T.T.L., D.T.A. and Q.B.P.; writing—review and editing, I.E., A.M.M., S.A.A.E.-M. and Q.B.P.; visualization, I.E., S.A.A.E.-M. and A.M.M. supervision, S.A.A.E.-M. and Q.B.P. All authors have read and agreed to the published version of the manuscript.

Funding

The authors are thankful to the Deanship of Scientific Research at Najran University for funding this work under the Research Collaboration Funding program grant code (NU/RC/SERC/11/3). Also, the authors are thankful to Academy of Scientific Research and Technology (ASRT), Cairo, Egypt as a part of funding this work under the Research Collaboration Funding program at Suez University Center for Scientific Research (SUCSR), grant (9256).

Institutional Review Board Statement

Not applicable.

Informed Consent Statement

Not applicable.

Data Availability Statement

The data that support the findings of this study are available from the author, (Quoc Bao Pham, [email protected]) upon reasonable request.

Acknowledgments

The authors are thankful to the Deanship of Scientific Research at Najran University for funding this work under the Research Collaboration Funding program grant code (NU/RC/SERC/11/3). The authors are thankful to Academy of Scientific Research and Technology (ASRT), Cairo, Egypt as a part of funding this work under the Research Collaboration Funding program at Suez University Center for Scientific Research (SUCSR), grant (9256). Anonymous reviewers are acknowledged for helpful comments on the manuscript.

Conflicts of Interest

This research received no external funding. This manuscript has not been published or presented elsewhere in part or entirety and is not under consideration by another journal.

References

  1. Hu, Z.; Wang, L.; Wang, Z.; Hong, Y.; Zheng, H. Quantitative assessment of climate and human impacts on surface water resources in a typical semi-arid watershed in the middle reaches of the yellow river from 1985 to 2006. Int. J. Climatol. 2015, 35, 97–113. [Google Scholar] [CrossRef]
  2. Sang, Y.F.; Wang, Z.; Liu, C.; Yu, J. The impact of changing environments on the runoff regimes of the arid Heihe River basin, China. Theor. Appl. Climatol. 2014, 115, 187–195. [Google Scholar] [CrossRef]
  3. He, Z.; Wang, Z.; Suen, C.J.; Ma, X. Hydrologic sensitivity of the upper san joaquin river watershed in California to climate change scenarios. Hydrol. Res. 2013, 44, 723–736. [Google Scholar] [CrossRef] [Green Version]
  4. Rehana, S.; Mujumdar, P.P. River water quality response under hypothetical climate change scenarios in Tunga-Bhadra river, India. Hydrol. Process. 2011, 25, 3373–3386. [Google Scholar] [CrossRef] [Green Version]
  5. Chenini, I.; Khemiri, S. Evaluation of ground water quality using multiple linear regression and structural equation modeling. Int. J. Environ. Sci. Technol. 2009, 6, 509–519. [Google Scholar] [CrossRef] [Green Version]
  6. Joarder, M.A.M.; Raihan, F.; Alam, J.B.; Hasanuzzaman, S. Regression analysis of ground water quality data of Sunamganj District, Bangladesh. Int. J. Environ. Res. 2008, 2, 291–296. [Google Scholar]
  7. Masoud, A.M.; Ali, M.H. Coupled multivariate statistical analysis and WQI approaches for groundwater quality assessment in Wadi El-Assiuty downstream area, Eastern Desert, Egypt. J. Afr. Earth Sci. 2020, 172, 103982. [Google Scholar] [CrossRef]
  8. Farrag, A.A.; Ebraheem, M.O.; Sawires, R.; Ibrahim, H.A.; Khalil, A.L. Petrophysical and aquifer parameters estimation using geophysical well logging and hydrogeological data, Wadi El-Assiuoti, Eastern Desert, Egypt. J. Afr. Earth Sci. 2019, 149, 42–54. [Google Scholar] [CrossRef]
  9. Abotalib, A.Z.; Heggy, E. Groundwater Mounding in Fractured Fossil Aquifers in the Saharan-Arabian Desert. In Advances in Science, Technology and Innovation; Springer: Cham, Switzerland, 2019; pp. 359–362. [Google Scholar] [CrossRef]
  10. Hussien, H.M.; Kehew, A.E.; Aggour, T.; Korany, E.; Abotalib, A.Z.; Hassanein, A.; Morsy, S. An integrated approach for identification of potential aquifer zones in structurally controlled terrain: Wadi Qena basin, Egypt. Catena 2017, 149, 73–85. [Google Scholar] [CrossRef]
  11. Farrag, A.A. On the Groundwater Assessment and Management in Wadi El Assiuti, Eastern Desert, Egypt. In Proceedings of the Fifth International Conference on the Geology of Africa, Assiut, Egypt, 23–24 October 2007; pp. 15–48. [Google Scholar]
  12. Abu El-Ella, E. Hydrogeochemical evolution of groundwater aquifers in the area east of Assiut Nile Basin, Egypt. Bull. Fac. Sci. Assiut Univ. 1999, 28, 1–16. [Google Scholar]
  13. Venegas-Quiñones, H.L.; Thomasson, M.; Garcia-Chevesich, P.A. Water scarcity or drought? The cause and solution for the lack of water in Laguna de Aculeo. Water Conserv. Manag. 2020, 4, 42–50. [Google Scholar] [CrossRef]
  14. Wang, R.; Kalin, L.; Kuang, W.; Tian, H. Individual and combined effects of land use/cover and climate change on Wolf Bay watershed streamflow in southern Alabama. Hydrol. Process. 2014, 28, 5530–5546. [Google Scholar] [CrossRef]
  15. Niraula, R.; Meixner, T.; Norman, L.M. Determining the importance of model calibration for forecasting absolute/relative changes in streamflow from LULC and climate changes. J. Hydrol. 2015, 522, 439–451. [Google Scholar] [CrossRef]
  16. Irawan, D.; Puradimaja, D. Geological Mapping and Groundwater Physical-Chemical Properties Characterization: An Approach to Spring Recharge Area Conservation. In Proceedings of the International Conference on Urban Hydrology for the 21st Century, Kuala Lumpur, Malaysia, 14–16 October 2002. [Google Scholar]
  17. Singh, S.K.; Singh, C.K.; Mukherjee, S. Impact of land-use and land-cover change on groundwater quality in the Lower Shiwalik hills: A remote sensing and GIS based approach. Cent. Eur. J. Geosci. 2010, 2, 124–131. [Google Scholar] [CrossRef]
  18. Singh, C.K.; Shashtri, S.; Mukherjee, S.; Kumari, R.; Avatar, R.; Singh, A.; Singh, R.P. Application of GWQI to Assess Effect of Land Use Change on Groundwater Quality in Lower Shiwaliks of Punjab: Remote Sensing and GIS Based Approach. Water Resour. Manag. 2011, 25, 1881–1898. [Google Scholar] [CrossRef]
  19. Fu, B.; Qiu, Y.; Wang, J.; Chen, L. Effect simulations of land use change on the runoff and erosion for a gully catchment of the Loess Plateau, China. Dili Xuebao Acta Geogr. Sin. 2002, 57, 717–722. [Google Scholar]
  20. Zhang, L.; Dawes, W.R.; Walker, G.R. Response of mean annual evapotranspiration to vegetation changes at catchment scale. Water Resour. Res. 2001, 37, 701–708. [Google Scholar] [CrossRef]
  21. Huang, M.; Zhang, L. Hydrological responses to conservation practices in a catchment of the Loess Plateau, China. Hydrol. Process. 2004, 18, 1885–1898. [Google Scholar] [CrossRef]
  22. Wang, G.; Yang, L.; Chen, L.; Kubota, J. Impacts of land use changes on groundwater resources in the Heihe River Basin. Dili Xuebao/Acta Geogr. Sin. 2005, 60, 456–466. [Google Scholar] [CrossRef]
  23. Flood Potential Analysis (FPAn) using Geo-Spatial Data in Penampang area, Sabah. Mal. J. Geo. 2017, 1, 1–6. [CrossRef]
  24. Dams, J.; Woldeamlak, S.T.; Batelaan, O. Predicting land-use change and its impact on the groundwater system of the Kleine Nete catchment, Belgium. Hydrol. Earth Syst. Sci. 2008, 12, 1369–1385. [Google Scholar] [CrossRef] [Green Version]
  25. Barringer, T.; Dunn, D.; Battaglin, W.; Vowinkel, E. Problems and Methods Involved in Relating Land Use To Ground-Water Quality. J. Am. Water Resour. Assoc. 1990, 26, 1–9. [Google Scholar] [CrossRef]
  26. Bhaduri, B.; Harbor, J.; Engel, B.; Grove, M. Assessing watershed-scale, long-term hydrologic impacts of land-use change using a GIS-NPS model. Environ. Manag. 2000, 26, 643–658. [Google Scholar] [CrossRef] [PubMed]
  27. Liu, Y.; Zhang, K.; Li, Z.; Liu, Z.; Wang, J.; Huang, P. A hybrid runoff generation modelling framework based on spatial combination of three runoff generation schemes for semi-humid and semi-arid watersheds. J. Hydrol. 2020, 590, 125440. [Google Scholar] [CrossRef]
  28. El-Rakaiby, M.L. Drainage basins and flash flood hazard in selected parts of Egypt. Egypt J. Geol. 1989, 33, 307–323. [Google Scholar]
  29. Gheith, H.; Sultan, M. Construction of a hydrologic model for estimating Wadi runoff and groundwater recharge in the Eastern Desert, Egypt. J. Hydrol. 2002, 263, 36–55. [Google Scholar] [CrossRef]
  30. Abu El-Magd, S.A.; Pradhan, B.; Alamri, A. Machine learning algorithm for flash flood prediction mapping in Wadi El-Laqeita and surroundings, Central Eastern Desert, Egypt. Arab. J. Geosci. 2021, 14, 323. [Google Scholar] [CrossRef]
  31. Abu El-Magd, S.A. Flash Flood Hazard Mapping Using GIS and Bivariate Statistical Method at Wadi Bada’a, Gulf of Suez, Egypt. J. Geosci. Environ. Prot. 2019, 7, 372–385. [Google Scholar] [CrossRef] [Green Version]
  32. El Bastawesy, M.; White, K.; Nasr, A. Integration of remote sensing and GIS for modelling fash foods in WadiHudain catchment. Egypt Hydrol. Process. 2009, 23, 1359–1368. [Google Scholar] [CrossRef]
  33. Abu El-Magd, S.A.; Orabi, H.O.; Ali, S.A.; Parvin, F.; Pham, Q.B. An integrated approach for evaluating the flash flood risk and potential erosion using the hydrologic indices and morpho-tectonic parameters. Environ. Earth Sci. 2021, 80, 694. [Google Scholar] [CrossRef]
  34. Abu El-Magd, S.A.; Maged, A.; Farhat, H.I. Hybrid-based Bayesian algorithm and hydrologic indices for flash flood vulnerability assessment in coastal regions: Machine learning, risk prediction, and environmental impact. Environ. Sci. Pollut. Res. 2022, 29, 57345–57356. [Google Scholar] [CrossRef] [PubMed]
  35. Abu El-Magd, S.A. Random forest and naïve Bayes approaches as tools for flash flood hazard susceptibility prediction, South Ras El-Zait, Gulf of Suez Coast, Egypt. Arab. J. Geosci. 2022, 15, 217. [Google Scholar] [CrossRef]
  36. Cools, J.; Vanderkimpen, P.; El Afandi, G.; Abdelkhalek, A.; Fockedey, S.; El Sammany, M.; Abdallah, G.; El Bihery, M.; Bauwens, W.; Huygens, M. An early warning system for flash floods in hyper-arid Egypt. Nat. Hazards Earth Syst. Sci. 2012, 12, 443–457. [Google Scholar] [CrossRef]
  37. Mahmoud, S.H. Delineation of potential sites for groundwater recharge using a GIS-based decision support system. Environ. Earth Sci. 2014, 72, 3429–3442. [Google Scholar] [CrossRef]
  38. Condon, L.E.; Kollet, S.; Bierkens, M.F.P.; Fogg, G.E.; Maxwell, R.M.; Hill, M.C.; Verhoef, A.; Van Loon, A.F.; Sulis, M.; Hendricks Fransen, H.J.; et al. Global groundwater modeling and monitoring: Opportunities and challenges. Water Resour. Res. 2021, 57, e2020WR029500. [Google Scholar] [CrossRef]
  39. Brunetti, G.F.A.; Fallico, C.; De Bartolo, S.; Severino, G. Well-Type Steady Flow in Strongly Heterogeneous Porous Media: An Experimental Study. Water Resour. Res. 2022, 58, e2021WR030717. [Google Scholar] [CrossRef]
  40. Lama, G.F.C.; Errico, A.; Francalanci, S.; Chirico, G.B.; Solari, L.; Preti, F. Hydraulic Modeling of Field Experiments in a Drainage Channel Under Different Riparian Vegetation Scenarios. Lect. Notes Civ. Eng. 2020, 67, 69–77. [Google Scholar] [CrossRef]
  41. Lama, G.F.C.; Giovannini, M.R.M.; Errico, A.; Mirzaei, S.; Padulano, R.; Chirico, G.B.; Preti, F. Hydraulic efficiency of green-blue flood control scenarios for vegetated rivers: 1D and 2D unsteady simulations. Water 2021, 13, 2620. [Google Scholar] [CrossRef]
  42. Reed, B.; Giri, C.; Zhu, Z. A comparative analysis of the Global Land Cover 2000 and MODIS land cover data sets. Remote Sens. Environ. 2005, 94, 123–132. [Google Scholar]
  43. Gautam, A.P.; Webb, E.L.; Shivakoti, G.P.; Zoebisch, M.A. Land use dynamics and landscape change pattern in a mountain watershed in Nepal. Agric. Ecosyst. Environ. 2003, 99, 83–96. [Google Scholar] [CrossRef]
  44. Lama, G.F.C.; Sadeghifar, T.; Azad, M.T.; Sihag, P.; Kisi, O. On the Indirect Estimation of Wind Wave Heights over the Southern Coasts of Caspian Sea: A Comparative Analysis. Water 2022, 14, 843. [Google Scholar] [CrossRef]
  45. Box, W.; Järvelä, J.; Västilä, K. Flow resistance of floodplain vegetation mixtures for modelling river flows. J. Hydrol. 2021, 601, 126593. [Google Scholar] [CrossRef]
  46. Lama, G.F.C.; Errico, A.; Pasquino, V.; Mirzaei, S.; Preti, F.; Chirico, G.B. Velocity uncertainty quantification based on Riparian vegetation indices in open channels colonized by Phragmites australis. J. Ecohydraulics 2022, 7, 71–76. [Google Scholar] [CrossRef]
  47. Sadeghfam, S.; Bagheri, A.; Razzagh, S.; Nadiri, A.A.; Vadiati, M.; Senapathi, V.; Sekar, S. Hydrochemical Analysis of Seawater Intrusion by Graphical Techniques in Coastal Aquifers to Delineate Vulnerable Areas. In Groundwater Contamination in Coastal Aquifers: Assessment and Management; Elsevier: Amsterdam, The Netherlands, 2022; pp. 91–104. [Google Scholar] [CrossRef]
  48. Rahbar, A.; Vadiati, M.; Talkhabi, M.; Nadiri, A.A.; Nakhaei, M.; Rahimian, M. A hydrogeochemical analysis of groundwater using hierarchical clustering analysis and fuzzy C-mean clustering methods in Arak plain, Iran. Environ. Earth Sci. 2020, 79, 342. [Google Scholar] [CrossRef]
  49. Elewa, H.H. Prediction of future drawdown of water levels of the Pleistocene aquifer system of Wadi El-Assiuti Area, Eastern Desert, Egypt, as a criterion for management and conservation. Resour. Conserv. Recycl. 2008, 52, 1006–1014. [Google Scholar] [CrossRef]
  50. Ashmawy, M.H.; Nassim, A.S. Nassim Hydrological Impacts and Assessment of Morphometric Aspects of Wadi El Assiuti Basin, Eastern Desert, Egypt. Egypt J. Remote Sens. Sp. Sci. 1998, 4, 207–232. [Google Scholar]
  51. Salama, F.M.; Sayed, S.A.E.-M.; Abd El-Galil, A.A.E.M. Plant Communities and Floristic Composition of the Vegetation of Wadi Al-Assiuty and Wadi Habib in the Eastern Desert, Egypt. Not. Sci. Biol. 2014, 6, 196–206. [Google Scholar] [CrossRef] [Green Version]
  52. Mansour, H.H.; Philobbos, E.R. Lithostratigraphic classification of the surface Eocene carbonates of the Nile Valley, Egypt: A review. Bull. Fac. Sci. Assiut Uni 1983, 12, 129–151. [Google Scholar]
  53. Said, R. The Geologic Evolution of the River Nile; Springer: New York, NY, USA, 1997; Volume 8, ISBN 9780511984075. [Google Scholar]
  54. Said, R. The Geology of Egypt, 2nd ed.; Balkema Publisher: Rotterdam, The Netherlands, 1990. [Google Scholar]
  55. Egyptian General Authority for Petroleum. Conoco Geologic Map of Egypt (Scale 1:500,000); Egyptian General Authority for Petroleum: Cairo, Egypt, 1987. [Google Scholar]
  56. Yousef, A.F. The impact of North West active fault system on the recharge of the quaternary aquifer system around the Nile valley: Case study Wadi El-Assuity, Eastern Desert, Egypt. Eur. Water 2008, 21, 41–55. [Google Scholar]
  57. Farrag, A.A.; Riad, S.; Ahmed, M.H. Groundwater situation and evaluation in the Nile Basin East of Assiut. Egypt. J. Eng. Sci. Ass. Univ. 2002, 30, 517–542. [Google Scholar]
  58. Farrag, F.A.; Farrag, A.A. Complementary Groundwater and Soil Studies on Wadi EL-Assiuti by the help of Satellite Images and GIS Techniques. Bull. Fac. Sci., Assiut Univ. 1997, 26, 45–64. [Google Scholar]
  59. RIGW (Research Institute for Groundwater, Ministry of Water Resources and Irrigation). Review of the Groundwater Studies in the Eastern Desert; Technical Report, Task 12 b; RIGW: Cairo, Egypt, 2003. [Google Scholar]
  60. Megahed, H.A. GIS-based assessment of groundwater quality and suitability for drinking and irrigation purposes in the outlet and central parts of Wadi El-Assiuti, Assiut Governorate, Egypt. Bull. Natl. Res. Cent. 2020, 44, 187. [Google Scholar] [CrossRef]
  61. Balakrishnan, P.; Saleem, A.; Mallikarjun, N.D. Groundwater quality mapping using geographic information system (GIS): A case study of Gulbarga City, Karnataka, India. Afr. J. Environ. Sci. Technol. 2011, 5, 1069–1084. [Google Scholar] [CrossRef]
  62. Deshmukh, K.K. Assessment of ground water quality in Sangamner area for sustainable agricultural water use planning. Int. J. Chem. Sci. 2011, 9, 1486–1500. [Google Scholar]
  63. Joshi, V.U. Land Use Change Detection Along the Pravara River Basin in Maharashtra, Using Remote Sensing and Gis. Imagine 2009, 3, 71–86. [Google Scholar]
  64. Tang, Z.; Engel, B.A.; Pijanowski, B.C.; Lim, K.J. Forecasting land use change and its environmental impact at a watershed scale. J. Environ. Manag. 2005, 76, 35–45. [Google Scholar] [CrossRef] [PubMed]
  65. Warner, T.T. Desert Meteorology; Cambridge University Press: Edinburgh, UK, 2004. [Google Scholar]
  66. El Bastawesy, M.; Abu El Ella, E.M. Quantitative estimates of flash flood discharge into waste water disposal sites in Wadi Al Saaf, the Eastern Desert of Egypt. J. Afr. Earth Sci. 2017, 136, 312–318. [Google Scholar] [CrossRef]
  67. Moawad, M.B.; Abdel Aziz, A.O.; Mamtimin, B. Flash floods in the Sahara: A case study for the 28 January 2013 flood in Qena, Egypt. Geomat. Nat. Hazards Risk 2016, 7, 215–236. [Google Scholar] [CrossRef] [Green Version]
  68. Saber, M.; Abdrabo, K.I.; Habiba, O.M.; Kantosh, S.A.; Sumi, T. Impacts of triple factors on flash flood vulnerability in Egypt: Urban growth, extreme climate, and mismanagement. Geosciences 2020, 10, 24. [Google Scholar] [CrossRef] [Green Version]
  69. Sultan, M.; Yan, E.; Sturchio, N.; Wagdy, A.; Abdel Gelil, K.; Becker, R.; Manocha, N.; Milewski, A. Natural discharge: A key to sustainable utilization of fossil groundwater. J. Hydrol. 2007, 335, 25–36. [Google Scholar] [CrossRef]
  70. Youssef, M.I. Structural pattern of Egypt and its interpretation. Bull. Amer. Pet. Geol. 1968, 52, 601–614. [Google Scholar] [CrossRef]
  71. Yan, E.; Wagdy, A.; Sultan, M.; Becker, R. Assessment of renewable groundwater resources in the Assiuty hydrologic system of the Eastern Desert, Egypt. In Proceedings of the Second Regional Conference on Arab Water 2004, Action Plans for Integrated Development, Cairo, Egypt, 13–15 April 2004; pp. 1–9. [Google Scholar]
  72. Masoud, A.M.; Abu El-Magd, S.A. Integration of hydrochemical and isotopic characteristics for identifying groundwater recharge sources of the Eocene carbonate aquifer, Western Desert, Egypt. J. African Earth Sci. 2022, 187, 104449. [Google Scholar] [CrossRef]
  73. Abdel Moneim, A.A.; Seleem, E.M.; Zeid, S.A.; Abdel Samie, S.G.; Zaki, S.; Abu El-Fotoh, A. Hydrogeochemical characteristics and age dating of groundwater in the Quaternary and Nubian aquifer systems in Wadi Qena, Eastern Desert, Egypt. Sustain. Water Resour. Manag. 2015, 1, 213–232. [Google Scholar] [CrossRef]
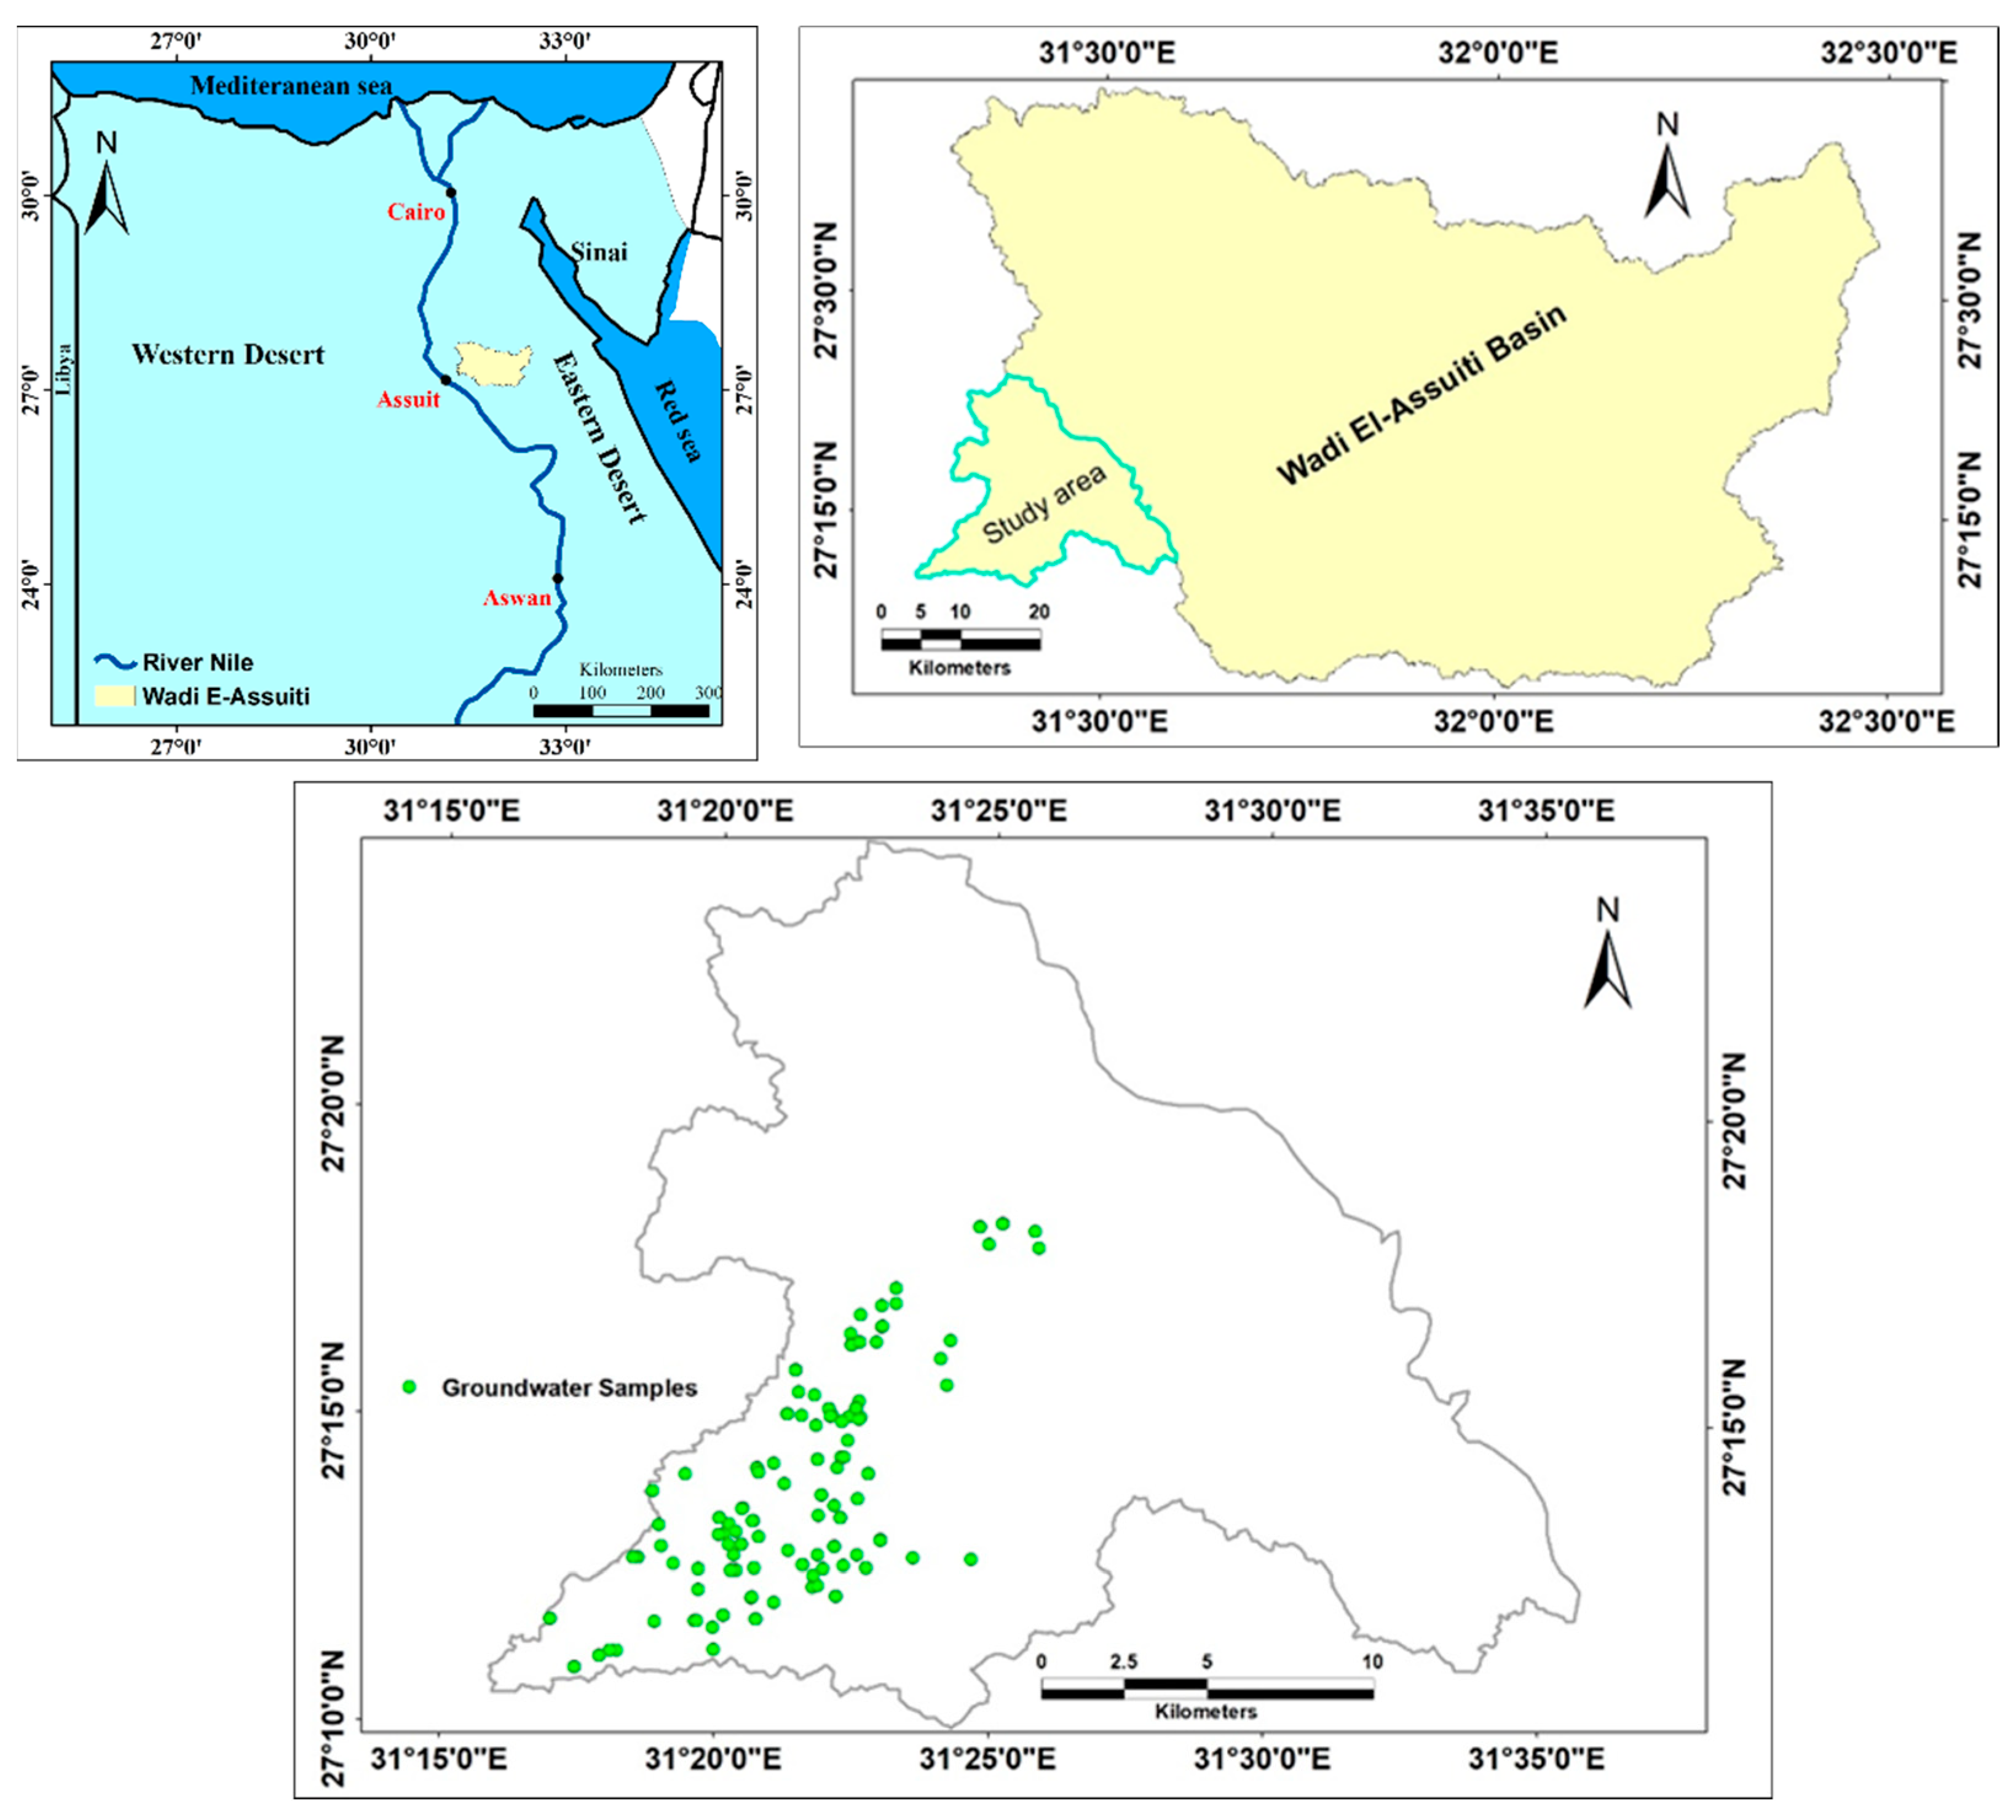
Figure 1. Location map of the study site.
Water 14 04073 g001
Figure 2. Geological map of the area [55].
Water 14 04073 g002
Figure 3. Hydrogeologic East–West cross-section at the basin downstream.
Water 14 04073 g003
Figure 4. Methodology flow chart for assessment of groundwater quality.
Water 14 04073 g004
Figure 5. Groundwater quality indices for 1997–2019 (SAR and RSBC).
Water 14 04073 g005
Figure 6. Groundwater quality indices for 1997–2019 (TDS and SSP).
Water 14 04073 g006
Figure 7. Groundwater quality indices for 1997–2019 (KR and MAR).
Water 14 04073 g007
Figure 8. Groundwater samples gathered through the study site during 1997, 2007, and 2019.
Water 14 04073 g008
Figure 9. Land use changes over the study years (1997, 2007, and 2019).
Water 14 04073 g009
Figure 10. Annual (a) maximum temperature and (b) precipitation from 1997–2019.
Water 14 04073 g010
Figure 11. Averages monthly rainfall and evaporation from 1981 to 2010 [65].
Water 14 04073 g011
Figure 12. Groundwater depth during 1977 and 2007 [11].
Water 14 04073 g012
Figure 13. Relation between groundwater and fault system.
Water 14 04073 g013
Table 1. Groundwater quality indices in the present work.
IndexMathematical FormulaNumber
SAR S A R = N a + C a 2 + + M g 2 + 2 1 / 2 (1)
RSBC R S B C = H C O 3 C a 2 + (2)
SSP S S P = N a + + K + × 100 C a 2 + + M g 2 + + N a + + K + (3)
KR K R = N a + C a 2 + + M g 2 + (4)
PI P I = N a + + H C O 3 C a 2 + + M g 2 + + N a + × 100 (5)
MAR M A R = M g 2 + × 100 C a 2 + + M g 2 + (6)
Table 2. Satellite image data used to detect land use changes in the study area.
SatelliteSensorDatumResolution (M)Acquisition DateSourcePath/Row
Landsat 4TMWGS8430 m17 November 1997USGS176/41
Landsat 7ETM+WGS8430 m12 October 2007
Landsat 8TMWGS8430 m10 August 2019
Table 3. Summary results of groundwater quality indices at 133-point locations.
Stats.Quality Indices
YearTDSSARRSBCSSPKRPIMAR
Range19971700.009.187.4422.412.7022.8438.30
20073892.0027.0419.8554.6613.5155.4750.71
20195272.4329.1430.2759.5014.57106.3758.10
Minimum19971080.006.15−9.3858.031.3660.166.90
2007672.001.83−17.9038.730.5845.5620.79
2019811.351.43−23.4534.230.3542.5117.71
Maximum19972780.0015.34−1.9480.444.0683.0045.20
20074564.0028.871.9593.3914.09101.0371.50
20196083.7830.576.8293.7314.92148.8875.81
Mean19971755.279.36−5.5468.262.3269.9033.49
20071720.6310.57−3.7870.403.0274.7440.30
20191726.1010.47−0.9073.993.6390.4442.21
Std. Deviation1997474.872.702.117.450.917.6911.24
2007769.395.613.7511.352.1313.029.70
2019948.386.024.9413.552.7028.7212.20
Table 4. Summary of land use changes in Wadi El-Assiuti.
YearAgricultureUrbanBarren SoilBarren Rock
19970.91%1.08%27.91%70.10%
20073.84%1.71%24.83%69.62%
20196.29%4.14%20.63%68.94%
Table 5. Historical flash flood events in the area.
Event Flash-Flood Affected ZonesResults
2015Wadi El-Assiuti and Wadi Qena Destroyed houses on east side of Nile Valley
1997Upper Egypt: Aswan, Sohag,
Asyut, Minia, and Qena
23 deaths, 260 houses destroyed, andthousands of hectares flooded
1975Wadi Taref, Wadi El-Assiuti, and Sohag Governorate180 houses destroyed and 1500 citizens displaced
Publisher’s Note: MDPI stays neutral with regard to jurisdictional claims in published maps and institutional affiliations.