
Advances in Characterizing Gas Hydrate Formation in Sediments with NMR Transverse Relaxation Time

Abstract
:1. Introduction
2. Basics of NMR T2 Method
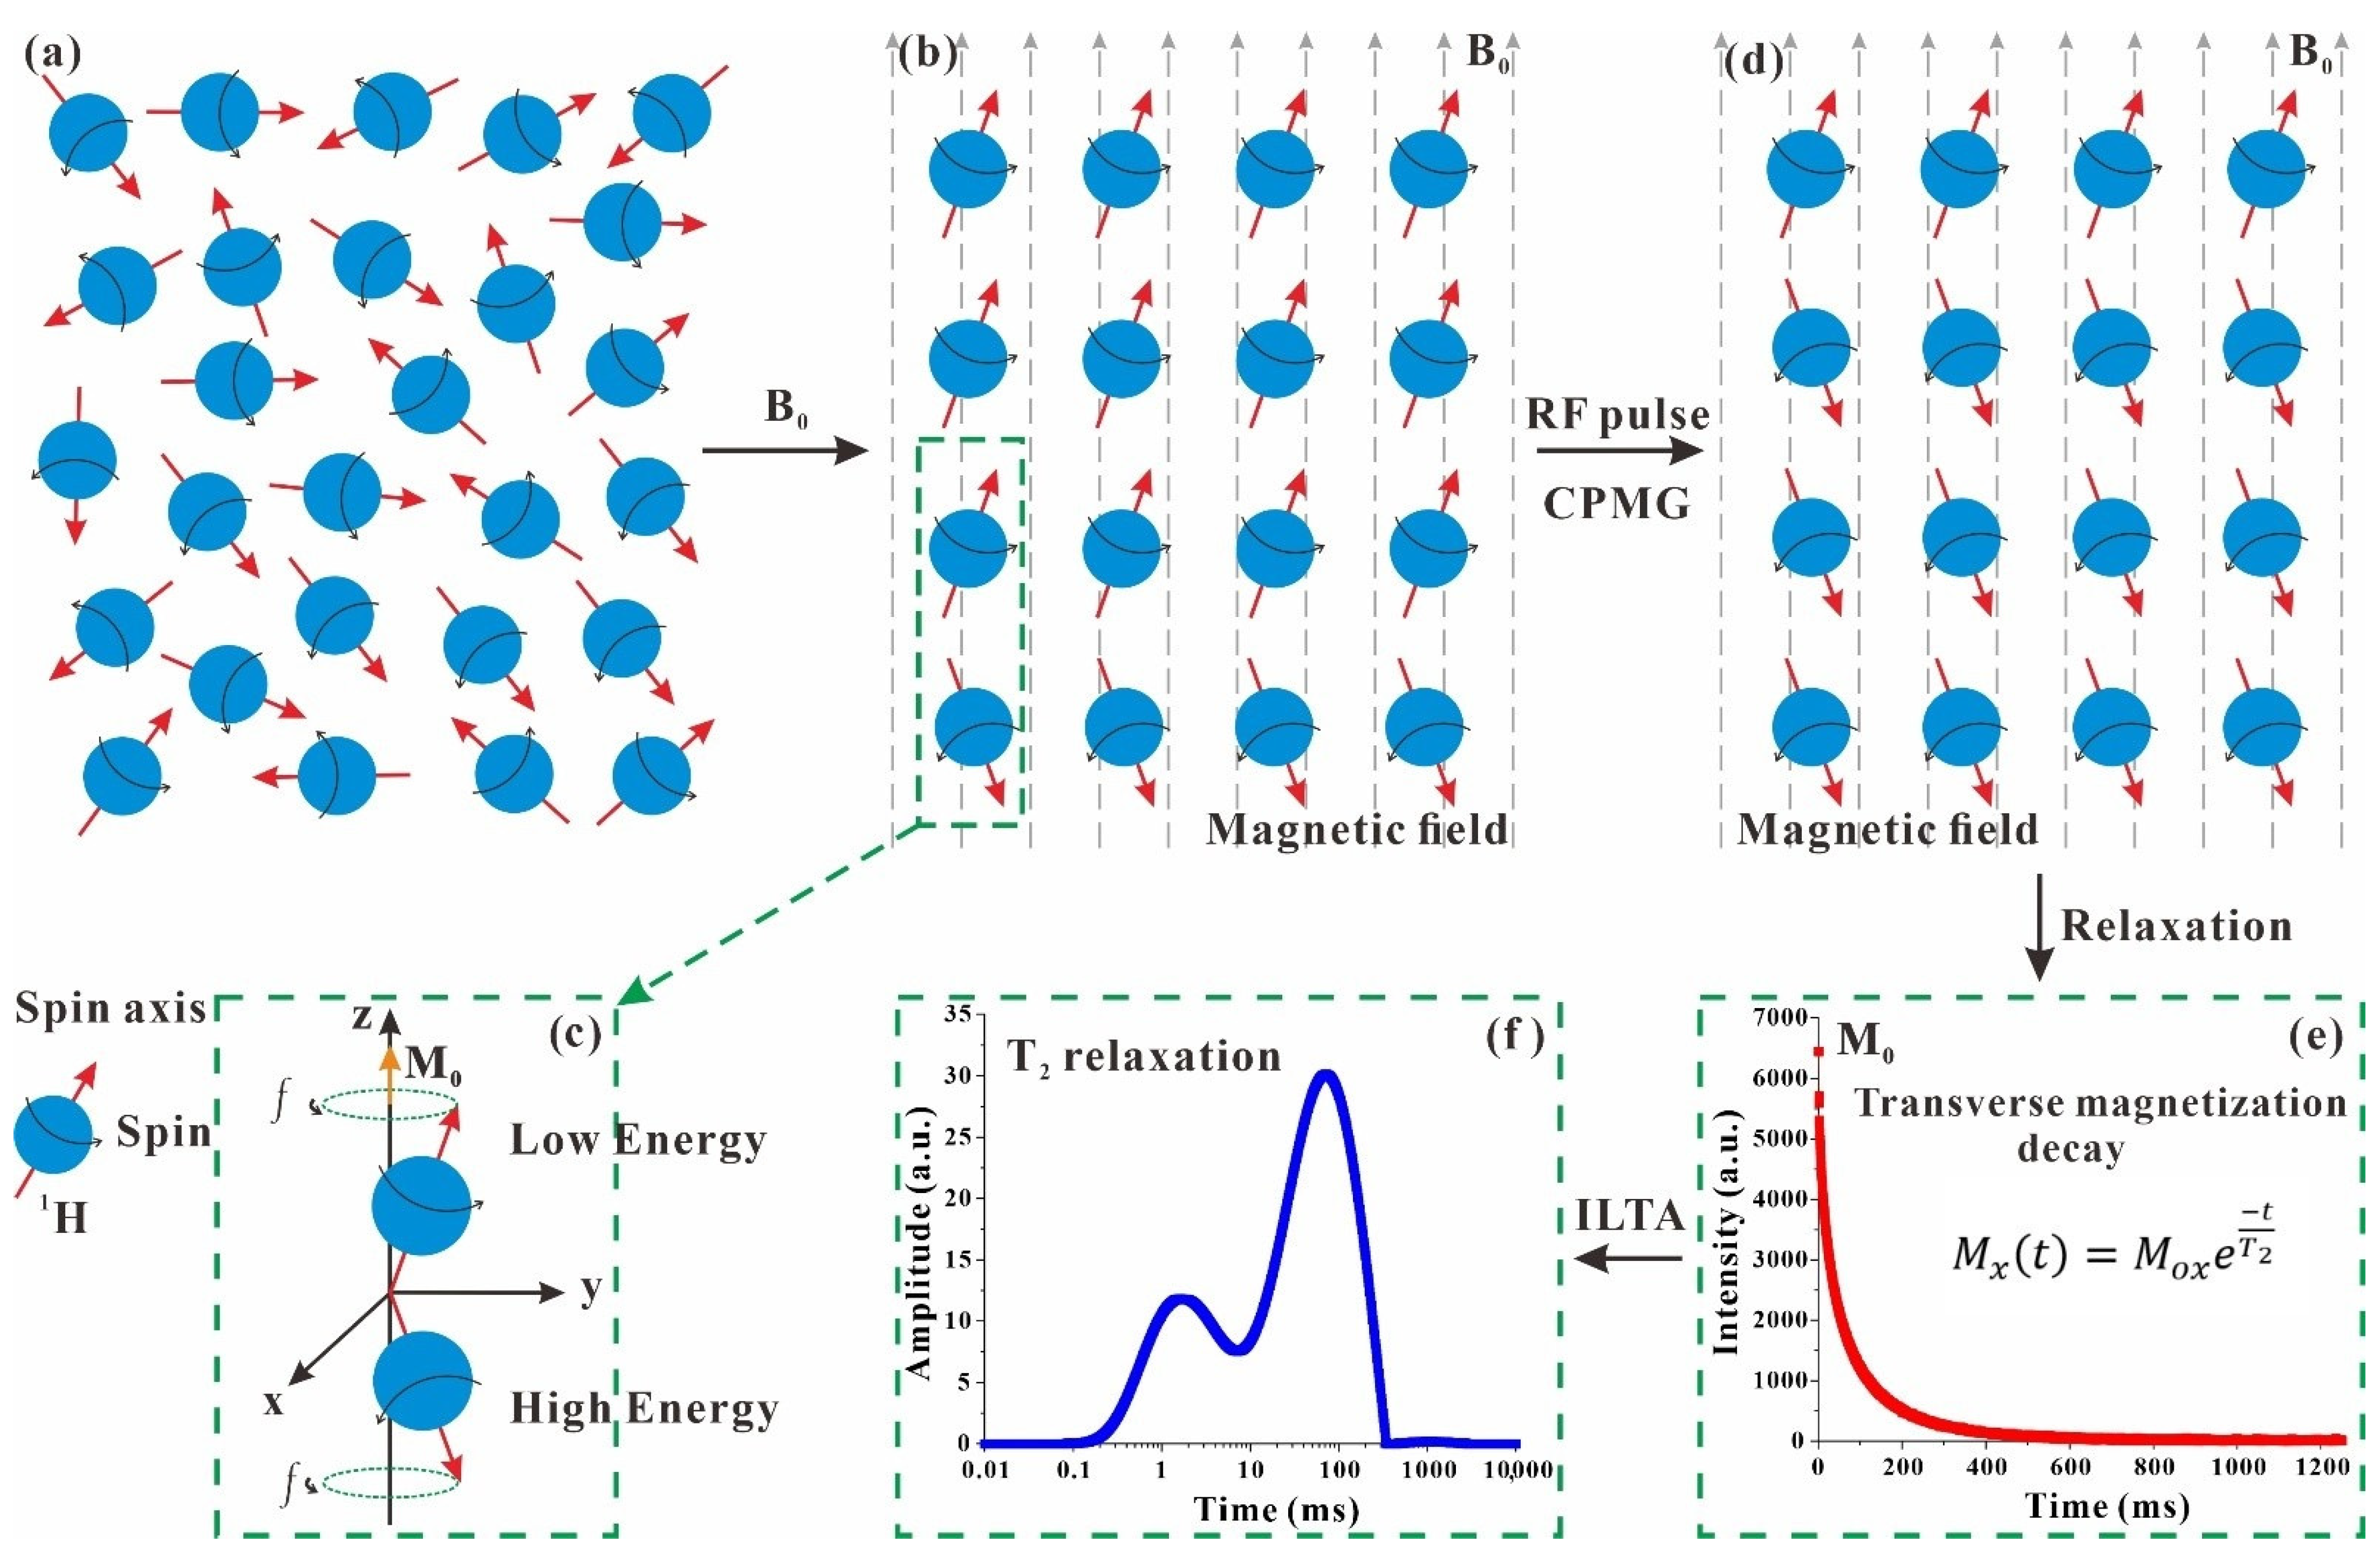
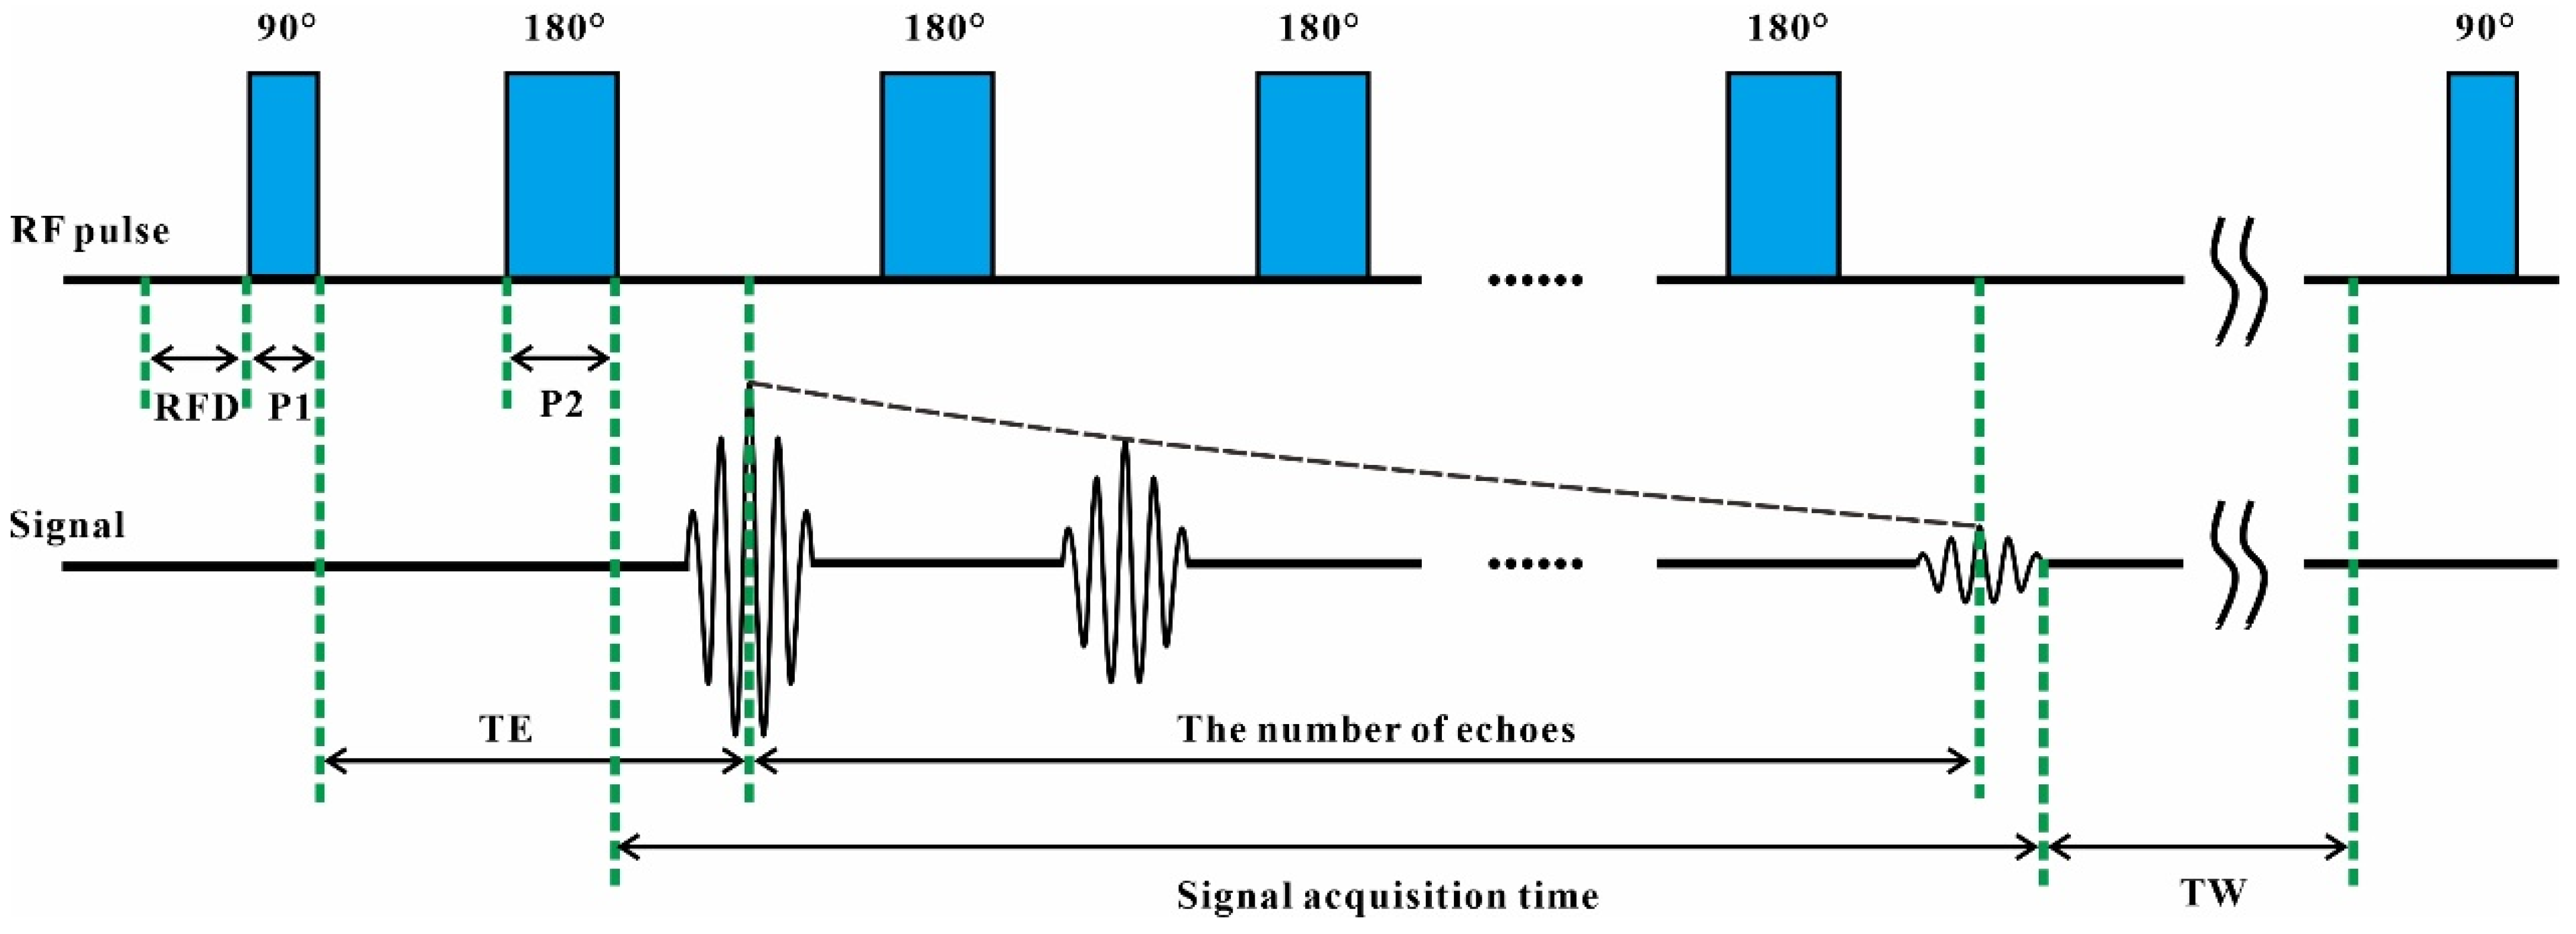
2.1. Principle of NMR T2
2.2. Low-Field NMR Equipment
3. NMR T2 Application
3.1. Gas Hydrate Formation Process
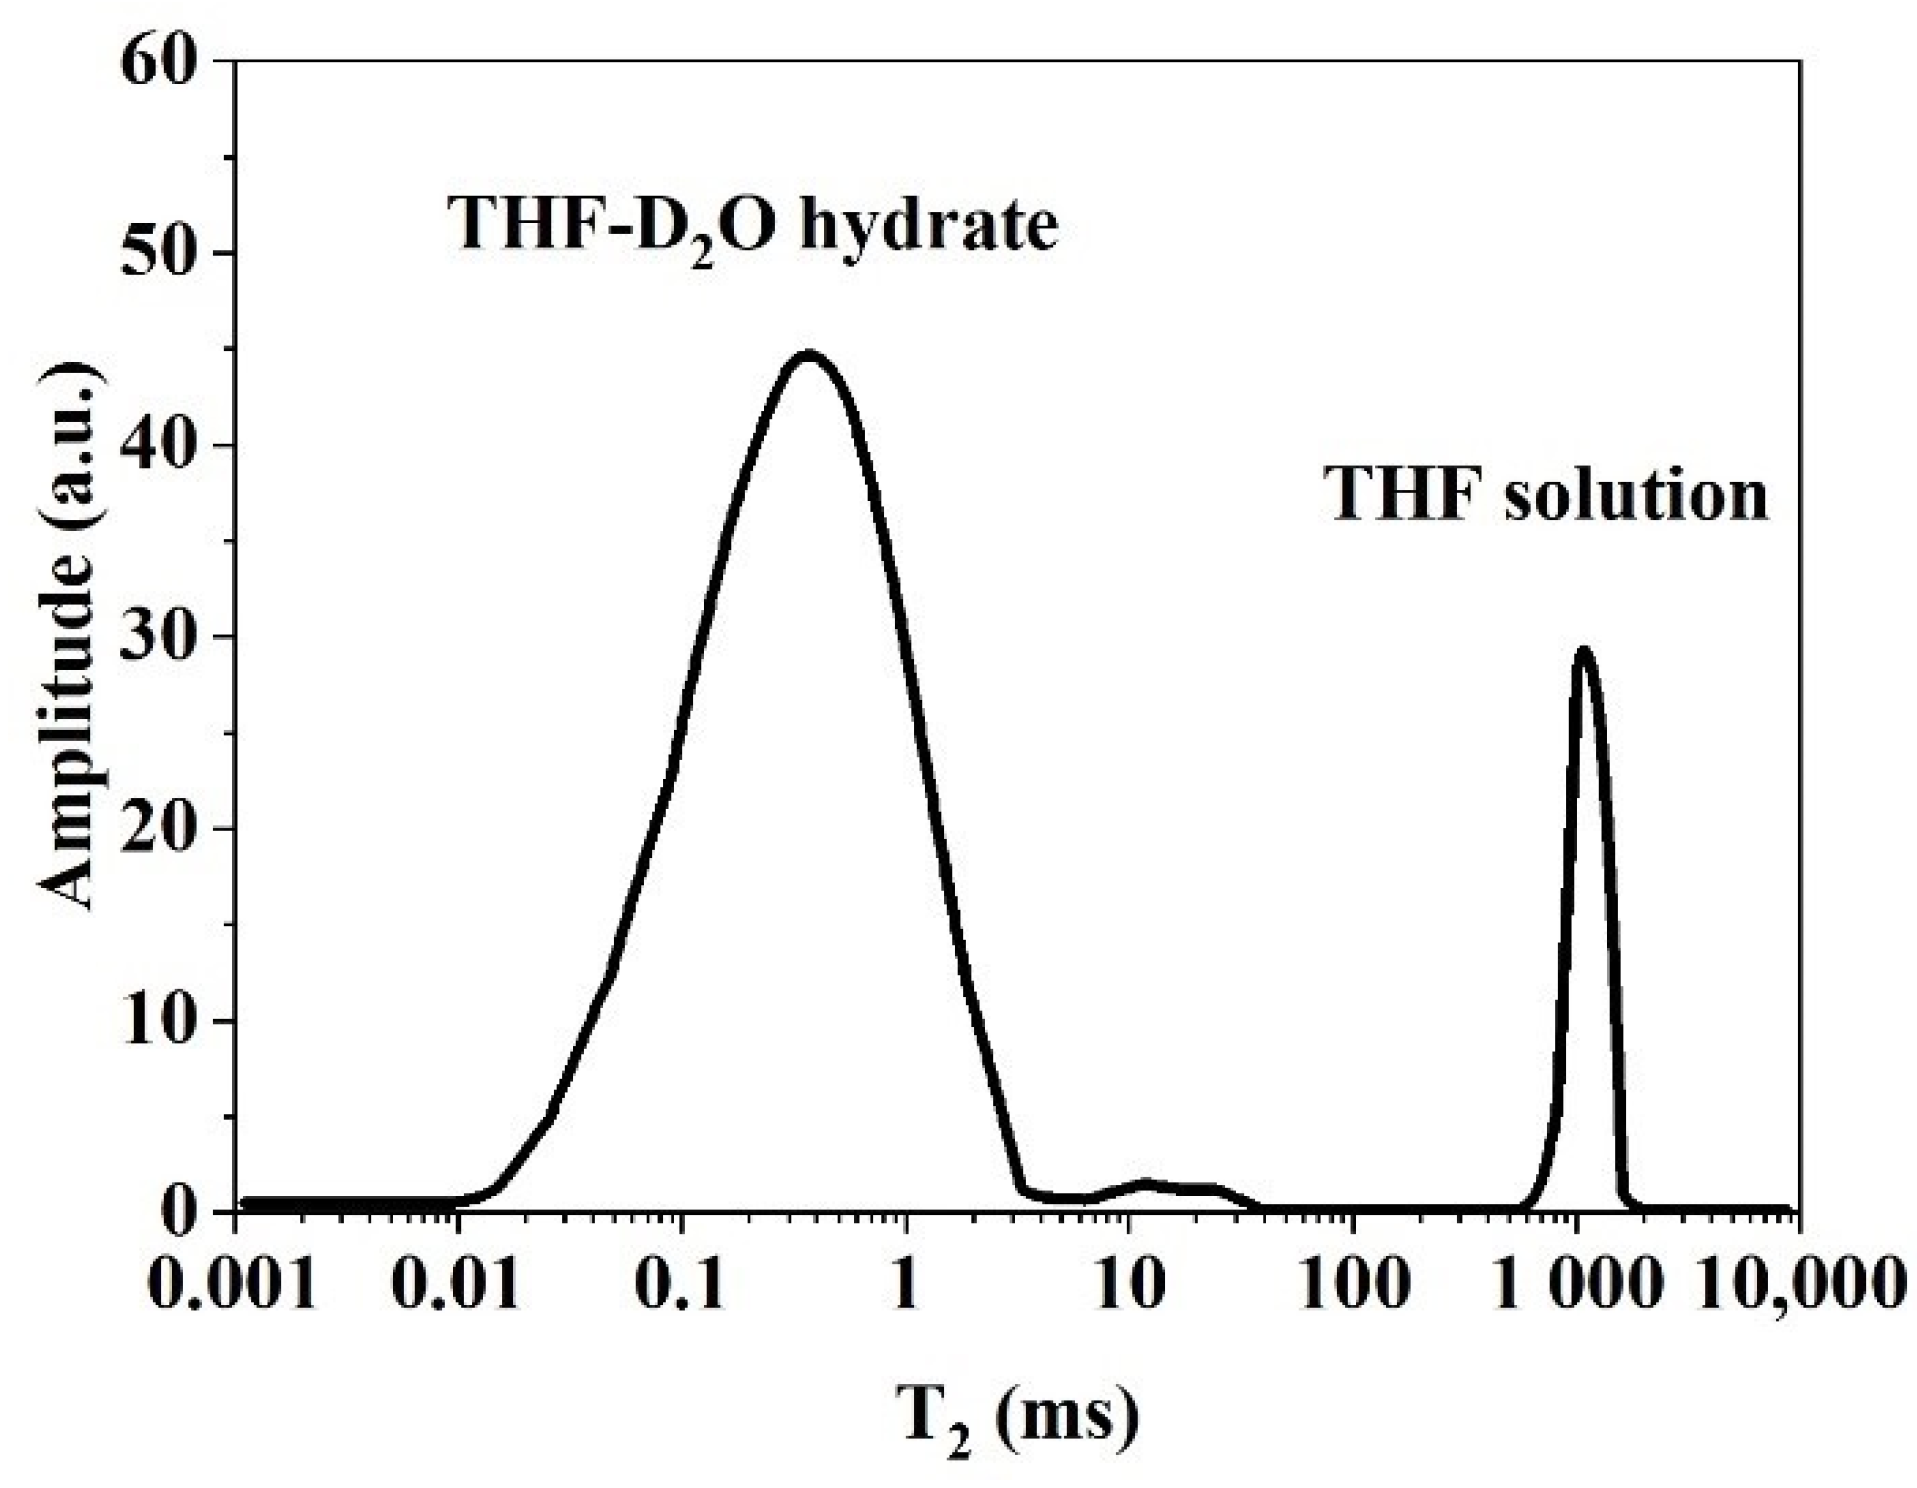
3.1.1. NMR T2 Relaxation of Hydrate, Water, and Gas
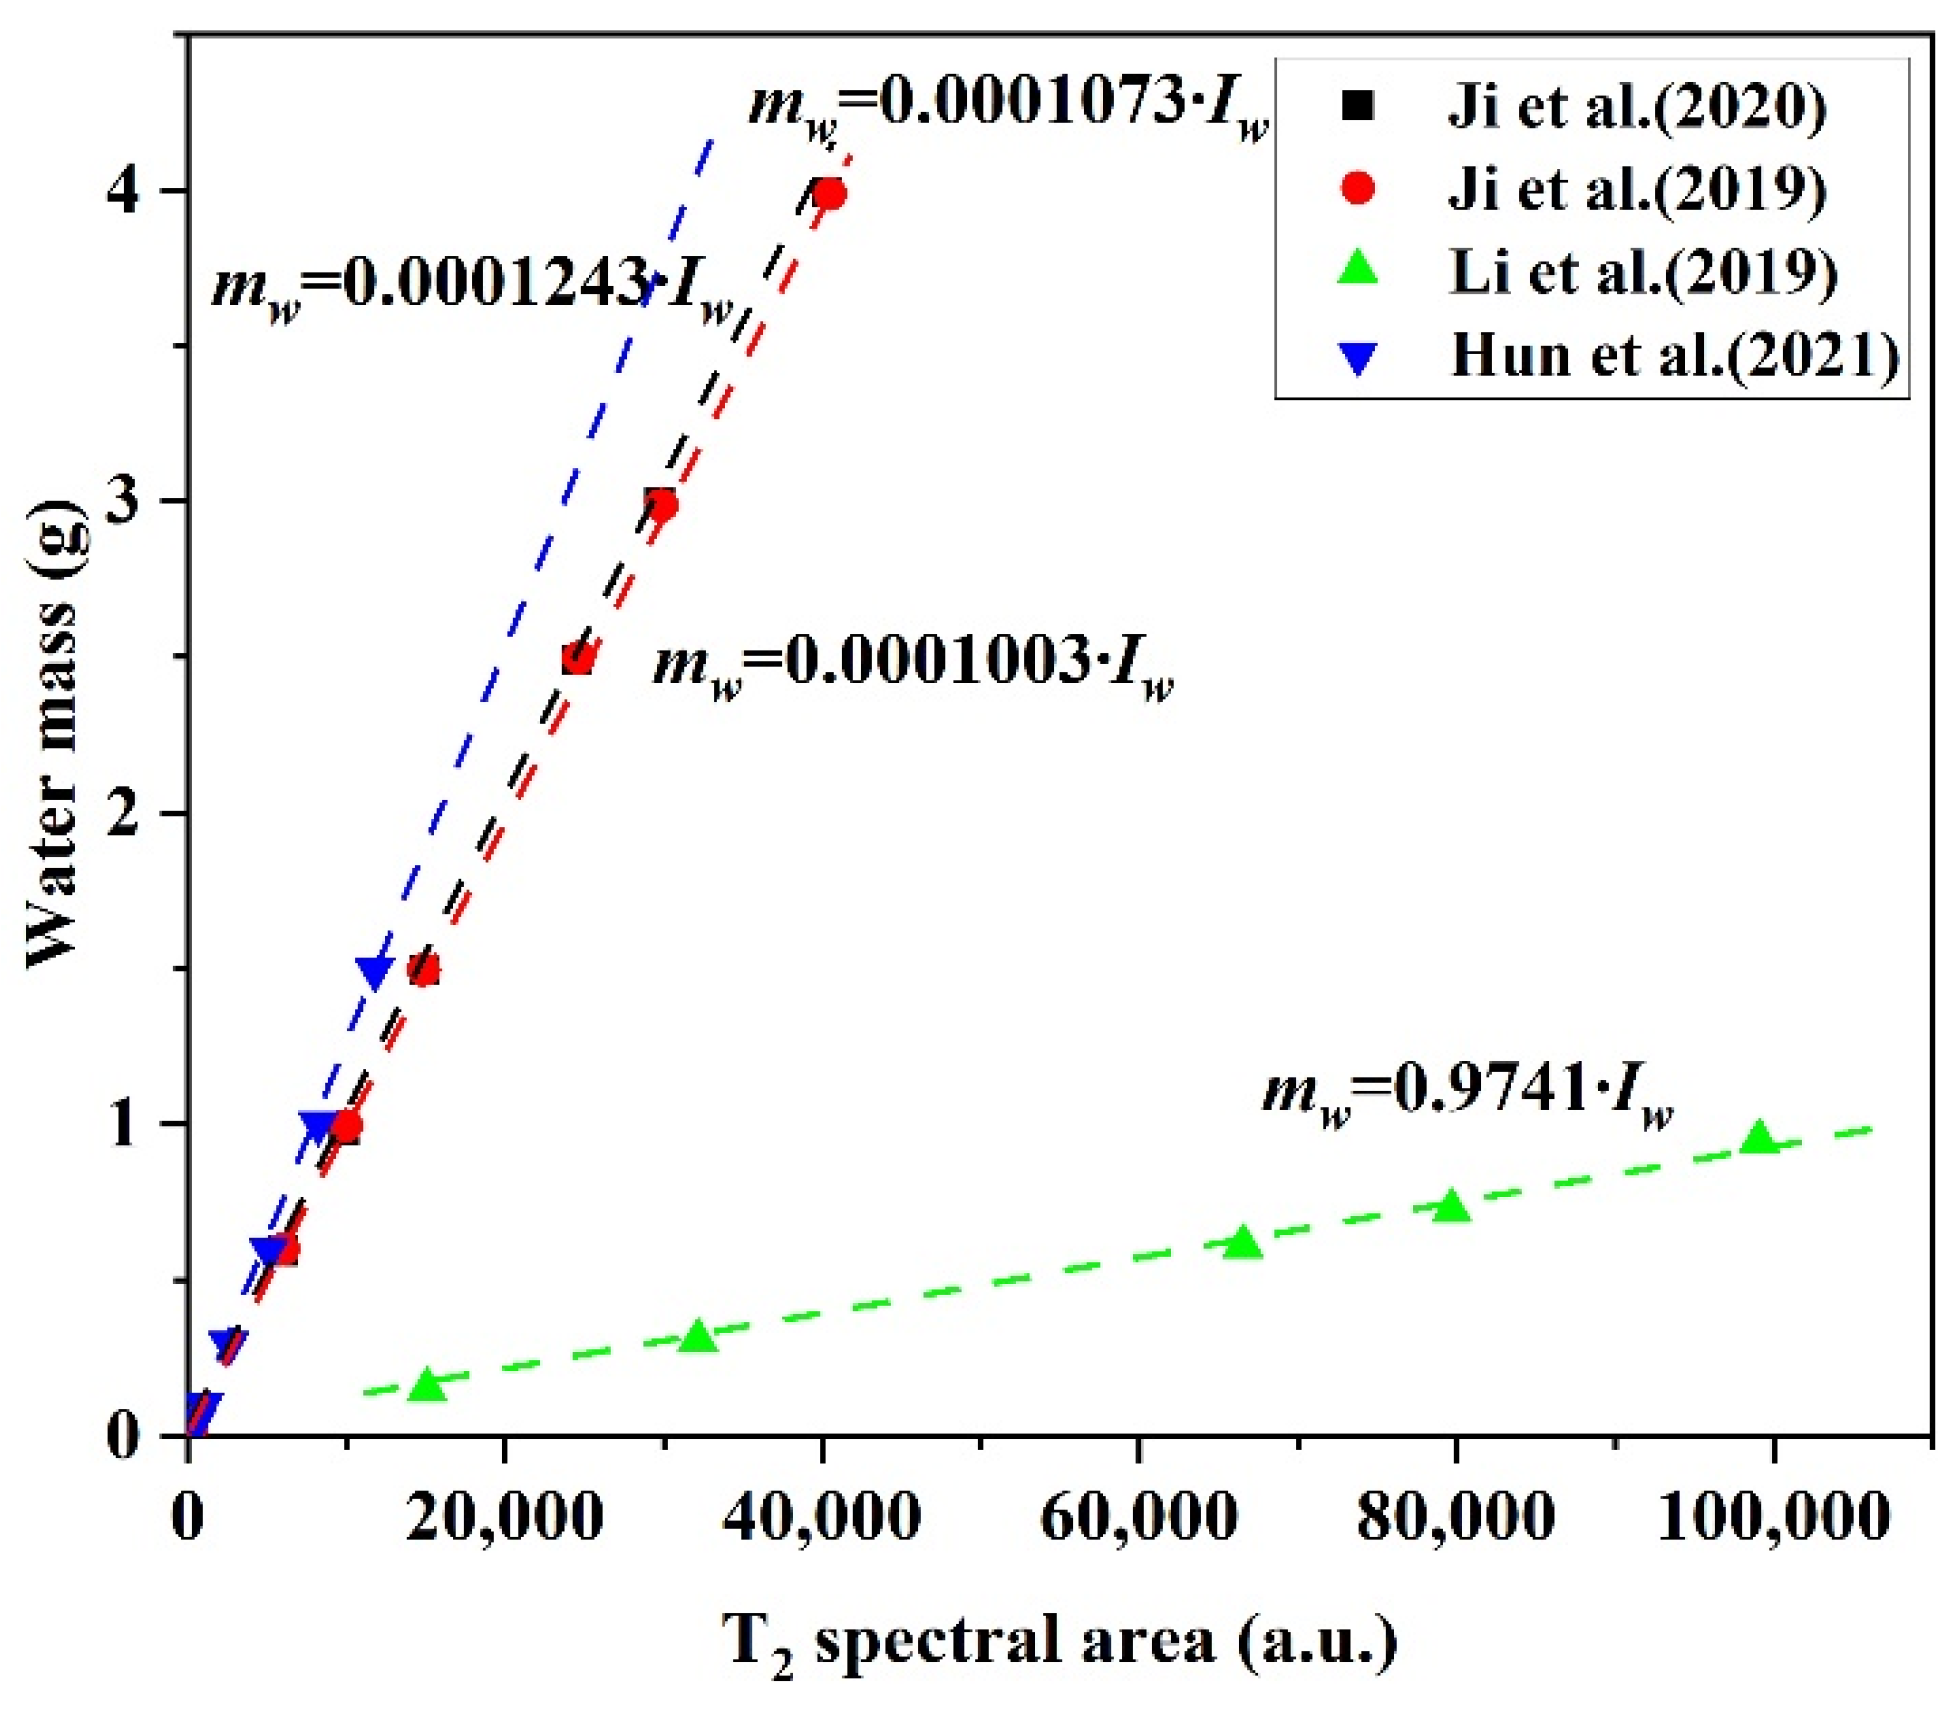
3.1.2. Saturation of Water and Gas Hydrate
3.1.3. Kinetics of Gas Hydrate Formation
3.2. Pore Structure in Sediments
3.2.1. Pore Size Distribution
3.2.2. Permeability
4. Comparison of NMR T2 Method with Other Technologies
5. Potential Research Trends and Improvements
6. Conclusions
Author Contributions
Funding
Institutional Review Board Statement
Informed Consent Statement
Data Availability Statement
Conflicts of Interest
References
- Sloan, E.D.; Koh, C.A. Clathrate Hydrates of Natural Gases; CRC Press: New York, NY, USA, 2007. [Google Scholar]
- Hassanpouryouzband, A.; Joonaki, E.; Vasheghani Farahani, M.; Takeya, S.; Ruppel, C.; Yang, J.; English, N.J.; Schicks, J.M.; Edlmann, K.; Mehrabian, H.; et al. Gas hydrates in sustainable chemistry. Chem. Soc. Rev. 2020, 49, 5225–5309. [Google Scholar] [CrossRef]
- Makogon, Y.F. Natural gas hydrates—A promising source of energy. J. Nat. Gas Sci. Eng. 2010, 2, 49–59. [Google Scholar] [CrossRef]
- Li, J.-F.; Ye, J.-L.; Qin, X.-W.; Qiu, H.-J.; Wu, N.-Y.; Lu, H.-L.; Xie, W.-W.; Lu, J.-A.; Peng, F.; Xu, Z.-Q.; et al. The first offshore natural gas hydrate production test in South China Sea. China Geol. 2018, 1, 5–16. [Google Scholar] [CrossRef]
- Yin, Z.; Linga, P. Methane hydrates: A future clean energy resource. Chin. J. Chem. Eng. 2019, 27, 2026–2036. [Google Scholar] [CrossRef]
- Koh, C.A. Towards a fundamental understanding of natural gas hydrates. Chem. Soc. Rev. 2002, 31, 157–167. [Google Scholar] [CrossRef]
- Yin, Z.; Zheng, J.; Kim, H.; Seo, Y.; Linga, P. Hydrates for cold energy storage and transport: A review. Adv. Appl. Energy 2021, 2, 100022. [Google Scholar] [CrossRef]
- Koh, C.A.; Sloan, E.D.; Sum, A.K.; Wu, D.T. Fundamentals and applications of gas hydrates. Annu. Rev. Chem. Biomol. Eng. 2011, 2, 237–257. [Google Scholar] [CrossRef] [PubMed]
- Sun, C.; Li, W.; Yang, X.; Li, F.; Yuan, Q.; Mu, L.; Chen, J.; Liu, B.; Chen, G. Progress in Research of Gas Hydrate. Chin. J. Chem. Eng. 2011, 19, 151–162. [Google Scholar] [CrossRef]
- Zi, M.; Wu, G.; Wang, J.; Chen, D. Investigation of gas hydrate formation and inhibition in oil-water system containing model asphaltene. Chem. Eng. J. 2021, 412, 128452. [Google Scholar] [CrossRef]
- Niu, M.; Wu, G.; Yin, Z.; Sun, Y.; Liu, K.; Chen, D. Effectiveness of CO2-N2 injection for synergistic CH4 recovery and CO2 sequestration at marine gas hydrates condition. Chem. Eng. J. 2021, 420, 129615. [Google Scholar] [CrossRef]
- Boswell, R.; Collett, T.S. Current perspectives on gas hydrate resources. Energy Environ. Sci. 2011, 4, 1206–1215. [Google Scholar] [CrossRef]
- Sain, K.; Gupta, H. Gas hydrates in India: Potential and development. Gondwana Res. 2012, 22, 645–657. [Google Scholar] [CrossRef]
- Dong, L.; Wan, Y.; Li, Y.; Liao, H.; Liu, C.; Wu, N.; Leonenko, Y. 3D numerical simulation on drilling fluid invasion into natural gas hydrate reservoirs. Energy 2022, 241, 122932. [Google Scholar] [CrossRef]
- Cheng, Z.C.; Wang, S.J.; Xu, N.; Liu, W.G.; Zhao, Y.C.; Zhao, J.F.; Jiang, L.L.; Zheng, J.N. Quantitative analysis of methane hydrate formation in size-varied porous media for gas storage and transportation application. Fuel 2021, 301, 121021. [Google Scholar] [CrossRef]
- Dong, H.S.; Wang, J.Q.; Xie, Z.X.; Wang, B.; Zhang, L.X.; Shi, Q. Potential applications based on the formation and dissociation of gas hydrates. Renew. Sustain. Energy Rev. 2021, 143, 110928. [Google Scholar] [CrossRef]
- Zhang, J.B.; Sun, Q.; Wang, Z.Y.; Wang, J.T.; Sun, X.H.; Liu, Z.; Sun, B.J.; Sun, J.S. Prediction of hydrate formation and plugging in the trial production pipes of offshore natural gas hydrates. J. Clean. Prod. 2021, 316, 128262. [Google Scholar] [CrossRef]
- Berndt, C.; Feseker, T.; Treude, T.; Krastel, S.; Liebetrau, V.; Niemann, H.; Bertics, V.J.; Dumke, I.; Dünnbier, K.; Ferré, B.; et al. Temporal Constraints on Hydrate-Controlled Methane Seepage off Svalbard. Science 2014, 343, 284–287. [Google Scholar] [CrossRef] [Green Version]
- Fukumoto, A.; Sato, T.; Kiyono, F.; Hirabayashi, S. Estimation of the Formation Rate Constant of Methane Hydrate in Porous Media. SPE J. 2014, 19, 184–190. [Google Scholar] [CrossRef]
- Chong, Z.R.; Chan, A.H.M.; Babu, P.; Yang, M.J.; Linga, P. Effect of NaCl on methane hydrate formation and dissociation in porous media. J. Nat. Gas Sci. Eng. 2015, 27, 178–189. [Google Scholar] [CrossRef]
- Qin, Y.; Pan, Z.; Liu, Z.M.; Shang, L.Y.; Zhou, L. Influence of the Particle Size of Porous Media on the Formation of Natural Gas Hydrate: A Review. Energy Fuels 2021, 35, 11640–11664. [Google Scholar] [CrossRef]
- Le, T.X.; Rodts, S.; Hautemayou, D.; Aimedieu, P.; Bornert, M.; Chabot, B.; Tang, A.M. Kinetics of methane hydrate formation and dissociation in sand sediment. Geomech. Energy Environ. 2020, 23, 100103. [Google Scholar] [CrossRef] [Green Version]
- Malagar, B.R.C.; Lijith, K.P.; Singh, D.N. Formation & dissociation of methane gas hydrates in sediments: A critical review. J. Nat. Gas Sci. Eng. 2019, 65, 168–184. [Google Scholar]
- Yin, Z.; Wan, Q.-C.; Gao, Q.; Linga, P. Effect of pressure drawdown rate on the fluid production behaviour from methane hydrate-bearing sediments. Appl. Energy 2020, 271, 115195. [Google Scholar] [CrossRef]
- Bai, Y.; Hou, J.; Liu, Y.; Lu, N.; Zhao, E.; Ji, Y. Interbed patterns division and its effect on production performance for class I hydrate deposit with mudstone interbed. Energy 2020, 211, 118666. [Google Scholar] [CrossRef]
- Liu, X.; Sun, Y.; Guo, T.; Rabiei, M.; Qu, Z.; Hou, J. Numerical simulations of hydraulic fracturing in methane hydrate reservoirs based on the coupled thermo-hydrologic-mechanical-damage (THMD) model. Energy 2022, 238, 122054. [Google Scholar] [CrossRef]
- Chen, Q.; Hu, G.-w.; Wu, N.-y.; Liu, C.-l.; Meng, Q.-g.; Li, C.-f.; Sun, J.-y.; Li, Y.-l. Evaluation of clayed silt properties on the behavior of hydrate production in South China Sea. China Geol. 2020, 3, 362–368. [Google Scholar]
- Ruan, X.; Li, X.-S.; Xu, C.-G. A review of numerical research on gas production from natural gas hydrates in China. J. Nat. Gas Sci. Eng. 2020, 85, 103713. [Google Scholar] [CrossRef]
- Liu, X.Q.; Qu, Z.Q.; Guo, T.K.; Sun, Y.; Rabiei, M.; Liao, H.L. A coupled thermo-hydrologic-mechanical (THM) model to study the impact of hydrate phase transition on reservoir damage. Energy 2021, 216, 119222. [Google Scholar] [CrossRef]
- Ge, X.; Liu, J.; Fan, Y.; Xing, D.; Deng, S.; Cai, J. Laboratory Investigation Into the Formation and Dissociation Process of Gas Hydrate by Low-Field NMR Technique. J. Geophys. Res. Solid Earth 2018, 123, 3339–3346. [Google Scholar] [CrossRef]
- Yao, Y.; Liu, D.; Xie, S. Quantitative characterization of methane adsorption on coal using a low-field NMR relaxation method. Int. J. Coal Geol. 2014, 131, 32–40. [Google Scholar] [CrossRef]
- Yin, Z.; Moridis, G.; Chong, Z.R.; Linga, P. Effectiveness of multi-stage cooling processes in improving the CH4-hydrate saturation uniformity in sandy laboratory samples. Appl. Energy 2019, 250, 729–747. [Google Scholar] [CrossRef] [Green Version]
- Coates, G.; Xiao, L.; Prammer, M. NMR Logging. Principles and Applications; Halliburton: Houston, TX, USA, 1999. [Google Scholar]
- Günther, H. NMR Spectroscopy: Basic Principles, Concepts and Applications in Chemistry; John Wiley & Sons: Baden-Württemberg, Germany, 2013. [Google Scholar]
- Zhang, R.; Huo, J.-h.; Peng, Z.-g.; Feng, Q.; Wang, J.-x.; Zhang, J. Research on Oil-Based Drilling Fluids Emulsion Droplet by Low-Field NMR. Appl. Magn. Reson. 2016, 47, 1339–1352. [Google Scholar] [CrossRef]
- Zhou, B.; Yang, P.; Ferrante, G.; Pasin, M.; Steele, R.; Bortolotti, V.; Korb, J.-P. Applying Fast-Field Cycling Nuclear Magnetic Relaxation to Petroleum Tight Sandstone Rocks. Energy Fuels 2019, 33, 1016–1022. [Google Scholar] [CrossRef]
- Belila, A.M.P.; Basso, M.; Chinelatto, G.F.; Kuroda, M.C.; Vidal, A.C. Pore typing using nuclear magnetic resonance, an example with samples from cretaceous pre-salt lacustrine carbonates in the Santos Basin, Brazil. J. Pet. Sci. Eng. 2020, 190, 107079. [Google Scholar] [CrossRef]
- Guo, J.C.; Zhou, H.Y.; Zeng, J.; Wang, K.J.; Lai, J.; Liu, Y.X. Advances in low-field nuclear magnetic resonance (NMR) technologies applied for characterization of pore space inside rocks: A critical review. Petrol. Sci. 2020, 17, 1281–1297. [Google Scholar] [CrossRef]
- Li, Q.; Li, X.B.; Yin, T.B. Factors affecting pore structure of granite under cyclic heating and cooling: A nuclear magnetic resonance investigation. Geothermics 2021, 96, 102198. [Google Scholar] [CrossRef]
- Lin, H.; Yang, B.; Song, X.X.; Sun, X.Y.; Dong, L.F. Fracturing fluid retention in shale gas reservoir from the perspective of pore size based on nuclear magnetic resonance. J. Hydrol. 2021, 601, 126590. [Google Scholar]
- Liu, W.Z.; Niu, S.W.; Tang, H.B.; Zhou, K. Pore structure evolution during lignite pyrolysis based on nuclear magnetic resonance. Case Stud. Therm. Eng. 2021, 26, 101125. [Google Scholar] [CrossRef]
- Wang, J.L.; Dong, S.F.; Zhou, C.S.; Ashour, A.; Han, B.G. Investigating pore structure of nano-engineered concrete with low-field nuclear magnetic resonance. J. Mater. Sci. 2021, 56, 243–259. [Google Scholar] [CrossRef]
- Wang, X.J.; Wang, M.; Li, Y.; Zhang, J.X.; Li, M.; Li, Z.; Guo, Z.Q.; Li, J.B. Shale pore connectivity and influencing factors based on spontaneous imbibition combined with a nuclear magnetic resonance experiment. Mar. Pet. Geol. 2021, 132, 105239. [Google Scholar] [CrossRef]
- Zhao, Y.; Liu, T.; Lin, B.Q.; Sun, Y. Evaluation of Compressibility of Multiscale Pore-Fractures in Fractured Low-Rank Coals by Low-Field Nuclear Magnetic Resonance. Energy Fuels 2021, 35, 13133–13143. [Google Scholar] [CrossRef]
- Chen, H.L.; Wei, C.F.; Tian, H.H.; Wei, H.Z. NMR Relaxation Response of CO2 Hydrate Formation and Dissociation in Sand. Acta Phys. Chim. Sin. 2017, 33, 1599–1604. [Google Scholar]
- Ma, S.; Sun, L.; Kelland, M.A.; Wang, Q.; Li, D.; Zhang, Y.; Dong, J. Hydrophobic hydration affects growth of clathrate hydrate: Insight from an NMR relaxometric and calorimetric study. Chem. Commun. 2019, 55, 2936–2939. [Google Scholar] [CrossRef] [PubMed] [Green Version]
- Ji, Y.; Hou, J.; Zhao, E.; Lu, N.; Bai, Y.; Zhou, K.; Liu, Y. Study on the Effects of Heterogeneous Distribution of Methane Hydrate on Permeability of Porous Media Using Low-Field NMR Technique. J. Geophys. Res. Solid Earth 2020, 125, e2019JB018572. [Google Scholar] [CrossRef]
- Kuang, Y.M.; Zhang, L.X.; Song, Y.C.; Yang, L.; Zhao, J.F. Quantitative determination of pore-structure change and permeability estimation under hydrate phase transition by NMR. Aiche J. 2020, 66, e16859. [Google Scholar] [CrossRef]
- Ma, S.; Zheng, J.-n.; Tian, M.; Tang, D.; Yang, M. NMR quantitative investigation on methane hydrate formation characteristics under different driving forces. Fuel 2020, 261, 116364. [Google Scholar] [CrossRef]
- Zheng, J.N.; Yang, L.; Ma, S.H.; Zhao, Y.C.; Yang, M.J. Quantitative analysis of CO2 hydrate formation in porous media by proton NMR. Aiche J. 2020, 66, 66. [Google Scholar] [CrossRef]
- Sun, X.; Qin, X.; Lu, H.; Wang, J.; Xu, J.; Ning, Z. Gas hydrate in-situ formation and dissociation in clayey-silt sediments: An investigation by low-field NMR. Energy Explor. Exploit. 2021, 39, 256–272. [Google Scholar] [CrossRef]
- Zhan, J.; Zhang, P.; Wang, Y.M.; Wu, Q.B. Experimental research on methane hydrate formation in porous media based on the low-field NMR technique. Chem. Eng. Sci. 2021, 244, 116804. [Google Scholar] [CrossRef]
- Zhang, Z.; Liu, L.L.; Li, C.F.; Liu, C.L.; Ning, F.L.; Liu, Z.C.; Meng, Q.G. A testing assembly for combination measurements on gas hydrate-bearing sediments using x-ray computed tomography and low-field nuclear magnetic resonance. Rev. Sci. Instrum. 2021, 92, 085108. [Google Scholar] [CrossRef]
- Turakhanov, A.H.; Shumskayte, M.Y.; Ildyakov, A.V.; Manakov, A.Y.; Smirnov, V.G.; Glinskikh, V.N.; Duchkov, A.D. Formation of methane hydrate from water sorbed by anthracite: An investgation by low-field NMR relaxation. Fuel 2020, 262, 116656. [Google Scholar] [CrossRef]
- Zhang, Y.; Zhao, Y.; Lei, X.; Yang, M.; Zhang, Y.; Song, Y. Quantitatively study on methane hydrate formation/decomposition process in hydrate-bearing sediments using low-field MRI. Fuel 2020, 262, 116555. [Google Scholar] [CrossRef]
- Zhang, Y.C.; Liu, L.L.; Wang, D.G.; Chen, P.F.; Zhang, Z.; Meng, Q.G.; Liu, C.L. Application of Low-Field Nuclear Magnetic Resonance (LFNMR) in Characterizing the Dissociation of Gas Hydrate in a Porous Media. Energy Fuels 2021, 35, 2174–2182. [Google Scholar] [CrossRef]
- Minagawa, H.; Egawa, K.; Sakamoto, Y.; Komai, T.; Tenma, N.; Narita, H. Characterization of Hydraulic Permeability and Pore-Size Distribution of Methane Hydrate-Bearing Sediment Using Proton Nuclear Magnetic Resonance Measurement. Int. J. Offshore Polar Eng. 2012, 22, 306–313. [Google Scholar]
- Harris, R.K. Nuclear Magnetic Resonance Spectroscopy; Longman: Essex, UK, 1986. [Google Scholar]
- Bakhmutov, V.I. Practical Nuclear Magnetic Resonance Relaxation for Chemists; John Wiley & Sons: Chichester, UK, 2005. [Google Scholar]
- Carr, H.Y.; Purcell, E.M. Effects of Diffusion on Free Precession in Nuclear Magnetic Resonance Experiments. Phys. Rev. 1954, 94, 630–638. [Google Scholar] [CrossRef]
- Meiboom, S.; Gill, D. Modified Spin-Echo Method for Measuring Nuclear Relaxation Times. Rev. Sci. Instrum. 1958, 29, 688–691. [Google Scholar] [CrossRef] [Green Version]
- Almenningen, S.; Fotland, P.; Ersland, G. Magnetic Resonance Imaging of Methane Hydrate Formation and Dissociation in Sandstone with Dual Water Saturation. Energies 2019, 12, 3231. [Google Scholar] [CrossRef] [Green Version]
- Wu, Q.; Deng, Y.; Fan, X.; Lu, H.; Wang, X.; Gan, Z.; Wang, F. Effect of Mineral Surface Properties on Water Behaviors in Pores Constructed by Calcite and Silica Particles. J. Phys. Chem. C 2019, 123, 13288–13294. [Google Scholar] [CrossRef]
- Washburn, K.E. Relaxation mechanisms and shales. Concepts Magn. Reson. Part A 2014, 43A, 57–78. [Google Scholar] [CrossRef]
- Kleinberg, R.L.; Vinegar, H.J. NMR properties of reservoir fluids. Log Anal. 1996, 37, 20–32. [Google Scholar]
- Ji, Y.; Hou, J.; Cui, G.; Lu, N.; Zhao, E.; Liu, Y.; Du, Q. Experimental study on methane hydrate formation in a partially saturated sandstone using low-field NMR technique. Fuel 2019, 251, 82–90. [Google Scholar] [CrossRef]
- Rojas Zuniga, A.; Li, M.; Aman, Z.M.; Stanwix, P.L.; May, E.F.; Johns, M.L. NMR-Compatible Sample Cell for Gas Hydrate Studies in Porous Media. Energy Fuels 2020, 34, 12388–12398. [Google Scholar] [CrossRef]
- Liu, L.L.; Zhang, Z.; Liu, C.L.; Wu, N.Y.; Ning, F.L.; Zhang, Y.C.; Meng, Q.G.; Li, C.F. Nuclear Magnetic Resonance Transverse Surface Relaxivity in Quartzitic Sands Containing Gas Hydrate. Energy Fuels 2021, 35, 6144–6152. [Google Scholar] [CrossRef]
- Vasheghani Farahani, M.; Guo, X.; Zhang, L.; Yang, M.; Hassanpouryouzband, A.; Zhao, J.; Yang, J.; Song, Y.; Tohidi, B. Effect of thermal formation/dissociation cycles on the kinetics of formation and pore-scale distribution of methane hydrates in porous media: A magnetic resonance imaging study. Sustain. Energy Fuels 2021, 5, 1567–1583. [Google Scholar] [CrossRef]
- Zhang, Y.C.; Liu, L.L.; Wang, D.G.; Zhang, Z.; Li, C.F.; Meng, Q.G.; Liu, C.L. The interface evolution during methane hydrate dissociation within quartz sands and its implications to the permeability prediction based on NMR data. Mar. Pet. Geol. 2021, 129, 105065. [Google Scholar] [CrossRef]
- Petrov, O.V.; Furó, I. NMR cryoporometry: Principles, applications and potential. Prog. Nucl. Magn. Reson. Spectrosc. 2009, 54, 97–122. [Google Scholar] [CrossRef]
- Kleinberg, R.L.; Flaum, C.; Griffin, D.D.; Brewer, P.G.; Malby, G.E.; Peltzer, E.T.; Yesinowski, J.P. Deep sea NMR: Methane hydrate growth habit in porous media and its relationship to hydraulic permeability, deposit accumulation, and submarine slope stability. J. Geophys. Res. Solid Earth 2003, 108, 2137. [Google Scholar] [CrossRef]
- Kleinberg, R.L.; Flaum, C.; Straley, C.; Brewer, P.G.; Malby, G.E.; Peltzer, E.T.; Friederich, G.; Yesinowski, J.P. Seafloor nuclear magnetic resonance assay of methane hydrate in sediment and rock. J. Geophys. Res. Solid Earth 2003, 108, 2508. [Google Scholar] [CrossRef]
- Yang, M.J.; Chong, Z.R.; Zheng, J.; Song, Y.C.; Linga, P. Advances in nuclear magnetic resonance (NMR) techniques for the investigation of clathrate hydrates. Renew Sust Energ Rev 2017, 74, 1346–1360. [Google Scholar] [CrossRef]
- Huang, X.; Li, T.; Gao, H.; Zhao, J.; Wang, C. Comparison of SO2 with CO2 for recovering shale resources using low-field nuclear magnetic resonance. Fuel 2019, 245, 563–569. [Google Scholar] [CrossRef]
- Yao, Y.B.; Liu, J.; Liu, D.M.; Chen, J.Y.; Pan, Z.J. A new application of NMR in characterization of multiphase methane and adsorption capacity of shale. Int. J. Coal Geol. 2019, 201, 76–85. [Google Scholar] [CrossRef]
- Shumskayte, M.Y.; Manakov, A.Y.; Sagidullin, A.K.; Glinskikh, V.N.; Podenko, L.S. Melting of tetrahydrofuran hydrate in pores: An investigation by low-field NMR relaxation. Mar. Pet. Geol. 2021, 129, 105096. [Google Scholar] [CrossRef]
- Tian, H.-h.; Wei, H.-z.; Yan, R.-t.; Ma, T.; Wei, C. Application of low-field NMR to the studies of the THF hydrate formation process. Nat. Gas Ind. 2011, 31, 97–99. [Google Scholar]
- Gao, S.; Chapman, W.G.; House, W. Application of low field NMR T2 measurements to clathrate hydrates. J. Magn. Reson. 2009, 197, 208–212. [Google Scholar] [CrossRef]
- Zhao, Y.; Sun, Y.; Liu, S.; Wang, K.; Jiang, Y. Pore structure characterization of coal by NMR cryoporometry. Fuel 2017, 190, 359–369. [Google Scholar] [CrossRef]
- Li, J.; Lu, S.; Chen, G.; Wang, M.; Tian, S.; Guo, Z. A new method for measuring shale porosity with low-field nuclear magnetic resonance considering non-fluid signals. Mar. Pet. Geol. 2019, 102, 535–543. [Google Scholar] [CrossRef]
- Devarakonda, S.; Groysman, A.; Myerson, A.S. THF–water hydrate crystallization: An experimental investigation. J. Cryst. Growth 1999, 204, 525–538. [Google Scholar] [CrossRef]
- Zeng, H.; Wilson, L.D.; Walker, V.K.; Ripmeester, J.A. Effect of Antifreeze Proteins on the Nucleation, Growth, and the Memory Effect during Tetrahydrofuran Clathrate Hydrate Formation. J. Am. Chem. Soc. 2006, 128, 2844–2850. [Google Scholar] [CrossRef]
- Naeiji, P.; Arjomandi, A.; Varaminian, F. Amino acids as kinetic inhibitors for tetrahydrofuran hydrate formation: Experimental study and kinetic modeling. J. Nat. Gas Sci. Eng. 2014, 21, 64–70. [Google Scholar] [CrossRef]
- Sun, S.; Peng, X.; Zhang, Y.; Zhao, J.; Kong, Y. Stochastic nature of nucleation and growth kinetics of THF hydrate. J. Chem. Thermodyn. 2017, 107, 141–152. [Google Scholar] [CrossRef]
- Minagawa, H.; Nishikawa, Y.; Ikeda, I.; Miyazaki, K.; Takahara, N.; Sakamoto, Y.; Komai, T.; Narita, H. Characterization of sand sediment by pore size distribution and permeability using proton nuclear magnetic resonance measurement. J. Geophys. Res-Sol. Earth Surf. 2008, 113, 113. [Google Scholar] [CrossRef]
- Liu, Z.; Liu, D.; Cai, Y.; Yao, Y.; Pan, Z.; Zhou, Y. Application of nuclear magnetic resonance (NMR) in coalbed methane and shale reservoirs: A review. Int. J. Coal Geol. 2020, 218, 103261. [Google Scholar] [CrossRef]
- Zhou, Y.; Wu, Z.; Weng, L.; Liu, Q. Seepage characteristics of chemical grout flow in porous sandstone with a fracture under different temperature conditions: An NMR based experimental investigation. International Journal of Rock Mechanics and Mining Sciences 2021, 142, 104764. [Google Scholar] [CrossRef]
- Yao, Y.; Liu, D. Comparison of low-field NMR and mercury intrusion porosimetry in characterizing pore size distributions of coals. Fuel 2012, 95, 152–158. [Google Scholar] [CrossRef]
- Zhao, Z.H.; Zhang, M.H.; Liu, W.J.; Li, Q.T. Measurement of Pore Sized Microporous-Mesoporous Materials by Time-Domain Nuclear Magnetic Resonance. Bioresources 2020, 15, 1407–1418. [Google Scholar] [CrossRef]
- Sun, Y.; Zhai, C.; Xu, J.Z.; Cong, Y.Z.; Qin, L.; Zhao, C. Characterisation and evolution of the full size range of pores and fractures in rocks under freeze-thaw conditions using nuclear magnetic resonance and three-dimensional X-ray microscopy. Eng Geol 2020, 271, 105616. [Google Scholar] [CrossRef]
- Kleinberg, R.L.; Griffin, D.D. NMR measurements of permafrost: Unfrozen water assay, pore-scale distribution of ice, and hydraulic permeability of sediments. Cold Reg. Sci. Technol. 2005, 42, 63–77. [Google Scholar] [CrossRef]
- Ryu, S.; Johnson, D.L. Aspects of Diffusive-Relaxation Dynamics with a Nonuniform, Partially Absorbing Boundary in General Porous Media. Phys. Rev. Lett. 2009, 103, 118701. [Google Scholar] [CrossRef] [Green Version]
- Keating, K.; Knight, R. The effect of spatial variation in surface relaxivity on nuclear magnetic resonance relaxation rates. Geophysics 2012, 77, E365–E377. [Google Scholar] [CrossRef]
- Ge, X.M.; Myers, M.T.; Liu, J.Y.; Fan, Y.R.; Zahid, M.A.; Zhao, J.E.; Hathon, L. Determining the transverse surface relaxivity of reservoir rocks: A critical review and perspective. Mar. Pet. Geol. 2021, 126, 104934. [Google Scholar] [CrossRef]
- Saidian, M.; Prasad, M. Effect of mineralogy on nuclear magnetic resonance surface relaxivity: A case study of Middle Bakken and Three Forks formations. Fuel 2015, 161, 197–206. [Google Scholar] [CrossRef]
- Yuan, Y.; Rezaee, R. Impact of Paramagnetic Minerals on NMR-Converted Pore Size Distributions in Permian Carynginia Shales. Energy Fuels 2019, 33, 2880–2887. [Google Scholar] [CrossRef]
- Keating, K.; Knight, R. A laboratory study of the effect of Fe(II)-bearing minerals on nuclear magnetic resonance (NMR) relaxation measurements. Geophysics 2010, 75, F71–F82. [Google Scholar] [CrossRef]
- Jaeger, F.; Bowe, S.; Van As, H.; Schaumann, G.E. Evaluation of 1H NMR relaxometry for the assessment of pore-size distribution in soil samples. Eur. J. Soil. Sci. 2009, 60, 1052–1064. [Google Scholar] [CrossRef]
- Li, Z.; Shen, X.; Qi, Z.; Hu, R. Study on the pore structure and fractal characteristics of marine and continental shale based on mercury porosimetry, N2 adsorption and NMR methods. J. Nat. Gas Sci. Eng. 2018, 53, 12–21. [Google Scholar] [CrossRef]
- Li, Z.; Qi, Z.; Shen, X.; Hu, R.; Huang, R.; Han, Q. Research on Quantitative Analysis for Nanopore Structure Characteristics of Shale Based on NMR and NMR Cryoporometry. Energy Fuels 2017, 31, 5844–5853. [Google Scholar] [CrossRef]
- Xiao, D.A.S.; Jiang, S.; Thul, D.; Huang, W.B.A.; Lu, Z.Y.; Lu, S.F. Combining rate-controlled porosimetry and NMR to probe full-range pore throat structures and their evolution features in tight sands: A case study in the Songliao Basin, China. Mar. Pet. Geol. 2017, 83, 111–123. [Google Scholar] [CrossRef]
- Bian, H.; Xia, Y.X.; Lu, C.; Qin, X.W.; Meng, Q.B.; Lu, H.F. Pore Structure Fractal Characterization and Permeability Simulation of Natural Gas Hydrate Reservoir Based on CT Images. Geofluids 2020, 2020, 6934691. [Google Scholar] [CrossRef]
- Zhang, Y.; Liu, C.; Liu, L.; Chen, P.; Zhang, Z.; Meng, Q. Sediment pore-structure and permeability variation induced by hydrate formation: Evidence from low field nuclear magnetic resonance observation. Mar. Geol. Quat. Geol. 2021, 41, 193–202. [Google Scholar]
- Kenyon, W.E. Nuclear magnetic resonance as a petrophysical measurement. Nucl. Geophys. 1992, 6, 153–171. [Google Scholar]
- Timur, A. Pulsed Nuclear Magnetic Resonance Studies of Porosity, Movable Fluid, and Permeability of Sandstones. J. Pet. Technol. 1969, 21, 775–786. [Google Scholar] [CrossRef]
- Lei, L.; Seol, Y.; Jarvis, K. Pore-Scale Visualization of Methane Hydrate-Bearing Sediments With Micro-CT. Geophys. Res. Lett. 2018, 45, 5417–5426. [Google Scholar] [CrossRef]
- Lei, L.; Seol, Y.; Choi, J.H.; Kneafsey, T.J. Pore habit of methane hydrate and its evolution in sediment matrix—Laboratory visualization with phase-contrast micro-CT. Mar. Pet. Geol. 2019, 104, 451–467. [Google Scholar] [CrossRef] [Green Version]
- Hu, C.; Liu, X.L.; Jia, Y.G.; Duan, Z.B. Permeability anisotropy of methane hydrate-bearing sands: Insights from CT scanning and pore network modelling. Comput. Geotech. 2020, 123, 103568. [Google Scholar] [CrossRef]
- Zhang, L.X.; Ge, K.; Wang, J.Q.; Zhao, J.F.; Song, Y.C. Pore-scale investigation of permeability evolution during hydrate formation using a pore network model based on X-ray CT. Mar. Pet. Geol. 2020, 113, 104157. [Google Scholar] [CrossRef]
- Zhao, Z.; Zhou, X.P. Pore-scale effect on the hydrate variation and flow behaviors in microstructures using X-ray CT imaging. J. Hydrol. 2020, 584, 124678. [Google Scholar] [CrossRef]
- Chen, J.; Hu, G.W.; Bu, Q.T.; Liu, C.L.; Dong, L.; Wan, Y.Z.; Mao, P.X.; Guo, Y.; Wang, Z.H. Elastic wave velocities of hydrate-bearing sands containing methane gas bubbles: Insights from CT-acoustic observation and theoretical analysis. J. Nat. Gas Sci. Eng. 2021, 88, 103844. [Google Scholar] [CrossRef]
- Kim, S.; Lee, M.; Lee, K.; Ahn, T.; Lee, J. Data-driven estimation of three-phase saturation during gas hydrate depressurization using CT images. J. Pet. Sci. Eng. 2021, 205, 108916. [Google Scholar] [CrossRef]
- Stern, L.A.; Lorenson, T.D.; Pinkston, J.C. Gas hydrate characterization and grain-scale imaging of recovered cores from the Mount Elbert Gas Hydrate Stratigraphic Test Well, Alaska North Slope. Mar. Pet. Geol. 2011, 28, 394–403. [Google Scholar] [CrossRef]
- Graue, A.; Kvamme, B.; Baldwin, B.A.; Stevens, J.; Howard, J.; Aspenes, E.; Ersland, G.; Husebo, J.; Zornes, D. MRI visualization of spontaneous methane production from hydrates in sandstone core plugs when exposed to CO2. Spe J 2008, 13, 146–152. [Google Scholar] [CrossRef]
- Lv, J.C.; Jiang, L.L.; Mu, H.L.; Xue, K.P.; Cheng, Z.C.; Wang, S.J.; Liu, Y. MRI investigation of hydrate pore habits and dynamic seepage characteristics in natural gas hydrates sand matrix. Fuel 2021, 303, 121287. [Google Scholar] [CrossRef]
- Hou, J.; Ji, Y.; Zhou, K.; Liu, Y.; Wei, B. Effect of hydrate on permeability in porous media: Pore-scale micro-simulation. Int. J. Heat Mass Transf. 2018, 126, 416–424. [Google Scholar] [CrossRef]
- Ta, X.H.; Yun, T.S.; Muhunthan, B.; Kwon, T.H. Observations of pore-scale growth patterns of carbon dioxide hydrate using X-ray computed microtomography. Geochem. Geophys. Geosystems 2015, 16, 912–924. [Google Scholar] [CrossRef]
- Chaouachi, M.; Falenty, A.; Sell, K.; Enzmann, F.; Kersten, M.; Haberthür, D.; Kuhs, W.F. Microstructural evolution of gas hydrates in sedimentary matrices observed with synchrotron X-ray computed tomographic microscopy. Geochem. Geophys. Geosystems 2015, 16, 1711–1722. [Google Scholar] [CrossRef] [Green Version]
- Chen, X.; Espinoza, D.N. Ostwald ripening changes the pore habit and spatial variability of clathrate hydrate. Fuel 2018, 214, 614–622. [Google Scholar] [CrossRef]
- Falenty, A.; Kuhs, W.F.; Glockzin, M.; Rehder, G. “Self-Preservation” of CH4 Hydrates for Gas Transport Technology: Pressure–Temperature Dependence and Ice Microstructures. Energy Fuels 2014, 28, 6275–6283. [Google Scholar] [CrossRef]
- Rasekhi, A.; Babaahmadi, A.; Assadsangabi, R.; Nabavizadeh, S.A. Clinical manifestations and MRI findings of patients with hydrated and dehydrated lumbar disc herniation. Acad. Radiol. 2006, 13, 1485–1489. [Google Scholar] [CrossRef]
- Forgacs, A.; Regueiro-Figueroa, M.; Barriada, J.L.; Esteban-Gomez, D.; de Blas, A.; Rodriguez-Bias, T.; Botta, M.; Platas-Iglesias, C. Mono-, Bi-, and TrinUclear Bis-Hydrated Mn2+ Complexes as Potential MRI Contrast Agents. Inorg. Chem. 2015, 54, 9576–9587. [Google Scholar] [CrossRef]
- Gahlot, S.; Gupta, H.; Kulshrestha, V. Hydrated proton self-diffusion study in ion-exchange membranes by MRI and impedance spectroscopy. Polym. Bull 2017, 74, 4437–4452. [Google Scholar] [CrossRef]
- Leone, L.; Guarnieri, L.; Martinelli, J.; Sisti, M.; Penoni, A.; Botta, M.; Tei, L. Rigid and Compact Binuclear Bis-hydrated Gd-complexes as High Relaxivity MRI Agents. Chem-Eur. J. 2021, 27, 11811–11817. [Google Scholar] [CrossRef]
- Zhao, Y.C.; Lei, X.; Zheng, J.N.; Li, M.; Johns, M.L.; Huang, M.X.; Song, Y.C. High resolution MRI studies of CO2 hydrate formation and dissociation near the gas-water interface. Chem. Eng. J. 2021, 425, 131426. [Google Scholar] [CrossRef]
- Yang, M.J.; Song, Y.C.; Zhao, Y.C.; Liu, Y.; Jiang, L.L.; Li, Q.P. MRI measurements of CO2 hydrate dissociation rate in a porous medium. Magn. Reson. Imaging 2011, 29, 1007–1013. [Google Scholar] [CrossRef] [PubMed]
- Song, Y.C.; Wang, S.L.; Yang, M.J.; Liu, W.G.; Zhao, J.F.; Wang, S.R. MRI measurements of CO2-CH4 hydrate formation and dissociation in porous media. Fuel 2015, 140, 126–135. [Google Scholar] [CrossRef]
- Zheng, J.N.; Jiang, L.L.; Wang, P.F.; Zhou, H.; Yang, M.J. MRI observation of CO2-C3H8 hydrate-induced water migration in glass sand. Chem. Eng. Sci. 2019, 207, 1096–1106. [Google Scholar] [CrossRef]
- Zhang, L.X.; Sun, L.J.; Lu, Y.; Kuang, Y.M.; Ling, Z.; Yang, L.; Dong, H.S.; Yang, S.X.; Zhao, J.F.; Song, Y.C. Molecular dynamics simulation and in-situ MRI observation of organic exclusion during CO2 hydrate growth. Chem. Phys. Lett. 2021, 764, 138287. [Google Scholar] [CrossRef]
- Gao, S.Q.; House, W.; Chapman, W.G. NMR/MRI study of clathrate hydrate mechanisms. J. Phys. Chem. B 2005, 109, 19090–19093. [Google Scholar] [CrossRef]
- Bohrmann, G.; Kuhs, W.F.; Klapp, S.A.; Techmer, K.S.; Klein, H.; Murshed, M.M.; Abegg, F. Appearance and preservation of natural gas hydrate from Hydrate Ridge sampled during ODP Leg 204 drilling. Mar. Geol. 2007, 244, 1–14. [Google Scholar] [CrossRef]
- Hou, G.; Liang, D.; Li, X. Experimental study on hydrate anti-agglomeration in the presence of rhamnolipid. RSC Adv. 2018, 8, 39511–39519. [Google Scholar] [CrossRef] [Green Version]
- Lee, S.; Park, S.; Lee, Y.; Seo, Y. Thermodynamic and C-13 NMR spectroscopic verification of methane-carbon dioxide replacement in natural gas hydrates. Chem. Eng. J. 2013, 225, 636–640. [Google Scholar] [CrossRef]
- Siuda, P.; Sadlej, J. Calculations of NMR properties for sI and sII clathrate hydrates of carbon dioxide. Chem. Phys. 2014, 433, 31–41. [Google Scholar] [CrossRef]
- Cha, M.J.; Shin, K.; Lee, H.; Moudrakovski, I.L.; Ripmeester, J.A.; Seo, Y. Kinetics of Methane Hydrate Replacement with Carbon Dioxide and Nitrogen Gas Mixture Using in Situ NMR Spectroscopy. Environ. Sci. Technol. 2015, 49, 1964–1971. [Google Scholar] [CrossRef] [Green Version]
- Lu, H.; Tsuji, Y.; Ripmeester, J.A. Stabilization of Methane Hydrate by Pressurization with He or N2 Gas. J. Phys. Chem. B 2007, 111, 14163–14168. [Google Scholar] [CrossRef] [PubMed]
- Lu, H.; Wang, J.; Liu, C.; Ratcliffe, C.I.; Becker, U.; Kumar, R.; Ripmeester, J. Multiple H2 occupancy of cages of clathrate hydrate under mild conditions. J. Am. Chem. Soc. 2012, 134, 9160–9162. [Google Scholar] [CrossRef] [PubMed]
- Baldwin, B.A.; Stevens, J.; Howard, J.J.; Graue, A.; Kvamme, B.; Aspenes, E.; Ersland, G.; Husebø, J.; Zornes, D.R. Using magnetic resonance imaging to monitor CH4 hydrate formation and spontaneous conversion of CH4 hydrate to CO2 hydrate in porous media. Magn. Reson. Imaging 2009, 27, 720–726. [Google Scholar] [CrossRef] [PubMed]
- Ersland, G.; Husebo, J.; Graue, A.; Baldwin, B.A.; Howard, J.; Stevens, J. Measuring gas hydrate formation and exchange with CO2 in Bentheim sandstone using MRI tomography. Chem. Eng. J. 2010, 158, 25–31. [Google Scholar] [CrossRef]
- Yang, M.; Song, Y.; Jiang, L.; Zhu, N.; Liu, Y.; Zhao, Y.; Dou, B.; Li, Q. CO2 Hydrate Formation and Dissociation in Cooled Porous Media: A Potential Technology for CO2 Capture and Storage. Environ. Sci. Technol. 2013, 47, 9739–9746. [Google Scholar] [CrossRef]
- Mitchell, J.; Chandrasekera, T.C.; Holland, D.J.; Gladden, L.F.; Fordham, E.J. Magnetic resonance imaging in laboratory petrophysical core analysis. Phys. Rep. 2013, 526, 165–225. [Google Scholar] [CrossRef]
- Xue, K.; Zhao, J.; Song, Y.; Liu, W.; Lam, W.; Zhu, Y.; Liu, Y.; Cheng, C.; Liu, D. Direct Observation of THF Hydrate Formation in Porous Microstructure Using Magnetic Resonance Imaging. Energies 2012, 5, 898–910. [Google Scholar] [CrossRef] [Green Version]
- Li, C.; Liu, C.; Hu, G.; Sun, J.; Hao, X.; Liu, L.; Meng, Q. Investigation on the Multiparameter of Hydrate-Bearing Sands Using Nano-Focus X-Ray Computed Tomography. J. Geophys. Res. Solid Earth 2019, 124, 2286–2296. [Google Scholar] [CrossRef]
- Uchida, T.; Lu, H.; Tomaru, H. Subsurface Occurrence of Natural Gas Hydrate in the Nankai Trough Area: Implication for Gas Hydrate Concentration. Resour. Geol. 2004, 54, 35–44. [Google Scholar] [CrossRef]
- Jin, S.; Takeya, S.; Hayashi, J.; Nagao, J.; Kamata, Y.; Ebinuma, T.; Narita, H. Structure Analyses of Artificial Methane Hydrate Sediments by Microfocus X-ray Computed Tomography. Jpn. J. Appl. Phys. 2004, 43, 5673–5675. [Google Scholar] [CrossRef]
- Zhang, L.; Sun, L.; Sun, M.; Lv, X.; Dong, H.; Miao, Y.; Yang, L.; Song, Y.; Zhao, J. Analyzing spatially and temporally visualized formation behavior of methane hydrate in unconsolidated porous media. Magn. Reson. Imaging 2019, 61, 224–230. [Google Scholar] [CrossRef] [PubMed]
- Yang, L.; Zhang, C.; Cai, J.; Lu, H. Experimental Investigation of Spontaneous Imbibition of Water into Hydrate Sediments Using Nuclear Magnetic Resonance Method. Energies 2020, 13, 445. [Google Scholar] [CrossRef] [Green Version]
- Song, Y.; Wang, S.; Cheng, Z.; Huang, M.; Zhang, Y.; Zheng, J.; Jiang, L.; Liu, Y. Dependence of the hydrate-based CO2 storage process on the hydrate reservoir environment in high-efficiency storage methods. Chem. Eng. J. 2021, 415, 128937. [Google Scholar] [CrossRef]


| Nucleus | Natural Abundance (%) | Spin Quantum Number (I) | Gyromagnetic Ratio (γ) (107 rad s−1 T−1) | Sensitivity Relative to 1H |
|---|---|---|---|---|
| 1H | 99.98 | 1/2 | 26.75 | 100 |
| 2H | 0.02 | 1 | 4.11 | 1.45 × 10⁻⁶ |
| 11B | 80.42 | 3/2 | 8.58 | 0.13 |
| 13C | 1.11 | 1/2 | 6.73 | 1.76 × 10⁻⁴ |
| 14N | 99.63 | 1 | 1.93 | 1.00 × 10⁻³ |
| 19F | 100 | 1/2 | 25.18 | 0.83 |
| 31P | 100 | 1/2 | 10.84 | 0.07 |
| 17O | 0.04 | 5/2 | −3.63 | 1.08 × 10⁻⁵ |
| Year | Hydrate | P1 (μs) | P2 (μs) | TW (s) | TE (ms) | NECH | Scan Time | References |
|---|---|---|---|---|---|---|---|---|
| 2017 | CO2 hydrate | / | / | / | 0.24 | 10,000 | / | [45] |
| 2017 | CO2 hydrate | / | / | / | 0.24 | 10,000 | / | [52] |
| 2018 | CH4 hydrate | / | / | 6.00 | 0.1 | 10,000 | 4 | [30] |
| 2019 | CH4 hydrate | / | / | / | 0.17 | 18,000 | / | [66] |
| 2020 | CH4 hydrate | / | / | / | 0.17 | 18,000 | / | [47] |
| 2020 | CO2-CH4 hydrate | 14.4 | 29.5 | 15 | 2.00 | 4096 | 16 | [67] |
| 2020 | CH4 hydrate | / | / | 1.5 | / | 9259 | 2 | [55] |
| 2021 | Xenon hydrate | / | / | 5 | 0.4 | 10,000 | 8 | [56,68] |
| Porous Media | Pore Size (μm) | Gas | Hydrate | T2 (ms) | References | |||||
|---|---|---|---|---|---|---|---|---|---|---|
| Water | Gas | Hydrate | ||||||||
| Porous Confined Water | Bulk Water | Absorbed Gas | Porous Confined Gas | Bulk Gas | ||||||
| Berea sandstone | 20 | CH4 | CH4 hydrate | 460 | 2000 | / | / | 1000–2000 | 0.02 | [73] |
| Coal | / | CH4 | / | / | / | / | 240–2000 | <240 | / | [31] |
| Shale | / | CH4 | / | / | / | 0.1–11 | 11–270 | 270–2500 | / | [75] |
| Shale | / | C2H6 | / | / | / | 0.1–11 | 11–270 | 270–2500 | / | |
| Shale | 0.002–0.2 | CH4 | / | / | / | 0.1–1 | 1–50 | 50–2000 | / | [76] |
| Sandstone | / | CH4 | CH4 hydrate | 0.2–1000 | / | / | / | / | / | [47] |
| Unconsolidated sandstone | / | CH4 | CH4 hydrate | 10–2000 | / | / | / | / | / | [30] |
| Brea sandstone | / | CH4 | CH4 hydrate | 0.1–500 | / | / | / | / | / | |
| Consolidated sandstone | / | CH4 | CH4 hydrate | 1–2000 | / | / | / | / | / | |
| Tight sandstone | / | CH4 | CH4 hydrate | 0.2–200 | / | / | / | / | / | |
| Mineral powders | 0–110 | / | THF hydrate | 100–800 | / | / | / | / | 0.1–1 | [77] |
| Material | Transverse Surface Relaxivity (μm/s) | References |
|---|---|---|
| Quartz | 5–55 | [56,95] |
| Calcite | 0–5 | [95] |
| Illite | 0.5–2.5 | [96] |
| Clay minerals | 0.06–0.3 | [97] |
| Pyrite | 1.2–1.8 | [97,98] |
| Shale | 0.11–0.39 | [97,98] |
| Sandstone | 21–187 | [53,99] |
| Berea sand | 135.9 | [53] |
| Quartzitic sand | 27.3 | [68] |
| Method | Parameter for Phase Distinction | Resolution | Measurement Range | Scan Time | 2D/3D |
|---|---|---|---|---|---|
| NMR T2 | Relaxation time | 10 nm | 10 nm–1 mm | About 1 minute | 2D data |
| CT | Attenuation coefficient | 1–40 μm [103,107,108,110,111,112] | 1 μm–centimeter | Few seconds–76 h [107,108,110] * | 3D image |
| MRI | Relaxation time | 55–234 μm [126,128] | 55 μm–1 mm | About 3 min [126,130] | 3D image |
| Cryo-SEM | Gray scale | Nanoscale [114,121,132,133] | Nanometer–centimeter | Few seconds | 2D image |
| 13C solid-state NMR | Chemical shift | Molecular-level | Molecular-level | Few minutes | 2D data |
Publisher’s Note: MDPI stays neutral with regard to jurisdictional claims in published maps and institutional affiliations. |
© 2022 by the authors. Licensee MDPI, Basel, Switzerland. This article is an open access article distributed under the terms and conditions of the Creative Commons Attribution (CC BY) license (https://creativecommons.org/licenses/by/4.0/).
Share and Cite
Liu, B.; Zhan, L.; Lu, H.; Zhang, J. Advances in Characterizing Gas Hydrate Formation in Sediments with NMR Transverse Relaxation Time. Water 2022, 14, 330. https://doi.org/10.3390/w14030330
Liu B, Zhan L, Lu H, Zhang J. Advances in Characterizing Gas Hydrate Formation in Sediments with NMR Transverse Relaxation Time. Water. 2022; 14(3):330. https://doi.org/10.3390/w14030330
Chicago/Turabian StyleLiu, Biao, Linsen Zhan, Hailong Lu, and Jiecheng Zhang. 2022. "Advances in Characterizing Gas Hydrate Formation in Sediments with NMR Transverse Relaxation Time" Water 14, no. 3: 330. https://doi.org/10.3390/w14030330