Article

Impact of Dissolved Oxygen on the Performance and Microbial Dynamics in Side-Stream Activated Sludge Hydrolysis Process

1
National Demonstration Center for Experimental Water Resources and Hydro-Electric Engineering Education, Xi’an University of Technology, Xi’an 710048, China
2
Department of Municipal and Environmental Engineering, Xi’an University of Technology, Xi’an 710048, China
3
State Key Laboratory of Eco-Hydraulics in Northwest Arid Region, Xi’an University of Technology, Xi’an 710048, China
4
Shaanxi Key Laboratory of Earth Surface System and Environmental Carrying Capacity, College of Urban and Environmental Sciences, Northwest University, Xi’an 710127, China
*
Authors to whom correspondence should be addressed.
Water 2023, 15(11), 1977; https://doi.org/10.3390/w15111977
Submission received: 24 March 2023 / Revised: 10 May 2023 / Accepted: 18 May 2023 / Published: 23 May 2023
(This article belongs to the Special Issue Water-Sludge-Nexus)

Abstract

:
Dissolved oxygen (DO) plays an important role in the performance of biological wastewater treatment systems. This study investigated the effect of the DO concentration on nutrient removal performance and microbial community structure in side-stream activated sludge hydrolysis (SSH) and conventional anaerobic/anoxic/aerobic (A2O) processes. The results showed that the change in DO had little effect on the removal performance of chemical oxygen demand (COD), and the removal efficiencies were about 90% for both reactors. Compared with the high DO level (4.1–6.9 mg/L), the A2O and SSH reactors had better nitrogen removal performance at low (0.5–2.2 mg/L) and moderate (2.2–3.9 mg/L) DO levels, with ammonia (NH4+-N) removal efficiencies of 88–89% and 89–91%, respectively, and total nitrogen (TN) removal efficiencies of 74–76% and 75–81%, respectively. Directly reducing the DO concentration from high to low reduced the phosphate removal efficiencies of the A2O and SSH reactors from 80.2% and 86.2% to 63.1% and 70.6%, respectively, while re-elevating the DO concentration to moderate levels significantly improved the phosphate removal efficiencies to 94.6% and 96.0%, respectively. Compared to the A2O reactor, the SSH reactor had more stable and better nutrient removal performance under different DO conditions, partly due to the additional carbon sources produced through the sludge fermentation in the side-stream reactor. The decrease in the DO concentration resulted in a decrease in the relative abundance of Acinetobacter but an increase in the relative abundance of Competibacter, potentially leading to the deterioration in phosphorus removal.

1. Introduction

With the rapid development of urbanization, the increasing anthropogenic discharge of nitrogen (N) and phosphorus (P) nutrients in water bodies leads to more prominent water environment problems such as eutrophication and water quality deterioration [1]. Wastewater treatment plants (WWTPs) play a critical role in nutrient removal. The anaerobic–anoxic–aerobic (A2O) process is one of the most commonly used biological nutrient removal (BNR) processes [2,3], which facilitates various functional populations to complete the transformation and removal of N and P. For example, ammonia (NH4+-N) is oxidized to nitrate (NO3-N) (i.e., nitrification) under aerobic conditions by ammonia-oxidizing bacteria (AOB) and nitrite-oxidizing bacteria (NOB), and then reduced to nitrogen gas (i.e., denitrification) under anoxic conditions by denitrifying bacteria (DNB) [4]. Enhanced biological P removal (EBPR) is accomplished by polyphosphate (polyP) accumulating organisms (PAOs), which anaerobically assimilate and reserve volatile fatty acids (VFAs) as polyhydroxyalkanoates (PHAs) and later use them for aerobic or anoxic P uptake [5]. However, the A2O process always experiences unstable performance due to insufficient influent carbon source, hydraulic shock, and the impact of excessive nitrate loading [1,6,7,8], etc.
Side-stream sludge hydrolysis (SSH) is proposed as a novel BNR process to address common challenges related to weak wastewater influent [7,9]. SSH is achieved by setting up the anaerobic reactor in the side-stream for generating internal carbon sources, such as volatile fatty acids (VFAs), through hydrolysis and fermentation of the return activated sludge (RAS) or mixed liquor. Compared to the conventional BNR process, SSH has several advantages including (1) improved P removal performance and stability without relying on external carbon sources and chemical dosing, (2) enhanced denitrification performance due to effectively alleviating competition for influent carbon sources between DNB and PAOs, and (3) increased tolerance to influent fluctuations [7,9,10,11]. SSH has been successfully applied to several WWTPs worldwide [10,11]. Recently, several studies have compared P removal performance and related key functional populations of SSH processes with conventional BNR processes at full-scale [10,11] and lab-scale [8], where the impact of the influent food-to-microorganism (F/M) ratio has been studied. However, the impact of other operational and environmental factors is still unknown; thus, corresponding studies are needed for better process design and wider applications.
Dissolved oxygen (DO) is an important parameter for regulating the BNR process [12]. Traditional high-rate BNR processes are operated under extensive aeration conditions to ensure efficient nitrification and P removal [13,14]. However, from the perspective of improving the energy efficiency of WWTPs, extensive aeration is not desirable, as it usually requires the most significant WWTP energy consumption, accounting for about 45–75% of energy costs [15]. It has been reported that energy consumption in WWTPs can be saved by 10% when the DO concentration decreases from 2 mg/L to 0.5 mg/L [16]. Reducing aeration would also reduce carbon dioxide emissions, contributing to achieving carbon neutrality in WWTPs [17,18]. In addition, a high DO of >4.5 mg/L would lead to overgrowth of glycogen accumulating organisms (GAOs) [5,19,20], which compete with PAOs for VFA uptake but do not contribute to P uptake [21]. Deteriorated EBPR process performance due to high relative GAO-to-PAO abundance has been observed in many studies [22,23]. Lower DO of 2.5–3.0 mg/L was observed to be associated with PAO dominance and high P removal [5,19,20]. Carvalheira et al. [24] demonstrated the lower oxygen affinity of GAOs compared to PAOs, which allows higher PAO activity at low DO levels. However, at a very low DO of 0.15–0.45 mg/L, variable P removal efficiency of 60–99% has been achieved [25,26], which needs further investigation. For N removal, high DO levels inhibit the denitrification process [27], while low DO levels promote nitrite accumulation and N removal in the form of partial nitrification–denitrification (PND), due to AOB’s greater oxygen affinity to NOB [4]. However, several drawbacks have also been reported at low DO levels, such as reduced nitrification rates [28], increased nitrous oxide emissions [29], promotion of secondary P release [30], and sludge bulking [31]. Although the effect of the DO concentrations on the BNR process has been extensively studied, the comparative analysis of performance variations between SSH and conventional BNR processes at different DO concentrations is limited. The impact of the DO input, via the RAS into the side-stream anaerobic reactor, on nutrient removal performance is still unknown. In addition, few studies focused on the microbial community structure and key functional populations that drive the SSH process under different DO conditions.
Therefore, the objective of this study was to (1) compare the removal performance of chemical oxygen demand (COD), N, and P between two lab-scale reactors operating in A2O and SSH configurations at various DO concentrations; (2) analyze the P mass balance, (3) the EBPR metabolic activity, and (4) the dynamic changes in the microbial community structure and functional populations to reveal the mechanisms involved. This study will provide support for the design and optimization of the SSH process in WWTPs in an economically effective and environmentally sustainable manner.

2. Materials and Methods

2.1. Reactor Setup and Operational Conditions

Two lab-scale continuous-flow reactors were operated in A2O and SSH configurations (Figure 1) with the same dimensions and working volumes, 2 L, 4 L, 4 L, 16 L, and 4 L, respectively, for the pre-anoxic tank, anaerobic tank, anoxic tank, aerobic tank, and secondary clarifier. In the A2O reactor, the pre-anoxic tank was installed to denitrify the RAS to minimize the nitrate load entering the anaerobic tank. Compared to the A2O reactor, the pre-anoxic and anaerobic tanks in the SSH reactor were installed in the side-stream for RAS hydrolysis and fermentation, with the direct transfer of influent to the anoxic tank. In this study, 30% of the RAS was split into the side-stream tanks, while 70% was directly diverted to the mainstream anoxic tank. The detailed operating parameters, including sludge retention time (SRT), hydraulic retention time (HRT), and the influent flow rate for each reactor during the experiment, are summarized in Table S1.
The two reactors with the same settings were operated for ~1 month to achieve a stable state before the formal experiment. The initial inoculum was activated sludge from Xi’an No.4 WWTP, Shaanxi, China. The concentration of mixed liquor suspended solids (MLSS) in the mainstream reactors was maintained at ~1500 mg/L. In synthetic wastewater, a mixture of acetate (HAc) and propionate (HPr) was used as carbon sources with a COD ratio of 1:1 and a total COD of 400 mg/L. Ammonium chloride and potassium dihydrogen phosphate were used as N and P sources, respectively, resulting in 40 mg N/L NH4+-N and 10 mg P/L phosphate (PO43−-P). Other trace elements were added as previously described [32]. The experiment was divided into three phases based on the different DO concentrations (Table 1).

2.2. Biological P Removal Activity Batch Tests

To evaluate the EBPR activity in the SSH and A2O reactors in three phases, ex situ P release and uptake batch tests were conducted with activated sludge collected in each phase following a previously described protocol [33]. Briefly, fresh sludge samples collected from the end of the aerobic tank were initially aerated for 1 h to remove residual organics. Then the sludge was continuously purged with nitrogen gas. When the anaerobic condition was achieved (DO < 0.1 mg/L), sodium acetate was introduced with an initial COD of 80 mg/L. After maintaining the anaerobic condition for 1 h, the sludge was bubbled with air to maintain the aerobic condition (DO > 2.0 mg/L) for 3 h, and 10 mg P/L was added to allow sufficient phosphorus uptake. During batch tests, pH was maintained at 7.0 ± 0.1 by adding NaOH or HCl. Samples were periodically collected for determination of soluble COD, PO43−-P, and mixed liquor volatile suspended solids (MLVSS).

2.3. Microbial Community Analysis

During the experiment, activated sludge samples were collected from both reactors for DNA extraction and 16S rRNA gene amplicon sequencing. Genomic DNA was extracted using the DNeasy PowerSoil Kit (QIAGEN, Inc., Venlo, The Netherlands). The primers, 515F (GTGCCAGCMGCCGCGGTAA) and 907R (CCGTCAATTCMTTTRAGTTT), were used for PCR amplification of the bacterial 16S rRNA gene. After purification of amplified products via Agencourt AMPure beads (Beckman Coulter, Indianapolis, IN, USA) and quantification via PicoGreen dsDNA Assay Kit (Invitrogen, Carlsbad, CA, USA), a sequencing library was established and Illumina MiSeq platform was used for high-throughput sequencing (Shanghai Personal Biotechnology Co., Ltd., Shanghai, China). Finally, QIIME (v1.8.0) software was used for bioinformatics analysis of sequencing data. Identified microorganisms were linked to their functional information using Activated Sludge Microbial Database (MiDAS: https://www.midasfieldguide.org/guide/search (accessed on 19 May 2023)).

2.4. Chemical Analyses

To evaluate the pollutant removal performance during the experiment, concentrations of COD, NH4+-N, total nitrogen (TN), PO43−-P, MLSS, and MLVSS were analyzed using standard methods [34]. The student’s t-test was used to test the significant difference between the two reactors.

3. Results and Discussion

3.1. Effects of DO on Pollutant Removal Performance

3.1.1. COD Removal Performance

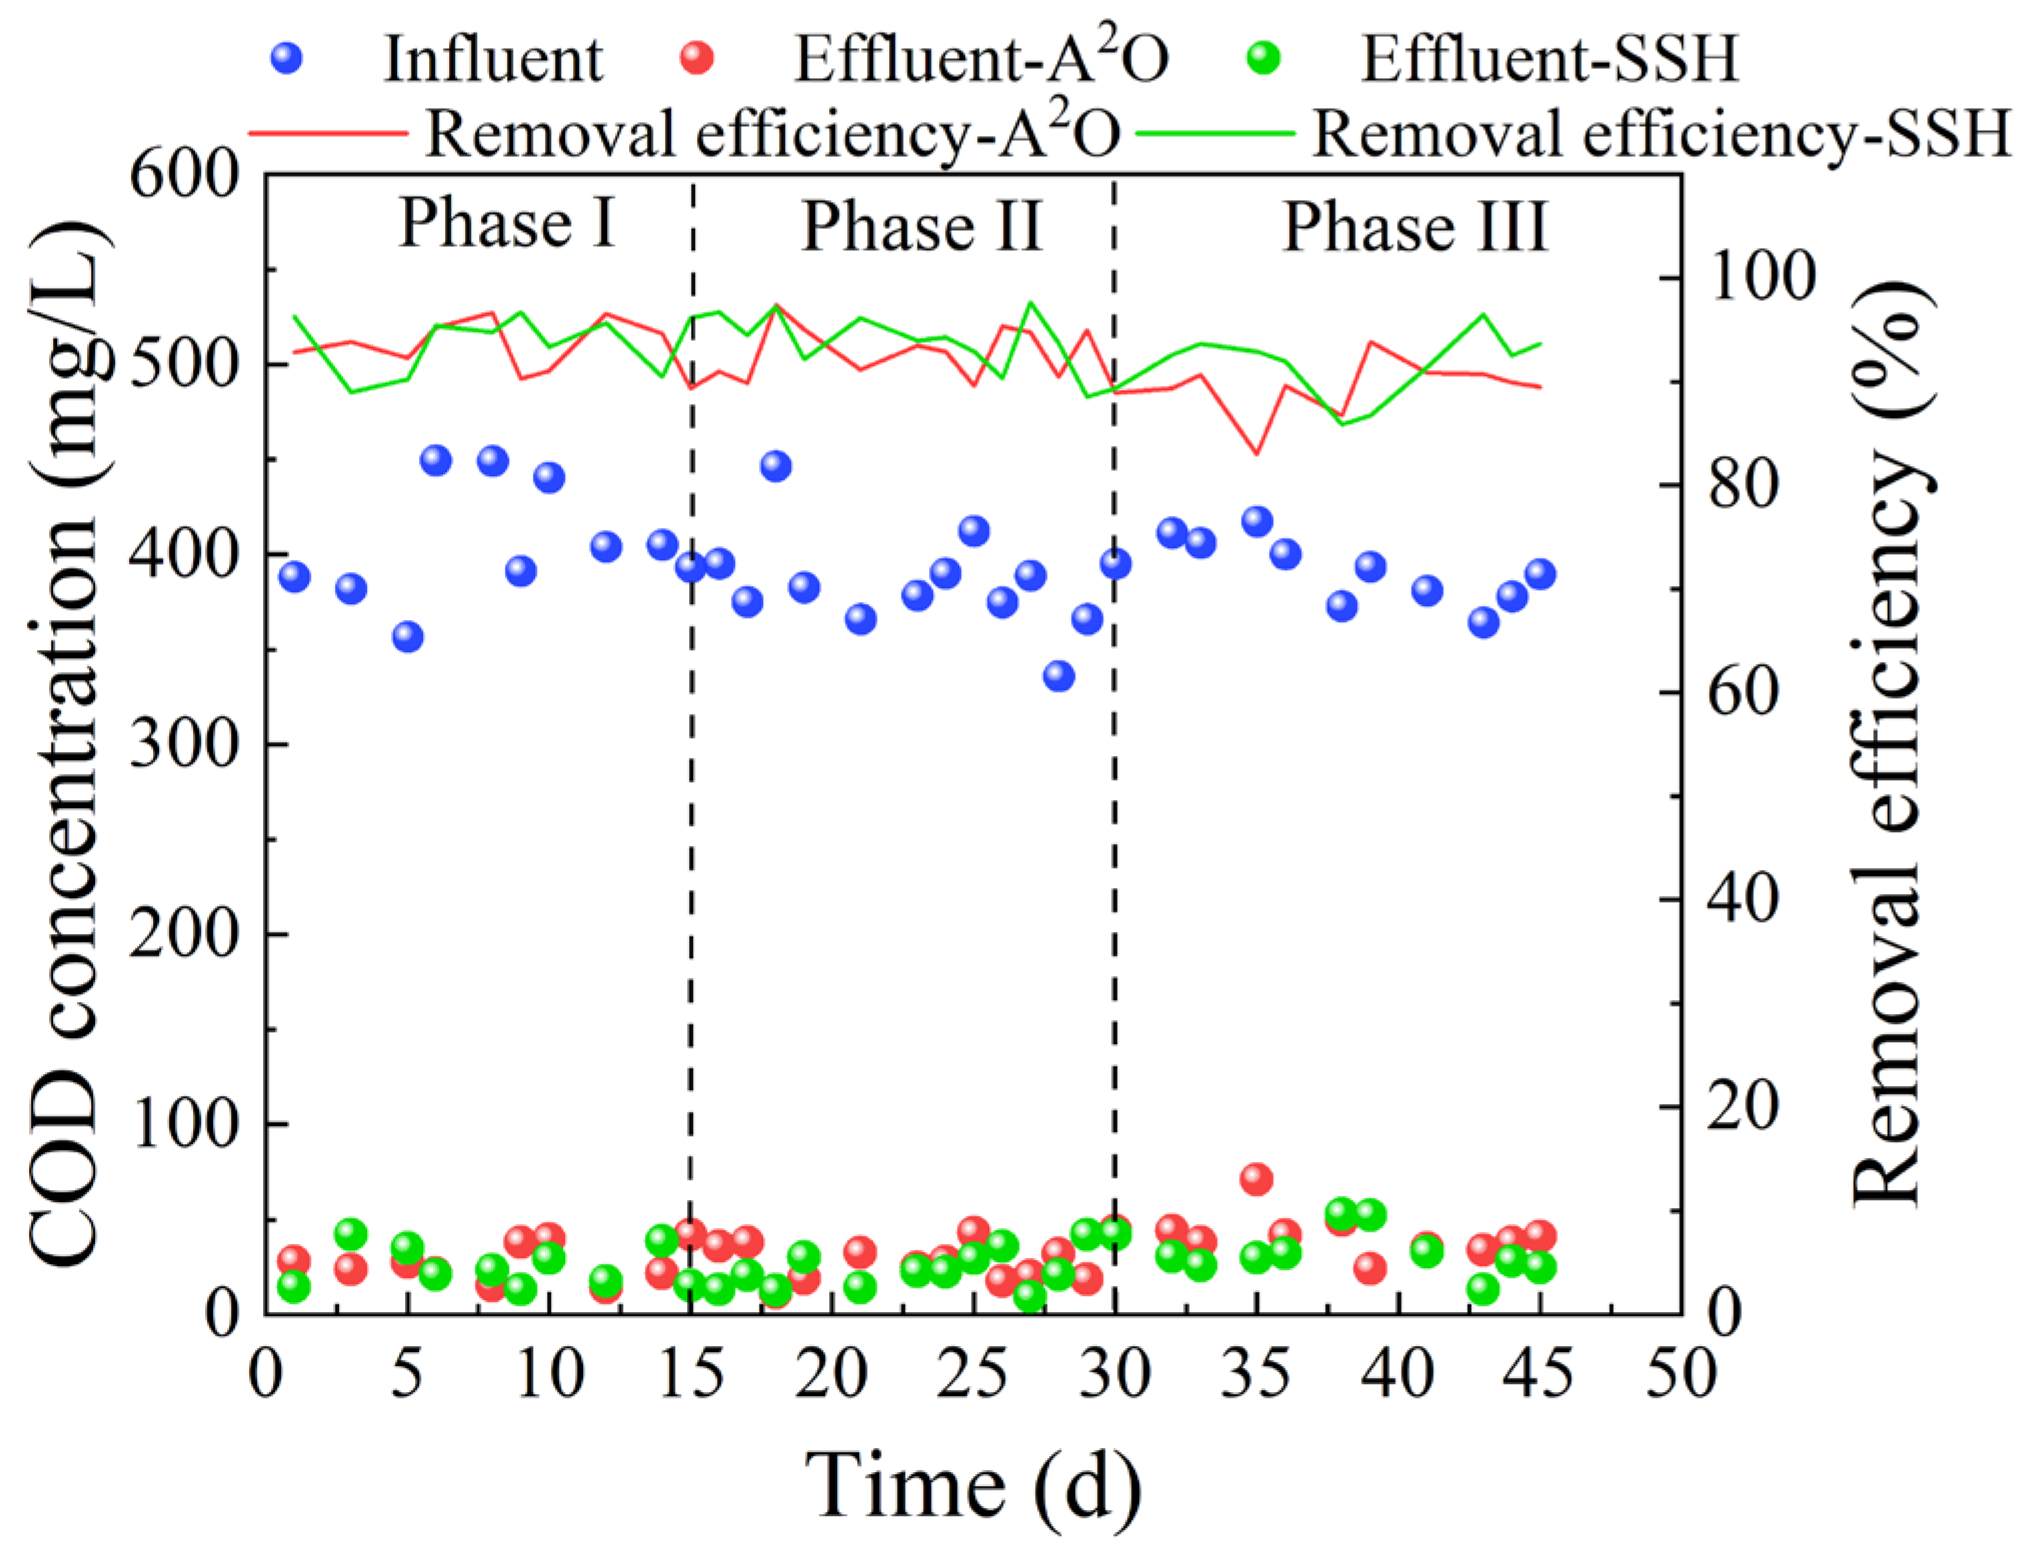
Variations in COD removal performance during each phase of the experiment are shown in Figure 2. In Phase I, the average effluent COD in the A2O and SSH reactors were 27 mg/L and 25 mg/L, respectively, with an average removal efficiency of ~93% for both reactors. As the DO concentration decreased to the low level of 0.5–2.2 mg/L in Phase II and the moderate level of 2.2–3.9 mg/L in Phase III, the COD removal performance in both reactors was generally stable, with a removal efficiency of 91 ± 3% for the A2O and 93 ± 3% for the SSH reactor. Overall, more than 85% of the effluent in both reactors was below 50 mg/L during the experiment, meeting China’s Class 1A Discharge Standard for Municipal WWTPs (Table S2). Even at low DO levels, both reactors maintained stable COD removal performance (93 ± 3%), with all effluent samples meeting the Class 1A Standard. As shown in Figure S1, most influent COD was consumed in the anaerobic and/or anoxic tank before entering the aerobic zone [35,36].

3.1.2. Nitrogen Removal Performance

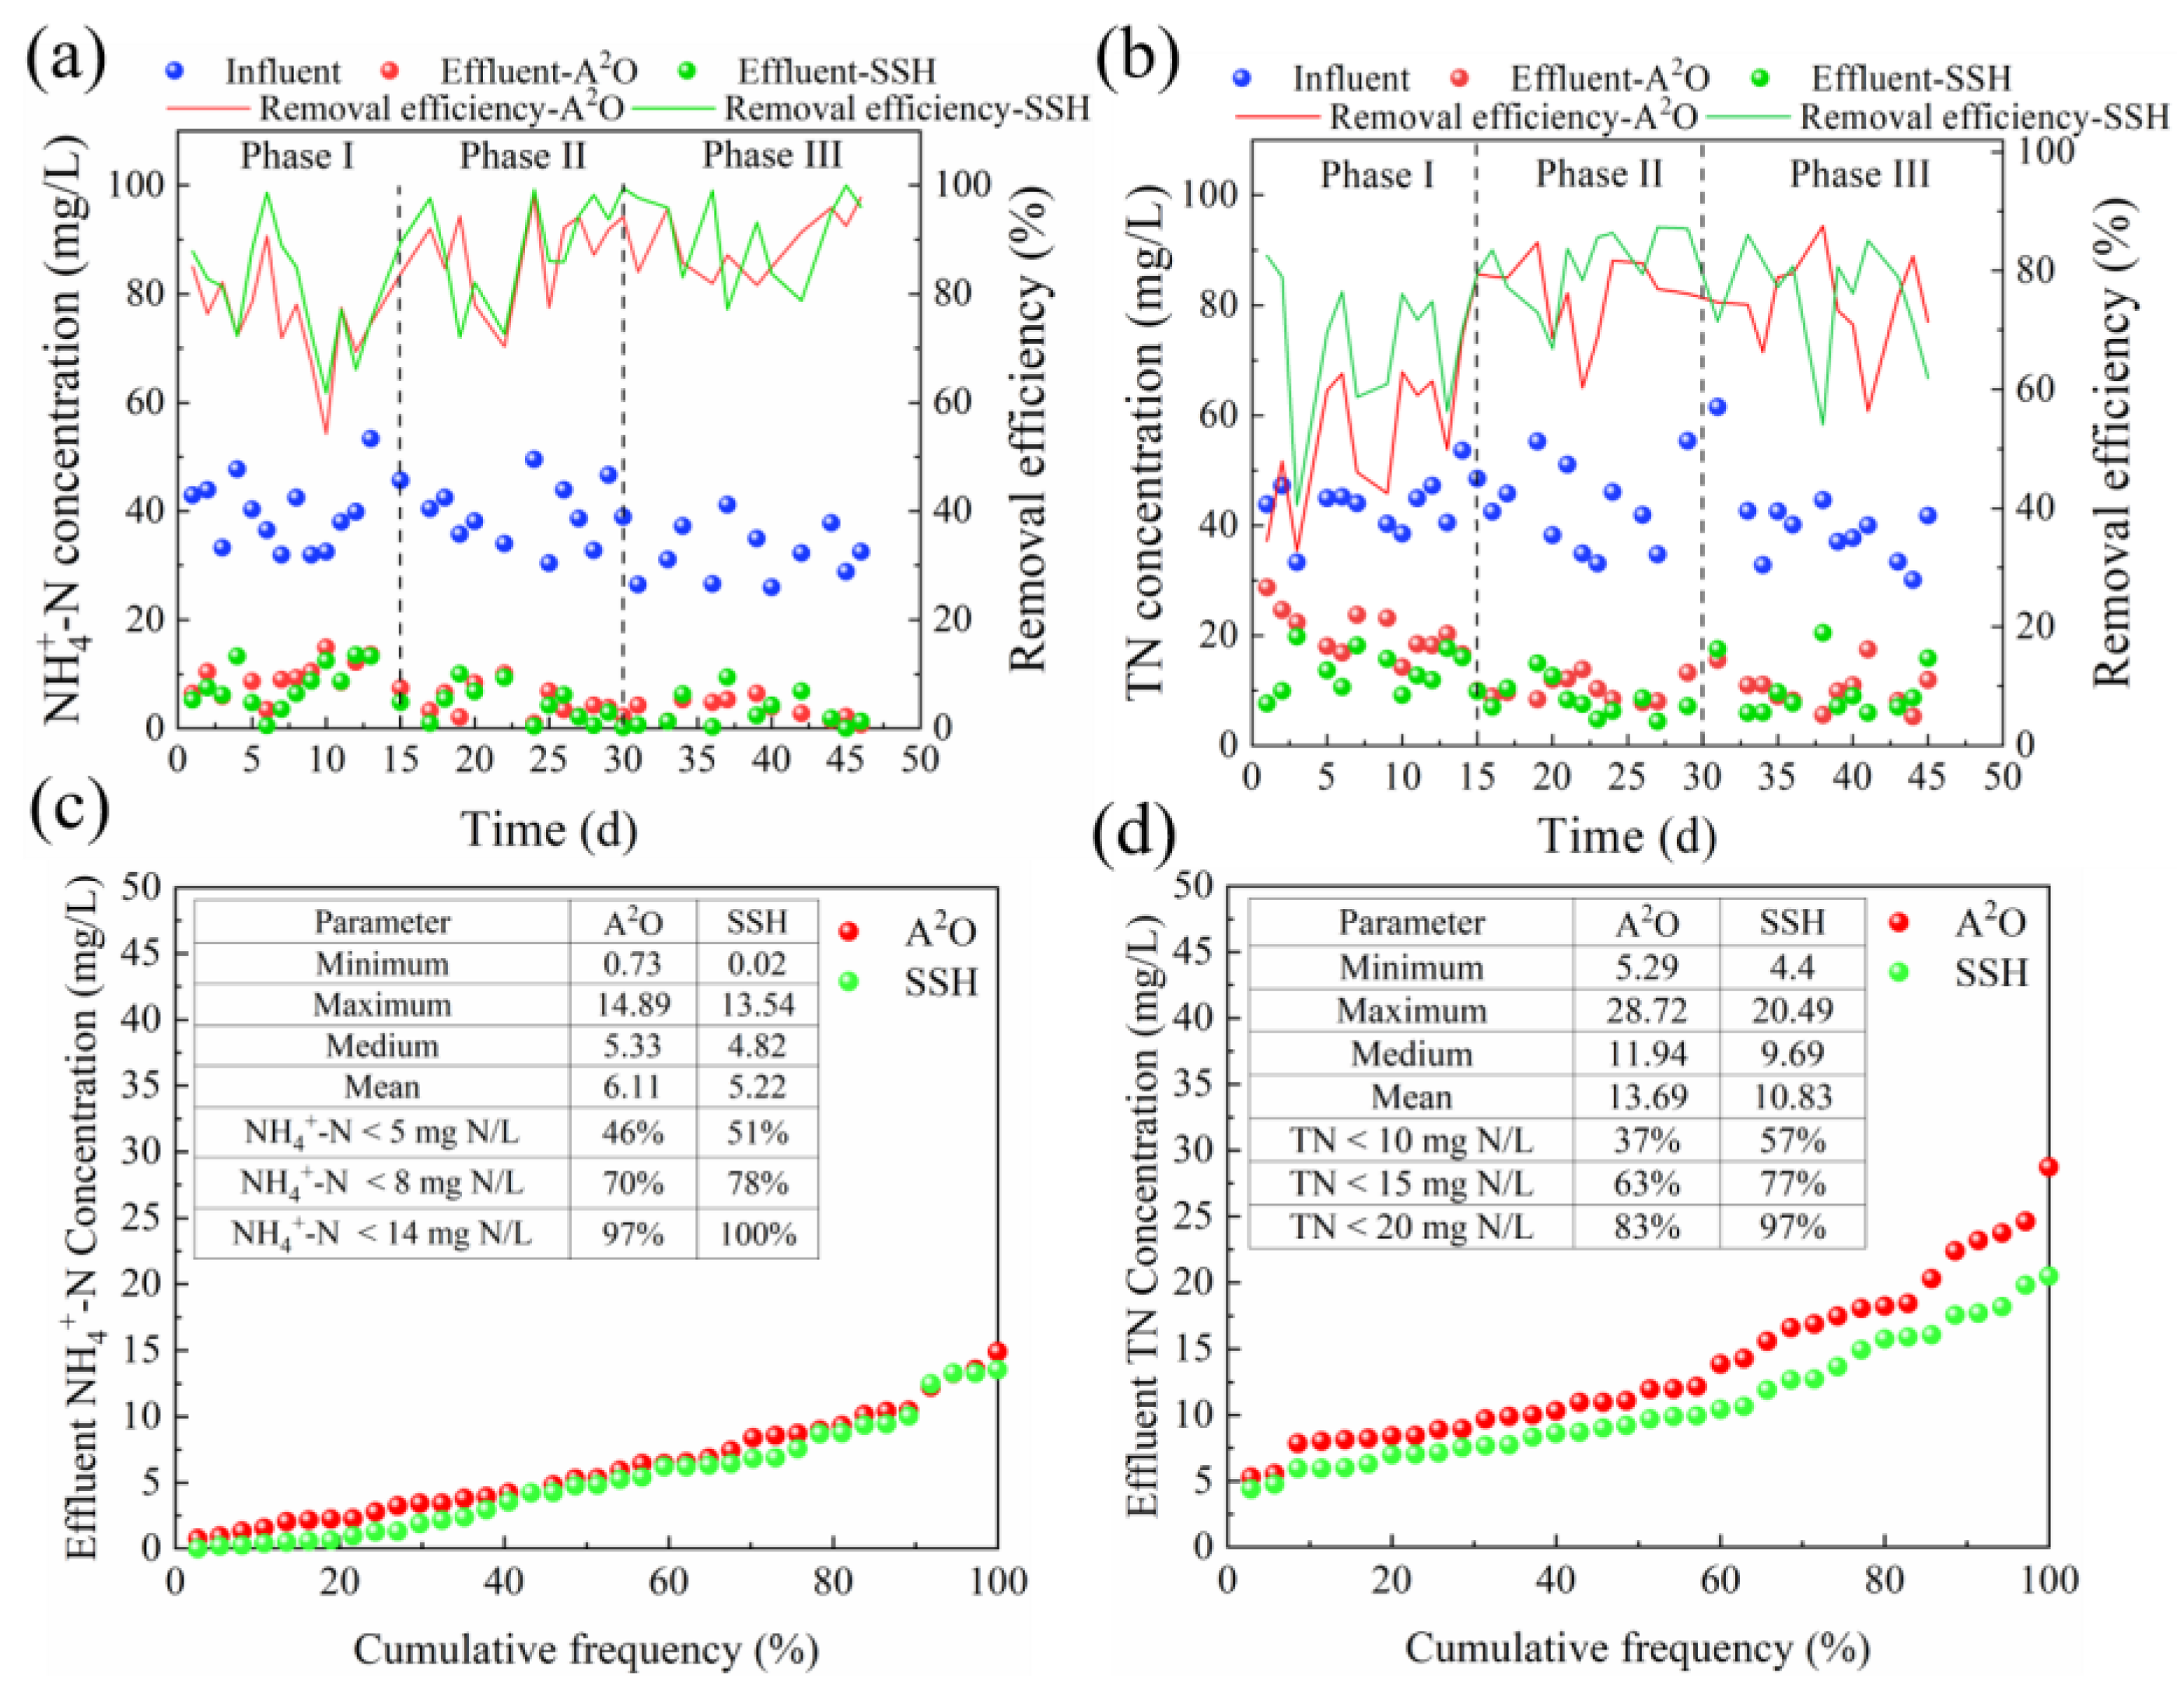
When the DO levels (4.1–6.9 mg/L) were high in Phase I, the average NH4+-N removal efficiencies in the A2O and SSH reactors were only 76% and 80%, respectively (Figure 3a). It has been shown that the size of the activated sludge flocs would decrease due to the shear stress induced by high aeration intensity [37]. The microbial community structure would also be changed under high aeration conditions, with a decrease in relative abundance of AOB and NOB [38]. As the DO concentration decreased to lower levels, including low level in Phase II and moderate level in Phase III, an improved NH4+-N removal performance was observed for both reactors, with removal efficiency of 88 ± 7% for A2O and 90 ± 9% for SSH reactor. To ensure sufficient electron acceptors, the DO concentration was considered to be about 2.0–4.0 mg/L for complete nitrification [14,39]. Therefore, NH4+-N could be completely nitrified at the moderate DO level. Lower DO concentrations, typically from 0.4 to 1.5 mg/L, were found to be beneficial for partial nitrification through nitrite accumulation [40], which may also result in effective NH4+-N removal with reduced oxygen requirements. Although increased AOB and decreased NOB abundance were observed in this study (see Section 3.4.2), further confirmation is still pending as nitrite concentration has not been measured.
At higher DO levels, the average TN removal efficiencies in the A2O and SSH reactors were only 54% and 69%, respectively (Figure 3b) due in part to low NH4+-N removal performance. At the same time, large amounts of oxygen entering the anoxic zone together with the refluxed nitrification liquid may consume portions of COD and inhibit denitrification performance [41,42]. Both reactors performed better at TN removal as the DO concentration decreased to lower levels. In Phase II, the average TN removal efficiencies in the A2O and SSH reactors were 76% and 81%, respectively. Little change was observed in Phase III, with average removal efficiencies of 74% and 75%, respectively.
Compared to the A2O reactor, the SSH reactor had a better NH4+-N removal performance in response to changes in the DO concentration (Figure 3c). The median effluent NH4+-N in the SSH reactor was 4.8 mg/L with 51% of the effluent below 5.0 mg/L, while the median effluent NH4+-N in the A2O reactor was 5.3 mg/L with 46% of the effluent below 5.0 mg/L. Notably better TN removal performance was observed in the SSH reactor (p < 0.05, Figure 3d), with a median effluent TN of 9.7 mg/L and 77% of the effluent below 15.0 mg/L. While the median effluent TN was 11.9 mg/L in the A2O reactor, and 63% of the effluent was below 15.0 mg/L. The better N removal performance in the SSH reactor may be due to more carbon sources available for denitrification. For the A2O reactor, a portion of the influent carbon would be consumed by PAOs and/or GAOs in the anaerobic tank before entering the anoxic tank, while the influent in the SSH reactor went directly to the anoxic tank for denitrification. In addition, additional carbon sources could be generated from hydrolysis and fermentation of the RAS in the side-stream anaerobic tank. The residual carbon in the side-stream tank would then be diverted to the mainstream, thus enhancing denitrification. In addition, NO3-N carried by the RAS into the side-stream tank could be removed by denitrifying PAOs (DPAOs) and denitrifying GAOs (DGAOs) using anaerobically stored internal carbon sources (e.g., PHAs). This is confirmed by the relatively high abundance of Dechloromonas DPAOs (Section 3.4.2). Therefore, the SSH reactor could be operated effectively in low DO conditions without affecting the N removal performance, potentially contributing to energy saving, carbon neutrality, and reduced nitrification liquid reflux.

3.1.3. Phosphorus Removal Performance

At high DO levels, the average PO43−-P removal efficiencies in the A2O and SSH reactors were 80% and 86%, respectively, with an average effluent PO43-P of 1.73 mg/L and 1.19 mg/L, respectively (Figure 4a). At low DO levels, the PO43−-P removal performance significantly decreased, and the highest effluent PO43−-P of the A2O and SSH reactors reached 7.95 mg/L and 5.86 mg/L, respectively, with average PO43−-P removal efficiencies of 63% and 71%, respectively. After the DO level was raised to a moderate level, the PO43−-P removal performance in both reactors improved dramatically, with average PO43−-P removal efficiencies of 95% and 96%, respectively, and an average effluent PO43−-P of 0.49 mg/L and 0.40 mg/L, respectively.
Both the reactors had a higher PO43−-P effluent concentration at high DO concentrations compared with the moderate DO concentrations, which might be attributed to the reduced PO43−-P uptake caused by deceased PHA depletion occurring in an overaerated process [43]. Previous studies had shown that DO-limited conditions are beneficial for enhancing the P removal performance [44], as PAOs have a higher oxygen affinity than GAOs [24,45]. However, a significant decrease in the P removal performance was observed in this study when the DO level decreased to 0.5–2.2 mg/L, possibly due to PAOs’ failure to adapt to rapid DO decline, which was in line with the significant decrease in the relative abundance of PAOs in Phase II (see Section 3.4.2). By contrast, increasing the DO concentration to a moderate level (2.2–3.9 mg/L) allowed for better adaptation of the microbial community, leading to an improved P removal of ~95%. Izadi et al. [46] found that an instantaneous decrease in the DO concentration from 2.0 to 0.4 mg/L induced a decrease in the PAO abundance and a deterioration in the P removal performance, while progressive DO reduction promoted the EBPR performance. These results suggest that a step-wise reduction in the DO concentration may be a good operating strategy for WWTPs to simultaneously save energy consumption and achieve effective P removal.
Compared to the A2O reactor, the SSH reactor had better and more stable PO43−-P removal performance during the experiment (Figure 4b). In SSH reactor, PO43−-P concentration in 81% of the effluent samples was below 2.0 mg/L, compared to 70% in the A2O reactor. The better P removal performance was partially attributed to the longer anaerobic retention time (24 h) in the side-stream tank, which allowed fermentative organisms to degrade complex organic matter in the RAS and produce more VFAs for the EBPR activity [7]. Meanwhile, a lower DO concentration could reduce the amount of DO entering the side-stream tank, which would help maintain deep anaerobic conditions, such as oxidation-reduction potential (ORP) as low as −300 mV, allowing for additional generation of carbon sources for extra nutrient removal.

3.2. Mass Balance of Phosphorus

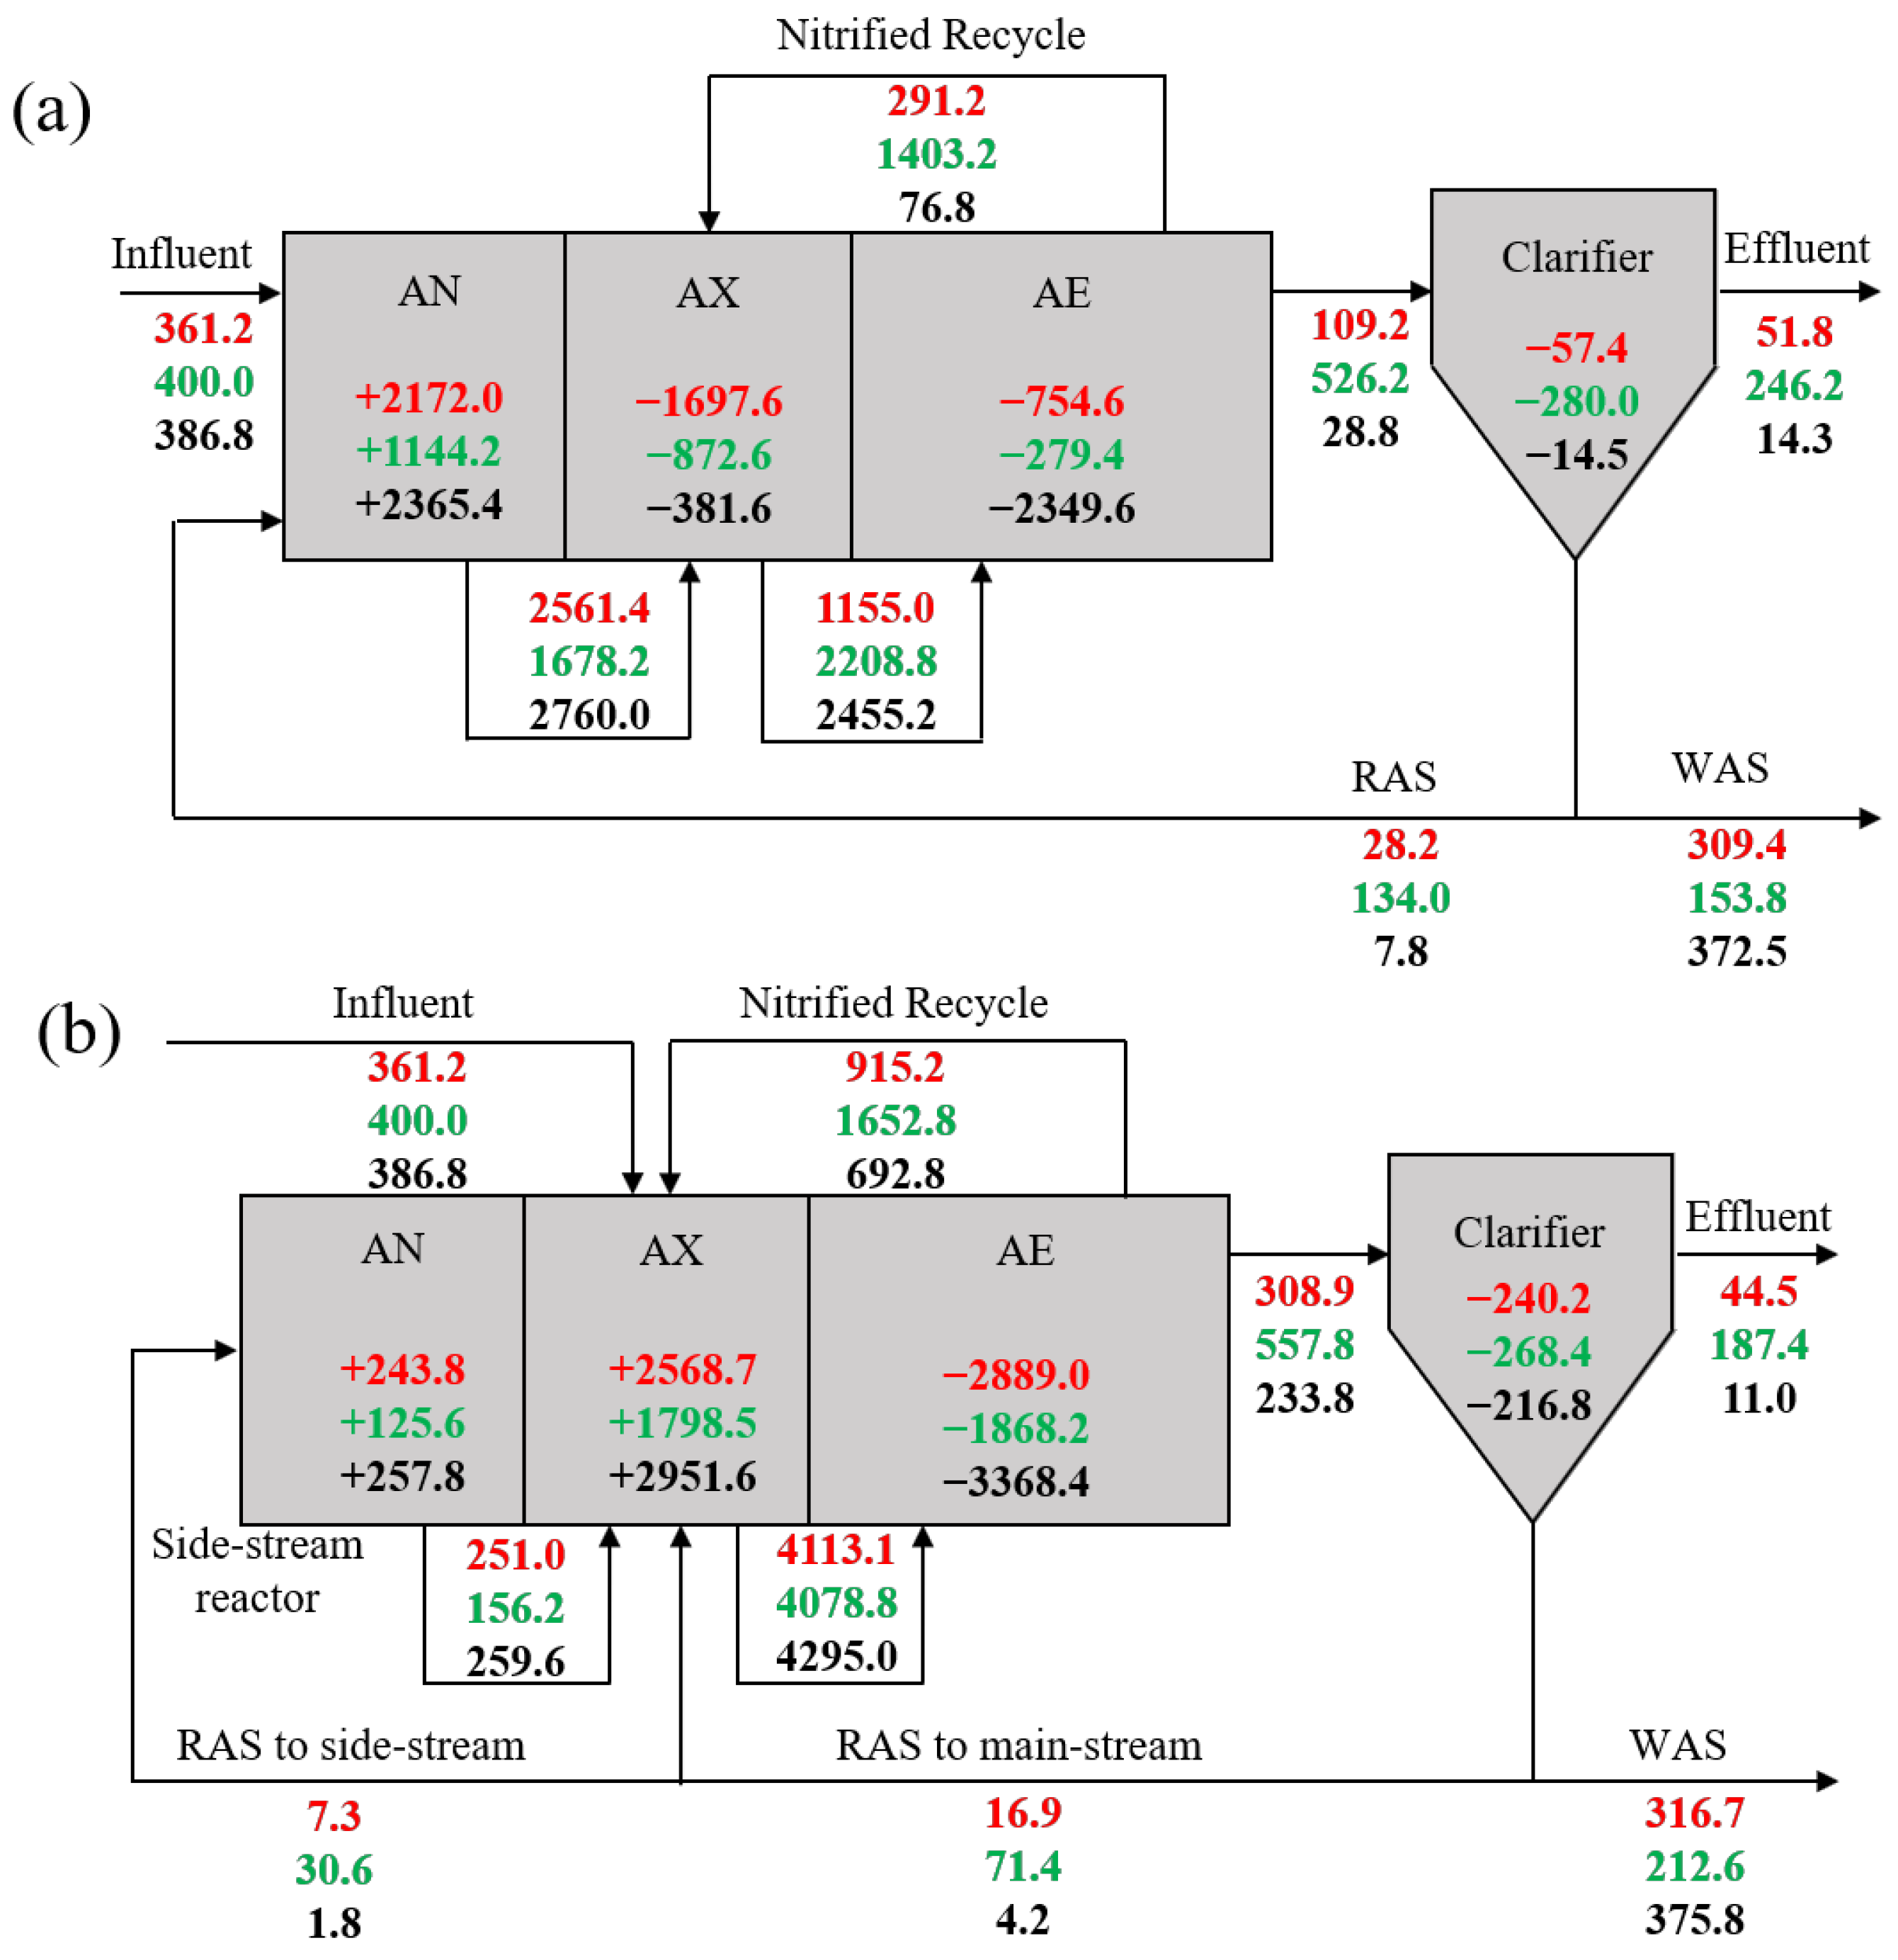
To further elucidate the mechanism of P removal at varying DO concentrations, the PO43−-P mass balance in the A2O and SSH reactors during the experiment was performed. As shown in Figure 5, the decrease in the DO concentration in Phase II resulted in the lowest P uptake in the SSH (1868 mg P/d in aerobic tank) and A2O (1152 mg P/d in anoxic and aerobic tanks) reactors. Meanwhile, the P release also fell to the lowest in Phase II (1144 and 1924 mg P/d in A2O and SSH reactors, respectively). Decreases in the P release and uptake confirmed the deteriorating EBPR performance in Phase II (as noted in Section 3.1.3). Lower P uptake may be partially related to nitrite accumulation, which was caused by inhibition of NOB activity under low DO conditions [4]. NOB inhibition was also confirmed by our microbial population results (Section 3.4.2). It has been observed that the presence of nitrite caused inhibition of aerobic and anoxic P uptake by PAOs [5]. Depressed P uptake would result in limited generation of polyP within PAO cells as an energy source, further reducing the P release and VFA uptake under anaerobic conditions. Accordingly, the COD consumed for the EBPR in Phase II also decreased to 335 and 1970 mg COD/d in the A2O and SSH reactors, respectively (Table S3).
Unlike the P release in the A2O reactor that occurred in the anaerobic tank, significant P release was observed in the anoxic tank of the SSH reactor where the influent was fed, which was also observed in the previous study [11]. A combined P release, in both mainstream anoxic and side-stream anaerobic tanks, resulted in a significantly higher P release in the SSH reactor (1924–3209 mg P/d) than in the A2O reactor (1144–2365 mg P/d). It indicates that PAOs in the SSH reactor assimilated larger amounts of organic matter, through both influent and RAS fermentation, for the synthesis of intracellular PHA, which resulted in increased P uptake in the subsequent aerobic tank (1868–3368 mg P/d) compared to that in the A2O reactor (1152–2731 mg P/d). Consequently, the effluent P load in the SSH reactor (11–187 mg P/d) was lower than that in the A2O reactor (14–246 mg P/d). Therefore, the SSH reactor was not as affected by the DO variations as the A2O reactor, which was attributed to the installation of the anaerobic tank in the side-stream that promotes EBPR performance through RAS hydrolysis and fermentation.

3.3. EBPR Activity

To evaluate the EBPR metabolic activity of sludge in both reactors, the P release and uptake batch tests with acetate (HAc) addition were conducted in different phases. Typical EBPR profiles were observed in these tests, as shown in Figure S2. The calculated kinetic rates and stoichiometric ratios (Table 2) were all within the range reported in other full-scale or lab-scale EBPR systems [10,11,33,47,48]. The anaerobic P release rate has been shown to be positively correlated with the EBPR activity [49]. The lowest P release rate (6.6 and 7.0 mg P/g VSS/h in the A2O and SSH reactors, respectively) was achieved at low DO levels, while the highest (9.2 and 11.0 mg P/g VSS/h in the A2O and SSH reactors, respectively) was achieved at moderate DO levels, which was consistent with the P removal performance results (Section 3.1.3). In addition, the P release rates in the SSH reactor in all phases were higher than in the A2O reactor, suggesting higher EBPR activity.
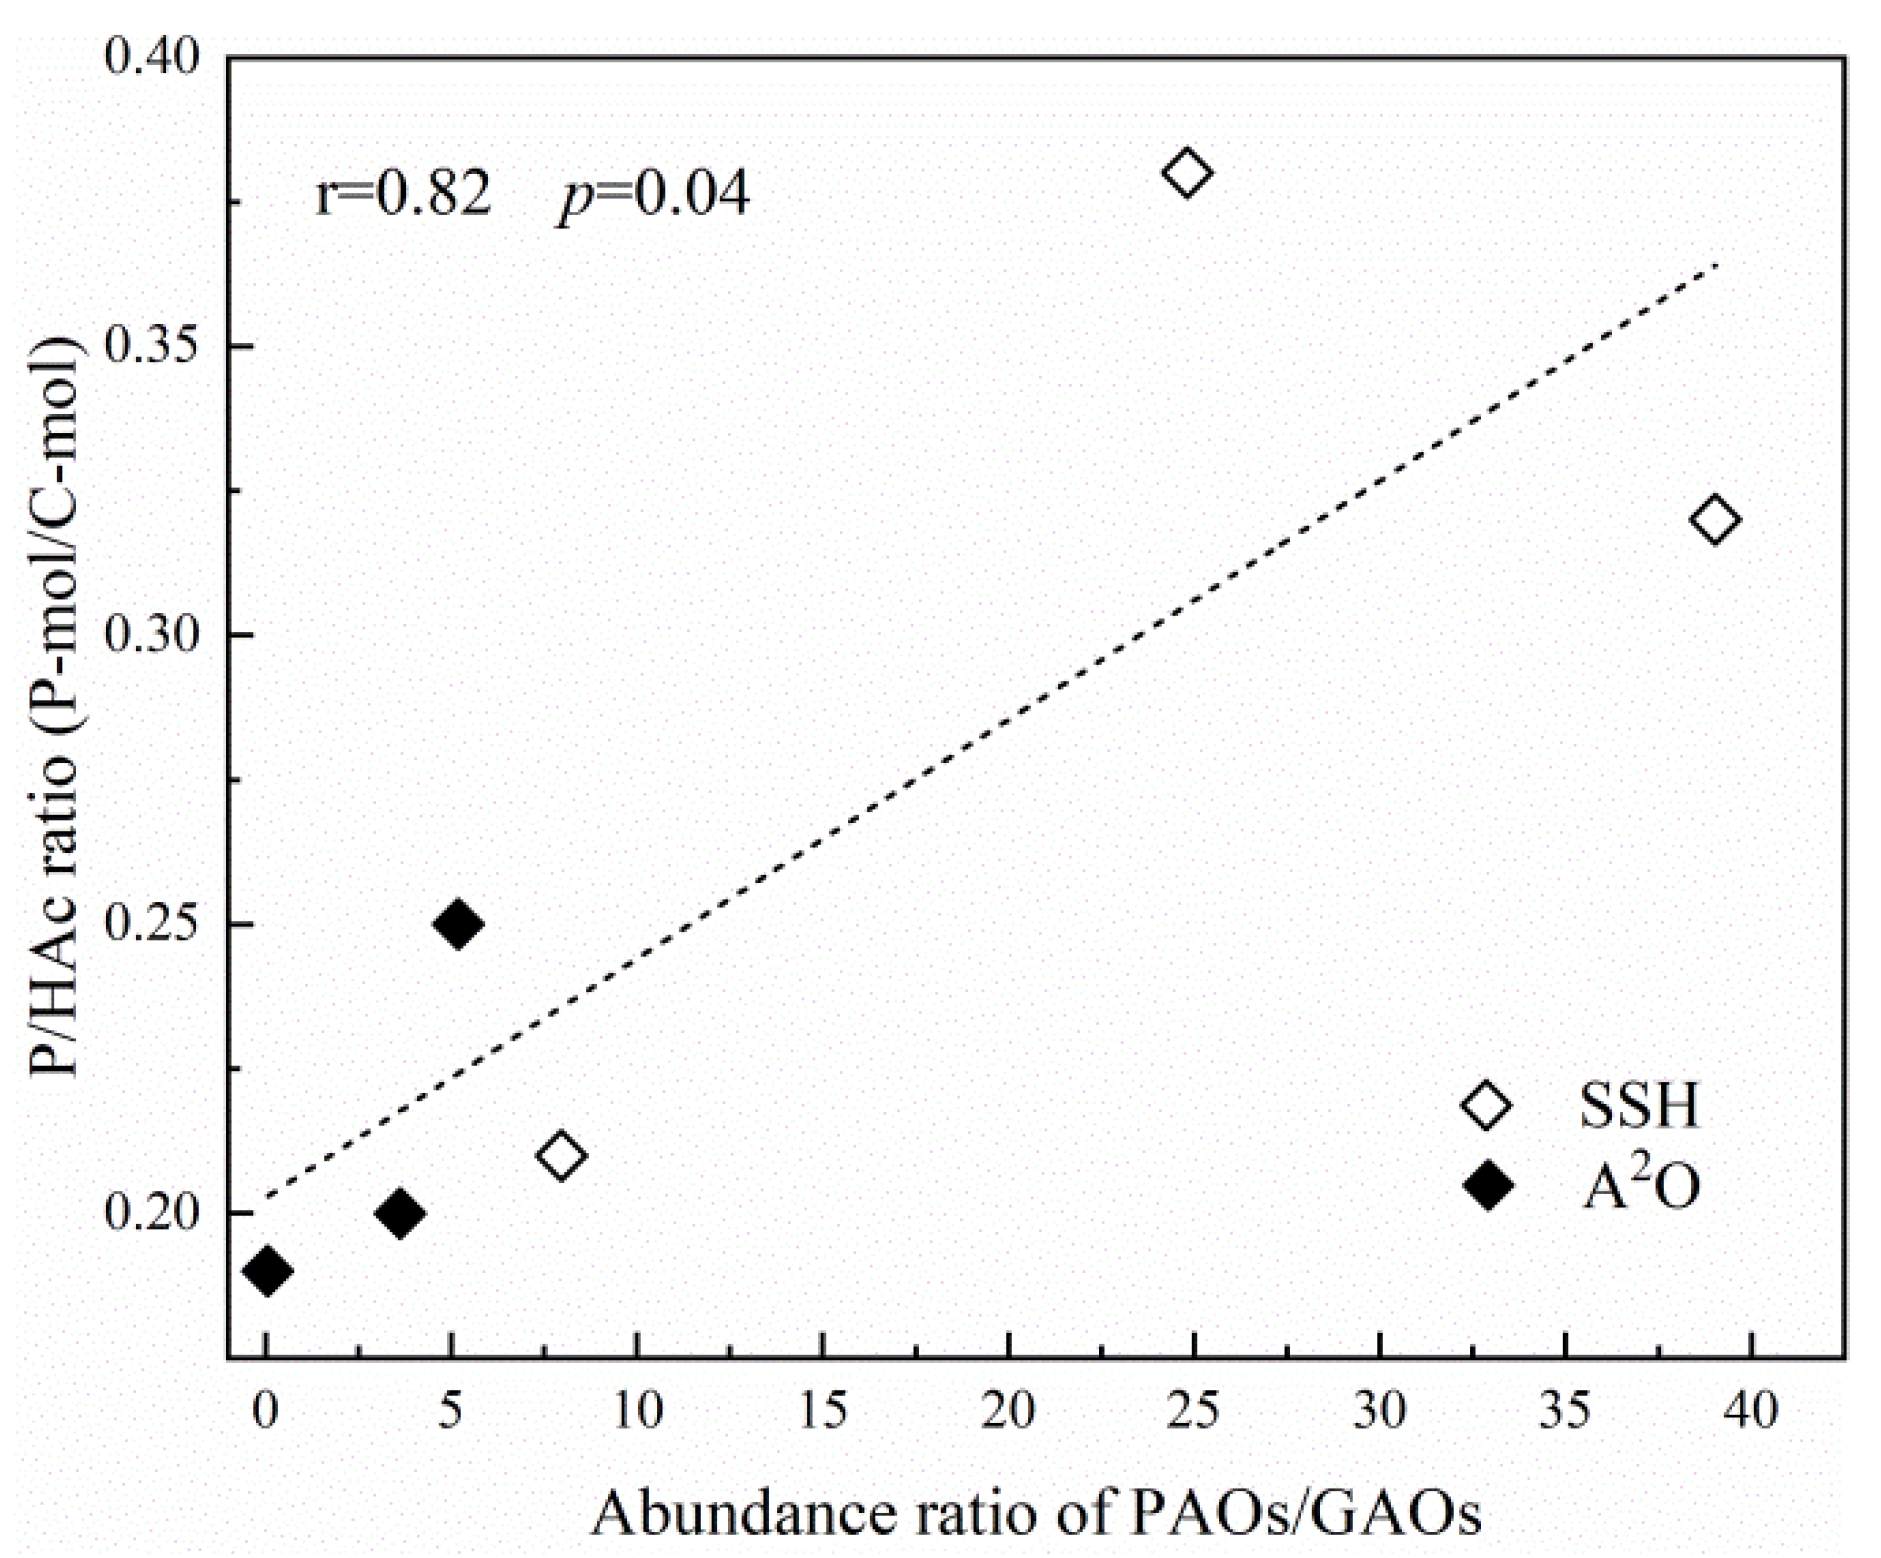
The anaerobic P-release/C-uptake ratio has been considered one of the most suitable indicators for evaluating PAO and GAO activity [5,11,22,50]. As PAOs are the only organisms known to release phosphate during anaerobic VFA uptake, a high P-release/C-uptake ratio has been considered indicative of PAO presence, while a low ratio suggests the presence of GAOs. During the experiment, the anaerobic P release to acetate uptake (P/HAc) ratio was in the range from 0.19 to 0.25 and 0.21 to 0.38 P-mol/C-mol in the A2O and SSH reactors, respectively, indicating competition between PAOs and GAOs, and potentially higher PAO abundance in the SSH reactor. Coincidentally, our microbial population results (Section 3.4.2) showed a significant positive correlation between the P/HAc ratio and the abundance ratio of PAOs/GAOs (correlation coefficient r = 0.82, p = 0.04) (Figure 6). The PAO/GAO abundance ratios in the SSH reactor (7.98–39.03) were much higher than those in the A2O reactor (0.06–5.19), with the lowest ratio obtained in Phase II at low DO levels.

3.4. Effects of DO on Microbial Community

3.4.1. Microbial Community Composition

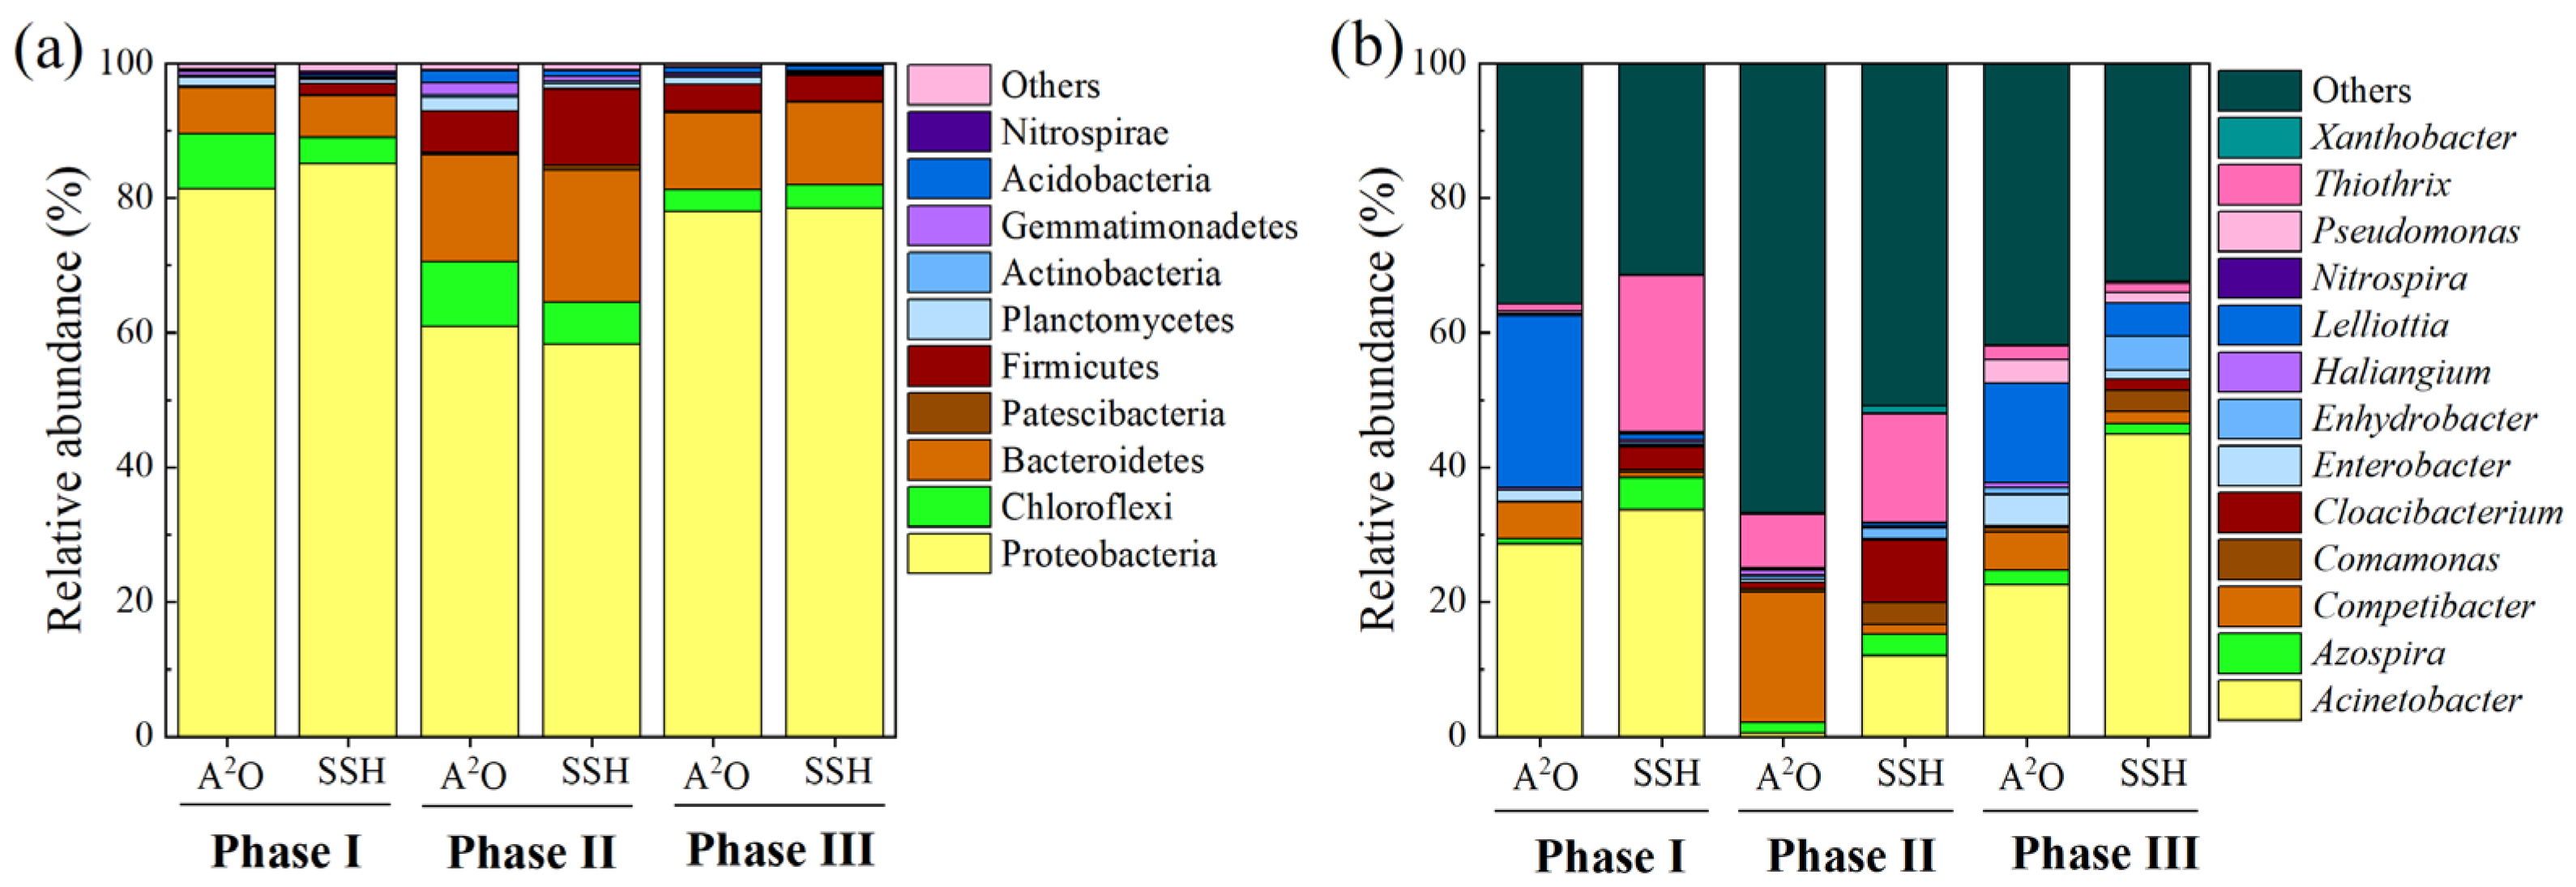
The relative abundances of microorganisms in the two reactors during the experiment are shown in Figure 7. The dominant phylum was Proteobacteria, with a relative abundance from 60.9% to 81.4% in A2O reactor and 58.2% to 85.1% in the SSH reactor. Proteobacteria was a common phylum in the activated sludge systems, containing many microorganisms related to the degradation of organic matter and nutrient removal (e.g., some known DNB and PAOs) [51,52,53]. In addition, Bacteroidetes (6.9–15.9% and 6.2–19.7%, respectively) and Chloroflexi (3.2–9.6% and 3.5–6.3%, respectively) were also the main phyla in the A2O and SSH reactors. Bacteroidetes were found to favor denitrification [54]. Chloroflexi was able to provide a stable framework for active sludge and played an important role in removing pollutants [55,56].
At the genus level, community structures varied greatly between the A2O and SSH reactors in different phases (Figure 7b). In the A2O reactor, the main genera were Acinetobacter (0.5–28.7%), Lelliottia (0.3–25.7%), and Competibacter (5.4–19.3%), while Acinetobacter (12.0–45.0%), Thiothrix (1.3–23.2%) and Cloacibacterium (1.6–9.3%) exhibited the highest abundance in SSH reactor. These dominant genera were commonly detected in previous BNR studies [8,46,57,58]. Competibacter, Thiothrix, and Cloacibacterium were known GAO, denitrifier and fermentative bacterium, respectively [59]. Acinetobacter and Thiothrix have also been recognized as putative PAOs in some studies [60,61,62]. In general, the SSH reactor was more likely to improve the enrichment of functional populations associated with BNR due to the special configuration discussed in Section 3.4.2.

3.4.2. Functionally Relevant Populations

To better investigate the drivers of nutrient removal performance at different DO levels, the MiDAS database was used to further screen functionally relevant populations associated with nitrification–denitrification and EBPR (Figure 8). When the DO concentration decreased from high levels in Phase I to low levels in Phase II, the relative abundance of Nitrosomonas AOB in the A2O and SSH reactors increased from 0 to 0.01% to 0.02% to 0.10%, while the relative abundance of Nitrospira NOB decreased from 0.20–0.32% to ~0.14%. This different shift was due to the fact that a low DO condition tended to cause NOB washout, which is related to their lower oxygen affinity compared to AOB [63]. Enrichment of AOB populations and out-selection of NOB populations could potentially lead to nitrite accumulation. Meanwhile, heterotrophic DNB (mainly Thiothrix, Azospira, Dechloromonas, and Pseudomonas) were also detected with a high total abundance of 4.3–11.3% and 5.0–32.3% in the A2O and SSH reactors, respectively, which would promote TN removal.
The main functional populations involved in the EBPR were PAOs and GAOs. During the experiment, several known PAOs (e.g., Accumulibacter), DPAOs (e.g., Dechloromonas) and GAOs (e.g., Competibacter and Defluviicoccus) were detected in both reactors (Figure 8). Additionally, Acinetobacter was largely detected in the A2O and SSH reactors, with relative abundance ranging from 0.5% to 28.7% and 12.0% to 45.0%, respectively. Acinetobacter is commonly detected in the activated sludge, and it has previously been proposed to behave as PAOs in the EBPR systems [5,62]. Although there is controversy about its significance in the EBPR, Acinetobacter’s aerobic polyP accumulation and anaerobic P release characteristics, as demonstrated by several studies [64,65,66], are similar to those of the PAO groups, and it has been classified as PAO in many EBPR studies [46,67]. The higher relative abundance of Acinetobacter was detected in Phase I (28.7% and 33.7%, respectively, for the A2O and SSH reactors) and Phase III (22.5% and 45.0%, respectively, for the A2O and SSH reactors), in which both reactors showed better EBPR performance. Therefore, Acinetobacter was considered a potential PAO in our study. The potential contributions of Acinetobacter for P removal will be explored in the future with some advanced tools, such as single-cell Raman spectroscopy-based analyses linking phenotypic and phylogenetic traits at a finer resolution [68,69,70,71].
With the decrease in DO levels, the relative abundance of total PAOs in the A2O and SSH reactors decreased dramatically from 30.4% and 36.8%, respectively, in Phase I to only 1.2% and 13.2%, respectively, in Phase II. Meanwhile, the relative abundance of known GAOs in the A2O reactor increased significantly from 5.8% to 20.3%, and a slight increase was observed in the SSH reactor (from 0.9% to 1.7%). These opposite shifts in PAO and GAO populations would contribute to the deteriorating EBPR performance. In Phase III, the total PAO abundance in the A2O and SSH reactors increased to 23.2% and 45.4%, respectively, while the GAO abundance decreased to 6.4% in the A2O and remained unchanged in the SSH reactor. Several studies have shown that the DO concentration may affect competition between PAOs and GAOs. In general, high GAO abundance was observed at high DO levels (e.g., 4.5–5.0 mg/L), while PAOs were more abundant at low DO levels (e.g., 0.15–3.0 mg/L) [5,62]. Carvalheira et al. [24] suggested that a lower DO level would favor Accumulibacter PAOs over Competibacter GAOs due to Accumulibacter’s higher oxygen affinity. The direct reduction in DO from 2.0 mg/L to 0.4 mg/L also induced a decrease in PAO abundance and an increase in GAO abundance [46]. Changes in PAO/GAO abundance in our study may also be related to the presence of nitrite, which accumulates with NOB suppression and AOB enrichment under limited DO conditions. Nitrite has been found to inhibit the energy transformation process and growth rate of PAOs, including traditionally known PAOs and Acinetobacter [67,72,73,74], and free nitrous acid (FNA), which is the protonated form of nitrite, has been reported as the true inhibitor [75]. However, GAOs were found to be more tolerant to FNA inhibition [76].
Compared to the A2O reactor, the SSH reactor in this study contained higher PAO but lower GAO abundance, which is consistent with better EBPR performance and activity (see Section 3.1.3 and Section 3.3). As previously reported [10,11], the involvement of side-stream RAS fermentation in SSH would provide PAOs with competitive advantages over GAOs, as PAOs could exhibit sustained activity and delayed decay under extended anaerobic conditions [10]. The large abundance of Acinetobacter in the SSH reactor was probably due to its metabolic versatility and preference for complex substrates [65,77].
Furthermore, the relative abundance of fermentative bacteria was investigated because they are capable of decomposing complex carbon compounds (e.g., RAS) to produce VFAs in the side-stream tank, potentially facilitating VFA uptake by PAOs and promoting the EBPR. Several known fermentative bacteria, including Aeromonas, Cloacibacterium and Enhydrobacter, were detected (Figure 8). When the DO concentration decreased, the relative abundance of total fermentative bacteria in the A2O reactor increased from 0.6% in Phase I to 4.1% in Phase II, while that in the SSH reactor increased from 3.9% to 11.3%. This suggests that the lower DO levels contributed to the enrichment of fermentative microorganisms. In addition, a higher abundance of fermentative bacteria was observed in the SSH reactor. This is probably due to the longer retention time of the RAS in the anaerobic tank in the SSH reactor (24 h) than in the A2O reactor (3.6 h), resulting in a lower ORP that facilitates the growth of fermentative bacteria.

4. Conclusions

(1)
Changes in DO had little impact on the COD removal performance. At low and moderate DO levels, the SSH reactor had better NH4+-N and TN removal performance. The direct decrease in the DO concentration from high to low depressed the EBPR performance, while the EBPR performance improved substantially when the DO concentration increased to moderate levels.
(2)
Due to the side-stream anaerobic tank providing stress resistance and additional VFAs, the SSH reactor had more stable and better nutrient removal performance than the A2O reactor at various DO levels, highlighting its potential to promote energy saving, carbon neutrality, and sustainable development.
(3)
Higher EBPR metabolic activities were observed in the SSH reactor. P/HAc ratios were positively correlated with the abundance ratios of PAOs/GAOs. Compared to the A2O reactor, the SSH reactor showed better resilience to changing the DO concentrations, which is related to its special configuration.
(4)
As the DO concentrations declined rapidly, the relative abundance of PAOs (dominated by Acinetobacter) decreased, but the relative abundance of GAOs (dominated by Competibacter) increased, which were likely the drivers of the deterioration in the EBPR performance. Higher relative abundance of PAOs and fermentative microorganisms were observed in the SSH reactor, which would have potentially enhanced the pollutant removal performance and stability.

Supplementary Materials

The following supporting information can be downloaded at: https://www.mdpi.com/article/10.3390/w15111977/s1, Figure S1: Profiles of COD concentrations in different tanks of A2O (a) and SSH (b) reactor during the experiment; Figure S2: Profiles of COD and PO43−-P during P release and uptake batch tests in (a) Phase I, (b) Phase II, and (c) Phase III; Table S1: Phases and operational conditions of the A2O and SSH configurations during the experiment; Table S2: The COD load consumed for EBPR in A2O and SSH configurations during the experiment (Unit: mg COD/d); Table S3: The COD load consumed for EBPR in A2O and SSH configurations during the experiment (Unit: mg COD/d). References [78,79,80] are citied in the Supplementary Materials.

Author Contributions

Conceptualization, D.W.; methodology, L.Q., D.W., Z.Z., X.L., H.M., Z.W., H.W., C.J. and Y.G.; validation, L.Q., Z.Z. and X.L.; formal analysis, L.Q., Z.Z. and X.L.; investigation, L.Q., Z.Z., X.L., C.L., R.C., Y.S. and G.C.; resources, Y.L. and J.L.; data curation, L.Q., Z.Z. and X.L.; writing—original draft preparation, L.Q.; writing—review and editing, D.W.; visualization, L.Q. and G.C.; supervision, D.W. and X.Z.; Project administration, D.W. and X.Z.; funding acquisition, D.W. All authors have read and agreed to the published version of the manuscript.

Funding

This research was funded by the National Natural Science Foundation of China (No. 52070156), the Opening Fund of National Demonstration Center for Experimental Water Resources and Hydro-Electric Engineering Education (No. WRHE2011), the Scientific Research Project for Returned Overseas Scholars in Shaanxi Province of China, the China Postdoctoral Science Foundation (No. 2022M712561), and the Qinchuangyuan Project for the Team of Scientists and Engineers in Shaanxi Province of China (No. 2022KXJ-115).

Data Availability Statement

Not applicable.

Conflicts of Interest

The authors declare no conflict of interest. The funders had no role in the design of the study; in the collection, analyses, or interpretation of data; in the writing of the manuscript, or in the decision to publish the results.

References

  1. Zheng, X.; Zhou, W.; Wan, R.; Luo, J.; Su, Y.; Huang, H.; Chen, Y. Increasing municipal wastewater BNR by using the preferred carbon source derived from kitchen wastewater to enhance phosphorus uptake and short-cut nitrification-denitrification. Chem. Eng. J. 2018, 344, 556–564. [Google Scholar] [CrossRef]
  2. Zhao, W.; Bai, M. Advanced nutrient removal and functional microorganism enrichment in AOA system reinforced by side-stream sludge fermentation. J. Environ. Chem. Eng. 2022, 10, 108487. [Google Scholar] [CrossRef]
  3. Zeng, W.; Li, L.; Yang, Y.; Wang, X.; Peng, Y. Denitrifying phosphorus removal and impact of nitrite accumulation on phosphorus removal in a continuous anaerobic–anoxic–aerobic (A2O) process treating domestic wastewater. Enzym. Microb. Technol. 2011, 48, 134–142. [Google Scholar] [CrossRef] [PubMed]
  4. Jaramillo, F.; Orchard, M.; Muñoz, C.; Zamorano, M.; Antileo, C. Advanced strategies to improve nitrification process in sequencing batch reactors—A review. J. Environ. Manag. 2018, 218, 154–164. [Google Scholar] [CrossRef] [PubMed]
  5. Oehmen, A.; Lemos, P.; Carvalho, G.; Yuan, Z.; Keller, J.; Blackall, L.; Reis, M. Advances in enhanced biological phosphorus removal: From micro to macro scale. Water Res. 2007, 41, 2271–2300. [Google Scholar] [CrossRef] [PubMed]
  6. Tayà, C.; Guerrero, J.; Suárez-Ojeda, M.; Guisasola, A.; Baeza, J. Assessment of crude glycerol for Enhanced Biological Phosphorus Removal: Stability and role of long chain fatty acids. Chemosphere 2015, 141, 50–56. [Google Scholar] [CrossRef]
  7. Barnard, J.L.; Dunlap, P.; Steichen, M. Rethinking the Mechanisms of Biological Phosphorus Removal. Water Environ. Res. 2017, 89, 2043–2054. [Google Scholar] [CrossRef]
  8. Guo, Z.; Zhang, J.; Xu, P.; Liu, Y.; Jing, X.; Liu, L.; Zhang, Z.; Qin, L.; Chai, G.; Lv, T.; et al. Performance and microbial dynamics of side-stream activated sludge hydrolysis process at different influent food-to-microorganism (F/M) ratios. Int. J. Environ. Sci. Technol. 2022, 1–12. [Google Scholar] [CrossRef]
  9. Gu, A.; Tooker, N.B.; Onnis-Hayden, A.; Wang, D.; Srinivasan, V.; Li, G.; Takács, I.; Vargas, E. Optimization and design of a side-stream EBPR process as a sustainable approach for achieving stable and efficient phosphorus removal. Water Res. Found. 2019, 226, U1R13/4869. [Google Scholar]
  10. Onnis-Hayden, A.; Srinivasan, V.; Tooker, N.B.; Li, G.; Wang, D.; Barnard, J.L.; Bott, C.; Dombrowski, P.; Schauer, P.; Menniti, A.; et al. Survey of full-scale sidestream enhanced biological phosphorus removal (S2EBPR) systems and comparison with conventional EBPRs in North Americarocess stability, kinetics, and microbial populations. Water Environ. Res. 2020, 92, 403–417. [Google Scholar] [CrossRef]
  11. Wang, D.; Tooker, N.B.; Srinivasan, V.; Li, G.; Fernandez, L.A.; Schauer, P.; Menniti, A.; Maher, C.; Bott, C.B.; Dombrowski, P.; et al. Side-stream enhanced biological phosphorus removal (S2EBPR) process improves system performance—A full-scale comparative study. Water Res. 2019, 167, 115109. [Google Scholar] [CrossRef] [PubMed]
  12. Chen, Y.; Lan, S.; Wang, L.; Dong, S.; Zhou, H.; Tan, Z.; Li, X. A review: Driving factors and regulation strategies of microbial community structure and dynamics in wastewater treatment systems. Chemosphere 2017, 174, 173–182. [Google Scholar] [CrossRef] [PubMed]
  13. Keene, N.A.; Reusser, S.; Scarborough, M.; Grooms, A.L.; Seib, M.; Domingo, J.S.; Noguera, D.R. Pilot plant demonstration of stable and efficient high rate biological nutrient removal with low dissolved oxygen conditions. Water Res. 2017, 121, 72–85. [Google Scholar] [CrossRef] [PubMed]
  14. Mulkerrins, D.; Dobson, A.; Colleran, E. Parameters affecting biological phosphate removal from wastewaters. Environ. Int. 2004, 30, 249–259. [Google Scholar] [CrossRef] [PubMed]
  15. Rosso, D.; Larson, L.; Stenstrom, M. Aeration of large-scale municipal wastewater treatment plants: State of the art. Water Sci. Technol. 2008, 57, 973–978. [Google Scholar] [CrossRef]
  16. Liu, G.; Wang, J. Long-Term Low DO Enriches and Shifts Nitrifier Community in Activated Sludge. Environ. Sci. Technol. 2013, 47, 5109–5117. [Google Scholar] [CrossRef]
  17. Hao, X.; Liu, R.; Huang, X. Evaluation of the potential for operating carbon neutral WWTPs in China. Water Res. 2015, 87, 424–431. [Google Scholar] [CrossRef]
  18. Li, L.; Wang, X.; Miao, J.; Abulimiti, A.; Jing, X.; Ren, N. Carbon neutrality of wastewater treatment—A systematic concept beyond the plant boundary. Environ. Sci. Ecotechnol. 2022, 11, 100180. [Google Scholar] [CrossRef]
  19. Chen, H.; Wang, D.; Li, X.; Yang, Q.; Luo, K.; Zeng, G.; Tang, M.; Xiong, W.; Yang, G. Effect of dissolved oxygen on biological phosphorus removal induced by aerobic/extended-idle regime. Biochem. Eng. J. 2014, 90, 27–35. [Google Scholar] [CrossRef]
  20. Griffiths, P.C.; Stratton, H.; Seviour, R. Environmental factors contributing to the “G bacteria” population in full-scale EBPR plants. Water Sci. Technol. 2002, 46, 185–192. [Google Scholar] [CrossRef]
  21. Liu, W.-T.; Mino, T.; Nakamura, K.; Matsuo, T. Glycogen accumulating population and its anaerobic substrate uptake in anaerobic-aerobic activated sludge without biological phosphorus removal. Water Res. 1996, 30, 75–82. [Google Scholar] [CrossRef]
  22. Saunders, A.M.; Oehmen, A.; Blackall, L.L.; Yuan, Z.; Keller, J. The effect of GAOs (glycogen accumulating organisms) on anaerobic carbon requirements in full-scale Australian EBPR (enhanced biological phosphorus removal) plants. Water Sci. Technol. 2003, 47, 37–43. [Google Scholar] [CrossRef] [PubMed]
  23. Cech, J.S.; Hartman, P. Competition between polyphosphate and polysaccharide accumulating bacteria in enhanced biological phosphate removal systems. Water Res. 1993, 27, 1219–1225. [Google Scholar] [CrossRef]
  24. Carvalheira, M.; Oehmen, A.; Carvalho, G.; Eusébio, M.; Reis, M.A. The impact of aeration on the competition between polyphosphate accumulating organisms and glycogen accumulating organisms. Water Res. 2014, 66, 296–307. [Google Scholar] [CrossRef]
  25. Li, H.; Chen, Y. Research on polyhydroxyalkanoates and glycogen transformations: Key aspects to biologic nitrogen and phosphorus removal in low dissolved oxygen systems. Front. Environ. Sci. Eng. China 2011, 5, 283–290. [Google Scholar] [CrossRef]
  26. Li, H.; Chen, Y.; Gu, G. The effect of propionic to acetic acid ratio on anaerobic–aerobic (low dissolved oxygen) biological phosphorus and nitrogen removal. Bioresour. Technol. 2008, 99, 4400–4407. [Google Scholar] [CrossRef]
  27. Lochmatter, S.; Gonzalez-Gil, G.; Holliger, C. Optimized aeration strategies for nitrogen and phosphorus removal with aerobic granular sludge. Water Res. 2013, 47, 6187–6197. [Google Scholar] [CrossRef]
  28. Ginige, M.P.; Kayaalp, A.S.; Cheng, K.Y.; Wylie, J.; Kaksonen, A.H. Biological phosphorus and nitrogen removal in sequencing batch reactors: Effects of cycle length, dissolved oxygen concentration and influent particulate matter. Water Sci. Technol. 2013, 68, 982–990. [Google Scholar] [CrossRef]
  29. Kampschreur, M.J.; Temmink, H.; Kleerebezem, R.; Jetten, M.S.M.; van Loosdrecht, M.C.M. Nitrous oxide emission during wastewater treatment. Water Res. 2009, 43, 4093–4103. [Google Scholar] [CrossRef]
  30. Mikola, A.; Rautiainen, J.; Vahala, R. Secondary clarifier conditions conducting to secondary phosphorus release in a BNR plant. Water Sci. Technol. 2009, 60, 2413–2418. [Google Scholar] [CrossRef]
  31. Martins, A.M.P.; Heijnen, J.; van Loosdrecht, M. Effect of dissolved oxygen concentration on sludge settleability. Appl. Microbiol. Biotechnol. 2003, 62, 586–593. [Google Scholar] [CrossRef]
  32. Smolders, G.J.F.; van der Meij, J.; van Loosdrecht, M.C.M.; Heijnen, J.J. Model of the anaerobic metabolism of the biological phosphorus removal process: Stoichiometry and pH influence. Biotechnol. Bioeng. 1994, 43, 461–470. [Google Scholar] [CrossRef]
  33. Gu, A.Z.; Saunders, A.; Neethling, J.B.; Stensel, H.D.; Blackall, L.L. Functionally Relevant Microorganisms to Enhanced Biological Phosphorus Removal Performance at Full-Scale Wastewater Treatment Plants in the United States. Water Environ. Res. 2008, 80, 688–698. [Google Scholar] [CrossRef]
  34. APHA. Standard Methods for the Examination of Water and Wastewater, 23rd ed.; American Public Health Association: Washington, DC, USA, 2017. [Google Scholar]
  35. Wang, Q.; Chen, Q. Simultaneous denitrification and denitrifying phosphorus removal in a full-scale anoxic–oxic process without internal recycle treating low strength wastewater. J. Environ. Sci. 2016, 39, 175–183. [Google Scholar] [CrossRef]
  36. Cao, G.; Wang, S.; Peng, Y.; Miao, Z. Biological nutrient removal by applying modified four step-feed technology to treat weak wastewater. Bioresour. Technol. 2013, 128, 604–611. [Google Scholar] [CrossRef]
  37. Feng, Q.; Tai, X.; Sun, Y.; Li, M. Influence of turbulent mixing on the composition of extracellular polymeric substances (EPS) and aggregate size of aerated activated sludge. Chem. Eng. J. 2019, 378, 122123. [Google Scholar] [CrossRef]
  38. Ma, J.; Wang, Z.; Yang, Y.; Mei, X.; Wu, Z. Correlating microbial community structure and composition with aeration intensity in submerged membrane bioreactors by 454 high-throughput pyrosequencing. Water Res. 2013, 47, 859–869. [Google Scholar] [CrossRef]
  39. Park, H.-D.; Noguera, D.R. Evaluating the effect of dissolved oxygen on ammonia-oxidizing bacterial communities in activated sludge. Water Res. 2004, 38, 3275–3286. [Google Scholar] [CrossRef]
  40. Cui, B.; Yang, Q.; Liu, X.; Huang, S.; Yang, Y.; Liu, Z. The effect of dissolved oxygen concentration on long-term stability of partial nitrification process. J. Environ. Sci. 2020, 90, 346–354. [Google Scholar] [CrossRef]
  41. Plósz, B.G.; Jobbágy, A.; Grady, C. Factors influencing deterioration of denitrification by oxygen entering an anoxic reactor through the surface. Water Res. 2003, 37, 853–863. [Google Scholar] [CrossRef]
  42. Oh, J.; Silverstein, J. Oxygen inhibition of activated sludge denitrification. Water Res. 1999, 33, 1925–1937. [Google Scholar] [CrossRef]
  43. Peng, Y.-Z.; Wang, X.-L.; Li, B.-K. Anoxic biological phosphorus uptake and the effect of excessive aeration on biological phosphorus removal in the A2O process. Desalination 2006, 189, 155–164. [Google Scholar] [CrossRef]
  44. Izadi, P.; Izadi, P.; Eldyasti, A. Understanding microbial shift of Enhanced Biological Phosphorus Removal process (EBPR) under different Dissolved Oxygen (DO) concentrations and Hydraulic Retention Time (HRTs). Biochem. Eng. J. 2021, 166, 107833. [Google Scholar] [CrossRef]
  45. Camejo, P.Y.; Owen, B.R.; Martirano, J.; Ma, J.; Kapoor, V.; Domingo, J.S.; McMahon, K.D.; Noguera, D.R. Candidatus Accumulibacter phosphatis clades enriched under cyclic anaerobic and microaerobic conditions simultaneously use different electron acceptors. Water Res. 2016, 102, 125–137. [Google Scholar] [CrossRef] [PubMed]
  46. Izadi, P.; Izadi, P.; Eldyasti, A. Evaluation of PAO adaptability to oxygen concentration change: Development of stable EBPR under stepwise low-aeration adaptation. Chemosphere 2022, 286, 131778. [Google Scholar] [CrossRef]
  47. Qiu, G.; Zuniga-Montanez, R.; Law, Y.; Thi, S.S.; Nguyen, T.Q.N.; Eganathan, K.; Liu, X.; Nielsen, P.H.; Williams, R.B.H.; Wuertz, S. Polyphosphate-accumulating organisms in full-scale tropical wastewater treatment plants use diverse carbon sources. Water Res. 2019, 149, 496–510. [Google Scholar] [CrossRef]
  48. Majed, N.; Gu, A.Z. Phenotypic dynamics in polyphosphate and glycogen accumulating organisms in response to varying influent C/P ratios in EBPR systems. Sci. Total Environ. 2020, 743, 140603. [Google Scholar] [CrossRef]
  49. Zilles, J.L.; Peccia, J.; Kim, M.W.; Hung, C.H.; Noguera, D.R. Involvement of Rhodocyclus-Related Organisms in Phosphorus Removal in Full-Scale Wastewater Treatment Plants. Appl. Environ. Microbiol. 2002, 68, 2763–2769. [Google Scholar] [CrossRef]
  50. Schuler, A.J.; Jenkins, D. Enhanced Biological Phosphorus Removal from Wastewater by Biomass with Different Phosphorus Contents, Part I: Experimental Results and Comparison with Metabolic Models. Water Environ. Res. 2003, 75, 485–498. [Google Scholar] [CrossRef]
  51. Sun, T.; Du, R.; Dan, Q.; Liu, Y.; Peng, Y. Rapidly achieving partial nitrification of municipal wastewater in enhanced biological phosphorus removal (EBPR) reactor: Effect of heterotrophs proliferation and microbial interactions. Bioresour. Technol. 2021, 340, 125712. [Google Scholar] [CrossRef]
  52. Nielsen, P.H.; Mielczarek, A.T.; Kragelund, C.; Nielsen, J.L.; Saunders, A.M.; Kong, Y.; Hansen, A.A.; Vollertsen, J. A conceptual ecosystem model of microbial communities in enhanced biological phosphorus removal plants. Water Res. 2010, 44, 5070–5088. [Google Scholar] [CrossRef]
  53. Wang, D.; Tang, G.; Yang, Z.; Li, X.; Chai, G.; Liu, T.; Cao, X.; Pan, B.; Li, J.; Sheng, G.; et al. Long-term impact of heavy metals on the performance of biological wastewater treatment processes during shock-adaptation-restoration phases. J. Hazard. Mater. 2019, 373, 152–159. [Google Scholar] [CrossRef]
  54. Lawson, C.E.; Strachan, B.J.; Hanson, N.W.; Hahn, A.S.; Hall, E.R.; Rabinowitz, B.; Mavinic, D.S.; Ramey, W.D.; Hallam, S.J. Rare taxa have potential to make metabolic contributions in enhanced biological phosphorus removal ecosystems. Environ. Microbiol. 2015, 17, 4979–4993. [Google Scholar] [CrossRef]
  55. Chen, C.; Huang, X.; Lei, C.; Zhang, T.C.; Wu, W. Effect of organic matter strength on anammox for modified greenhouse turtle breeding wastewater treatment. Bioresour. Technol. 2013, 148, 172–179. [Google Scholar] [CrossRef]
  56. Cho, S.; Takahashi, Y.; Fujii, N.; Yamada, Y.; Satoh, H.; Okabe, S. Nitrogen removal performance and microbial community analysis of an anaerobic up-flow granular bed anammox reactor. Chemosphere 2010, 78, 1129–1135. [Google Scholar] [CrossRef]
  57. Zhang, X.; Zheng, S.; Wang, R. Effect of dissolved oxygen concentration (microaerobic and aerobic) on community structure and activity of culturable heterotrophic nitrifying bacteria in activated sludge. Chem. Ecol. 2020, 36, 953–966. [Google Scholar] [CrossRef]
  58. Feng, X.; Qian, Y.; Xi, P.; Cao, R.; Qin, L.; Zhang, S.; Chai, G.; Huang, M.; Li, K.; Xiao, Y.; et al. Partial Nitrification and Enhanced Biological Phosphorus Removal in a Sequencing Batch Reactor Treating High-Strength Wastewater. Int. J. Environ. Res. Public Health 2022, 19, 5653. [Google Scholar] [CrossRef]
  59. Nierychlo, M.; Andersen, K.S.; Xu, Y.; Green, N.; Jiang, C.; Albertsen, M.; Dueholm, M.S.; Nielsen, P.H. MiDAS 3: An ecosystem-specific reference database, taxonomy and knowledge platform for activated sludge and anaerobic digesters reveals species-level microbiome composition of activated sludge. Water Res. 2020, 182, 115955. [Google Scholar] [CrossRef]
  60. Rey-Martínez, N.; Badia-Fabregat, M.; Albert, G.; Baeza, J.A. Glutamate as sole carbon source for enhanced biological phosphorus removal. Sci. Total Environ. 2019, 657, 1398–1408. [Google Scholar] [CrossRef]
  61. Zhang, C.; Guisasola, A.; Baeza, J. Exploring the stability of an A-stage-EBPR system for simultaneous biological removal of organic matter and phosphorus. Chemosphere 2023, 313, 137576. [Google Scholar] [CrossRef]
  62. Izadi, P.; Izadi, P.; Eldyasti, A. Design, operation and technology configurations for enhanced biological phosphorus removal (EBPR) process: A review. Rev. Environ. Sci. Bio/Technol. 2020, 19, 561–593. [Google Scholar] [CrossRef]
  63. Zaman, M.; Kim, M.; Nakhla, G. Simultaneous partial nitrification and denitrifying phosphorus removal (PNDPR) in a sequencing batch reactor process operated at low DO and high SRT for carbon and energy reduction. Chem. Eng. J. 2021, 425, 131881. [Google Scholar] [CrossRef]
  64. Ohtake, H.; Takahashi, K.; Tsuzuki, Y.; Toda, K. Uptake and release of phosphate by a pure culture of Acinetobacter calcoaceticus. Water Res. 1985, 19, 1587–1594. [Google Scholar] [CrossRef]
  65. Zafiri, C.; Kornaros, M.; Lyberatos, G. Kinetic modelling of biological phosphorus removal with a pure culture of Acinetobacter sp. under aerobic, anaerobic and transient operating conditions. Water Res. 1999, 33, 2769–2788. [Google Scholar] [CrossRef]
  66. Han, Y.-H.; Fu, T.; Wang, S.S.; Yu, H.T.; Xiang, P.; Zhang, W.; Chen, D.L.; Li, M. Efficient phosphate accumulation in the newly isolated Acinetobacter junii strain LH4. 3 Biotech 2018, 8, 313. [Google Scholar] [CrossRef]
  67. Weon, S.-Y.; Lee, C.W.; Lee, S.; Koopman, B. Nitrite inhibition of aerobic growth of Acinetobacter sp. Water Res. 2002, 36, 4471–4476. [Google Scholar] [CrossRef]
  68. Fernando, E.Y.; McIlroy, S.J.; Nierychlo, M.; Herbst, F.A.; Petriglieri, F.; Schmid, M.C.; Wagner, M.; Nielsen, J.L.; Nielsen, P.H. Resolving the individual contribution of key microbial populations to enhanced biological phosphorus removal with Raman–FISH. ISME J. 2019, 13, 1933–1946. [Google Scholar] [CrossRef]
  69. Wang, D.; Li, Y.; Cope, H.A.; Li, X.; He, P.; Liu, C.; Li, G.; Rahman, S.M.; Tooker, N.B.; Bott, C.B.; et al. Intracellular polyphosphate length characterization in polyphosphate accumulating microorganisms (PAOs): Implications in PAO phenotypic diversity and enhanced biological phosphorus removal performance. Water Res. 2021, 206, 117726. [Google Scholar] [CrossRef]
  70. Li, Y.; Cope, H.A.; Rahman, S.M.; Li, G.; Nielsen, P.H.; Elfick, A.; Gu, A.Z. Toward Better Understanding of EBPR Systems via Linking Raman-Based Phenotypic Profiling with Phylogenetic Diversity. Environ. Sci. Technol. 2018, 52, 8596–8606. [Google Scholar] [CrossRef]
  71. Wang, D.; He, P.; Wang, Z.; Li, G.; Majed, N.; Gu, A.Z. Advances in single cell Raman spectroscopy technologies for biological and environmental applications. Curr. Opin. Biotechnol. 2020, 64, 218–229. [Google Scholar] [CrossRef]
  72. Saito, T.; Brdjanovic, D.; van Loosdrecht, M. Effect of nitrite on phosphate uptake by phosphate accumulating organisms. Water Res. 2004, 38, 3760–3768. [Google Scholar] [CrossRef]
  73. Pijuan, M.; Ye, L.; Yuan, Z. Free nitrous acid inhibition on the aerobic metabolism of poly-phosphate accumulating organisms. Water Res. 2010, 44, 6063–6072. [Google Scholar] [CrossRef]
  74. Miao, Z.; Li, D.; Guo, S.; Zhao, Z.; Fang, X.; Wen, X.; Wan, J.; Li, A. Effect of free nitrous acid on nitrous oxide production and denitrifying phosphorus removal by polyphosphorus-accumulating organisms in wastewater treatment. BioMed Res. Int. 2018, 2018. [Google Scholar] [CrossRef]
  75. Zhou, Y.; Pijuan, M.; Yuan, Z. Free nitrous acid inhibition on anoxic phosphorus uptake and denitrification by poly-phosphate accumulating organisms. Biotechnol. Bioeng. 2007, 98, 903–912. [Google Scholar] [CrossRef]
  76. Lu, X.; Duan, H.; Oehmen, A.; Carvalho, G.; Yuan, Z.; Ye, L. Achieving combined biological short-cut nitrogen and phosphorus removal in a one sludge system with side-stream sludge treatment. Water Res. 2021, 203, 11756. [Google Scholar] [CrossRef]
  77. Van Assche, A.; Álvarez-Pérez, S.; de Breij, A.; De Brabanter, J.; Willems, K.A.; Dijkshoorn, L.; Lievens, B. Phylogenetic signal in phenotypic traits related to carbon source assimilation and chemical sensitivity in Acinetobacter species. Appl. Microbiol. Biotechnol. 2017, 101, 367–379. [Google Scholar] [CrossRef]
  78. Grady, C.P.L.J.; Daigger, G.T.; Lim, H.C. Biological Wastewater Treatment, 2nd ed.; Marcel Dekker, Inc.: New York, NY, USA, 1999. [Google Scholar]
  79. Henze, M.; van Loosdrecht, M.C.M.; Ekama, G.A.; Brdjanovic, D. Biological Wastewater Treatment: Principles, Modelling, and Design; IWA Publishing: London, UK, 2008. [Google Scholar]
  80. Wentzel, M.; Dold, P.; Ekama, G.; Marais, G. Enhanced polyphosphate organism cultures in activated sludge systems. Part III: Kinetic model. Water SA 1989, 15, 89–102. [Google Scholar]
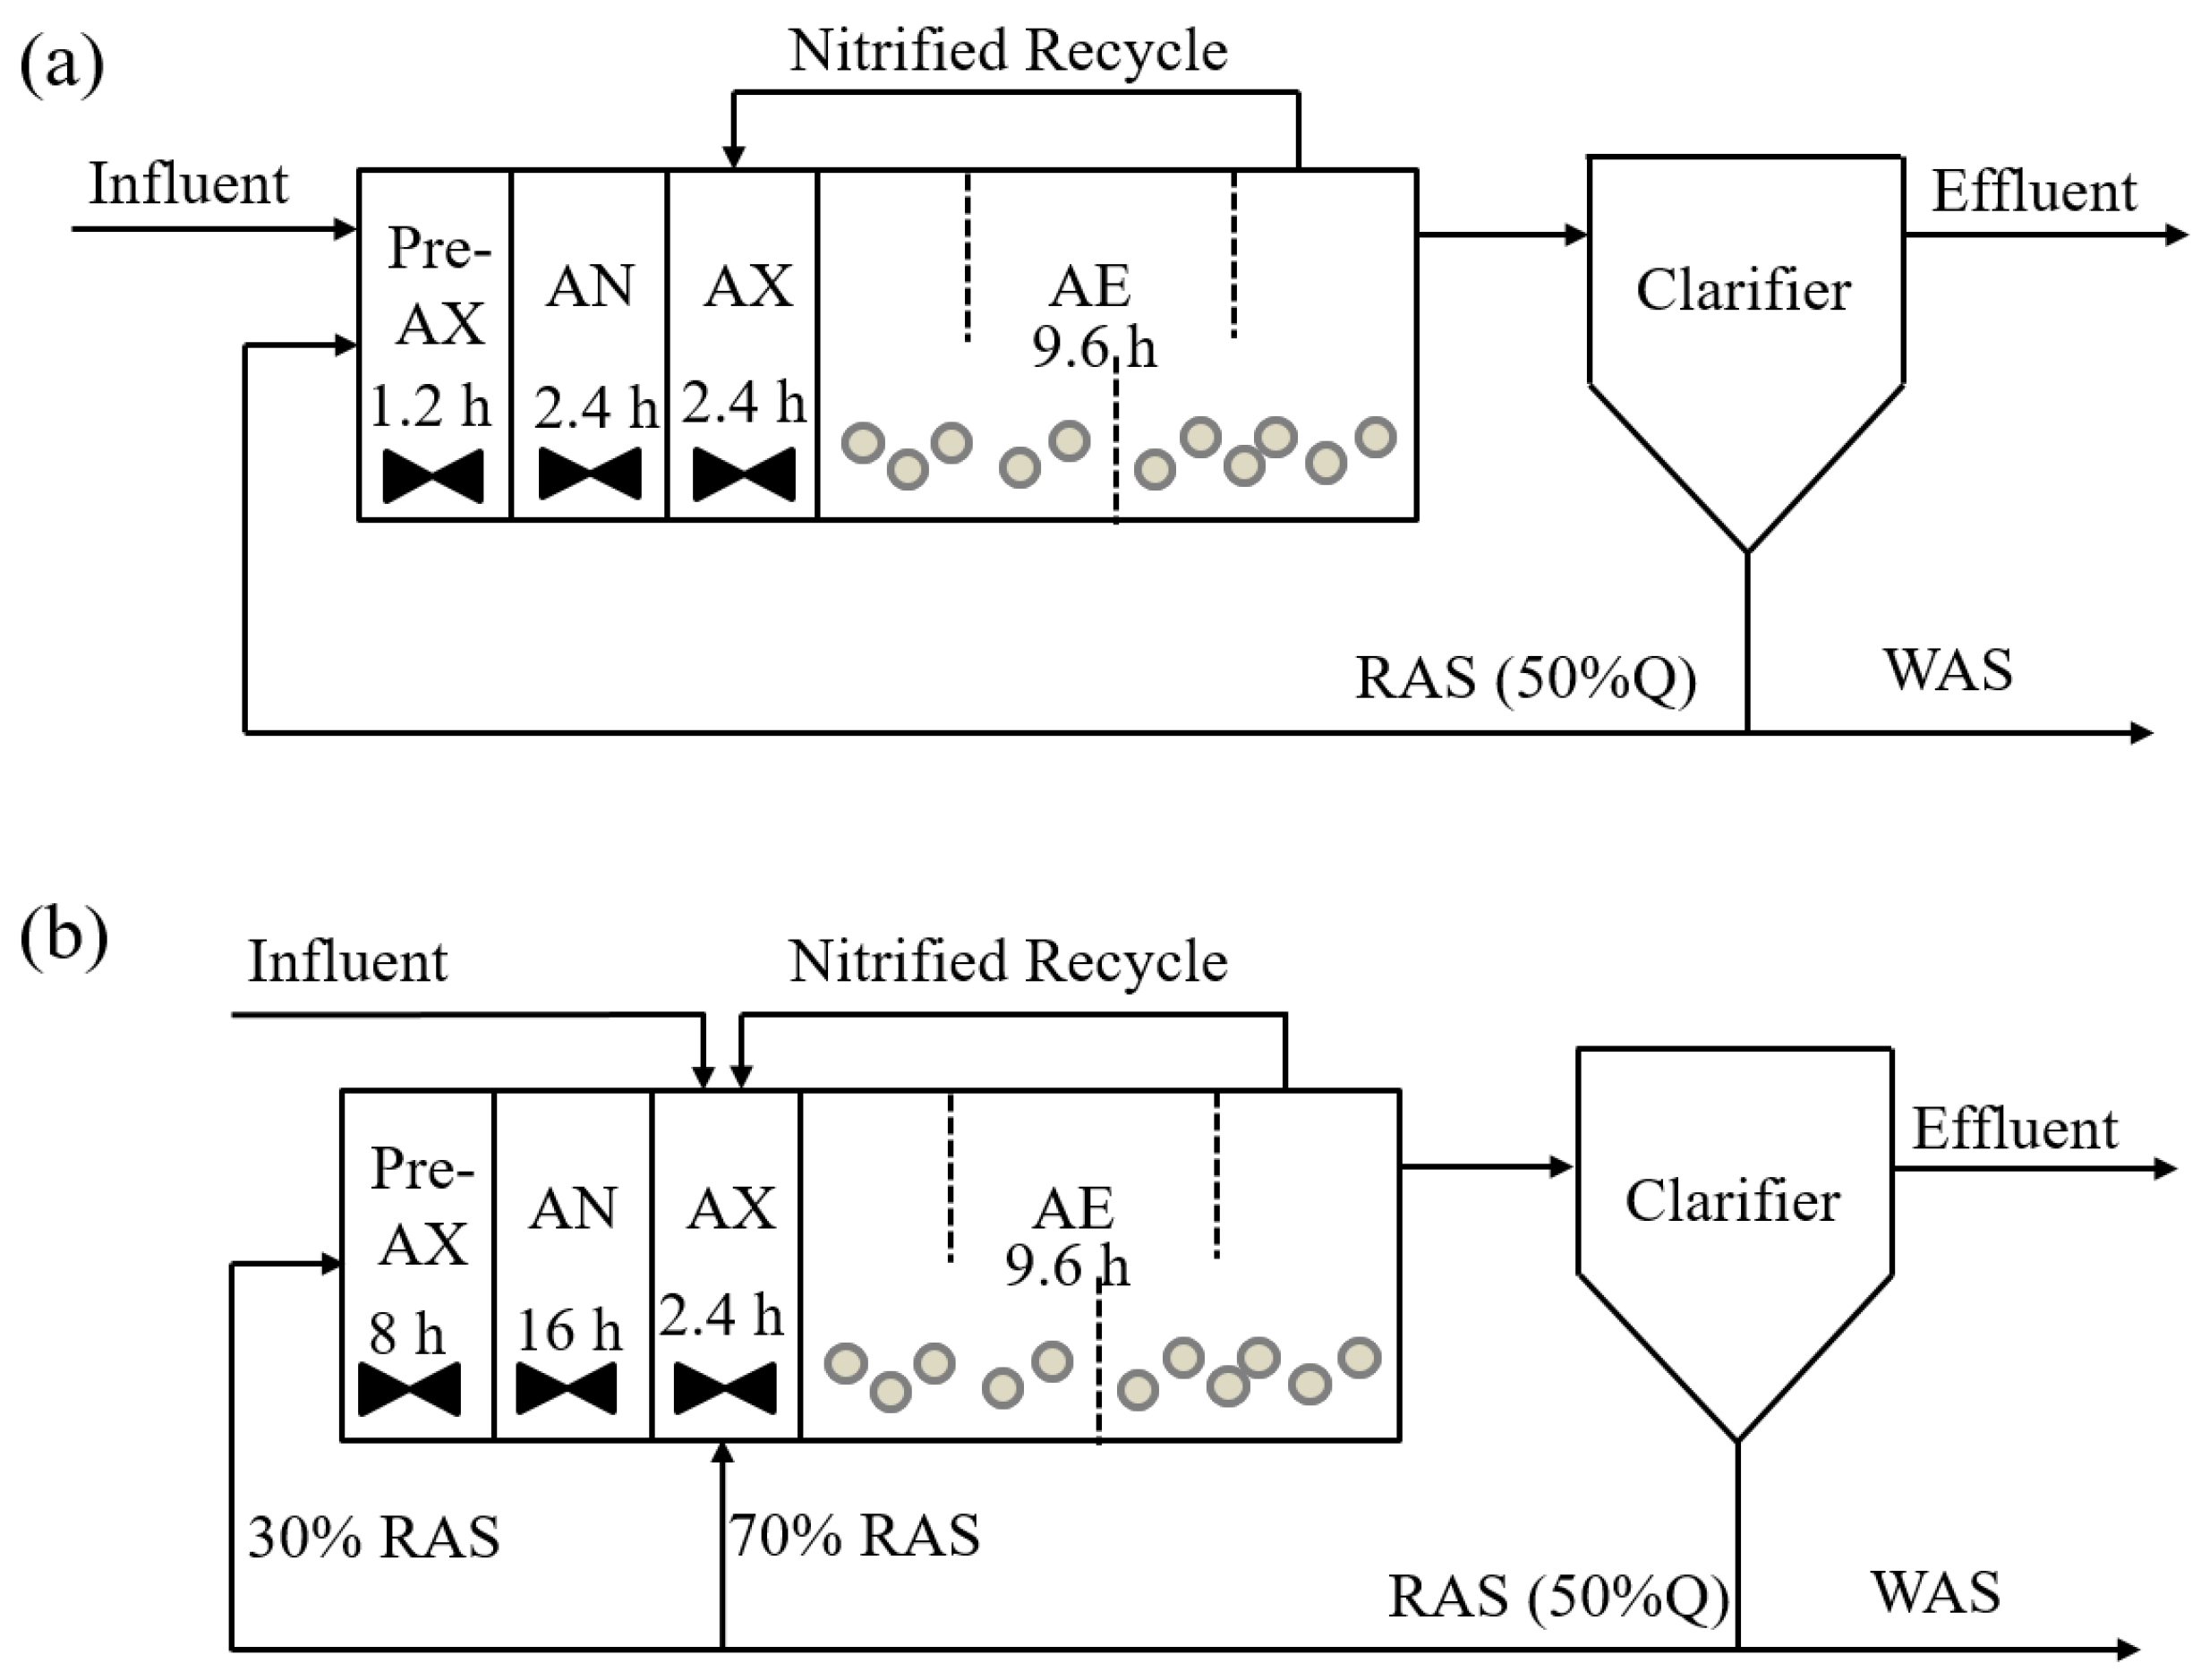
Figure 1. Schematic flow diagrams of (a) A2O and (b) SSH reactors in this study. AN: anaerobic tank; AX: anoxic tank; AE: aerobic tank; RAS: return activated sludge; WAS: waste activated sludge. The value in each tank was the corresponding HRT. The values in brackets were recycle ratios.
Water 15 01977 g001
Figure 2. Comparison of COD removal performance between the A2O and SSH reactors during the experiment.
Water 15 01977 g002
Figure 3. Comparison of (a) NH4+-N and (b) TN removal performance, and cumulative relative frequency distribution for effluent (c) NH4+-N and (d) TN between the A2O and SSH reactors during the experiment.
Water 15 01977 g003
Figure 4. Comparison of (a) PO43−-P removal performance and (b) cumulative relative frequency distribution for effluent PO43−-P between the A2O and SSH reactors during the experiment.
Water 15 01977 g004
Figure 5. Fate of PO43−-P in (a) the A2O and (b) the SSH reactors during the experiment. Values in red, green, and black represent the fate of PO43−-P in Phase I, II, and III, respectively. Values with plus and minus signs represent PO43−-P release and uptake, respectively. AN: pre-anoxic and anaerobic tanks; AX: anoxic tank; AE: aerobic tank; RAS: return activated sludge; WAS: PO43−-P in the waste activated sludge. Units are in mg P/d.
Water 15 01977 g005
Figure 6. Correlation between the P/HAc ratios and the abundance ratios of PAOs/GAOs, r is the Pearson correlation coefficient and p indicates the significance level.
Water 15 01977 g006
Figure 7. Microbial community structure at (a) phylum and (b) genus levels in the A2O and SSH reactors during the experiment.
Water 15 01977 g007
Figure 8. Relative abundance of functionally relevant microorganisms in the A2O and SSH reactors during the experiment.
Water 15 01977 g008
Table 1. Key operational parameters in the A2O and SSH reactors during the experiment.
ParameterPhase I
(Days 1–15)
Phase II
(Days 16–27)
Phase III
(Days 28–45)
A2OSSHA2OSSHA2OSSH
DO (mg/L)5.0 ± 0.95.1 ± 1.11.2 ± 0.51.4 ± 0.52.9 ± 0.63.4 ± 0.5
Influent COD (mg/L)406 ± 29391 ± 23392 ± 16
Influent NH4+-N (mg/L)40.0 ± 6.239.3 ± 5.732.4 ± 5.0
Influent PO43−-P (mg/L)8.92 ± 0.8510.43 ±1.459.52 ± 1.22
Table 2. Specific kinetic rates and P/HAc ratios obtained in the P release and uptake batch tests in the A2O and SSH reactors during the experiment.
PhaseSamplesP Release
(mg P/g VSS/h)
Hac Uptake
(mg HAc/g VSS/h)
P Uptake
(mg P/g VSS/h)
P/HAc Ratio (P-mol/C-mol)References
IA2O7.730.02.30.25This study
SSH8.023.92.40.32
IIA2O6.634.42.00.19
SSH7.038.53.70.21
IIIA2O9.244.73.70.20
SSH11.027.84.50.38
Full-scale sludge2.8–31.913.5–47.01.9–11.00.11–0.66[10,11,33,47]
Lab-scale sludge4.4–50.67.7–32.79.8–23.80.22–0.60[48]
Disclaimer/Publisher’s Note: The statements, opinions and data contained in all publications are solely those of the individual author(s) and contributor(s) and not of MDPI and/or the editor(s). MDPI and/or the editor(s) disclaim responsibility for any injury to people or property resulting from any ideas, methods, instructions or products referred to in the content.