1. Introduction
Most often, stormwater runoff is captured and controlled using centralized stormwater systems [
1]. In contrast, low-impact development (LID) systems dispersed throughout an urban area typically receive runoff from much smaller contributing areas and contribute to reducing total runoff volumes [
2,
3,
4]. LID measures are designed to mimic a site’s pre-development hydrologic processes through infiltration, evaporation, and detention of runoff, and to capture pollutants [
5,
6].
LID practices can be applied together with centralized facilities to meet a full range of stormwater goals. These include flood control, protecting (or improving) water quality, preventing erosion, and restoring water balance [
7,
8,
9,
10,
11,
12]. Such an approach can relieve the maintenance burden of end-of-pipe facilities and provide various benefits, including better runoff and pollutant load reduction, protection of aquatic habitat, and cost-effectiveness [
7,
13,
14,
15,
16,
17].
Permeable pavement systems, one type of LID, were introduced in the early 1970s. They were designed to provide both a paved surface for pedestrian and vehicular movement and to manage stormwater [
18,
19,
20,
21,
22]. They reduce runoff by allowing water to infiltrate through voids in the pavement and provide detention by storing water in the base layer [
23,
24,
25]. Common types of permeable pavement surfaces include Permeable Interlocking Concrete Pavers (PICPs), permeable concrete, permeable asphalt, and cellular grids filled with gravel. The permeable pavement system can be designed without underdrains for full infiltration or with underdrains for partial or no infiltration. The amount of infiltration depends on the permeability and characteristics of the native underlying soils [
26,
27,
28,
29].
PICPs are widely used for their surface infiltration performance [
30]. PICPs have large (approximately 1.5-cm wide) openings [
31] between the concrete paver blocks [
32], which facilitates movement of water from the surface into the aggregate base [
33,
34,
35]. The gaps between the pavers are filled with aggregates of 2–5 mm in diameter. Sediments and pollutants are removed as the stormwater infiltrates through the gap between the pavers and an underlying bedding layer [
33,
36].
In some situations, PICPs tend to clog quickly with sediment and debris [
37,
38,
39], which can be time-intensive and costly to remove. Many studies have found that the rate of surface-water infiltration and the age of the permeable pavement are inversely related [
32]. Drake et al. [
40] reported that the loss of hydraulic functionality over time is due to insufficient regular maintenance and inadequate knowledge of maintenance requirements. However, the maintenance costs for PICPs are still low relative to porous asphalt [
34].
Studies have shown that permeable pavement surface infiltration capability can be restored with maintenance after clogging with sediment and debris [
41,
42]. James and Gerrits [
41] studied the infiltration-rate reduction in an eight-year-old installation of PICPs, which had no maintenance procedures used other than street sweeping once a year. The study showed that the infiltration rate decreased from 200 mm/h to 25 mm/h [
41]. Moreover, the authors found that removing the top 1.5 cm of the joint material between the PICPs increased the infiltration rate to 150 mm/h. Replacing the top 2.5 cm of clogged material with fresh aggregates in the PICPs resulted in a complete restoration to the original infiltration rate of 200 mm/h. Accelerating and simplifying cleanout procedures would allow PICPs to be used more frequently for stormwater treatment [
34,
41,
43,
44].
In practice, cleaning equipment like vacuum trucks is generally employed to clean out PICPs. The literature also confirms that different street sweeper technologies can restore the high-infiltration capacity of the permeable pavement [
34,
45]. Street sweeper technologies for cleaning and maintenance include mechanical broom sweepers (MSSs), vacuum broom sweepers (VSSs), regenerative air street sweepers (RASSs), and high-efficiency sweepers [
34,
46]. The MSSs are used by 41% of local governments in the United States and Canada [
47]. According to Fleming [
48], RASSs are environment-friendly street sweeper technology, as no air or dust is exhausted into the atmosphere during cleaning operations. RASS can clean the entire width of the sweeping head and, compared to VSS, pick up finer particles and larger debris, without clogging the pick-up nozzle [
49].
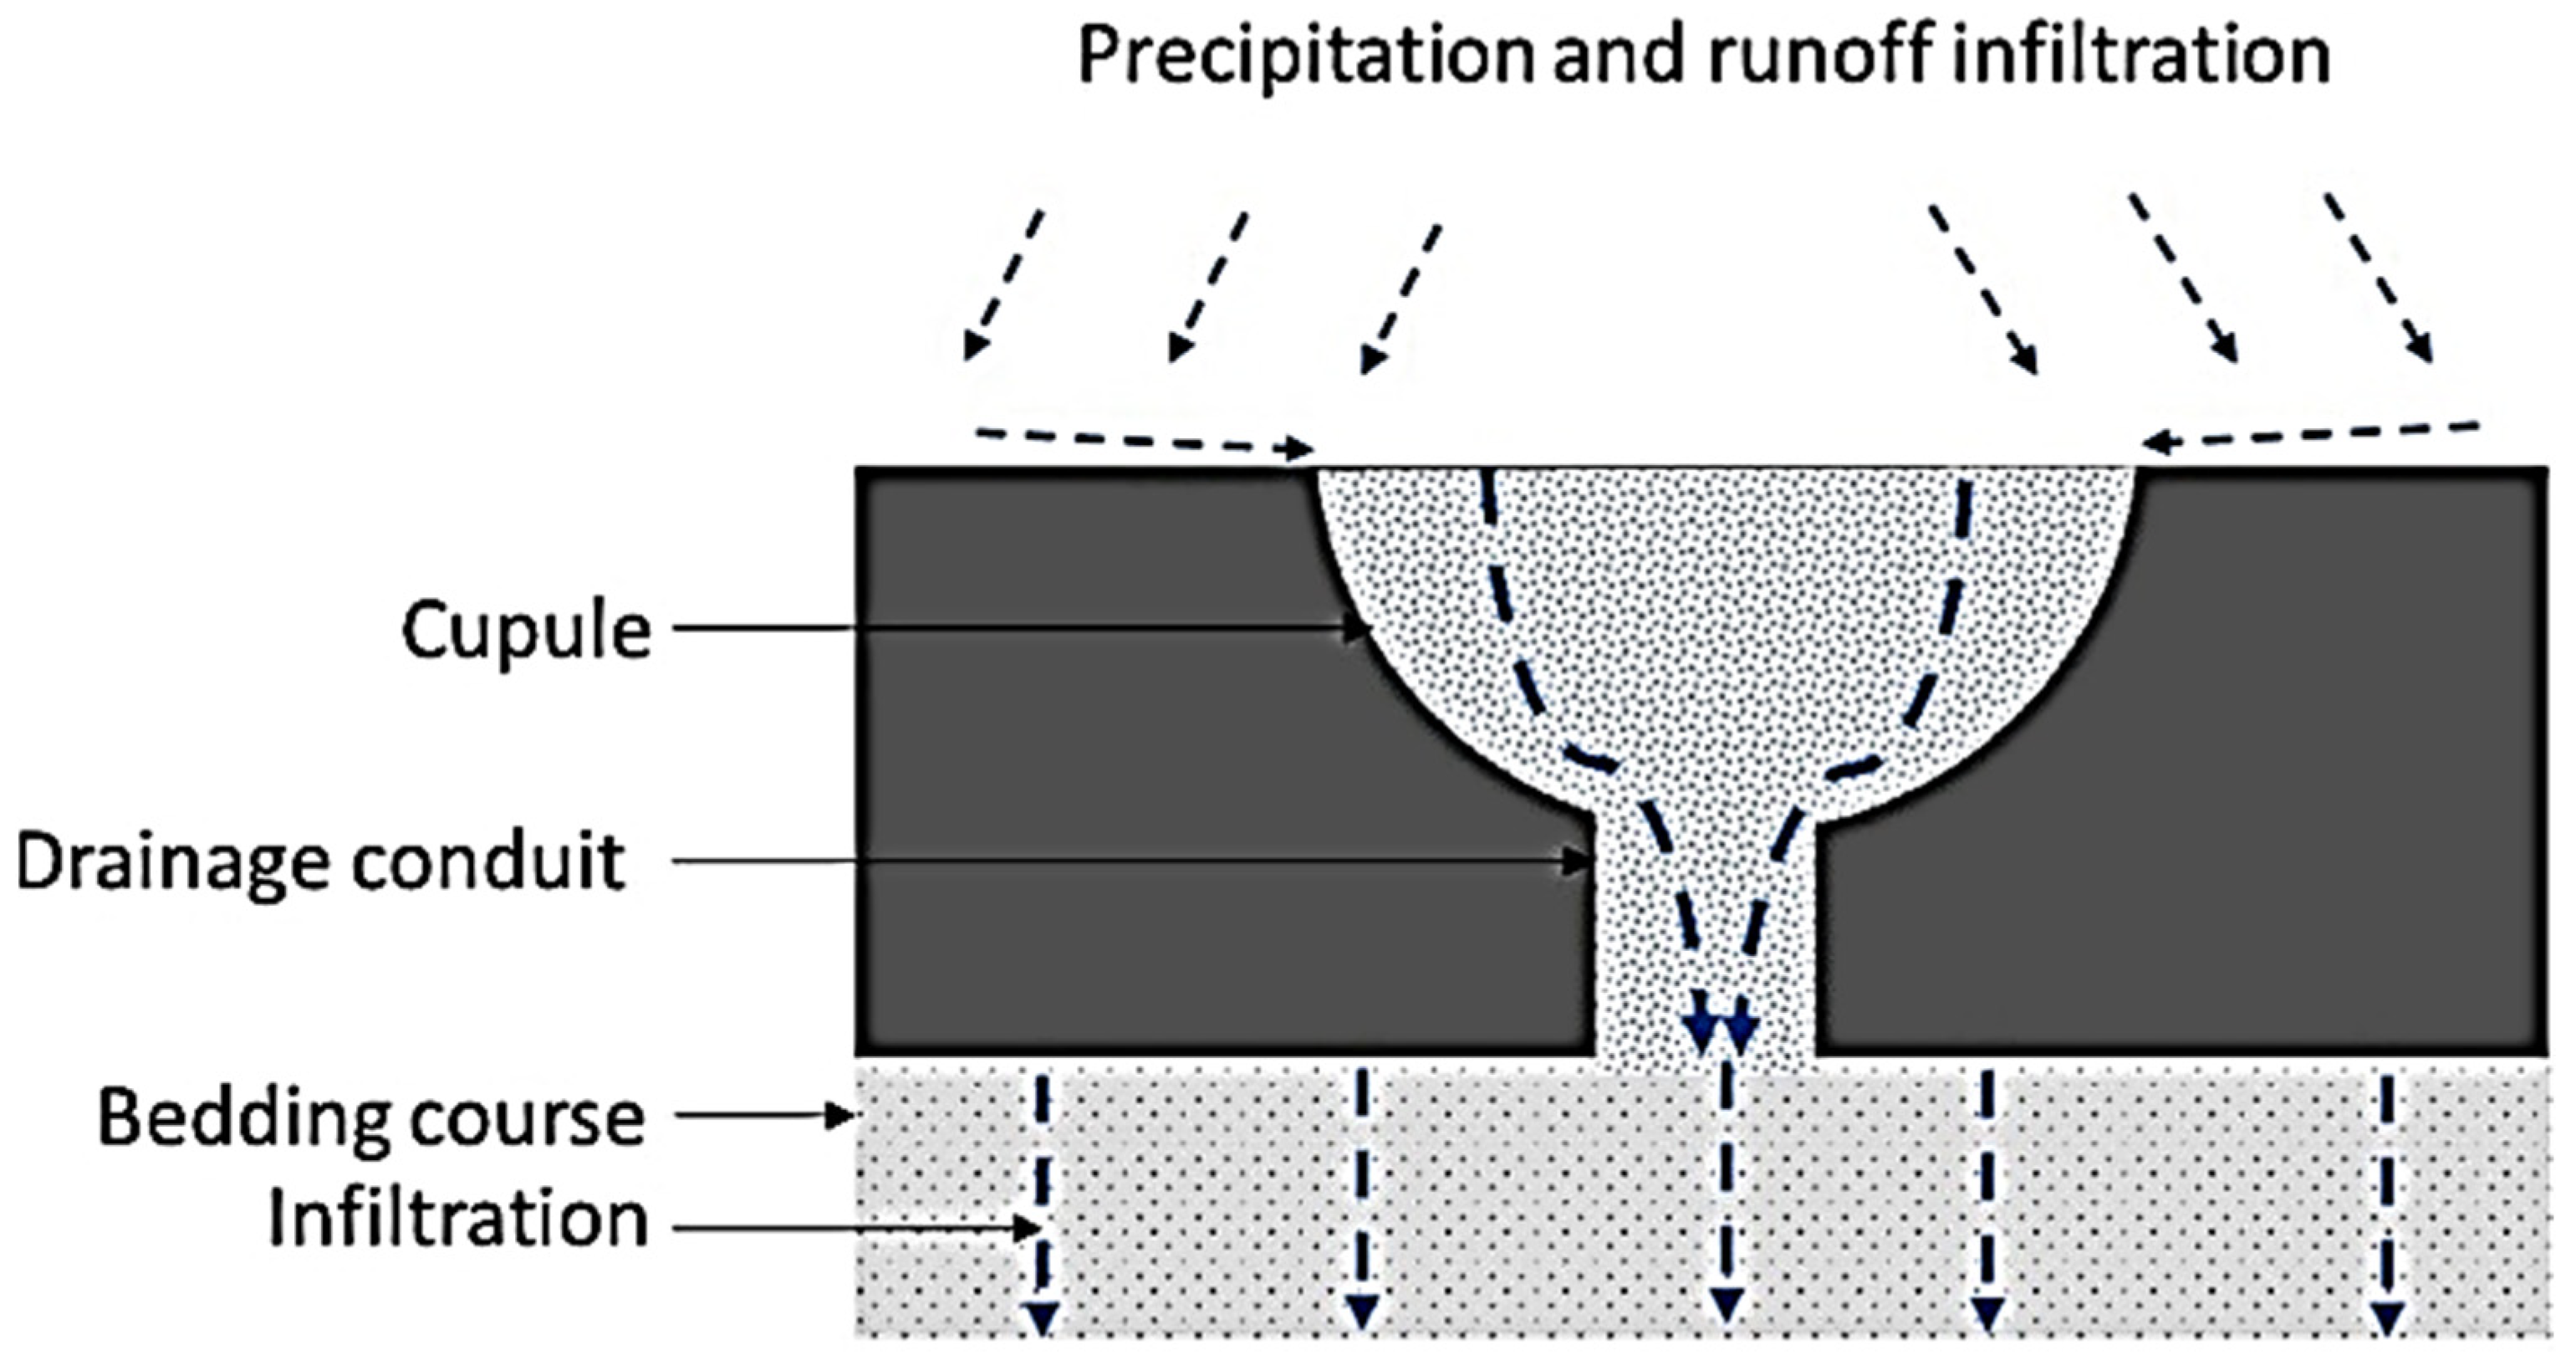
There are various types of PICPs found in the industry, such as AquaPave, Eco-Optiloc [
50], and the newly introduced Rapidly Cleaned Permeable Pavers (RCPP) [
45]. The new RCPP is designed with special cell geometries and special-purpose cupules. As shown in
Figure 1, the cupule is a specially designed surface, consisting of a depression in the PICPs adjacent to the drainage conduit that allows the movement of water from the surface to the sub-grade base reservoir.
The magnitude of the removal force applied, the duration of such force, the compactness/size of the masses being removed, and the type of material to be removed govern the performance of vacuum equipment [
34]. A detailed understanding of the variables affecting the cleanout processes and the targeted infiltration rates of PICPs is required for improving the design of PICP cupules and the operation of cleaning equipment.
Machine-learning tools can be used to provide insights into the variables affecting clean-out. Generally, machine-learning tools can simulate nonlinear relationships between input variables and outputs using training datasets. During the training procedure, the weight given to each neuron link is adjusted until the error between simulated and measured output is minimized. The performance of the designed machine-learning architecture is tested independently during the testing period. Several existing techniques act as a black box and do not present explicit expressions that are desirable for practical use [
51].
Among machine-learning methods, the Group Method of Data Handling (GMDH) is well-known as an inductive self-organized learning algorithm that has been applied in various practical engineering problems and has performed well for solving extremely complex nonlinear multi-variable problems [
51,
52,
53,
54,
55,
56,
57]. The GMDH algorithm establishes the relationship between independent and dependent variables by designing an optimal architecture through quadratic regression polynomials [
51,
57,
58].
The overall goal of this study is to examine the processes associated with the removal of masses from drainage spaces between the permeable interlocking concrete pavers (PICPs). A permeable pavement was set under laboratory conditions with filter media replicating the properties of masses to be removed from the gaps between the pavers. To achieve the main objective, several steps were carried out. The first step is to develop an understanding of key variables that affect the cleanout processes in RCPPs by using a laboratory setup that mimics commercial cleaning equipment. The second step is to develop a Group Method of Data Handling (GMDH) model using lab data to estimate cleaning performances under different conditions. The third step is to analyze the case-study applications using the developed models to improve the cost-effectiveness of cleaning equipment design and operation.
2. Materials and Methods
As part of this study, a comprehensive laboratory test was performed in the Hydraulic Laboratory of the School of Engineering at the University of Guelph. The dataset is used to train and test the machine-learning model developed for the estimation of the effectiveness of PICP cleaning.
2.1. Laboratory Setup
A series of tests were completed using a custom-designed laboratory apparatus to examine the removal of filter media by a moving pick-up head, as affected by the independent variables: cleaning equipment speed over the pavement (truck); air speed in the cleaning jets; top opening width of the cupule; and filter media gradation. The dependent variable is the ratio of the mass removed relative to the original cupule filter media mass. The apparatus, shown in
Figure 2a,b, is designed to simulate the air flow at the pavement-surface joints. The pickup head of a regenerative air street sweeper (RASS) moves laterally along the pavement, which has a geometry similar to the rapidly cleaned permeable pavers (RCPPs) [
34].
The skirting material between the moving head and the pavement was a brush made of nylon material. The gap between the head and pavement was 5 cm. The head of the forced jet was applied obliquely at 35o relative to the pavement surface. The truck (as can be seen in
Figure 2) with a certain jet velocity was moved manually from right to left. A stopwatch was used to measure the time for the truck to cross the pavement. The track velocity of the truck was finally calculated by dividing the distance covered by the time taken by the truck.
Figure 3 presents a flowchart showing the sequence of the experimental activities.
The pick-up head of the truck was connected to the regenerative air source (Ridgid 12-gallon 5.0 Peak HP Vacuum (Model # WD1270) with a maximum forced air flowrate of 0.02 m
3/s) and passed over the RCPP at different track velocities, varying from 0.1 to 1.2 m/s. The tested cupules were of three different designs, as presented in
Table 1.
Pavers with different cupule designs were provided to the authors by industry partners (see acknowledgments). The divider in Cupule 1 is one of the earlier designs of James et al. [
34] and has been found to pose challenges in their industrial construction. The concave shape of cupules is designed for the efficient removal of clogged materials by regenerative air sweepers. Such concave surfaces are expected to generate vortices for flows with negligible viscosity (similar to air in the present study), which tend to create turbulence and remove the masses within them [
59]. A single RCPP was inserted in the rectangular plexiglass housing, as shown in
Figure 2 above. The bedding layer located below the paver and encased by additional plexiglass housing comprises a single aggregate material throughout the tests. The connection between the cupule and the bedding layer was filled with the same aggregate as used in the bedding layer. Six filter materials of different sizes were used to fill the cupule for the laboratory tests. Refer to
Figure 2 and
Table 1 to visualize the connection between the cupule and the bedding layer.
2.2. Sieve Analysis
Generally, for a given soil (filter media in this case), the percentage distribution of sand, silt, and clay determines its structure. Sieve analysis is a mechanical means of determining the size range of particles present in filter media, with results expressed as a percentage of the total dry weight. TRCA and STEP [
60] report that sieve analysis is an acceptable method to determine a filter media’s particle size distribution (PSD). A series of mechanical strainers are used, and the percentage of filter media retained at each sieve of varying mesh openings is determined.
Six materials were selected initially based on the visible distinctness of fine-to-coarse texture. These materials were Tan Limestone well-graded sand, with D50 ranging from 0.34 to 3.20 mm. The PSD was determined using sieve analysis, as described above. For this study, the particle size of the filter media used in the apparatus is expressed in terms of D50, which is the particle diameter above which 50% of the material is larger, and the remaining 50% is smaller.
2.3. Jet Velocity
The air velocity of the cleaning jet was measured using three different techniques: bag method, anemometer method, and pressure difference method. The flow rate was controlled by constricting the forced air using different nozzle openings ranging from 1 cm to 5.3 cm. The velocity was calculated for the bag method by filling the bag using the forced jet and measuring the time it took for the bag to empty. Using the dimensions of the bag, the volume of the air captured inside the bag is calculated. The volume, time, and opening of the nozzle were used to calculate the velocity. For the anemometer method, the anemometer (Kestrel 4000) was placed at the nozzle opening, and velocities were recorded from the anemometer display for all cases of different nozzle openings. For the pressure difference method, a relationship between pressure and flow rate in the nozzle was developed using Bernoulli’s equation. To simplify our task, we assumed energy loss is negligible and air is incompressible (at these low pressures). This yields the well-known equation for nozzle velocity, which is linearly proportional to the square root of the differential pressure on either side of the nozzle.
2.4. Development of Test Runs
Different jet velocities, track velocities, the top width of cupule, and the D
50 of the filter media were tested as presented in
Table 2. A total of 376 runs were tested by combining different values for these variables. For each test run, the percentage mass removal (PMR) was measured using the ratio of filter media mass removed from the cupule to the initial filter media mass placed in the cupule. A higher percentage mass removal means that clean-out is more effective with the conditions used in the test run. For this experiment, PMR = f (JV, TV, PS, TW, ρ, g), where ρ (kg/m
3) is the density of the particles, g (m/s
2) is the gravitational acceleration and the other variables, including Jet Velocity (JV), Track Velocity (TV), Particle Size (PS), and Cupule Top Width (TW), are as defined in
Table 2. In the later part of this paper, variables for the test runs and the removal of filter media mass were used for the development of models.
2.5. Performance Measures
Four performance indicators, shown in
Table 3, were selected to evaluate the performance of the developed models: coefficient of determination (R
2), root mean squared error (RMSE), mean absolute error (MAE), and percentage bias (PBIAS). The purpose is to evaluate how closely the predicted values of the percentage mass removed match the measured values in the laboratory tests. Statistical measures were used to assess the entire dataset, including the training and testing datasets. Of the total dataset, 67% was used to train the model and calculate the performance indicators, and the remaining 33% was used to validate the values measured in the laboratory tests.
2.6. Case Studies
Three cases representing real-world conditions are considered to showcase the application of the new GMDH model in this study. Two sites are assumed (Area 1 = 5000 m
2 with Length = 100 m, Width = 50 m, and Area 2 = 1000 m
2 with Length = 100 m, Width = 10 m)4. An economic comparison of the two sites is performed to better justify the selection of input parameters and the robustness of the model developed in this study. The required construction and rehabilitation cost (
$/m
2) of permeable pavement surface is taken from the “Low Impact Development Stormwater Management Practice Inspection and Maintenance Guide” [
52]. This analysis assumes that 90% of the filter media in the permeable pavement is removed, allowing the infiltration capacity to be regained. Track velocities and the time required to achieve this level of removal at the hypothetical sites are computed from the GMDH model. Three cases (i.e., Case 1, Case 2 and Case 3) are assumed with different track velocities (TV), jet velocities (JV), particle sizes (PS), and top widths (TW). Case 1: JV = 55 m/s, TV = 0.5 m/s, PS = 5 mm, TW = 14.8 cm; Case 2: JV = 80 m/s, TV = 1.0 m/s, PS = 5 mm, TW = 14.8 cm; Case 3: JV = 40 m/s, TV = 0.1 m/s, PS = 1 mm, TW = 8.2 cm.
The average velocity used in the development of the test runs, along with the development of the GMDH model, is the average value of multiple trials of the bag, anemometer, and pressure difference methods.
Table 4 shows the measured velocity using the bag, anemometer, and pressure difference methods. Such average values are expected to be more precise than individual values of different methods [
61].
4. Discussions
A higher percentage mass removal efficiency was achieved for higher jet velocity acting on the cupule. The lower jet velocity resulted in less scour of the cupule, resulting in less filter media mass removed. The results show that slower track velocities, higher jet velocities, and longer exposure help in higher mass removal.
Particle sizes used in the laboratory experiments varied from D
50 = 0.34 mm to 3.24 mm. The track velocity, jet velocity, and cupule design were not varied to see the changes in percentage mass removed with the various median particle sizes.
Figure 5 presents the percentage mass removal achieved for each median particle size tested. Only 31% mass removal was achieved for the finest particles (D
50 = 0.34 mm), whereas 48% removal was achieved for the coarsest particles (D
50 = 3.24 mm). The results show that the coarser the grain size, the more mass is removed, as finer filter material tends to settle through the voids of base aggregates and is not added to the masses removed. Brown et al. [
60] also reported that when the size range decreases, the removal efficiency begins to drop drastically. The finer particles pass through the base layer aggregate and are trapped and retained below.
Maintenance costs, which are expected yearly from the second year after pavement installation, are found to be similar under the moderate and higher speeds of cleaning trucks. However, the results revealed that the surface area of the pavements to be cleared plays a key role because a larger area takes longer cleaning time. Pavements with larger surface areas are found to have lower maintenance costs (
$/m
2/year) compared to the ones with smaller surface areas. This study estimates
$0.32/m
2/year and
$0.5/m
2/year to maintain pavements with larger (5000 m
2) and smaller (1000 m
2) surface areas, respectively. The costs to clean permeable pavement under the investigated conditions were lower than the estimated costs (
$0.6/m
2/year) in the LID inspection and maintenance guide [
57].
Using the standard rates of the LID guide [
52] and the rates estimated from this study, the maintenance cost for a 25-year period of 5000 m
2 pavement ranges from
$38,400 to
$72,000. A savings of approximately
$33,000 can be expected with the application of the cleaning equipment over larger areas compared to smaller ones. A saving of
$2400 can be expected from smaller pavement areas with the prescribed conditions in Cases 1 and 2 of this study.
Engineering Implications of This Study
The analysis of this study shows the effect of track velocity, jet velocity, width of the cupule, and median particle size on the PMR. Compared to the lab conditions (JV = 20.2 Itto 53.4 m/s, TV = 0.1 m/s to 1.3 m/s), industries generally employ apparatus like RASS, with higher track and jet velocities (JV = 50 m/s to 100 m/s, TV = 1.34 m/s to 2.2 m/s) [
61]. In comparison to the test ranges of these variables, an increase in RASS track velocity is expected to decrease the percentage mass removal. In contrast, an increase in jet velocity will likely increase the percentage mass removal. The combined effect of the increase in jet velocity and decrease in track velocity is yet to be assessed under laboratory and field conditions. In addition, the compactness of the sample aggregates considered in the study may differ from the real-world conditions and affect the expected results.
Similarly, street sweepers like RASS employ jet nozzles to release blasts of air. Generally, they have a higher percentage mass removal due to the shorter acting distance between the jet nozzle and pavement. Tymco [
57] reported this acting distance in real-world conditions to be approximately 3.8 cm, which is less than the 5 cm adopted in the laboratory experiment. In real-world conditions, we expect higher jet velocities from such trucks and, thus, higher percentage mass removals from pavements. However, the potential wear and tear along the jet nozzles and curtains of industrial RASS may impact the percentage mass removals due to the anticipated losses in the energy of blasts.
5. Conclusions
The variables affecting sustainable and economically feasible maintenance of permeable interlocking concrete pavers (PICPs) are yet to be fully understood under different conditions, such as age, materials, and the condition of the pavement, subgrade and slope, moisture content of the filter media, bedding layer, etc. Percentage mass removals (PMR) from three different cupules were measured using a laboratory apparatus and variable Jet Velocity (JV), Track Velocity (TV), Particle Size (PS), and Top Width (TW).
Four variables affecting PMR under laboratory conditions, including Jet Velocity (JV), Track Velocity (TV), particle size (PS), and top width (TW), were used to derive three dimensionless parameters for the models using the Buckingham Pi-Theorem.
A GMDH model was developed with reasonable accuracy to predict mass removals under the influence of different variables. The study provided insights into variables affecting the maintenance of PICPs. The key findings of this study are summarized as follows:
Jet velocities, particle size, and track velocities were the top three influential variables for PMR.
Track velocity was found to have an inverse relationship with PMR, while jet velocity was found to be directly related to PMR.
The GMDH model has the potential to estimate percentage mass removal from tested pavement and particular cleaning equipment under certain operational settings.
The GMDH can be used to compare different scenarios, which may not be possible from the laboratory experiments alone.
This study found a combination of higher jet velocity, lower track velocity, larger particle size, and wider cupule openings that produce the optimum results for percentage mass removals. Regular cleaning of PICP using higher jet velocities and lower track velocities may improve the function of such pavements (infiltration and prevention of undesirable ponding) and delay replacement.
The PMR in the industrial conditions were estimated with the model built from the results, which revealed potential savings in maintenance costs by applying moderate jet and track velocities. Such benefits are expected to be higher for pavements with larger surface areas than smaller ones. This study suggests that the industrial application of RASS for similar pavements can be expected to achieve higher PMR if the trucks maintain moderate jet and track velocities.
There were a few limitations of this study, which can be addressed in future studies:
Further investigate the optimal angle of the cleaning jet and height of blast orifice to the top of the pavement.
Investigate the effect of material density, cohesion, moisture, and particle shape (angular versus round).
Further investigate the mass removal efficiency for concrete cupules used in industrial applications.
The modeler selected the combinations of four variables to understand the effect on the cleanout of PICPs. However, for future robust estimates of maintenance cost or cleanout of PICPs in similar studies, sampling design, or permutation and combination techniques are recommended to obtain combinations of variables to simulate.
Conduct a field test to visualize the effects of real-world compaction in joints of the paver, then investigate the performance of street cleaning trucks on mass removals. Samples of compacted masses can be scooped (collected) and analyzed in laboratory conditions for their effective granular sizes, moisture content, and other relevant parameters.
Investigate head loss (energy loss) due to potential wear and tear of nozzles and curtains of industrial RASS.
This study’s findings provide insight into the potential variables affecting the cleanout of filter media masses from permeable pavers. The results of this research can be applied to improve the performance of cleaning equipment and reduce the associated operation and maintenance costs of the PICPs.
The model presented in this study is needed to calculate the cost of the maintenance (i.e., how fast the sweeper can clean an area to achieve a target percent removal efficiency or cleaning for rejuvenation of the PICP). Without proper and cost-optimized clean-out, permeable pavements would not perform optimally. Clogging can significantly diminish their flood risk mitigation and water-quality improvement benefits. Cost optimization can be achieved by designing/selecting the size of the filter media and cupule design for the PICP and the sweeper jet velocity and track velocity (based on available options in a given market) to reduce annual maintenance costs for the municipality or private landowners. Municipalities responsible for the maintenance of permeable pavements within their jurisdictions can adopt new policies and implement new standards for PICP maintenance contractors to achieve optimal performance of these systems.


