Article

Reservoir Reliability as Affected by Climate Change and Strategies for Adaptation

by
Henrique Marinho Leite Chaves
1,*,
Camila Correa da Silva
1 and
Maria Rita Souza Fonseca
2
1
School of Technology/EFL, University of Brasilia-UnB, Brasilia 70910-900, Brazil
2
Geography Department, University of Brasilia-UnB, Brasilia 70910-900, Brazil
*
Author to whom correspondence should be addressed.
Water 2023, 15(13), 2323; https://doi.org/10.3390/w15132323
Submission received: 17 April 2023 / Revised: 13 June 2023 / Accepted: 16 June 2023 / Published: 22 June 2023
(This article belongs to the Section Hydrology)

Abstract

:
Reservoir operational reliability indicates how satisfactorily the structure meets the water demand without failure. However, due to the stochastic nature of its operation, every combination of reservoir storage capacity and draft has an associated probability of failure (i.e., of having an empty reservoir). The objectives of this research were to design a method to assess reservoir reliability under present and future climate conditions, and to apply it to the Descoberto reservoir, with a capacity of 86 hm3 and a design draft of 182.9 hm3 yr−1, located in central Brazil. The scenarios were the historic (1986–2005) and future RCM projection ensembles (2031–2050 and 2061–2080, RCP 4.5 and 8.5). Projected runoff was obtained with the Gardner model, and the reservoir budget was assessed by the concatenated behavior analysis (CBA). The reliability of the Descoberto reservoir, which was 100% during the historic period, was reduced to 15–50%, depending on the future climate scenario analyzed. The proposed adaptive measures, involving the reduction of reservoir draft and the increase in reservoir storage, were capable of maintaining a 100% reservoir reliability under the new climatic conditions, but with associated costs. The proposed method can be applied to other upstream reservoirs, providing water managers and stakeholders with a simple and robust reliability assessment and climate adaptation tool.

1. Introduction

Water storage reservoirs provide multiple benefits, including water supply, hydropower generation, irrigation, and flood control, and are considered viable when benefits outweigh detrimental effects [1]. Reservoir operational reliability indicates how satisfactorily the structure meets the water demand without failure [2,3]. However, due to the stochastic nature of its operation, every combination of reservoir storage capacity and draft has an associated probability of failure, i.e., of having an empty reservoir [4].
Reservoirs are often built with incomplete hydrologic information, generating operational uncertainty [5], even where large inflow series exist [6]. Regardless of the type of storage reservoir or its mode of operation, hydrologic risk should be assessed, providing reliable forecasts of water inflows, drafts, and storage [4].
One of the factors affecting reservoir reliability is climate variability [7], including hydrologic persistence, characterized as a long-term phenomenon in which a sequence of low or high inflows occurs in a cluster [8]. A sequence of six years of below-average inflows, characterized by a Hurst coefficient of 0.66, led to a reservoir failure in Central Brazil, despite being operated under 100% reliability [9].
Non-homogeneity in reservoir hydrologic data, such as persistence, requires the utilization of non-classical statistics [10] and of adaptive reservoir operation [11]. In Brazil, the ex ante probability of failure of a storage reservoir was validated by ex post reliability data only when non-classical statistics was utilized [9]. In Australian reservoirs, water demand was taken as 70% of the design draft and storage to avoid reservoir failure [12]. In Vietnam, reservoir operation rules were adjusted to incorporate increases of 10–30% in forecasted stream flows [13].
In addition to natural climate variability, future climate change can reduce reservoir reliability [14], affecting reservoir design capacity and operation [15]. Therefore, the quantitative recognition of climate change effects on reservoir hydrology creates readiness to deal with its negative consequences [16]. These effects include the expected increase in the frequency and duration of both wet and dry extreme events [17], alteration in precipitation, evapotranspiration, and flow routing [18], all affecting the attainment of multiple reservoir objectives [19].
Evidence of future climate change impacts in hydrology is growing [20]. An increase in 2 °C in global temperature would increase global precipitation and evapotranspiration by 0.02% and 6%, respectively, augmenting global aridity [21]. As a consequence, variations in reservoir inflows are expected, requiring reservoir operations to be adapted accordingly [22], and the improvement of reservoir forecasts with the continuous evaluation of its quality [23].
Hydrological projections of five river basins around the world indicates that low (Q95%) and high (Q5%) flows would differ from the present values [24]. In Australia, a significant decrease in mean annual runoff was projected for the majority of 222 storage reservoirs and catchments between 2056 and 2090, significantly reducing their water supply capability [12].
In the western United States, projected annual stream flows for the period of 2050–2095 would be reduced by 44–56% compared to the present conditions. In California (USA), a decrease of 10–22% in reservoir inflows was predicted for 2020–2040, and a reduction of 24–30% for 2070–2099 [25].
Hence, reservoir adaptation strategies are needed to cope with the hydrological consequences of climate change, including the alteration in operational rules [26]. In Greece, an increase of 12–50% in reservoir storage is required to maintain the current reservoir risk levels, depending on the GHG emission scenario [27]. In the Seine River valley in France, reservoir storage volumes were adjusted to tackle future inflow reductions [25].
However, reservoir reliability projections are limited by the coarse spatial and temporal scales [20] and the inherent uncertainty and bias [28] of GCM climate data, requiring a refined and customized framework to provide locally relevant reservoir hydrologic information [19]. This can be accomplished by downscaling GCM projections with RCMs, providing a finer scale and a better representation of the physical processes occurring at the watershed level [29].
Additionally, bias correction and the utilization of RCM ensembles are necessary to render the regionalized projections closer to the reference data [30], including coherent climatological moments, such as means and variances [31]. However, data post-processing does not guarantee that the error will be eliminated in future climate projections, especially if the latter is expected to change [29].
Considering the aspects above, and recognizing the need of new methodologies to assess reservoir reliability under climate change scenarios and to establish appropriate adaptive measures, the objectives of this study were: (a) to develop a new method to assess the impact of climate change on the reliability of storage reservoirs; (b) to identify effective adaptive measures to maintain adequate levels of reservoir reliability; and (c) to apply the developed methodology to an existing water supply reservoir in Central Brazil, as an example of reservoir reliability assessment and adaptation.

2. Materials and Methods

2.1. Reservoir Reliability and Adaptation Scheme for a Changing Climate

A six-step scheme was designed to assess the operational reliability of upstream reservoirs and, at the same time, to tackle the impacts of climate change, including aspects such as reservoir characterization, hydrologic model calibration, reservoir reliability assessment, hydrologic projection scenarios, and identification of prospective adaptative measures (Figure 1). In this study, only upstream reservoirs were considered, but the approach will be adapted to cascading reservoirs opportunely.

2.2. Reservoir and Watershed Characterization

The first step in the reservoir reliability and adaptation assessment is the characterization of watershed and reservoir hydrology. In this stage, the reservoir characteristics, such as the active volume, the inflow time series, and the draft and spilling rules, essential for the reliability analysis [32], are obtained.
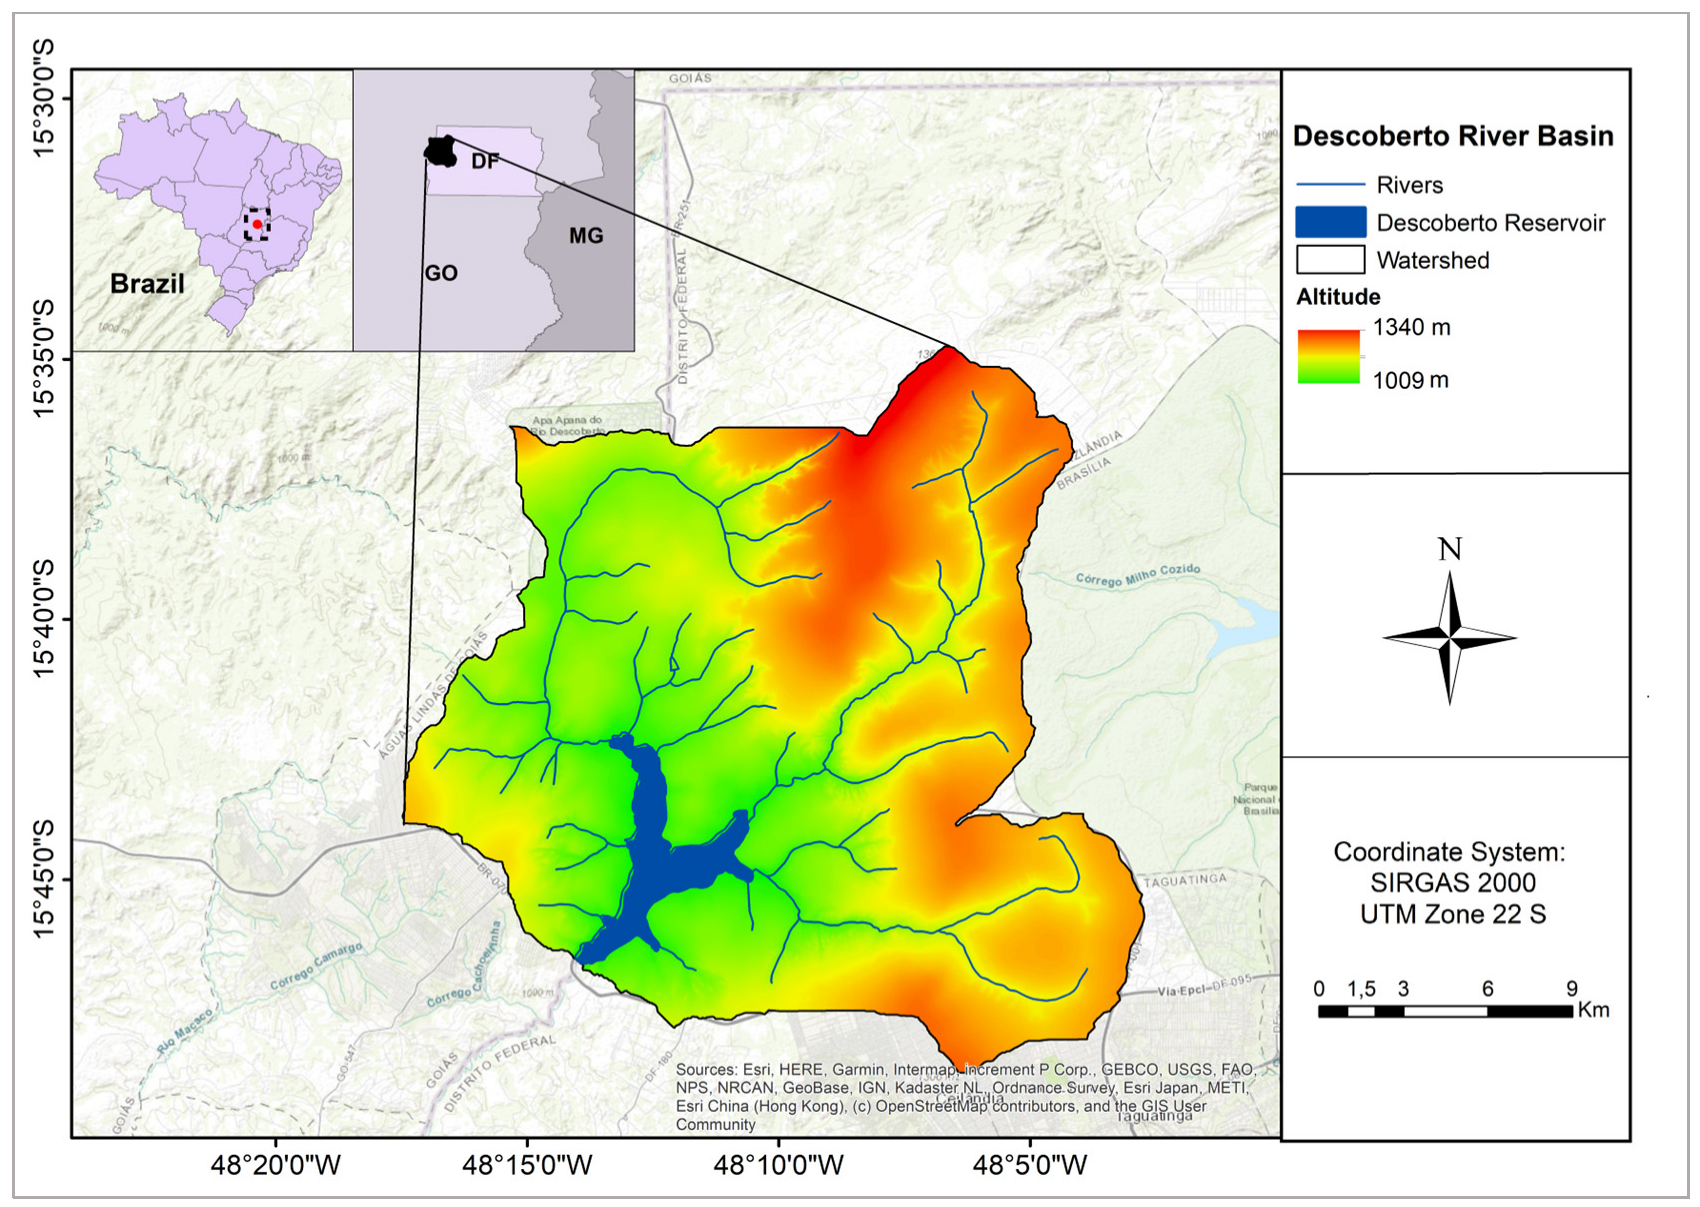
A detailed hydrologic characterization of upstream reservoirs and their corresponding watersheds was presented in a previous work [9]. To exemplify this step, the characteristics of the Descoberto upstream reservoir and its corresponding watershed, situated in Central Brazil, are presented (Figure 2, Table 1).
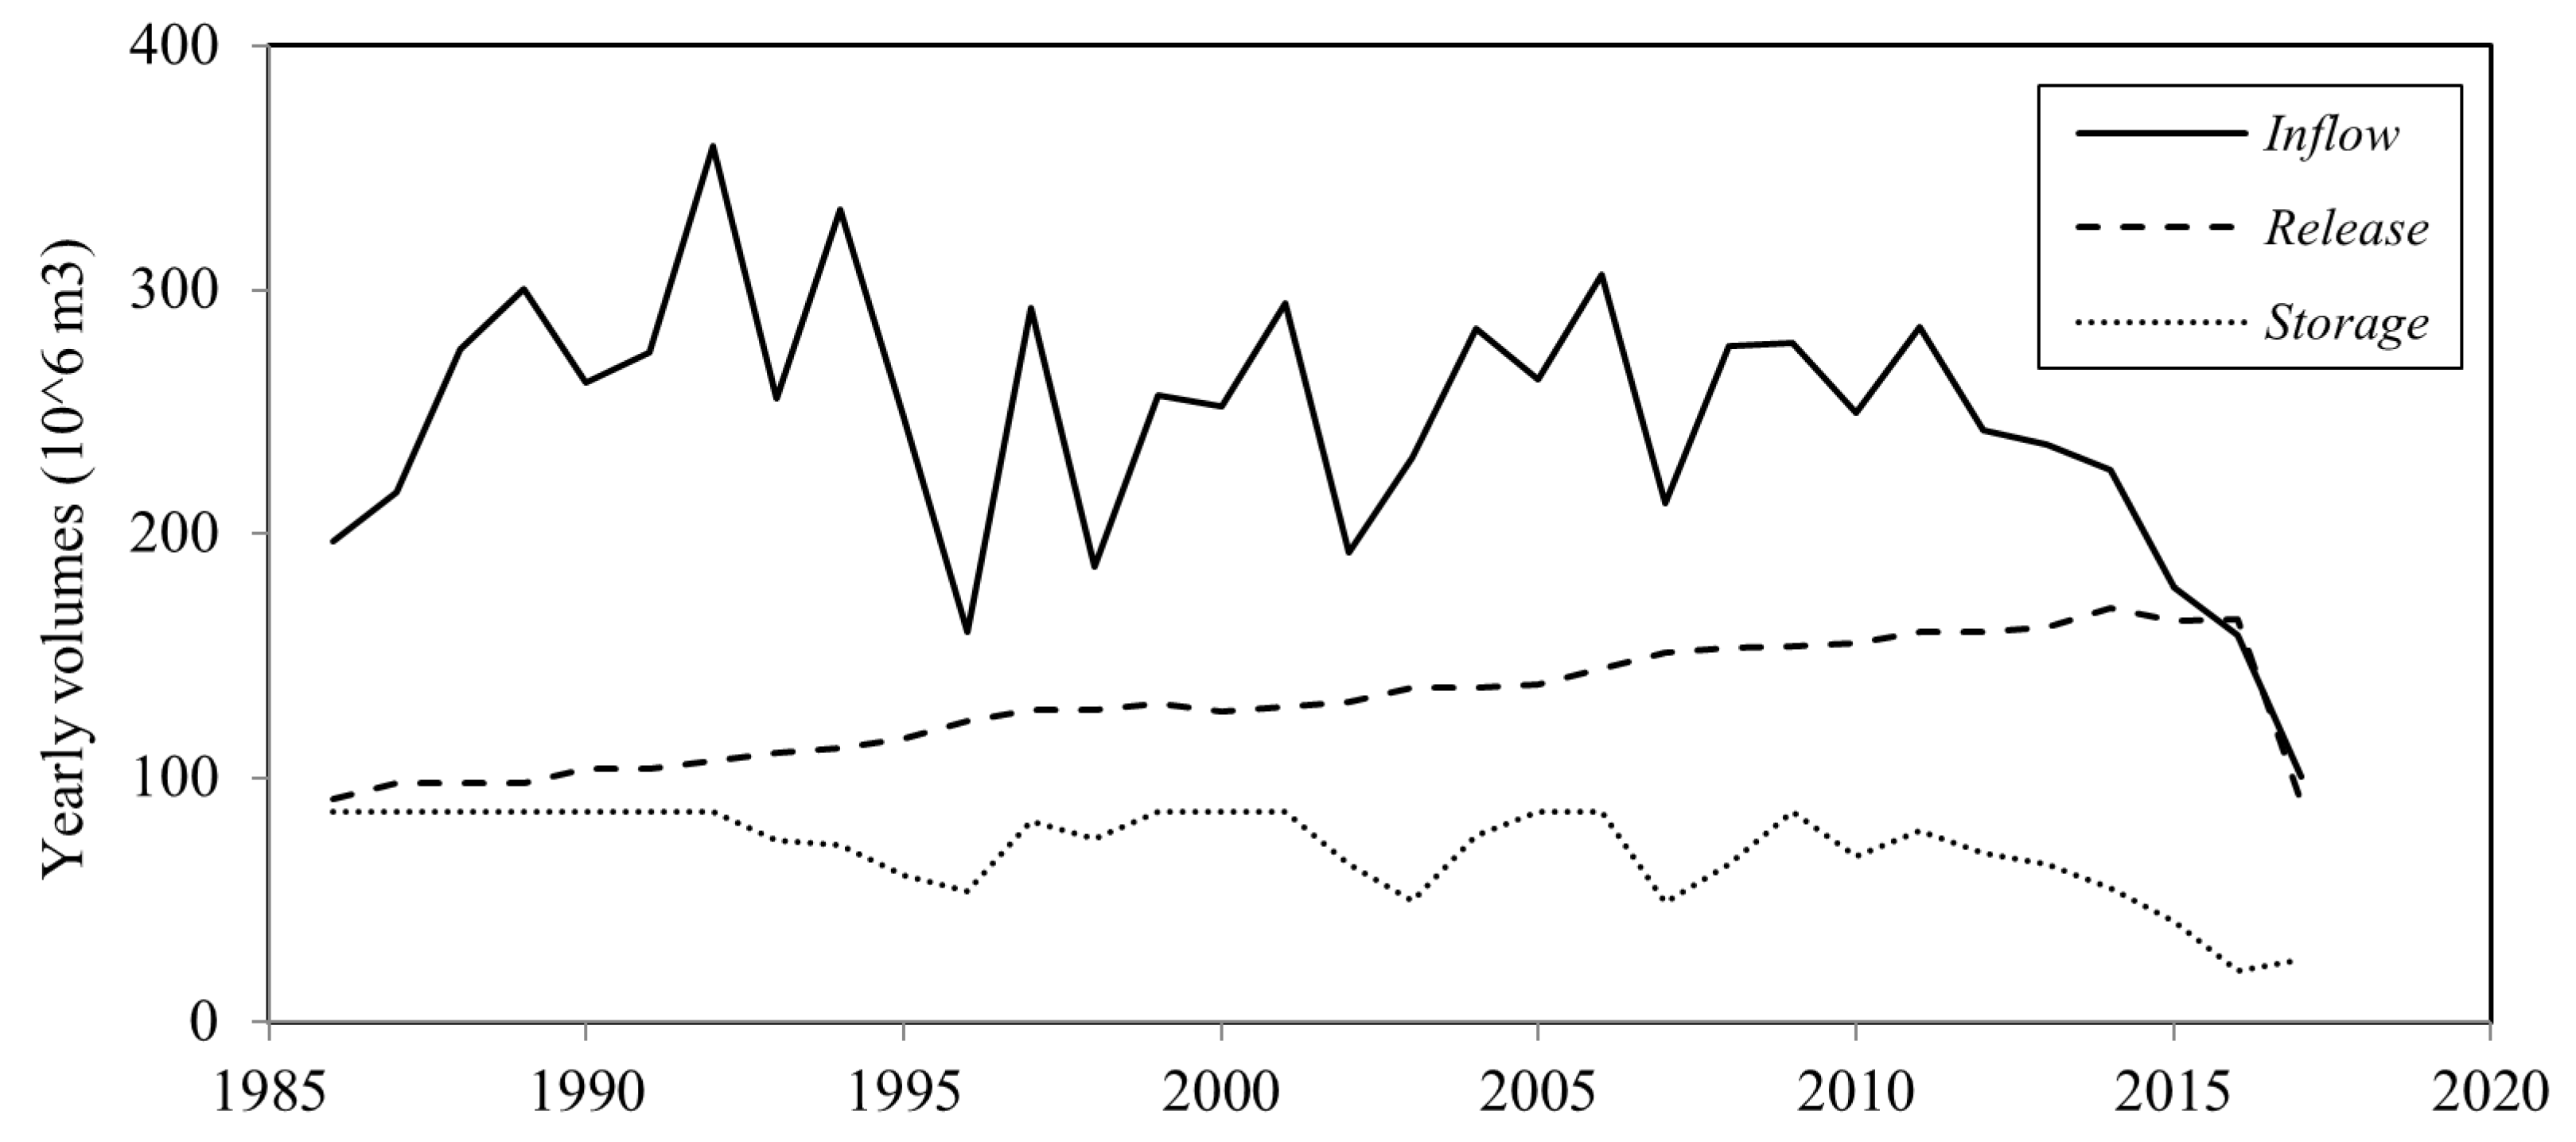
Under operation since 1986, the Descoberto reservoir failed to meet its design draft (5.2 m3 s−1) in 2017, after a sequence of six years of below-average inflows [9] (Figure 3). The break in the draft curve (D) in Figure 3 represents the water rationing response after the reservoir storage reached 5% of its active volume in 2017.

2.3. Model Calibration and Validation

Since mean annual runoff was used in the present analysis [2], a complex hydrologic model, capable of estimating inter-annual variability, was not required [32]. Therefore, a simple Budyko-type runoff model [33], designed to assess climate change impacts and validated in 26 Australian watersheds, was selected. The Gardner model calculates mean annual runoff as a function of annual precipitation and potential evapotranspiration [32]:
R = a P ∙ exp (−b PET/P)
and
PET = 1.2 × 10¹⁰ ∙ exp (−4620/T)
where R = mean annual runoff (mm yr−1); P = mean annual precipitation (mm yr−1); PET = mean annual potential evapotranspiration (mm yr−1); T = mean annual temperature (°K); and a and b are calibration parameters.
Since the calibration and validation of runoff models should be carried out with historic data before climate change impact assessments [30], the calibration of parameters a and b in Equation (1) was obtained using the odd years of a 29 yr (1987–2015) series of historic annual precipitation, temperature, and reservoir inflows [34], using the Nash–Sutcliffe efficiency (NSE) index [35] as the objective function and performance indicator [29,36]:
N S E = 1 [ i = 1 n ( Q i o Q i s ) 2 / i = 1 n ( Q i o Q i m ) 2 ]
where Qo = observed annual inflow (mm yr−1); Qs = simulated annual inflow (mm yr−1); and Qm = mean observed inflow (mm yr−1). The NSE index is robust, since it is more sensitive than other indices to differences in observed and simulated means and variances [37].
Once the runoff model was calibrated, it was validated using the even years of the same 29-yr reservoir inflow series [34]. The model was considered calibrated and validated when a value of NSE ≥ 0.5 was achieved in both the calibration and validation steps [26,38,39]. Additionally, a scatterplot analysis was used to verify how the simulated runoffs graphically adhered to the observed values [38].

2.4. Reservoir Reliability

Reservoir reliability in both present and future conditions was assessed by the ex post probability of reservoir failure of a sequence of operational years [9,40], namely:
Rr = 1 − Pf = 1 − Nf/N
where Rr = reservoir reliability; Pf = reservoir probability of failure; Nf = number of years in which the required water demand was not met (empty reservoir); N = number of years in the time series.
To calculate the reservoir storage at any given year, the concatenated behavior analysis (CBA), a mass balance equation of inflows and outflows from a finite storage, was applied on a yearly basis, starting with a full reservoir at the beginning of the first year of the time series. Considering that the reservoir storage at any time t is limited between zero (dead storage) and c (reservoir capacity), the annual reservoir water budget equation is [2,32]:
St = max [0; St−1+ Xt − Dt, c]
where St = reservoir volume at the end of year t (106 m3); St−1 = reservoir volume at the end of year t−1 (106 m3); Xt = inflow at year t, adjusted for reservoir evaporation (loss) and precipitation (gain) over the lake (106 m3); Dt = total water demand (draft) at year t (106 m3); and c = reservoir capacity (106 m3). Reservoir release at year t (Rt) is given by [2]:
Rt = min (St−1+ Xt, Dt)
Finally, annual reservoir spill Wt (106 m3) is simply [2]:
Wt = St−1 − St + Xt − Rt
Equations (5)–(7) were programmed in an electronic spreadsheet, where the reservoir volume (St) was obtained at the end of a given year of the tine series. The probability of failure and the corresponding reservoir reliability (Pf and Rr in Equation (4), respectively) were then calculated for all years in the series.

2.5. Hydrologic Projection Scenarios

2.5.1. RCM Projections and Ensembles

To reduce uncertainties and bias in the climate projections at the watershed scale, an ensemble of RCM temperature (T) and precipitation (P) was obtained from the RCM Eta [40], using inputs of four GCMs (BESM, CanESM2, HadGEM-2, MIROC), including the historic (1987–2005) and two future periods (2031–2050 and 2061–2080), the latter using the IPCC’s RCP 4.5 (medium) and 8.5 (high) emission scenarios [41].
The Eta-RCM [41] has a 20 km grid size, providing the necessary spatial variability for the Descoberto watershed and reservoir system [29] (Figure 4). In order to obtain the mean annual T and P of the historic or future period, an average value was calculated for all grid cells covering the watershed and reservoir for each individual downscaled GCM (BESM, CanESM2, HadGEM-2, MIROC) projection. Subsequently, a simple ensemble mean [41,42] of T and P was obtained from the four downscaled RCMs, for each year of the historic and future series.

2.5.2. Bias Correction of P and T

The bias in T and P of the ensemble historic projections with respect to the observed data was corrected (post-processed) with a parametric equation, so that the first two moments (mean and variance) of the distribution of the corrected projection matched the moments of the observed data. The parametric bias-correction equation was [31]:
Yo = α + β Ym
where: Yo = the best estimate of P or T, Ym = the projected (modeled) value P or T; and α and β are parameters.

2.5.3. Projections of Reservoir Inflows and Watershed Water Budget

Once the annual T and P means of the ensemble RCMs were post-processed, runoff data for the historic (1986–2005) and future (2031–2050 and 2061–2080) periods, in both the RCP 4.5 and 8.5 scenarios, were calculated using the calibrated runoff model (Equations (1) and (2)). The computed annual reservoir inflows where then utilized as inputs to the CBA reservoir budget (Equations (5)–(7)) to assess reservoir reliability in the present and future scenarios.

2.5.4. Comparison of Historic and Future Climate and Hydrology

In order to statistically assess the variation in the climatic (P, T) and hydrological (Q, PET) variables between the historic and future scenarios, the non-parametric Mann–Whitney test [43] was utilized, because of its robustness with respect to non-normal and unbalanced data [44].

2.6. Reservoir Adaptation Measures

To mitigate the hydrologic impacts of climate change in the different scenarios, reservoir adaptation measures included a combination of operational and structural methods, such as reduced water demand [15] and increased reservoir storage [45], respectively, aiming at 100% reservoir reliability (Pf = 0%) (Table 2).
Therefore, if, in any given climate scenario, a non-zero probability of failure occurred in the reservoir budget analysis, two adaptation measures were considered: (a) reduction of reservoir demand (draft); and (b) a combination of increased reservoir capacity and demand reduction. In both cases, the downstream environmental flow (17.2 × 10⁶ m3 yr−1) was maintained at all times, as part of the reservoir release volume.
In the case of the water demand reduction measure, the annual draft (Dt in Equation (6)) would be reduced by trial and error until no reservoir failure occurred. On the other hand, the increase in reservoir capacity was achieved by raising the concrete dam spillway and embankment of the Descoberto reservoir by 1.0 m, resulting in an increase of 14 × 106 m3 (16%) in the reservoir capacity. Since the selection of the best adaptation alternative would result from additional economic and environmental feasibility analyses, which was beyond the scope of the present research, only the hydrological aspects of adaptation were addressed in the study.

3. Results

3.1. Runoff Model Calibration and Validation

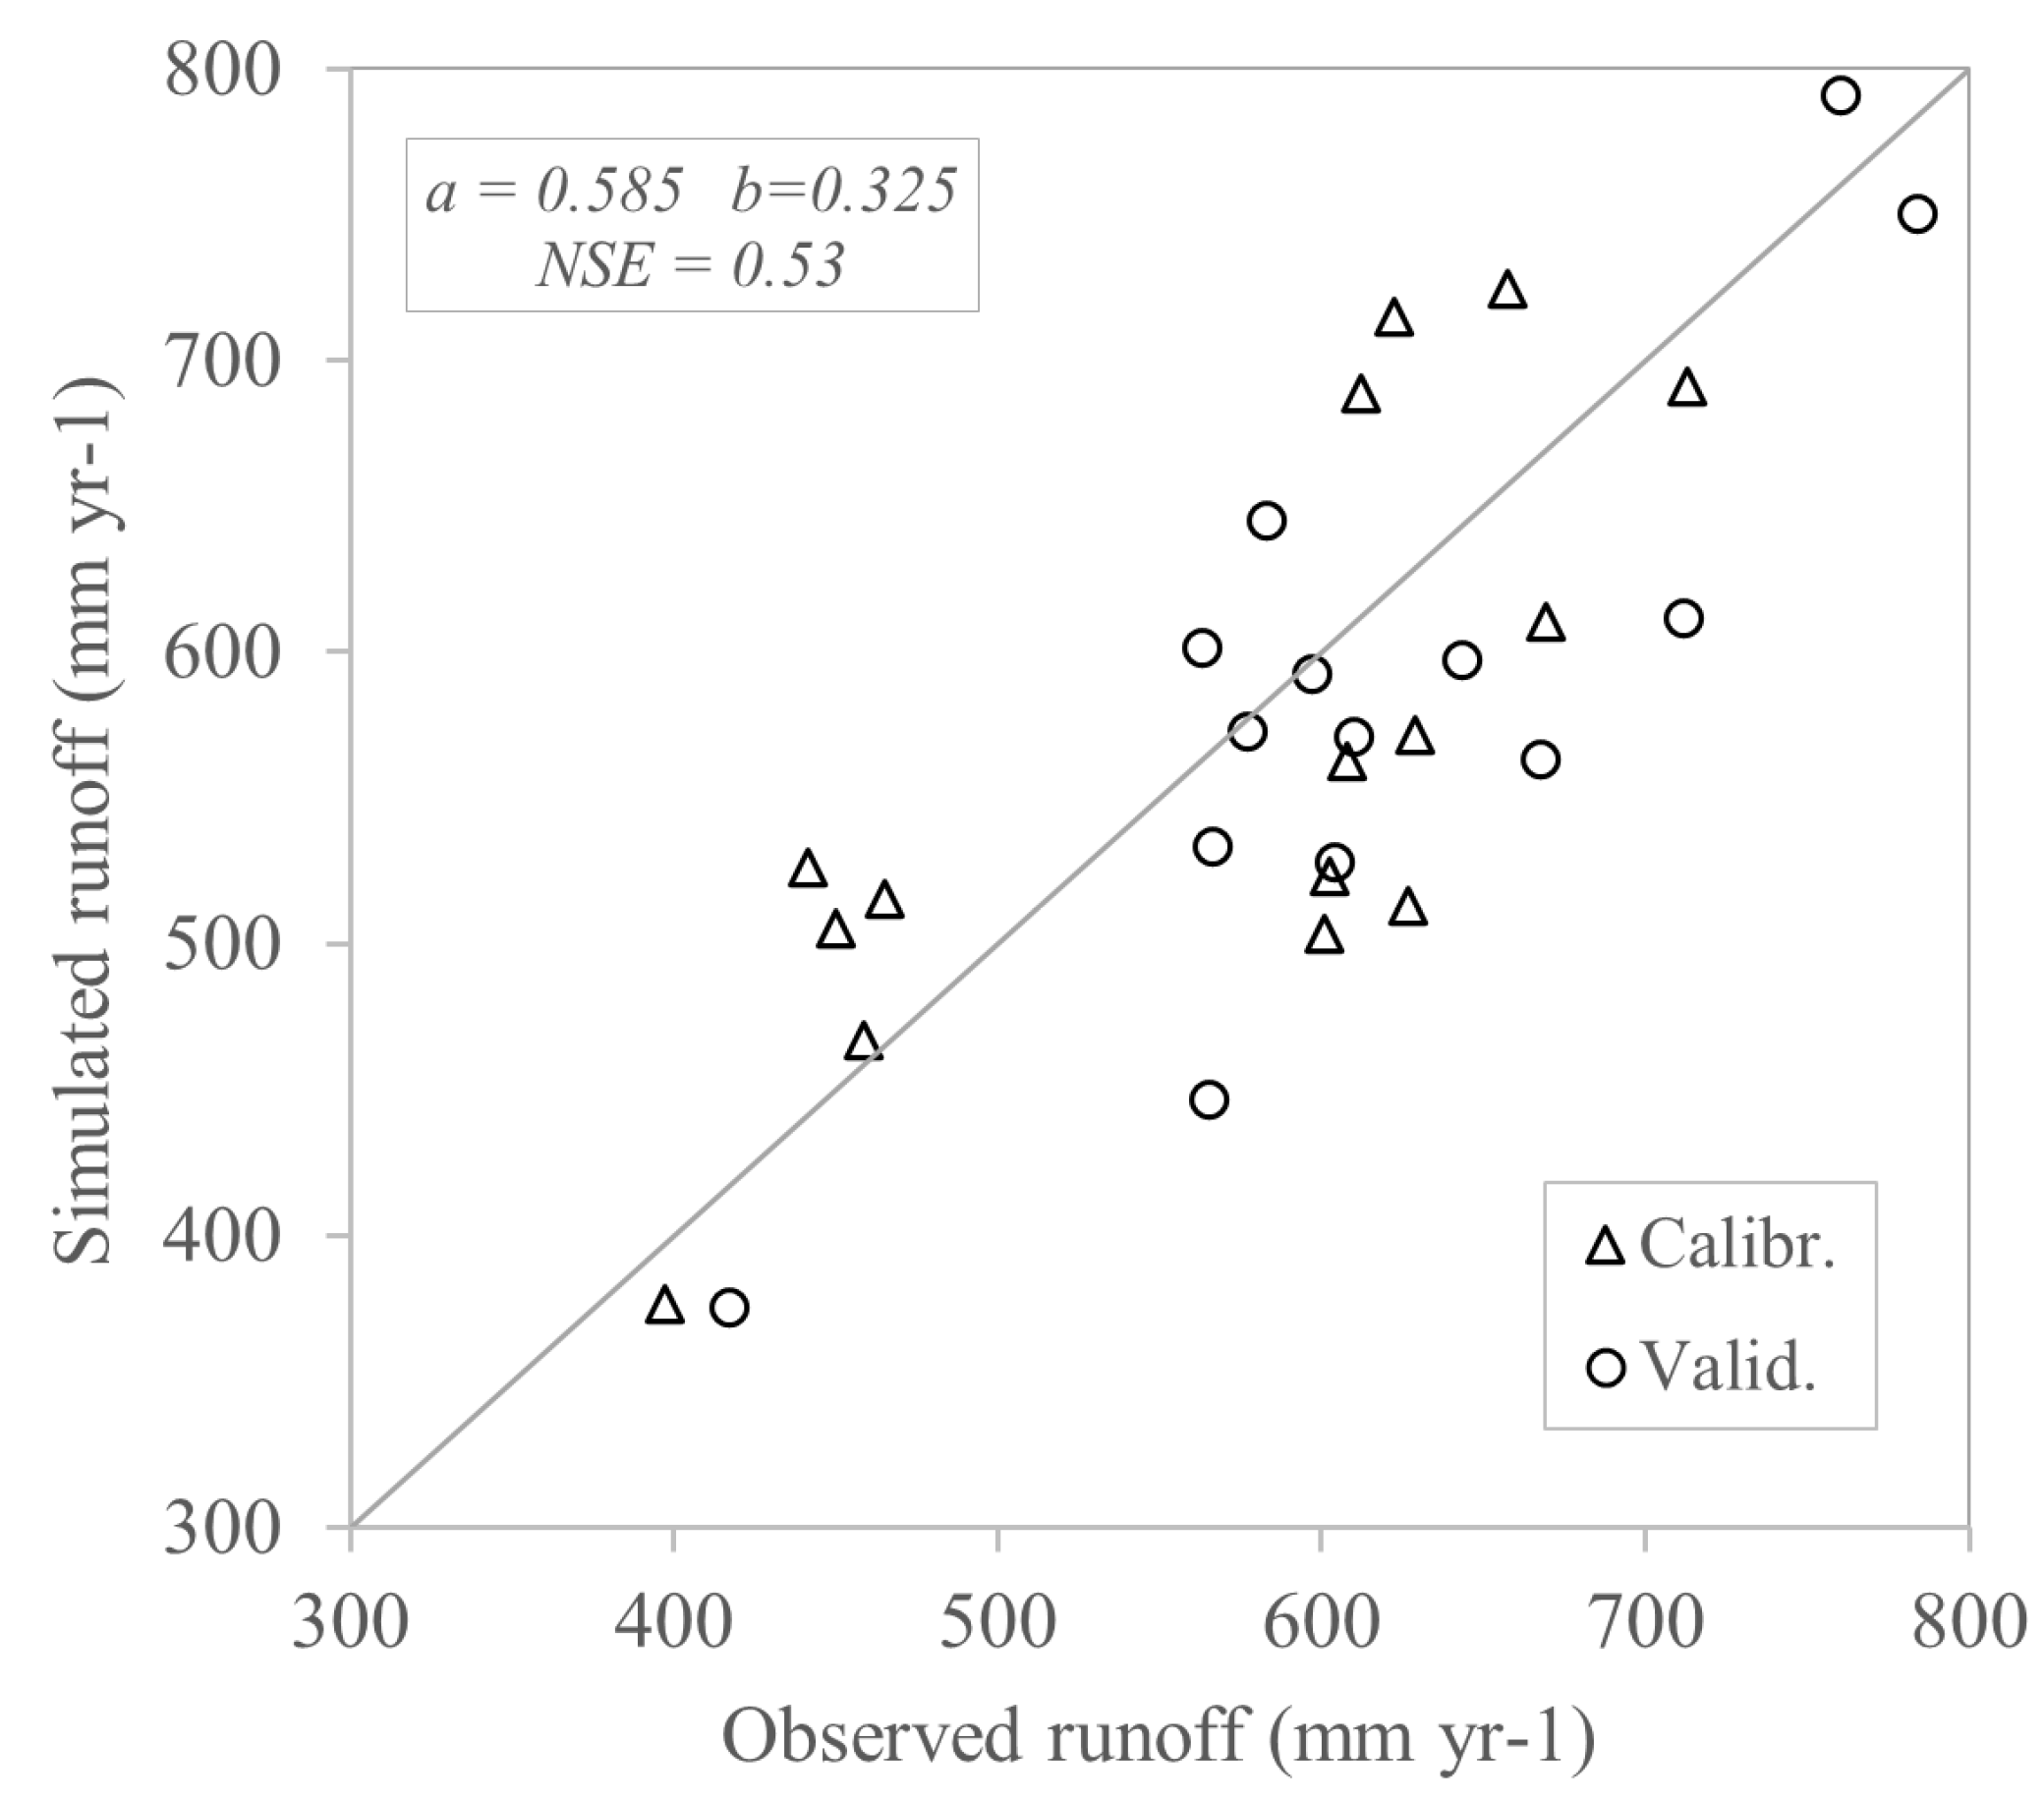
Figure 5 shows the scatterplot of the runoff model calibration and validation, using historic (1986–2005) observed and simulated data. The calibrated model parameters a & b in Equation (1) were 0.585 and 0.325, respectively. The NSEs for calibration and validation were 0.50 and 0.55, respectively, with an overall NSE of 0.53.

3.2. Bias Correction of Climate Data

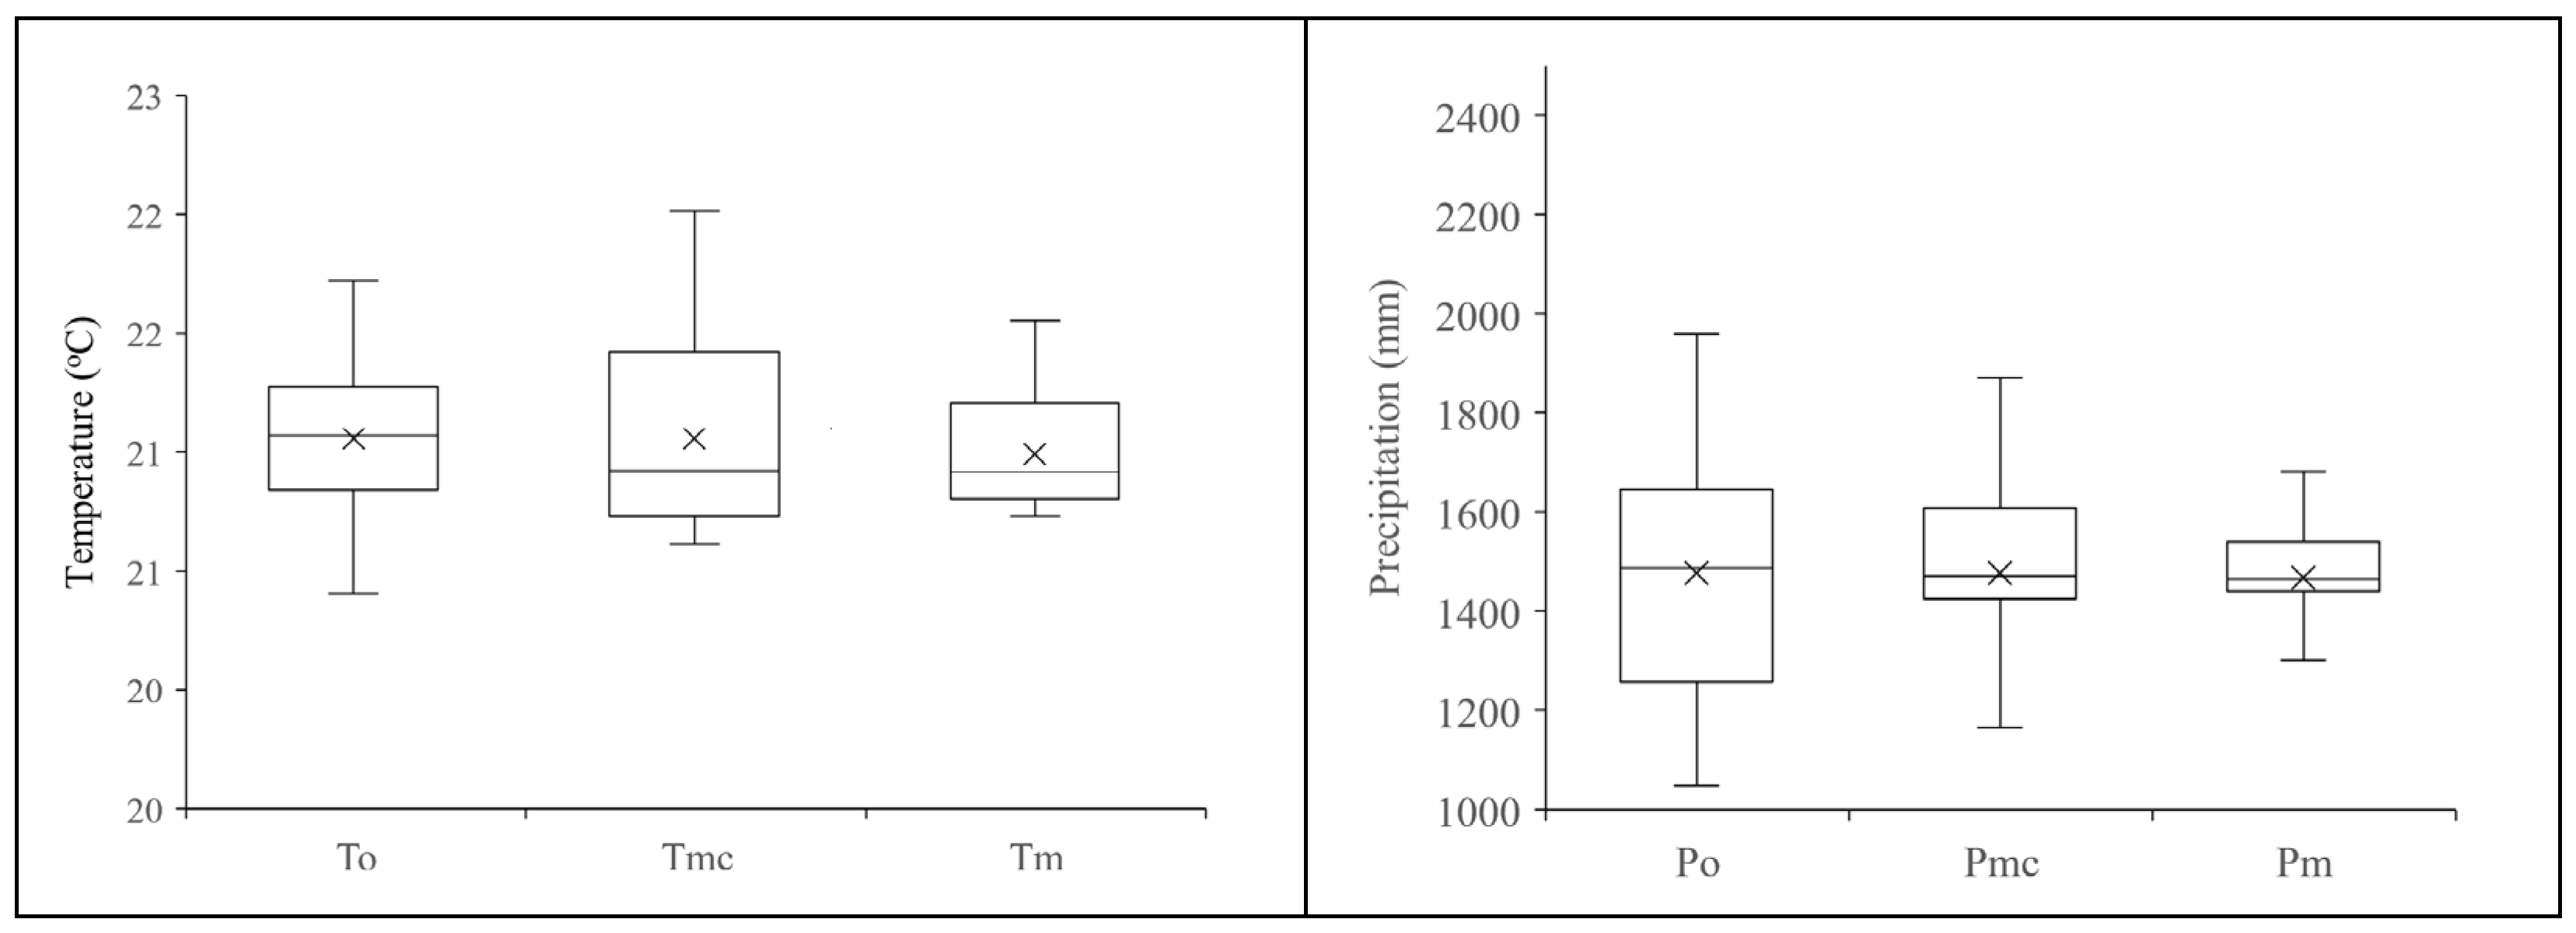
The observed, modeled, and bias-corrected annual temperature and precipitation of the Descoberto basin in the historic (1985–2005) period are presented in Figure 6.

3.3. Climate Projections and Climate Change

The means and coefficients of variation of the mean annual temperature and precipitation of the historic and future periods are presented in Table 3, highlighting the statistical significance of the climatic change between the present and future scenarios.

3.4. Hydrologic Projections and Impacts in Reservoir Hydrology

The projections of future reservoir inflows and potential evapotranspiration, in the different climate scenarios, and the corresponding hydrologic change with respect to the historic conditions, are presented in Table 4.

3.5. Reservoir Reliability in the Historic Period

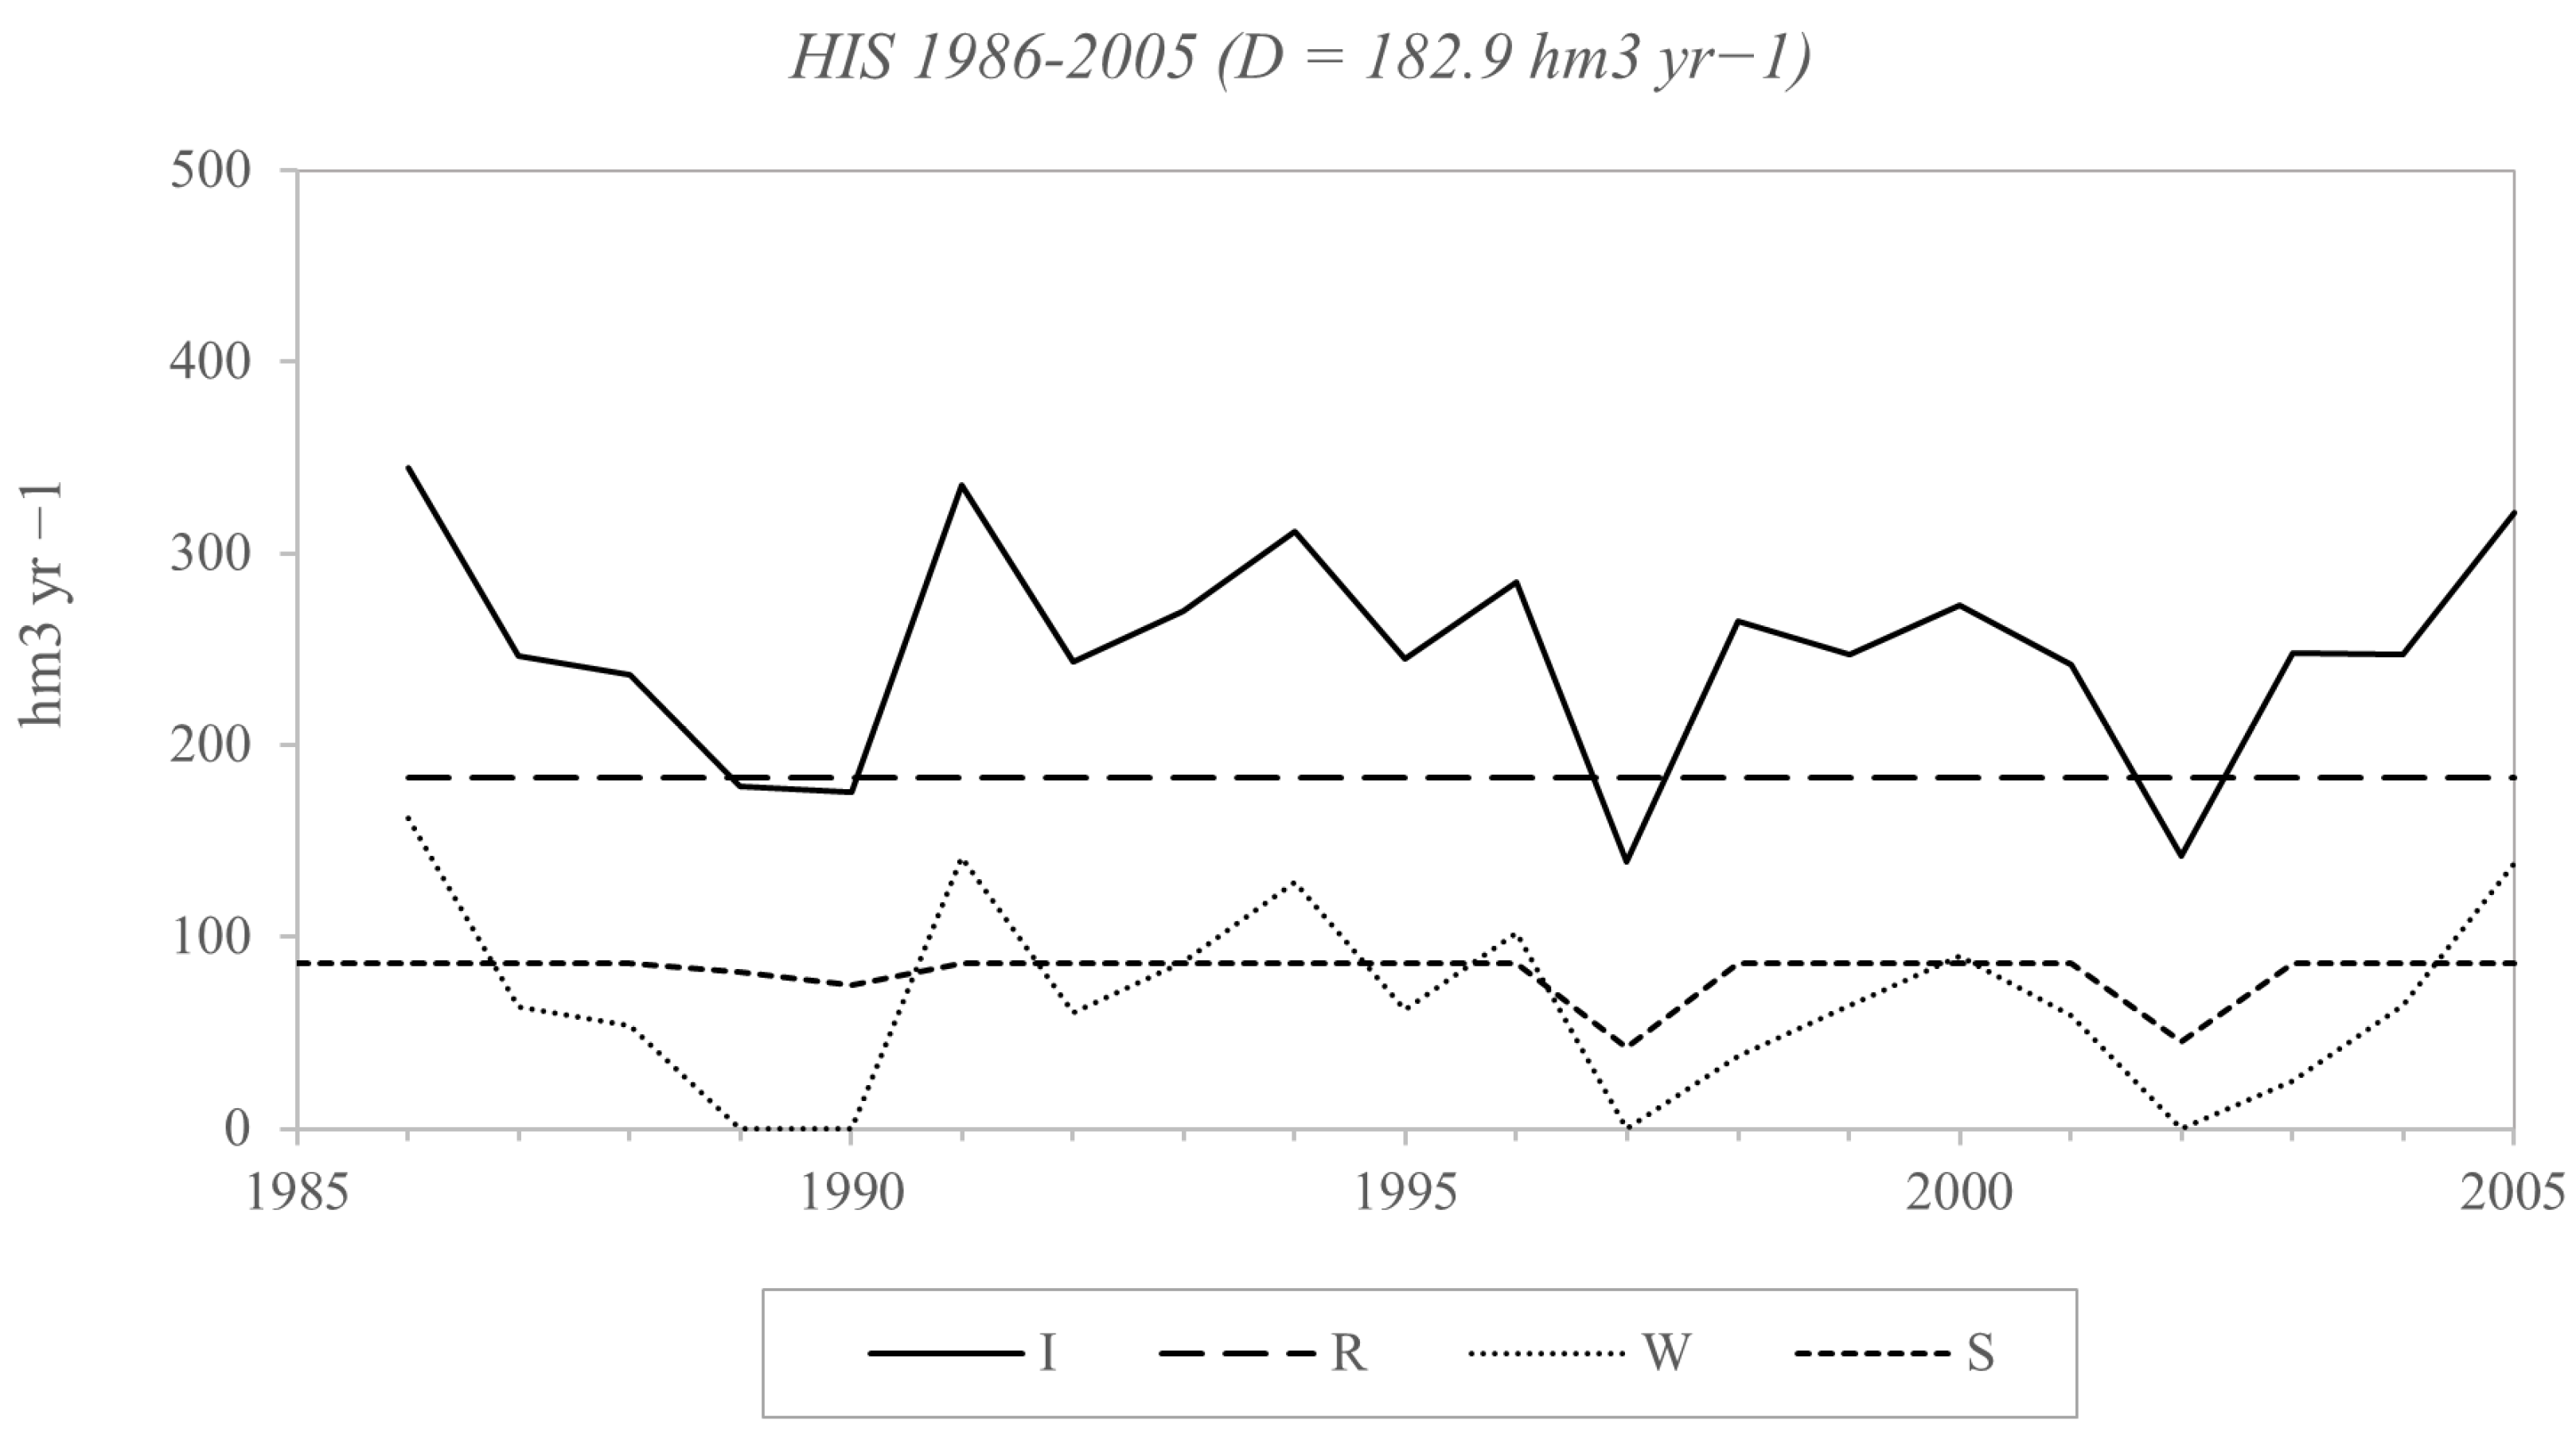
The reservoir water budget in the historic period (1986–2005), with the design draft of D = 182.9 hm3 yr−1, is presented in Figure 7. In the historic period, the probability of failure was zero (R = 100%), since the reservoir storage was always positive, meeting the water demand during the entire period.

3.6. Reservoir Reliability in Future Scenarios

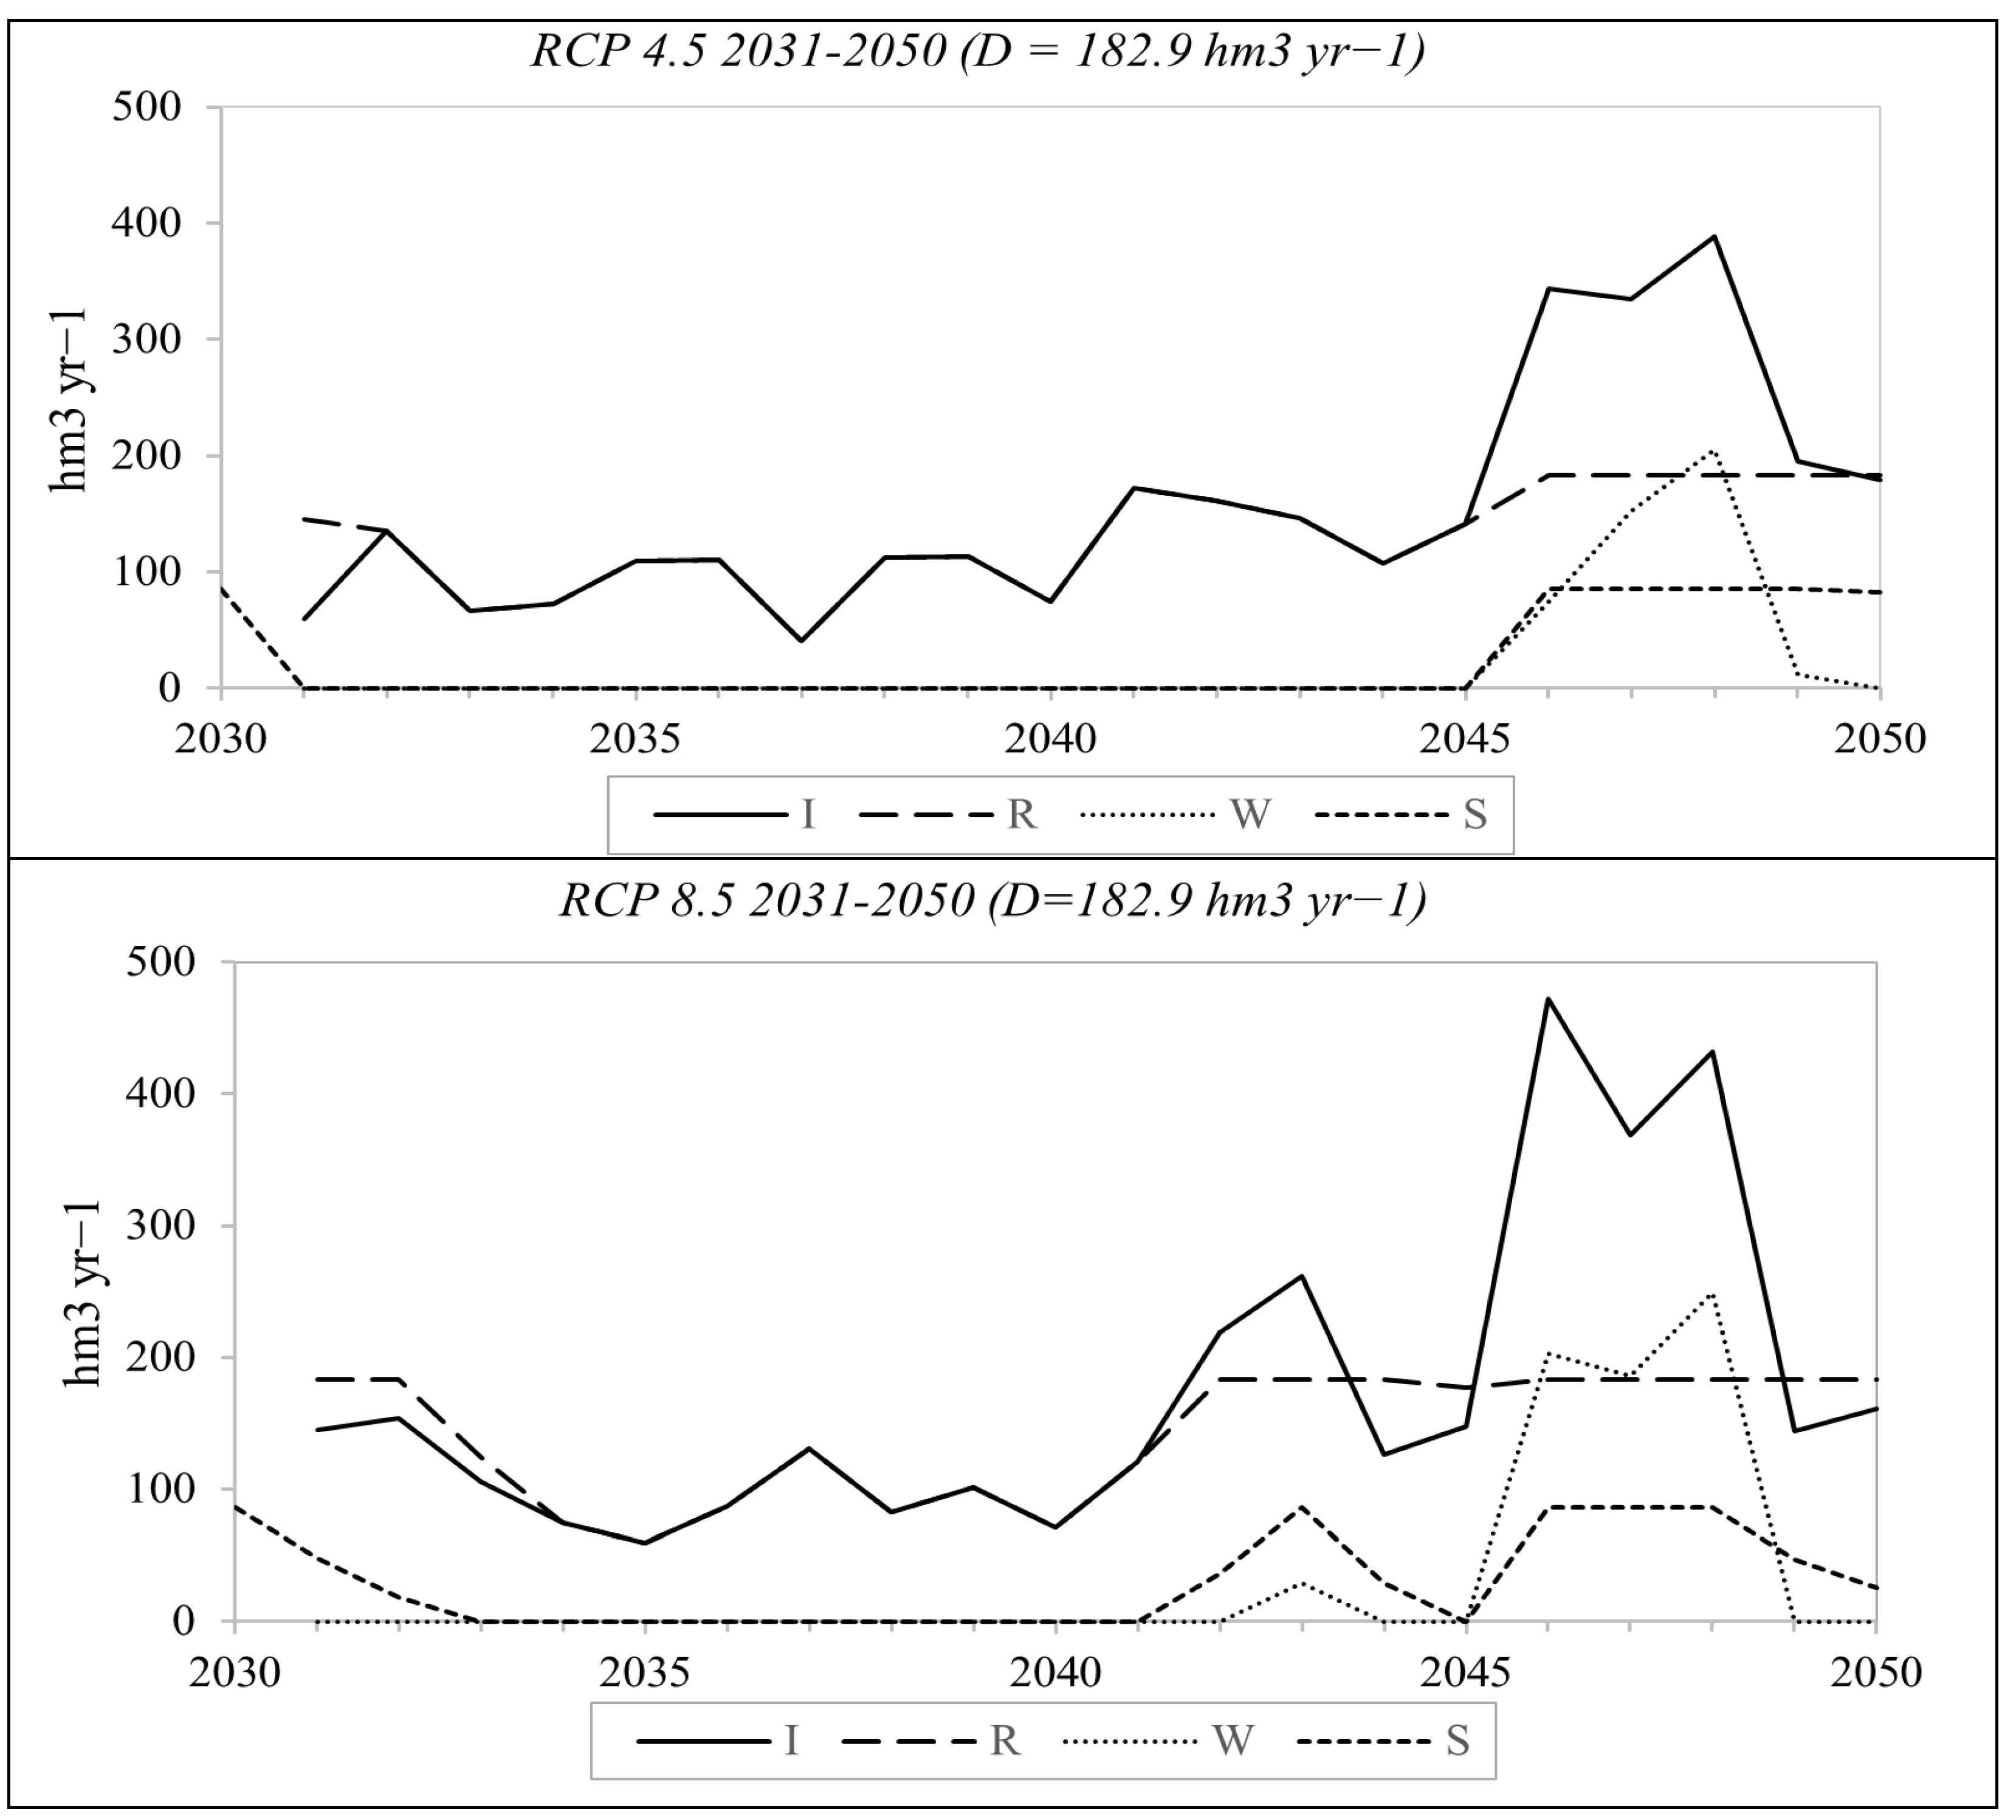
The reservoir budget in the 2031–2050 period (RCP 4.5 and 8.5 scenarios), using the design draft of D = 182.9 hm3 yr−1, is presented in Figure 8. Figure 9 shows the budget in the period 2061–2080 (RCP 4.5 and 8.5).
As opposed to the historic period, where no reservoir failures occurred when the design draft was utilized, the Descoberto reservoir would fail in all future scenarios, since a Pf < 0 was observed in all projections (Table 5).

3.7. Reservoir Reliability with Climate Change Adaptation

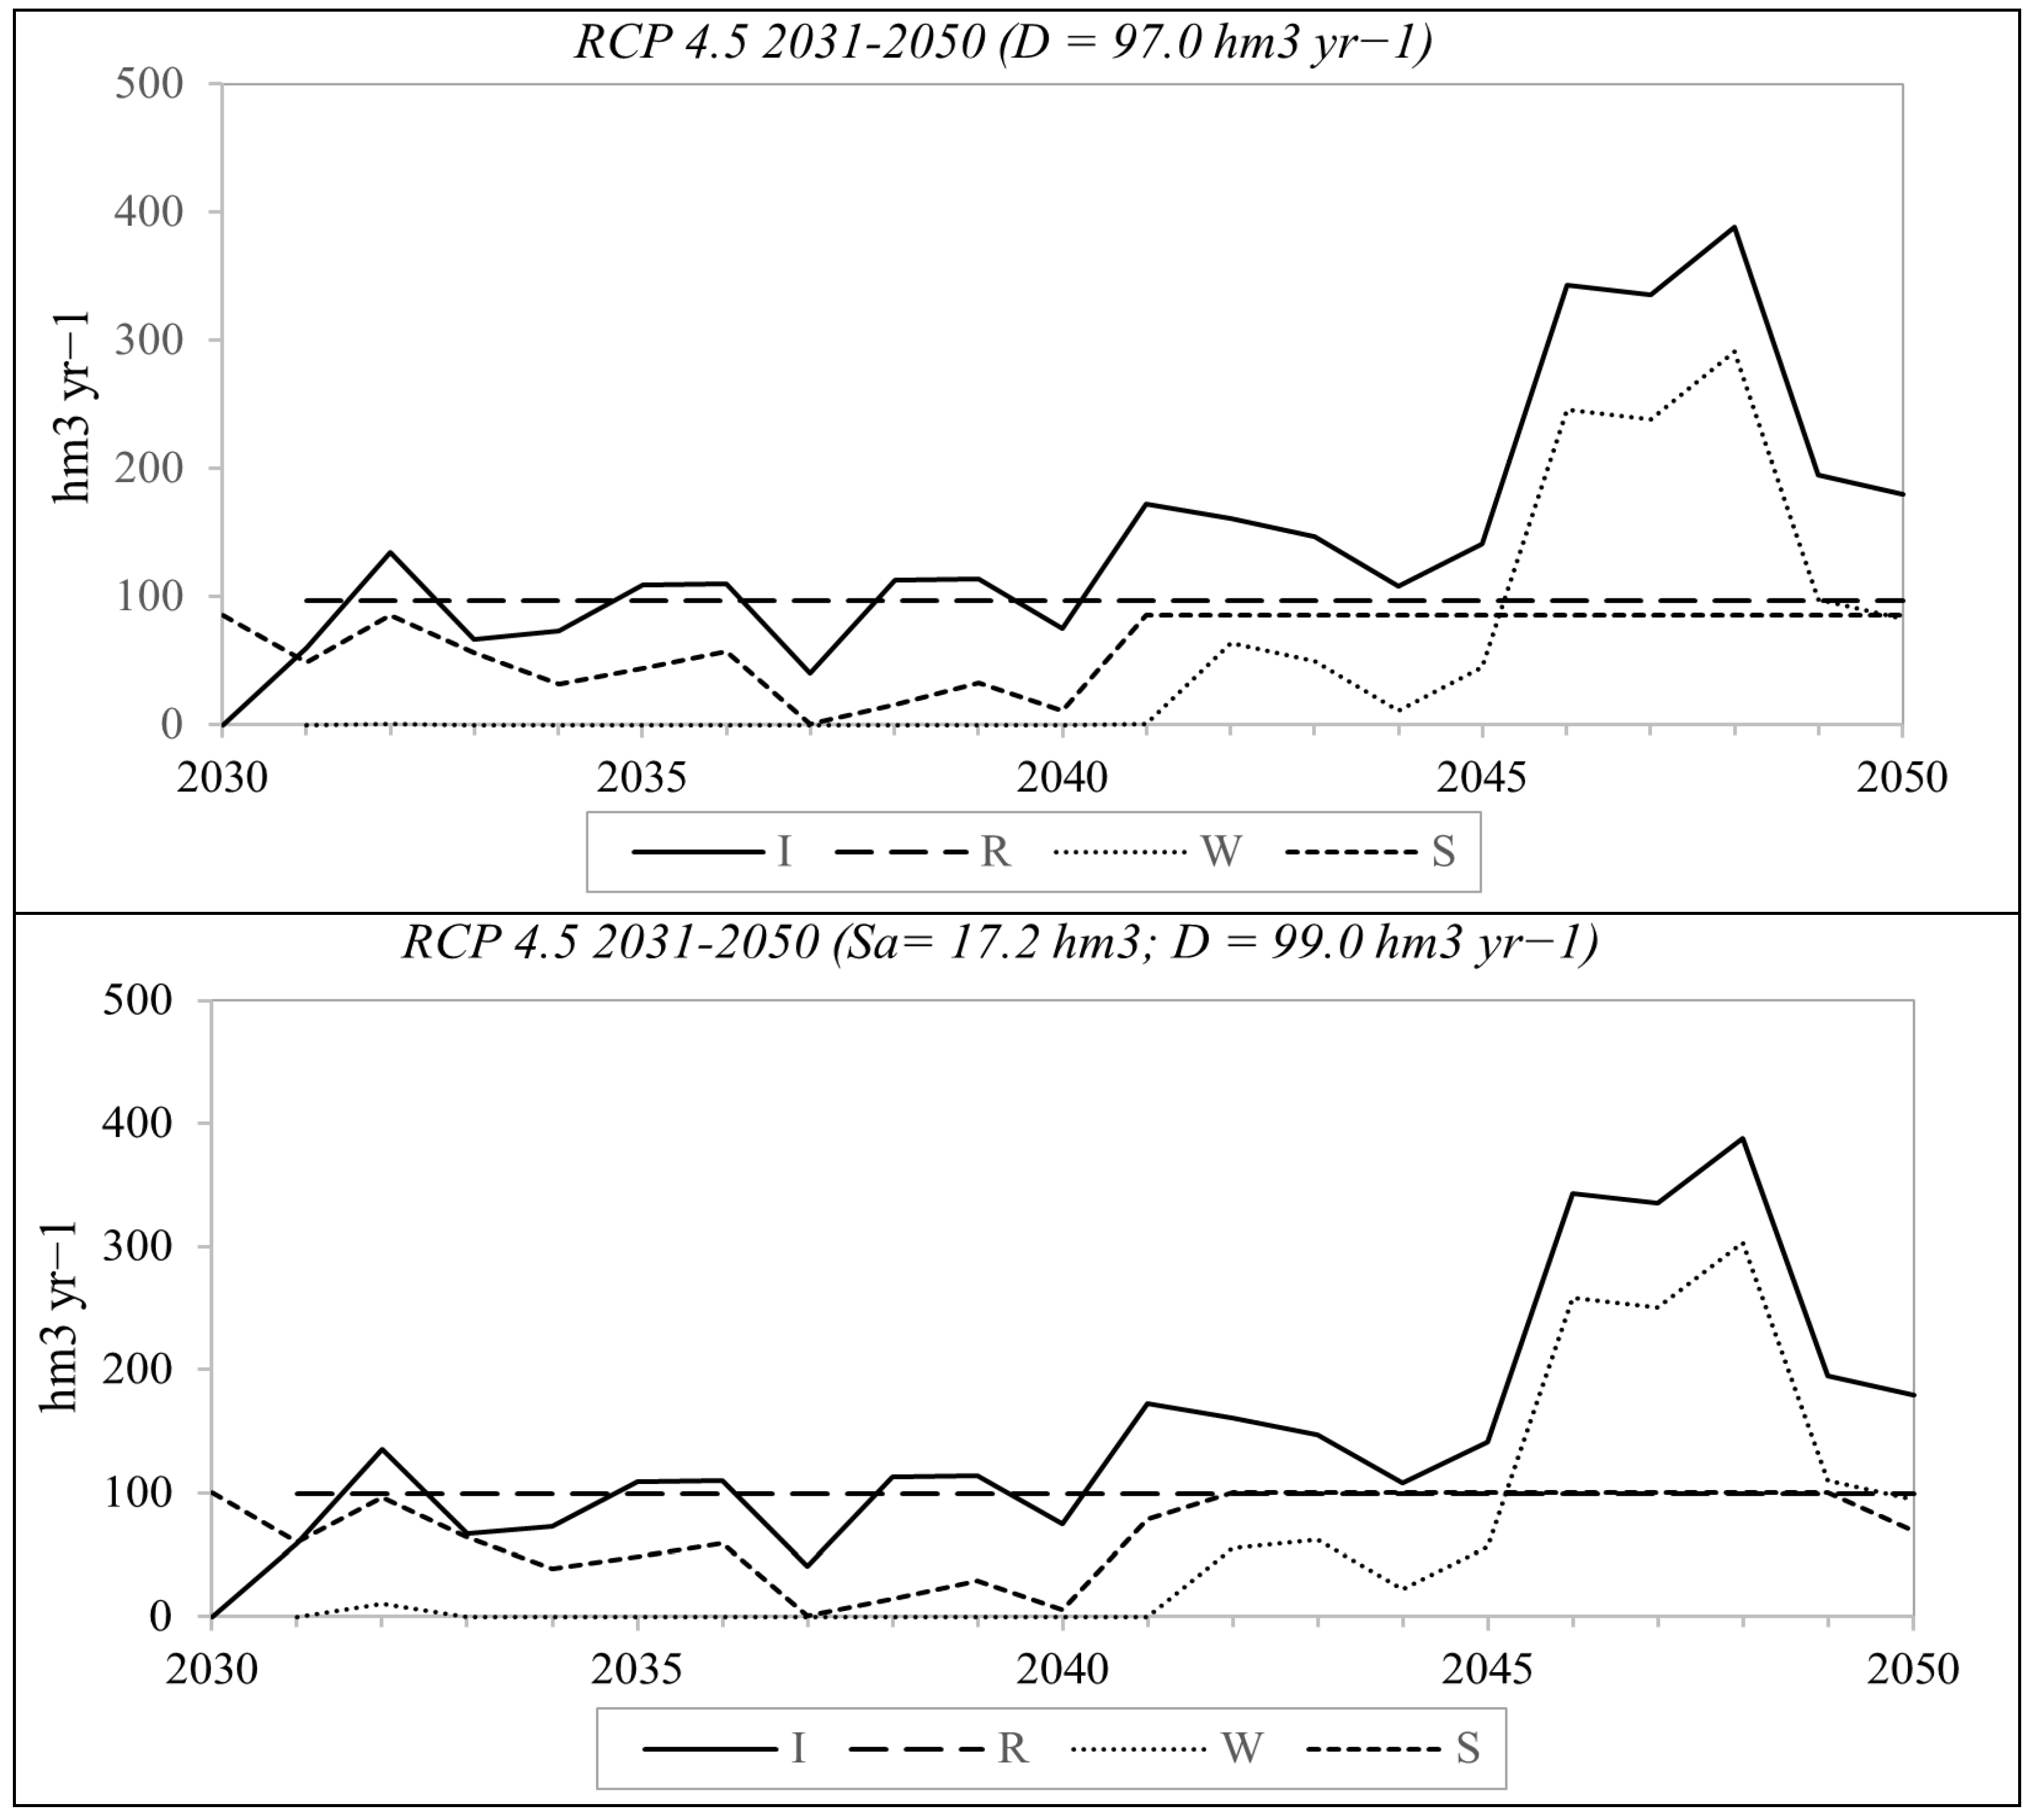
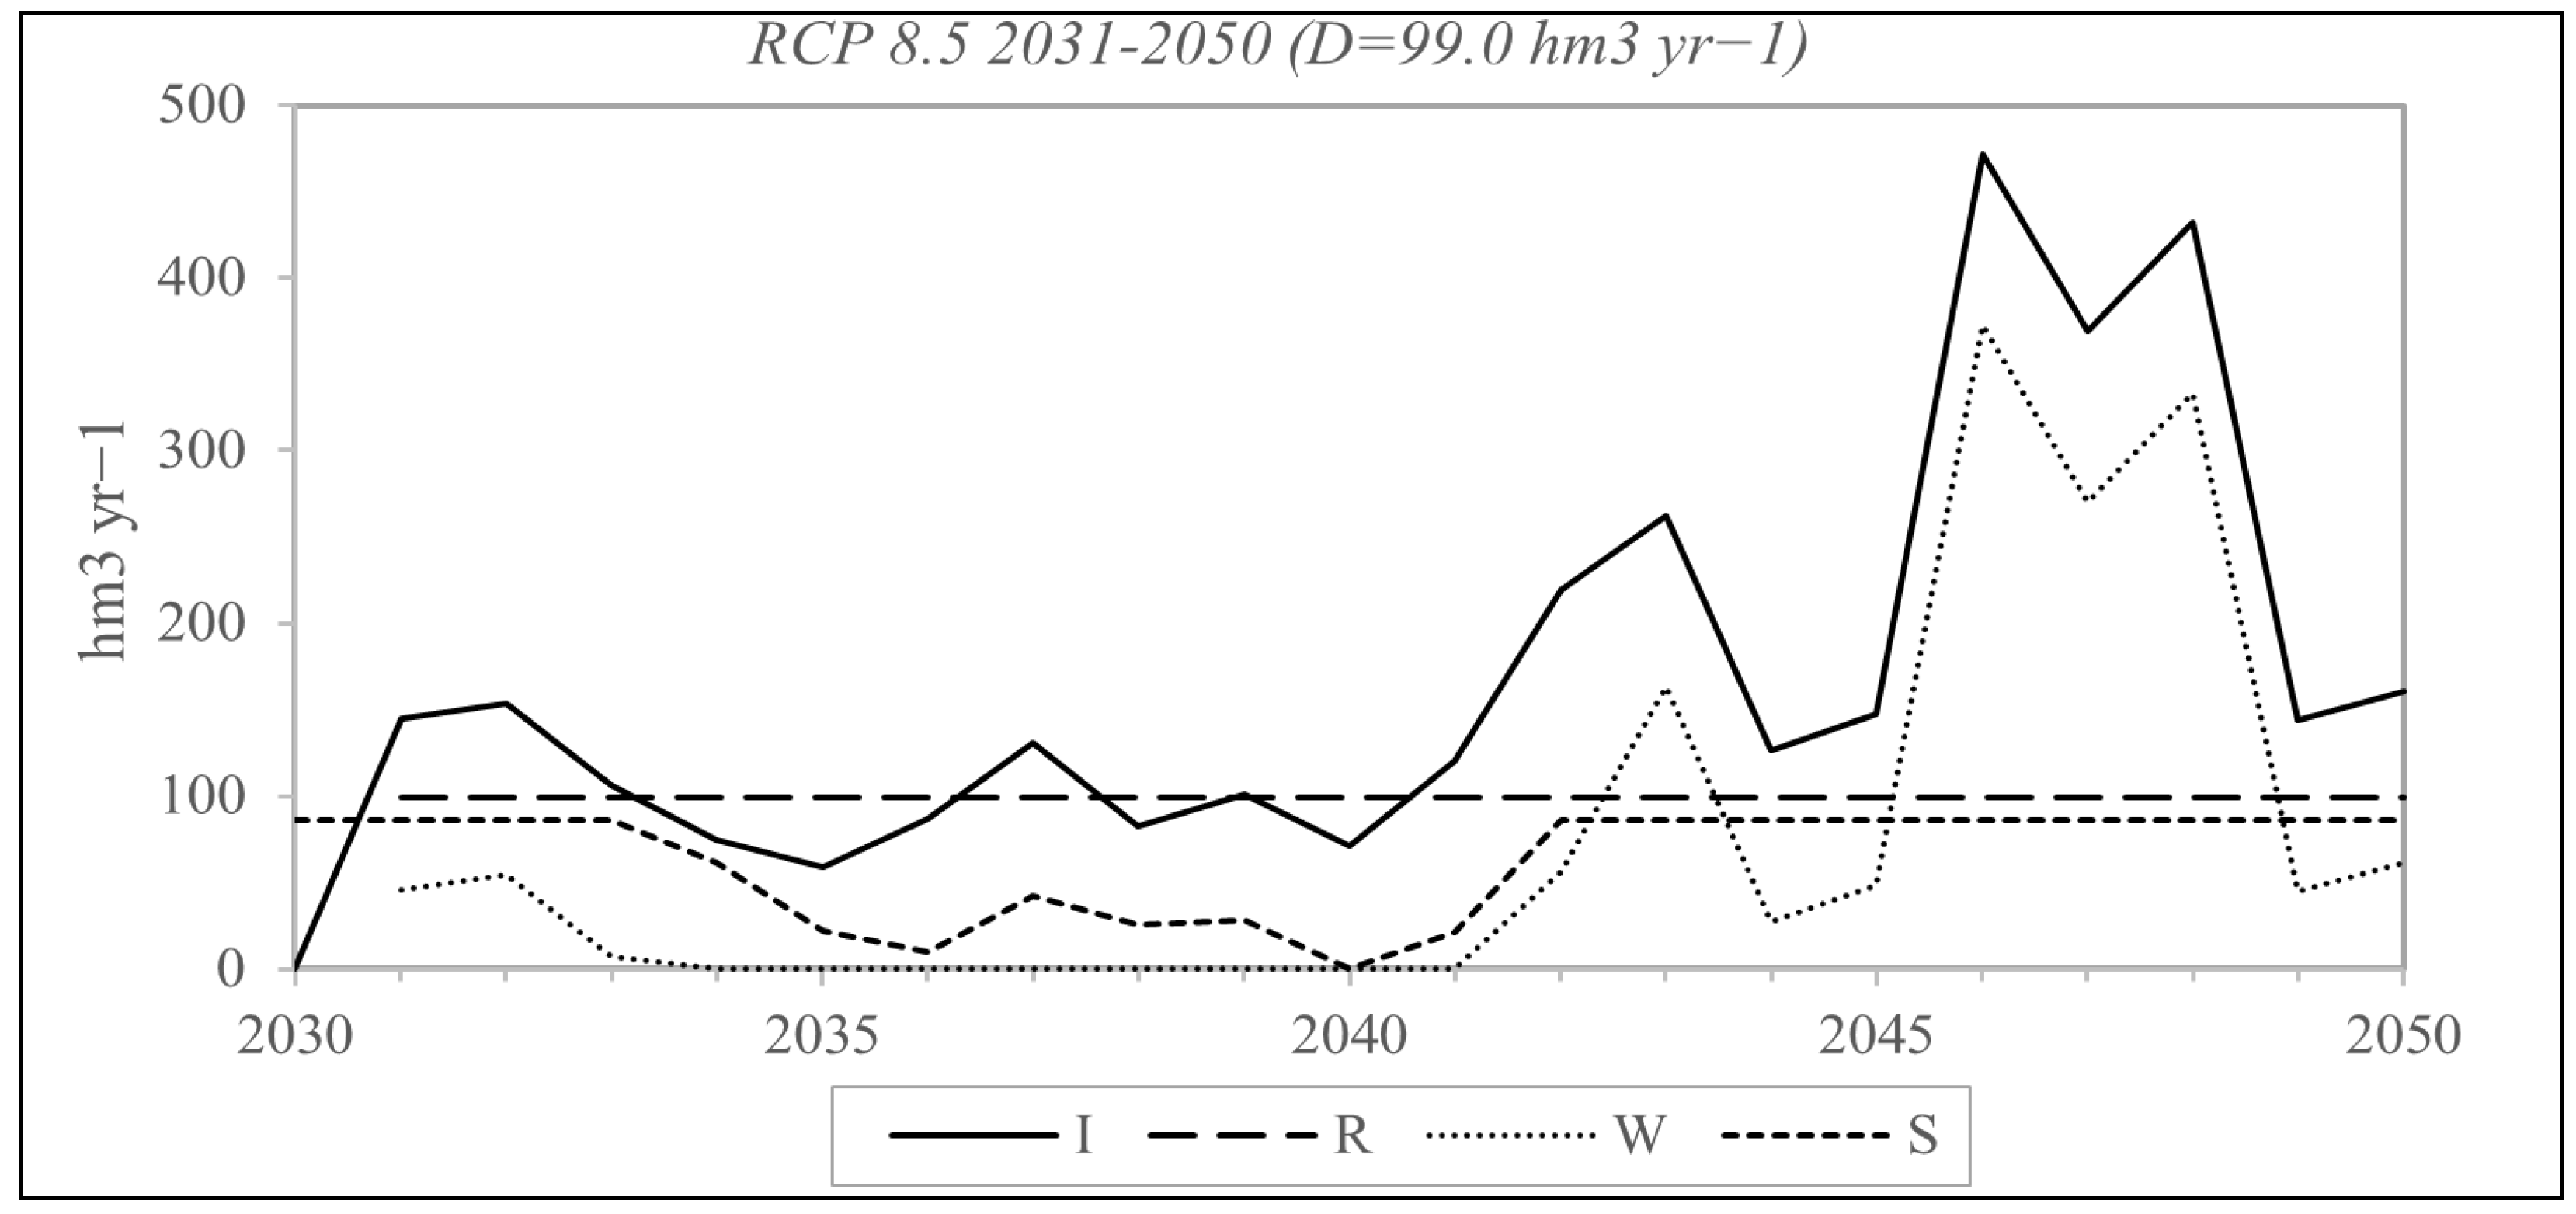
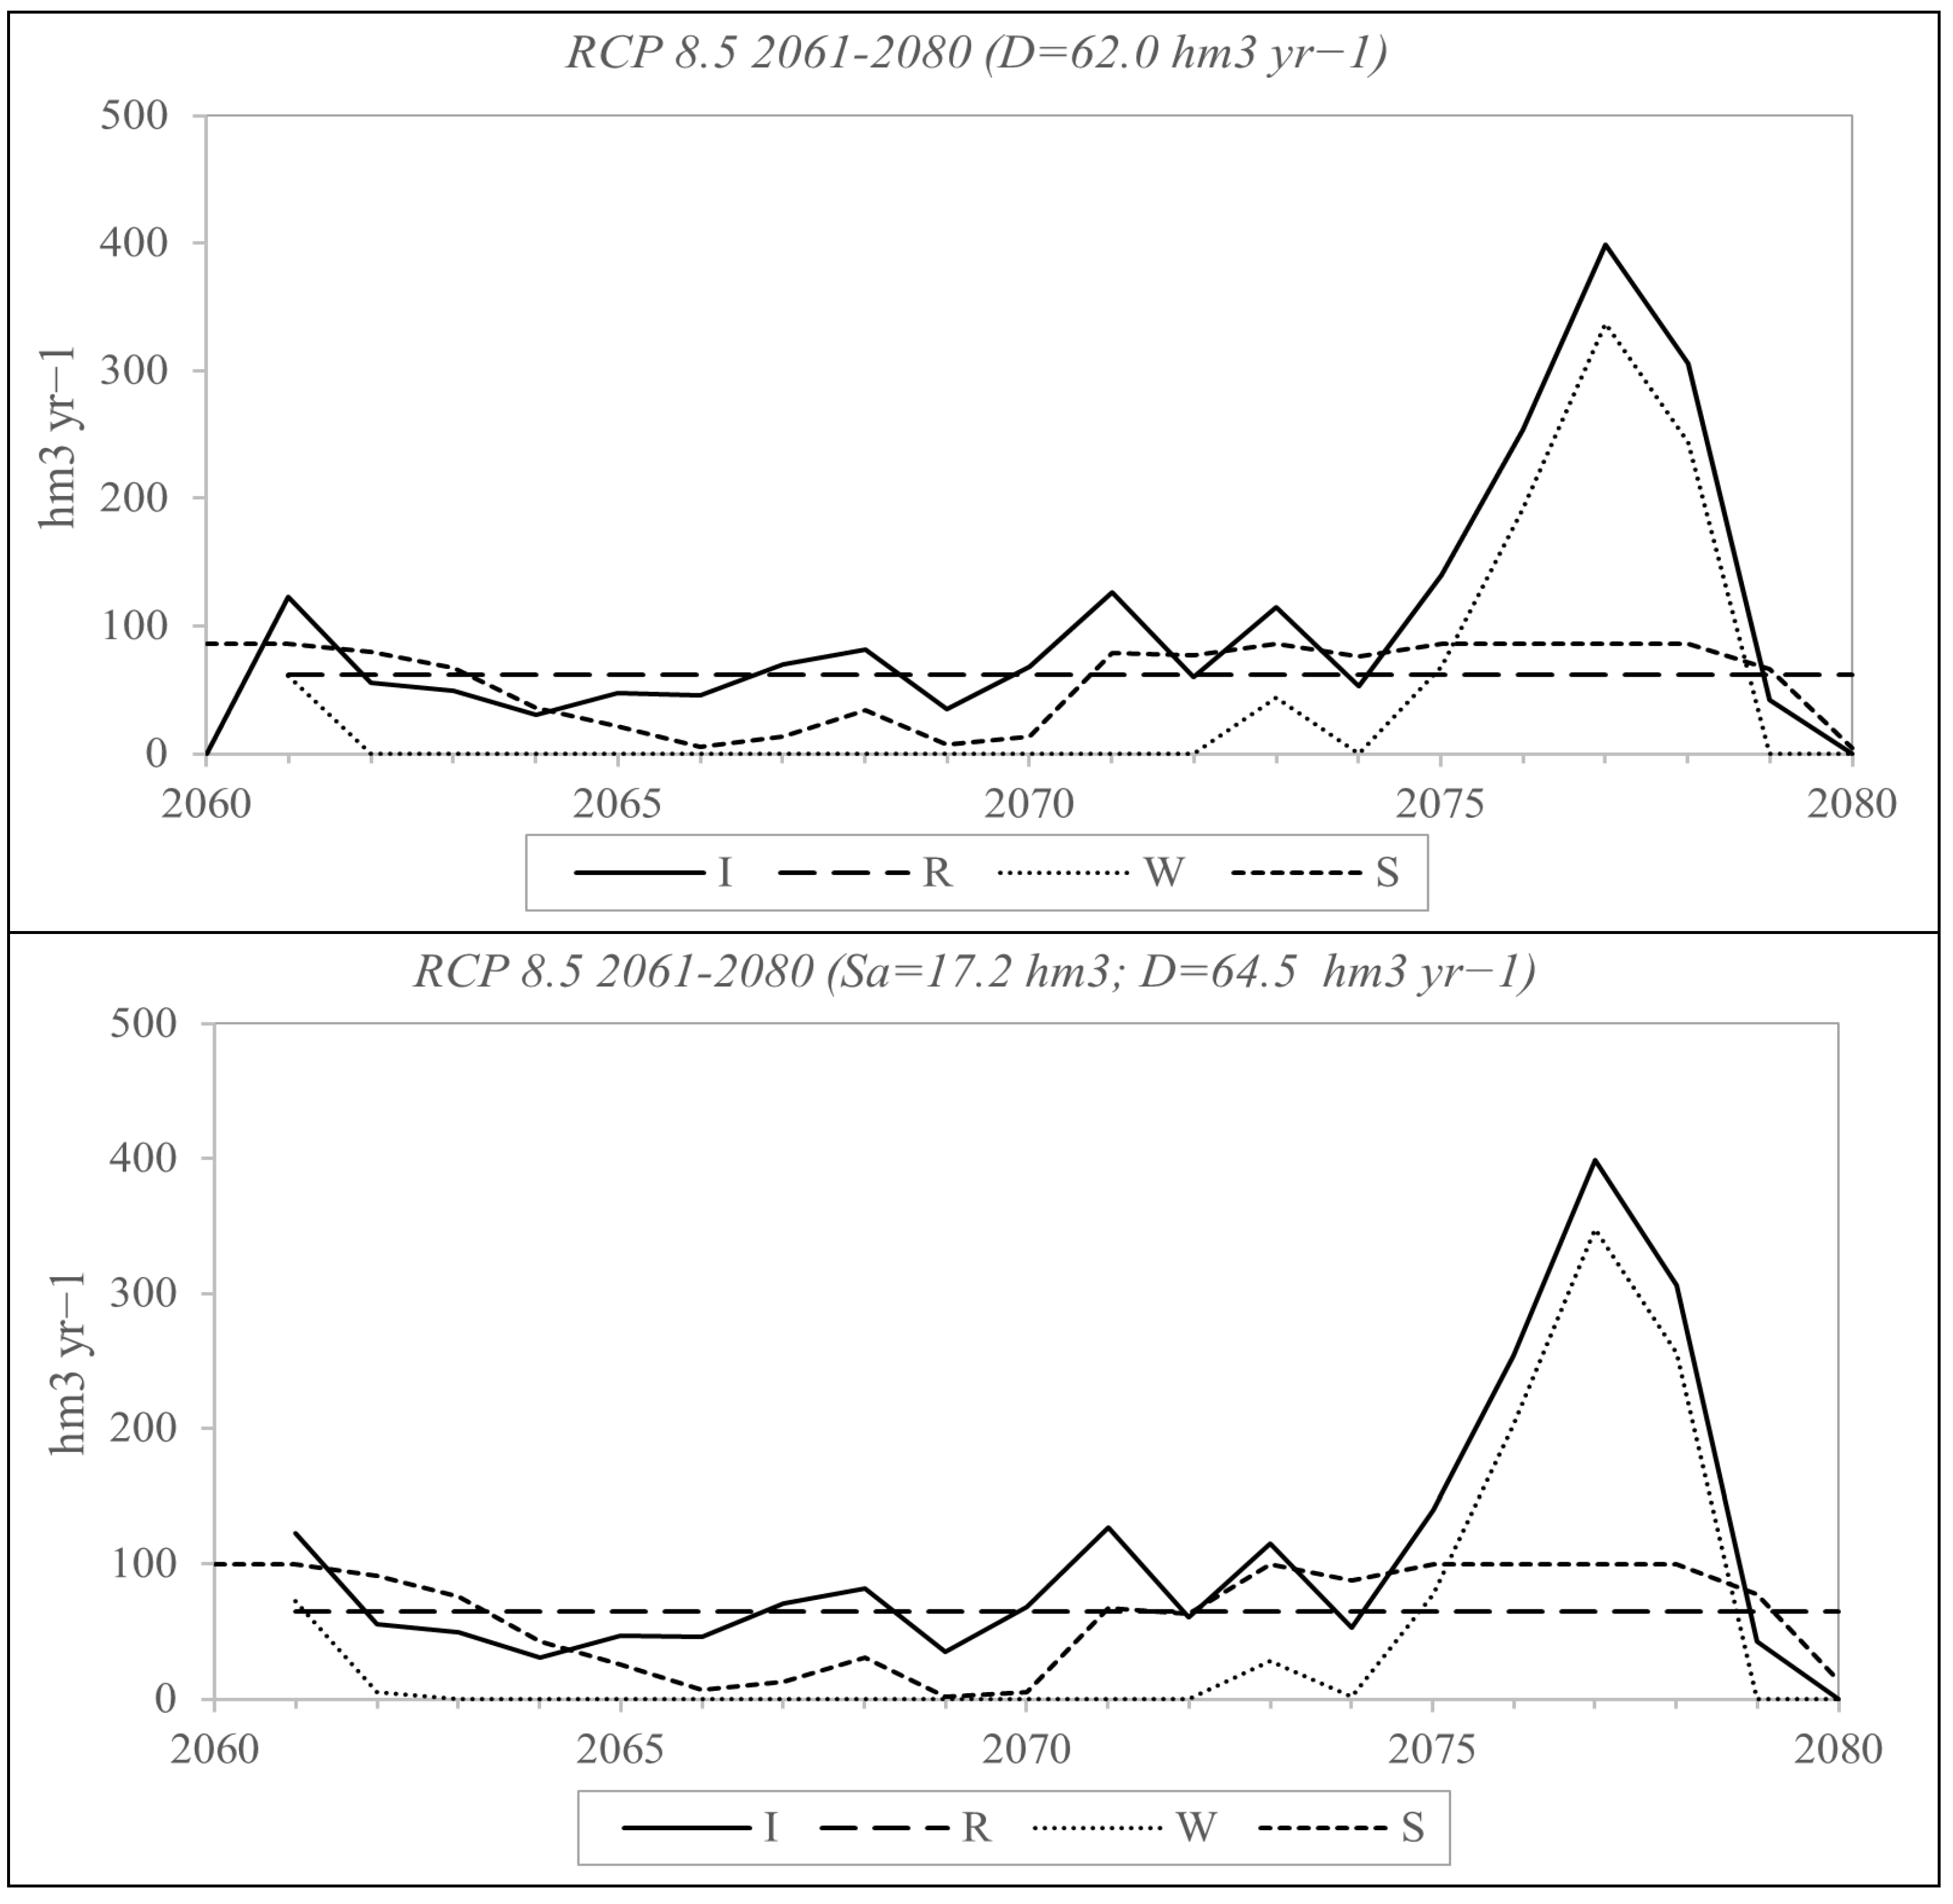
The Descoberto reservoir water budgets for future scenarios, using structural and operational adaptation measures, are presented in Figure 10, Figure 11, Figure 12 and Figure 13, for the 2031–2050/RCP 4.5, 2031–2050/RCP 8.5, 2051–2080/RCP 4.5, and 2051–2080/RCP 8.5 scenarios, respectively. Table 6 lists the adaptive reservoir drafts and storage obtained in each scenario, with the corresponding reliabilities and probabilities of failure.

4. Discussion

4.1. Runoff Model Calibration and Climatic Bias Correction

As indicated by the NSE ≥ 0.5 in both calibration and validation steps, and by the good adherence between the observed and modeled data in Figure 5, the runoff model was successfully calibrated and validated [38]. Additionally, the post-processed climate data significantly reduced the bias of the RCM historic temperature and precipitation, given by the improvement in their means, medians, quartiles, and standard deviations (Figure 6). This post-processing is expected to reduce the uncertainty and bias of future RCM projections used in the study [31]. In spite of the calibrated model and the climate bias correction, the inherent RCM/GCM uncertainties could affect future hydrological projections [29], requiring that water managers use them with caution [48].

4.2. Climate and Hydrology Projections

The results of the Mann–Whitney test (Table 3) indicate that there would be a statistically significant rise in mean annual temperature (between 1.8 and 4.3 °C) and a significant decrease in annual rainfall (between 295.7 and 588.2 mm), relative to the historic period, representing a climatic change for all future scenarios. Generally, the farther the period and higher the emission scenario, the greater the change in P and T, except for the RCP 8.5 2031-50 scenario, whose changes were the smallest. Similar changes (increases of up to 4 °C in T and decreases of up to 800 mm in P) were reported in another study carried out in central Brazil [49].
In the case of future hydrology, the means of the projected inflow and potential evapotranspiration followed the same trends observed in P and T, i.e., statistically significant reductions in Q and significant increases in PET, since the latter are affected by the former (equations 1 and 2). Hence, mean annual inflows would be reduced between 175.8 mm and 335.7 mm, representing a decrease of 30.3% and 57.9%, respectively, with respect to the historic inflow mean.
In the case of PET, increases were between 182.3 mm and 464.0 mm, representing 10.0% and 25.6% of the historic mean, respectively. Similar reductions in projected streamflow (13.9% to 72.4%) and increases in projected PET (7.1% to 19.2%) were reported for a different basin in the same region of Brazil [50].

4.3. Reservoir Reliability in the Historic Period

As indicated in Figure 7, the Descoberto reservoir operation in the historic period (1986–2005) had a 100% reliability (Pf = 0), since reservoir storage was greater than zero during the whole period. Under those conditions, the water demand of 182.9 hm3 yr−1 (design draft plus environmental flow) was fully met by the reservoir, without failure.
In an earlier study of the Descoberto reservoir using observed inflow data during the same period [9], a 100% reliability was also obtained. Reservoir failure occurred only 12 years later, in 2017 (Figure 2), confirming that severe climatic variability, such as low inflow persistence, could affect reservoir reliability [2].

4.4. Reservoir Reliability in Future Climate Scenarios

As opposed to the 100% reliability the historic period (1986–2005), the Descoberto reservoir would not meet the design draft in all future scenarios (Table 5), experiencing extensive empty periods (S = 0, shown in Figure 8 and Figure 9).
Reservoir failures in future climate scenarios would result from a combination of reduced precipitation and increased temperature (Table 3), causing higher evapotranspiration and lower runoff (Table 4). As a consequence, the probability of failure of the Descoberto reservoir in the four climate scenarios would vary between 50% and 85%, with a corresponding reliability of 50% and 15%, respectively (Table 5).
These low reliabilities in future scenarios indicate that the reservoir would not perform as originally intended under climate change conditions, requiring new operating rules and strategies. Anticipating future reservoir failures due to climate change, Australian managers reduced drafts from dams between 10% and 50% [12]. In Vietnam, the impact of climate change would significantly affect the rule curves (including draft) of small-to-medium reservoirs (c < 200 hm3) but not of large (c > 1000 hm3) ones [13].
As observed in Figure 8, Figure 9, Figure 10, Figure 11, Figure 12 and Figure 13, the last five years of the time series showed a peak in the reservoir inflows as a consequence of increased precipitation in the period. An auto-correlation analysis [45] performed in those time series indicated that all inflow projections had a significant auto-correlation in lag 1, with a gradual decrease in lags 2–3, confirming the presence of persistence of high flows in all projections [51], a result of the increased precipitation and groundwater carry-over [52].
Since persistence was previously detected in the historic inflow series of the Descoberto reservoir [9], and considering that projected streamflow series shall exhibit similar distributional and non-homogeneous attributes to past series [10], the inflow peaks observed in Figure 8, Figure 9, Figure 10, Figure 11, Figure 12 and Figure 13 were expected.

4.5. Reservoir Adaptation to Climate Change

As indicated by Figure 10, Figure 11, Figure 12 and Figure 13, the two proposed adaptation measures avoided the emptying of the reservoir, resulting in a 100% reliability (Pf = 0%) in all future scenarios. The trade-off was that the reservoir draft had to be reduced (measures 1 and 2), and the storage increased (measure 2). These types of operational and structural measures have been successfully utilized elsewhere to tackle climate variability and climate change [15,45].
The magnitude of the reduction in reservoir drafts (Table 6) reflects the severity of the future climate projection, i.e., the lower the future reservoir inflow, the lower the adaptive draft. The latter varied between 33.9% and 55.2% of the reservoir design draft (182.9 hm3), significantly reducing the water supply from the Descoberto reservoir. When increased storage was considered, the corresponding drafts would be about 2% higher than those with no incremental capacity, allowing water managers to choose between the two options after an appropriate economic feasibility study, not considered in the present analysis.

5. Conclusions

A six-step reservoir reliability and adaptation analysis was developed to assess and to tackle the impacts of climate change. Using a simple rainfall-runoff model to transform future downscaled climate data into reservoir inflows and a reservoir budget routine to assess reservoir reliability, the method was applied to an upstream reservoir in central Brazil, in different post-processed climate scenarios.
In the historic scenario, the Descoberto reservoir showed a 100% reliability, meeting the design draft of 182.9 hm3 yr−1. However, in future climate projections, with significant increases in temperature and reductions in precipitation and reservoir inflows, reservoir reliability would decrease between 15% and 50%.
In order to avoid an empty reservoir and the consequences thereof, the utilization of adaptive operational (draft reduction) and structural (storage increase) measures would reduce the probability of reservoir failure and maximize its reliability. This would result in associated costs, not analyzed in the present study.
The simplicity of the proposed method and its wide applicability provide a useful and strategic tool to assess and to tackle the climate threats affecting upstream reservoirs, allowing water managers and stakeholders to adapt accordingly.

Author Contributions

Conceptualization, H.M.L.C.; Modeling, H.M.L.C. and C.C.d.S.; writing—review and editing, H.M.L.C. and M.R.S.F. All authors have read and agreed to the published version of the manuscript.

Funding

This research received no external funding.

Data Availability Statement

The data presented in this study are available on request from the corresponding author.

Acknowledgments

The authors acknowledge the sharing of RCM climate data by the Federal District Secretariat of the Environment-SEMA/DF, and the support of the GRAPHIC-LAC/UNESCO Program.

Conflicts of Interest

The authors declare no conflict of interest.

References

  1. Jagger, H.I.; Smith, B.T. Sustainable Reservoir Operation: Can We Generate Hydropower and Preserve Ecosystem Values? River Res. Appl. 2008, 24, 340–352. [Google Scholar] [CrossRef]
  2. Koutsoyiannis, D. Hydrologic Persistence and The Hurst Phenomenon. Water Encycl. 2005, 10, 210–221. [Google Scholar] [CrossRef]
  3. Carty, J.G.; Cunnane, C. An Evaluation of Some Methods of Determining Storage Yield Relationships for Impounding Reservoirs. J. IWEM 1990, 4, 35–43. [Google Scholar] [CrossRef]
  4. Nagy, I.V.; Asante-Duah, K.; Zsuffa, I. Hydrological Dimensioning and Operation of Reservoirs. In Pratical Design Concepts and Principles; Springer: Cham, Switzerland, 2002; Volume 5, ISBN 9781119130536. [Google Scholar]
  5. Wallis, R.; O’Connell, P.E. Firm Reservoir Yield—How Reliable Are Historic Hydrological Records? Hydrol. Sci. J. 1973, 18, 347–365. [Google Scholar] [CrossRef]
  6. Vogel, R.M.; Tsai, Y.; Limbrunner, J.F. The Regional Persistence and Variability of Annual Streamflow in the United States. Water Resour. Res. 1998, 3, 3445–3459. [Google Scholar] [CrossRef] [Green Version]
  7. Cheng, W.M.; Huang, C.L.; Hsu, N.S.; Wei, C.C. Risk Analysis of Reservoir Operations Considering Short-Term Flood Control and Long-Term Water Supply: A Case Study for the Da-Han Creek Basin in Taiwan. Water 2017, 9, 424. [Google Scholar] [CrossRef] [Green Version]
  8. Papamichail, D.M.; Geourgiou, P.E. Seasonal Arima Inflow Model for Reservoir Sizing. J. Am. Water Resour. Assoc. 2001, 37, 877–885. [Google Scholar] [CrossRef]
  9. Chaves, H.M.L.; Lorena, D.R. Assessing Reservoir Reliability Using Classical and Long-Memory Statistics. J. Hydrol. Reg. Stud. 2019, 26, 100641. [Google Scholar] [CrossRef]
  10. Koutsoyiannis, D. Climate Change, the Hurst Phenomenon, and Hydrological Statistics. Hydrol. Sci. J. 2003, 48, 3–24. [Google Scholar] [CrossRef]
  11. Ahmadi, M.; Haddad, O.B.; Loáiciga, H.A. Adaptive Reservoir Operation Rules Under Climatic Change. Water Resour. Manag. 2015, 29, 1247–1266. [Google Scholar] [CrossRef]
  12. Nguyen, H.; Mehrotra, R.; Sharma, A. Assessment of Climate Change Impacts on Reservoir Storage Reliability, Resilience, and Vulnerability Using a Multivariate Frequency Bias Correction Approach. Water Resour. Res. 2020, 56, e2019WR026022. [Google Scholar] [CrossRef]
  13. Quan, V.D. Kittiwet Kuntiyawichai Identifying Adaptive Reservoir Operation for Future Climate Change Scenarios: A Case Study in Central Vietnam. Water Resour. 2020, 47, 189–199. [Google Scholar] [CrossRef]
  14. Mateus, M.C.; Tullos, D. Reliability, Sensitivity, and Vulnerability of Reservoir Operations under Climate Change. J. Water Resour. Plan. Manag. 2017, 143, 04016085. [Google Scholar] [CrossRef] [Green Version]
  15. Ehsani, N.; Vörösmarty, C.J.; Fekete, B.M.; Stakhiv, E.Z. Reservoir Operations under Climate Change: Storage Capacity Options to Mitigate Risk. J. Hydrol. 2017, 555, 435–446. [Google Scholar] [CrossRef]
  16. Zakizadeh, H.R.; Ahmadi, H.; Zehtabiyan, G.R.; Moeini, A.; Moghaddamnia, A. Impact of Climate Change on Surface Runoff: A Case Study of the Darabad River, Northeast of Iran. J. Water Clim. Chang. 2021, 12, 82–100. [Google Scholar] [CrossRef]
  17. Singh, D.; Tsiang, M.; Rajaratnam, B.; Diffenbaugh, N.S. Precipitation Extremes over the Continental United States in a Transient, High-Resolution, Ensemble Climate Model Experiment. J. Geophys. Res. Atmos. 2013, 118, 7063–7086. [Google Scholar] [CrossRef]
  18. Dey, P.; Mishra, A. Separating the Impacts of Climate Change and Human Activities on Streamflow: A Review of Methodologies and Critical Assumptions. J. Hydrol. 2017, 548, 278–290. [Google Scholar] [CrossRef]
  19. Naz, B.S.; Kao, S.C.; Ashfaq, M.; Gao, H.; Rastogi, D.; Gangrade, S. Effects of Climate Change on Streamflow Extremes and Implications for Reservoir Inflow in the United States. J. Hydrol. 2018, 556, 359–370. [Google Scholar] [CrossRef]
  20. Ouyang, Y.; Panda, S.S. Linking Climate-Change Impacts on Hydrological Processes. Climate 2022, 10, 96. [Google Scholar] [CrossRef]
  21. Wang, X.; Jiang, D.; Lang, X. Future Changes in Aridity Index at Two and Four Degrees of Global Warming above Preindustrial Levels. Int. J. Climatol. 2021, 41, 278–294. [Google Scholar] [CrossRef]
  22. Xu, Z.X.; Takeuchi, K.; Ishidaira, H.; Zhang, X.W. Sustainability Analysis for Yellow River Water Resources Using the System Dynamics Approach. Water Resour. Manag. 2002, 16, 239–261. [Google Scholar] [CrossRef]
  23. Cassagnole, M.; Ramos, M.H.; Zalachori, I.; Thirel, G.; Garçon, R.; Gailhard, J.; Ouillon, T. Impact of the quality of hydrological forecasts on the management and revenue of hydroelectric reservoirs—A conceptual approach. Hydrol. Earth Syst. Sci. 2021, 25, 1033–1052. [Google Scholar] [CrossRef]
  24. Todd, M.C.; Taylor, R.G.; Osborn, T.J.; Kingston, D.G.; Arnell, N.W.; Gosling, S.N. Uncertainty in Climate Change Impacts on Basin-Scale Freshwater Resources—Preface to the Special Issue: The QUEST-GSI Methodology and Synthesis of Results. Hydrol. Earth Syst. Sci. 2011, 15, 1035–1046. [Google Scholar] [CrossRef] [Green Version]
  25. Vicuna, S.; Maurer, E.P.; Joyce, B.; Dracup, J.A.; Purkey, D. The Sensitivity of California Water Resources to Climate Change Scenarios. J. Am. Water Resour. Assoc. 2007, 43, 482–498. [Google Scholar] [CrossRef]
  26. Dorchies, D.; Thirel, G.; Jay-Allemand, M.; Chauveau, M.; Dehay, F.; Bourgin, P.Y.; Perrin, C.; Jost, C.; Rizzoli, J.L.; Demerliac, S.; et al. Climate Change Impacts on Multi-Objective Reservoir Management: Case Study on the Seine River Basin, France. Int. J. River Basin Manag. 2014, 12, 265–283. [Google Scholar] [CrossRef] [Green Version]
  27. Mimikou, M.A.; Baltas, E.A. Impacts Du Changement Climatique Sur La Production d’énergie Hydroélectrique. Hydrol. Sci. J. 1997, 42, 661–678. [Google Scholar] [CrossRef] [Green Version]
  28. Prudhomme, C.; Davies, H. Assessing Uncertainties in Climate Change Impact Analyses on the River Flow Regimes in the UK. Part 1: Baseline Climate. Clim. Chang. 2009, 93, 177–195. [Google Scholar] [CrossRef]
  29. Cloke, H.L.; Wetterhall, F.; He, Y.; Freer, J.E.; Pappenberger, F. Modelling Climate Impact on Floods with Ensemble Climate Projections. Q. J. R. Meteorol. Soc. 2013, 139, 282–297. [Google Scholar] [CrossRef] [Green Version]
  30. Kundzewicz, Z.W.; Krysanova, V.; Benestad, R.E.; Hov; Piniewski, M.; Otto, I.M. Uncertainty in Climate Change Impacts on Water Resources. Environ. Sci. Policy 2018, 79, 1–8. [Google Scholar] [CrossRef]
  31. Gudmundsson, L.; Bremnes, J.B.; Haugen, J.E.; Engen-Skaugen, T. Technical Note: Downscaling RCM Precipitation to the Station Scale Using Statistical Transformations &ndash; A Comparison of Methods. Hydrol. Earth Syst. Sci. 2012, 16, 3383–3390. [Google Scholar] [CrossRef] [Green Version]
  32. Jakeman, A.J.; Hornberger, G.M. How much complexity is warranted in a rainfall-runoff model? Water Res. Res. 1993, 29, 2637–2649. [Google Scholar] [CrossRef]
  33. Gardner, L.R. Assessing the Effect of Climate Change on Mean Annual Runoff. J. Hydrol. 2009, 379, 351–359. [Google Scholar] [CrossRef]
  34. Xu, C.Y.; Singh, V.P. Review on Regional Water Resources Assessment Models under Stationary and Changing Climate. Water Resour. Manag. 2004, 18, 591–612. [Google Scholar] [CrossRef] [Green Version]
  35. Nash, E.; Sutcliffe, V. PART I- A DISCUSSION OF PRINCIPLES * The Problem of Determining River Flows from Rainfall, Evaporation, and Other Factors, Occupies a Central Place in the Technology of Applied Hydrology. It Is Not Only Essent. Probl. Flood Forecast. But A 1970, 10, 282–290. [Google Scholar]
  36. Wilby, R.L.; Harris, I. A Framework for Assessing Uncertainties in Climate Change Impacts: Low-Flow Scenarios for the River Thames, UK. Water Resour. Res. 2006, 42, W02419. [Google Scholar] [CrossRef]
  37. Legates, D.R.; McCabe, G.J. Evaluating the Use of “goodness-of-Fit” Measures in Hydrologic and Hydroclimatic Model Validation. Water Resour. Res. 1999, 35, 233–241. [Google Scholar] [CrossRef]
  38. Moriasi, D.N.; Arnold, J.G.; Van Liew, M.W.; Bingner, R.L.; Harmel, R.D.; Veith, T.L. Model Evaluation Guidelines for Systematic Quantification of Accuracy in Watershed Simulations. Am. Soc. Agric. Biol. Eng. 2007, 50, 885–900. [Google Scholar]
  39. Güntner, A.; Krol, M.S.; Araújo, J.C.D.; Bronstert, A. Simple Water Balance Modelling of Surface Reservoir Systems in a Large Data-Scarce Semiarid Region/Modélisation Simple Du Bilan Hydrologique de Systèmes de Réservoirs de Surface Dans Une Grande Région Semi-Aride Pauvre En Données. Hydrol. Sci. J. 2004, 49, 918. [Google Scholar] [CrossRef]
  40. Jain, S.K.; Bhunya, P.K. Reliability, Resilience and Vulnerability of a Multipurpose Storage Reservoir. Hydrol. Sci. J. 2008, 53, 434–447. [Google Scholar] [CrossRef]
  41. Chou, S.C.; Lyra, A.; Mourão, C.; Dereczynski, C.; Pilotto, I.; Gomes, J.; Bustamante, J.; Tavares, P.; Silva, A.; Rodrigues, D.; et al. Evaluation of the Eta Simulations Nested in Three Global Climate Models. Am. J. Clim. Chang. 2014, 3, 438–454. [Google Scholar] [CrossRef] [Green Version]
  42. Cloke, H.L.; Pappenberger, F. Ensemble Flood Forecasting: A Review. J. Hydrol. 2009, 375, 613–626. [Google Scholar] [CrossRef]
  43. Mann, H.B.; Whitney, D.R. On a Test of Whether One of Two Random Variables Is Stochastically Larger than the Other. Ann. Math. Stat. 1947, 18, 50–60. [Google Scholar] [CrossRef]
  44. Machiwal, D.; Jha, M.K. Time Series Analysis of Hydrologic Data for Water Resources Planning and Management: A Review. J. Hydrol. Hydromech. 2006, 54, 237–257. [Google Scholar]
  45. Wang, Z.; Hu, C. Strategies for managing reservoir sedimentation. Int. J. Sedim. Res. 2009, 24, 369–384. [Google Scholar] [CrossRef]
  46. Ijam, A.Z.; Al Saraireh, A.M. Increasing Storage by Raising WALA Dam in Jordan. Int. J. Appl. Eng. Res. 2021, 16, 94–102. [Google Scholar]
  47. Liu, X.; Tang, Q.; Cui, H.; Mu, M.; Gerten, D.; Gosling, S.N.; Masaki, Y.; Satoh, Y.; Wada, Y. Multimodel Uncertainty Changes in Simulated River Flows Induced by Human Impact Parameterizations. Environ. Res. Lett. 2017, 12, 025009. [Google Scholar] [CrossRef]
  48. Bustamante, M.; Nardoto, G.; Pinto, A.; Resende, J.; Takahashi, F.; Vieira, L. Potential Impacts of Climate Change on Biogeochemical Functioning of Cerrado Ecosystems. Brazilian J. Biol. 2012, 72, 655–671. [Google Scholar] [CrossRef] [Green Version]
  49. Rodrigues, J.A.M.; Viola, M.R.; Alvarenga, L.A.; de Mello, C.R.; Chou, S.C.; de Oliveira, V.A.; Uddameri, V.; Morais, M.A.V. Climate Change Impacts under Representative Concentration Pathway Scenarios on Streamflow and Droughts of Basins in the Brazilian Cerrado Biome. Int. J. Climatol. 2020, 40, 2511–2526. [Google Scholar] [CrossRef]
  50. Salas, J.D. Analysis and Modeling of Hydrologic Time Series. In Handbook of Hydrology; Maidmend, D.R., Ed.; McGraw-Hill: New York, NY, USA, 1992; pp. 19.1–19.72. [Google Scholar]
  51. Dahmen, E.R.; Hall, M.J. Screening of Hydrological Data: Tests for Stationarity and Relative Consistency; International Institute for Land Reclamation and Improvement/ILRI: Wangeningen, The Netherlands, 1990; ISBN 9070754231. [Google Scholar]
  52. Johnson, F.; Sharma, A. A Nesting Model for Bias Correction of Variability at Multiple Time Scales in General Circulation Model Precipitation Simulations. Water Resour. Res. 2012, 48, W01504. [Google Scholar] [CrossRef] [Green Version]
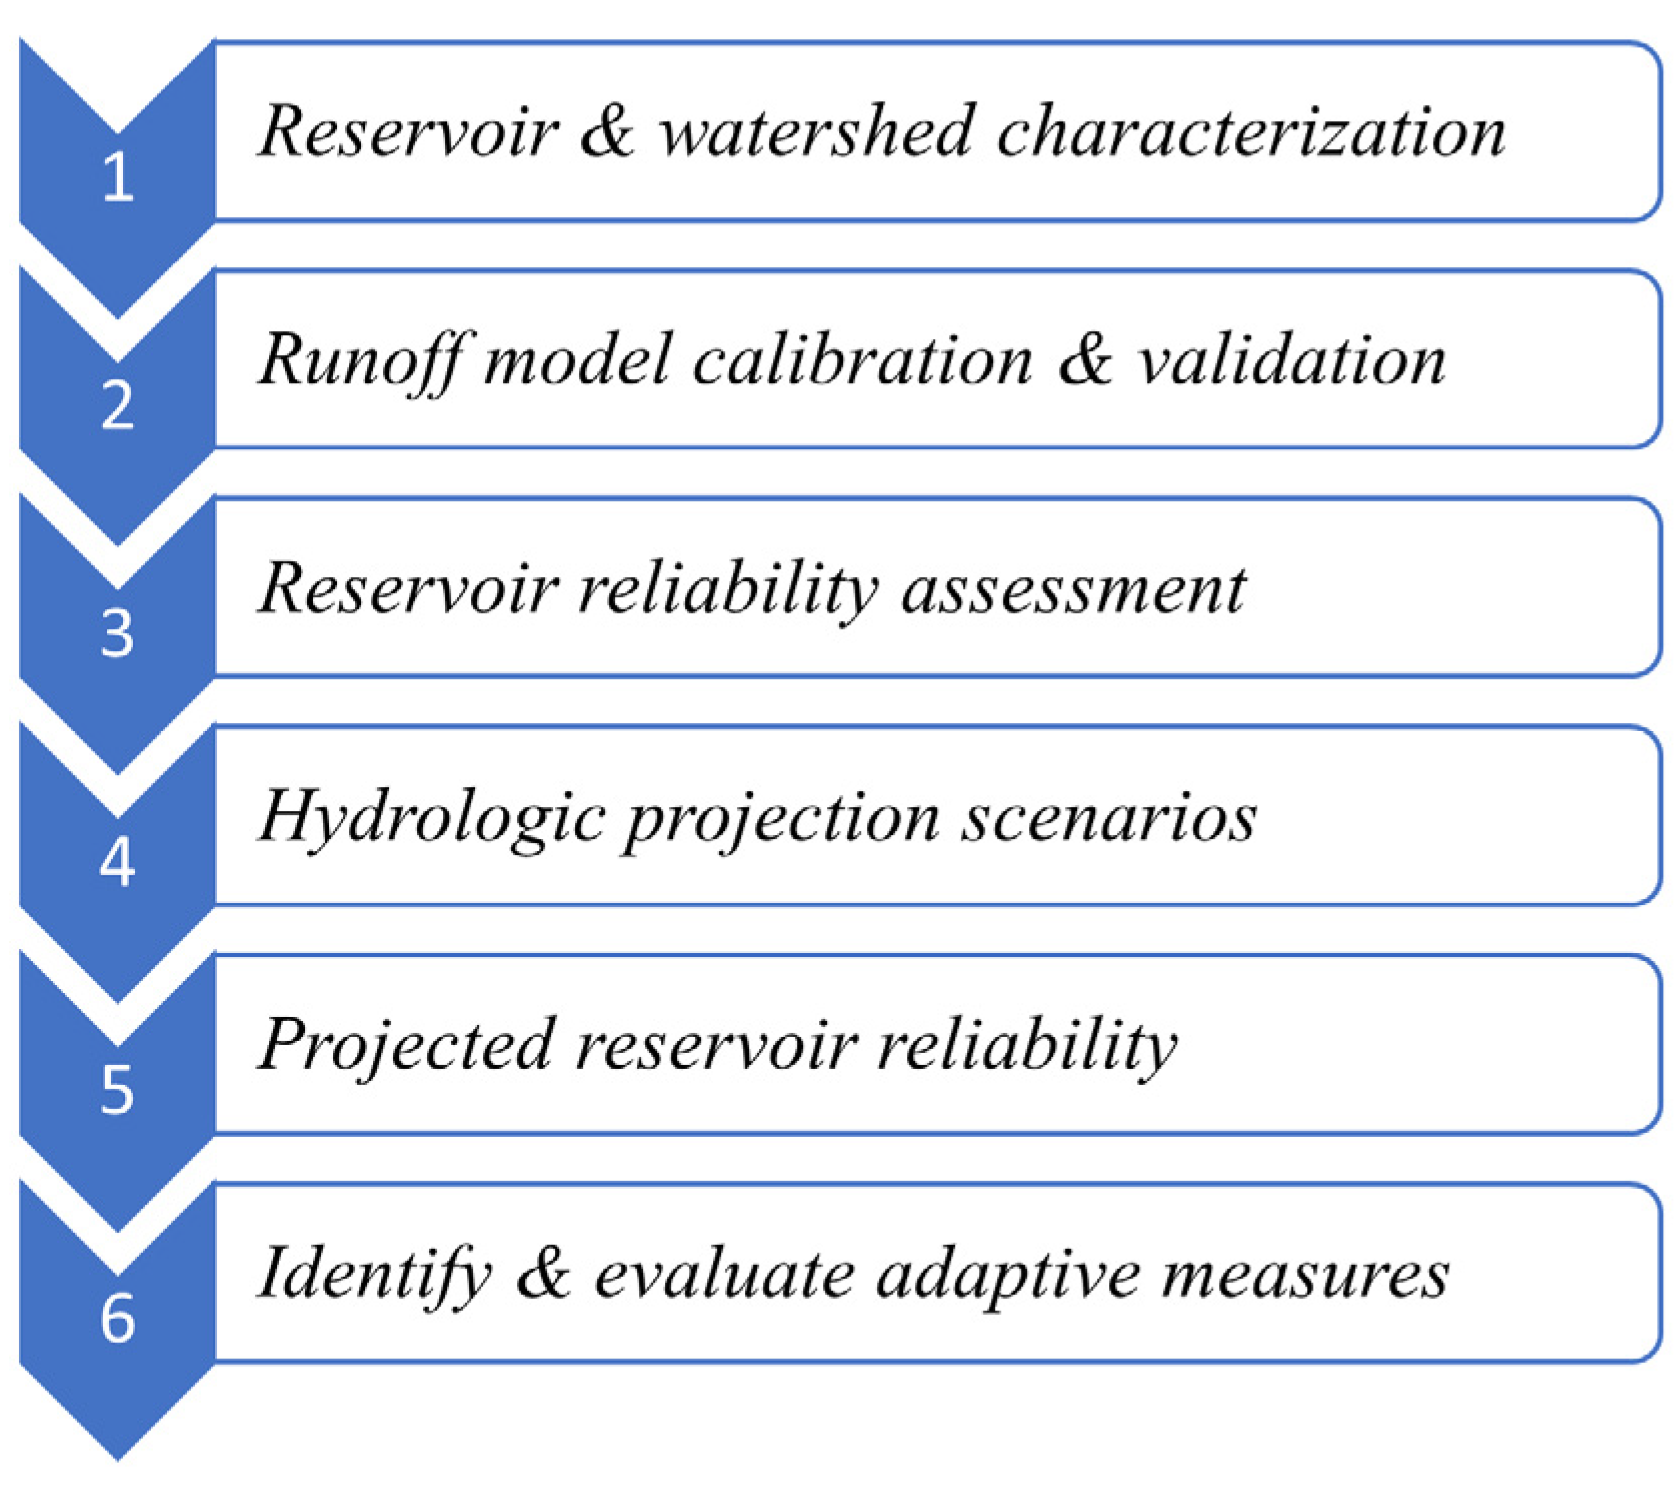
Figure 1. Reservoir reliability and adaptation scheme.
Water 15 02323 g001
Figure 2. The Descoberto river watershed and reservoir, in Central Brazil.
Water 15 02323 g002
Figure 3. Annual inflow, reservoir release, and active volume of the Descoberto reservoir between 1986 and 2018, showing the reservoir failure in 2017 (break in the release line).
Water 15 02323 g003
Figure 4. Examples of RCM annual temperature (top) and precipitation (bottom) ensembles in the Descoberto watershed, in the future (2045) and historic (2005) scenarios, respectively.
Water 15 02323 g004
Figure 5. Scatterplot of runoff model calibration and validation in the historic (1987–2015) period.
Water 15 02323 g005
Figure 6. Observed (o), modeled (m), and bias-corrected (mc) annual temperature (T) and precipitation (P) of the Descoberto basin in the historic (1985–2005) period.
Water 15 02323 g006
Figure 7. Reservoir budget in the historic period (1986–2005), with the design draft of D = 182.9 hm3 yr−1. I = inflow; R = reservoir release; W = reservoir spill; S = reservoir storage.
Water 15 02323 g007
Figure 8. Reservoir budget in the period 2031–2050 RCP 4.5 (top) and RCP 8.5 (bottom), using the design draft of 182.9 hm3 yr−1. I = reservoir inflow; R = reservoir release; W = reservoir spill; S = reservoir storage.
Water 15 02323 g008
Figure 9. Reservoir budget in the period 2061–2080 RCP 4.5 (top) and RCP 8.5 (bottom), using the design draft of 182.9 hm3 yr−1. I = reservoir inflow; R = reservoir release; W = reservoir spill; S = reservoir storage.
Water 15 02323 g009aWater 15 02323 g009b
Figure 10. Adaptive reservoir water budget in the period 2031–2050 (RCP 4.5), using a draft of 97 hm3 yr−1 (top), and additional storage of 17.2 hm3 and a draft of 99.0 hm3 yr−1 (bottom). I = reservoir inflow; R = reservoir release; W = reservoir spill; S = reservoir storage.
Water 15 02323 g010
Figure 11. Adaptive reservoir budget in the period 2031–2050 (RCP 8.5), using a draft of 99 hm3 yr−1 (top), and an additional storage of 17.2 hm3 and a draft of 101.0 hm3 yr−1 (bottom). I = reservoir inflow; R = reservoir release; W = reservoir spill; S = reservoir storage.
Water 15 02323 g011aWater 15 02323 g011b
Figure 12. Adaptive reservoir budget in the period 2061–2080 (RCP 4.5), using a draft of 88 hm3 yr−1 (top), and an additional storage of 17.2 hm3 and a draft of 89.7 hm3 yr−1 (bottom). I = reservoir inflow; R = reservoir release; W = reservoir spill; S = reservoir storage.
Water 15 02323 g012
Figure 13. Adaptive reservoir budget in the period 2061–2080 (RCP 8.5), using a draft of 62 hm3 yr−1 (top), and an additional storage of 17.2 hm3 and a draft of 64.5 hm3 yr−1 (bottom). I = reservoir inflow; R = reservoir release; W = reservoir spill; S = reservoir storage.
Water 15 02323 g013
Table 1. Descoberto watershed and reservoir hydrologic and operational characteristics.
Watershed AreaReservoir AreaActive VolumeMean Annual InflowC.V. of InflowsDesign DraftEnviron. Flow
(km2)(km2)(106 m3)(106 m3 yr−1)(%)(106 m3 yr−1)(106 m3 yr−1)
430.712.686.0251.119.1163.419.6
Table 2. Potential measures for reservoir adaptation to climate change.
MeasureTypeSource
Draft reductionOperational[15]
Increased reservoir storageStructural[46]
Sedimentation managementOperational[47]
Table 3. Means and coefficients of variation (CV) of annual precipitation (P) and temperature (T) in the future climate scenarios, and the significance of climate change with respect to the historic period (** and *** indicate significance at 95% and 99%, respectively).
PeriodScenarioP (mm)CV [P]T(°C)CV [T]
1986–2005HIS 1474.30.16 21.00.01
2031–2050RCP 4.51082.0 ***0.4022.8 ***0.01
RCP 8.51178.6 **0.4423.2 ***0.02
2061–2080RCP 4.51082.4 ***0.5423.6 ***0.01
RCP 8.5886.1 ***0.5525.3 ***0.02
Table 4. Means and coefficients of variation (CV) of annual inflow (Q) and potential evapotranspiration (PET) in the different climate scenarios, and the significance of hydrologic change with respect to the historic period (** and *** indicate significance at 95% and 99%, respectively).
PeriodScenarioQ (mm)CV [Q]PET (mm)CV [PET]
1986–2005HIS 580.00.23 1810.80.01
2031–2050RCP 4.5356.0 ***0.631993.1 **0.02
RCP 8.5404.2 **0.692036.1 ***0.02
2061–2080RCP 4.5354.1 ***0.882074.0 ***0.01
RCP 8.5244.3 ***0.972274.8 ***0.03
Table 5. Mean reservoir release, number of years of failure, probability of failure (Pf) and reliability (Rr) of the Descoberto reservoir in the historic and future scenarios, with a draft (D) of 182.9 hm3 yr−1.
PeriodScenarioMean Release (hm3 yr−1)% of Orig.
Draft
No. of FailuresPf
(%)
Rr
(%)
1986–2005HIS182.9100.000100
2031–2050RCP 4.5131.371.7157525
RCP 8.5142.978.1105050
2061–2080RCP 4.5121.866.6178515
RCP 8.593.351.0168020
Table 6. Adaptive drafts and additional reservoir storage in each of the future climate scenarios, and the resulting probability of failure and reliability.
PeriodScenarioAdaptive Draft (hm3 yr−1)% of Original DraftAdditional Storage (hm3)Pf
(%)
Rr
(%)
2031–2050RCP 4.597.053.000100
99.054.117.20100
RCP 8.599.054.100100
101.055.217.20100
2061–2080RCP 4.588.048.100100
89.749.017.20100
RCP 8.562.033.900100
64.535.317.20100
Disclaimer/Publisher’s Note: The statements, opinions and data contained in all publications are solely those of the individual author(s) and contributor(s) and not of MDPI and/or the editor(s). MDPI and/or the editor(s) disclaim responsibility for any injury to people or property resulting from any ideas, methods, instructions or products referred to in the content.