Article

A Study on Water Rights Allocation in Transboundary Rivers Based on the Transfer and Inequality Index of Virtual Water

1
Industrial Engineering Department, Architectural Engineering School, Tongling University, Tongling 244000, China
2
Logistics Department, Business School, Suzhou University of Science and Technology, Suzhou 215009, China
*
Authors to whom correspondence should be addressed.
Water 2023, 15(13), 2379; https://doi.org/10.3390/w15132379
Submission received: 24 May 2023 / Revised: 21 June 2023 / Accepted: 24 June 2023 / Published: 28 June 2023
(This article belongs to the Special Issue Water Resources and Sustainable Development)

Abstract

:
Virtual water exerts an essential effect on water resources, yet such effect is rarely considered in current studies on water rights allocation in transboundary rivers. Hence, this paper ran a case study on Taihu Lake Basin, collecting data from 2017 to make clear the physical water rights of four regions—Jiangsu Province, Zhejiang Province, Anhui Province, and Shanghai City—in the Basin. After that, the multiregional input–output (MRIO) approach was utilized to measure the trade in value-added (TiVA) transfer and virtual water transfer (VWT) and construct an inequality index of VWT (VWI). Next, water efficiency coefficient was employed to convert the VWT into riparian level. Finally, VWT and VWI were incorporated into the water rights allocation model to form up a water rights allocation scheme for Taihu Lake Basin. Results showed: (1) Jiangsu enjoys the most allocated physical water rights, followed by Zhejiang, and Anhui ranks the lowest; (2) Anhui and Jiangsu are net virtual water exporters (2.259 billion m3 and 1.78 billion m3, respectively), while Zhejiang and Shanghai are net importers (2.344 billion m3 and 1.695 billion m3, respectively); (3) Anhui suffers the most inequality—0.4401—followed by 0.5076 of Jiangsu, while Zhejiang has the most equal environment—0.7012; (4) after the inclusion of virtual water, the quantity of water rights allocation changes, whereas Anhui experiences the largest growth—144 million m3—due to the dual effects from the highest VWT and inequality. In conclusion, the effect of virtual water is indispensable, so VWT and VWI should both be considered in the physical water rights allocation of transboundary rivers.

1. Introduction

Water shortage leads to disputes over water resources between upper and lower parts of a drainage basin or even regional intense competition for water rights, such as the Maipo River in Nile and the Tennessee Valley in USA [1,2,3,4]. Hence, with the water rights fairly determined and allocated, such conflicts could be greatly relieved, beneficial to establish an equitable water trading market and transregional ecological compensation. In light of overseas attempts, the key to initial water rights allocation is to adhere to multiple objectives of social equity, economic benefit, ecological preservation, and risk control [5,6,7]. Scholars have discovered a variety of allocation methods such as linear programming, dynamic programming, multi-model methodology, the multi-objective method, collaboration, and game, and gained experience in exploring rules for initial water rights allocation in drainage basins [8,9,10,11,12,13,14,15,16,17,18,19,20,21,22,23,24].
Virtual water refers to the water hidden in trading products and varies according to regional trade cooperation [25,26,27,28,29,30,31,32,33,34,35,36,37,38,39]. Frequent trading leads to an increase in virtual water transfer (VWT) between upper and lower parts of a basin, which exerts an indirect impact on the actual amount of water resources [25,26,27,28,29,30,31,32,33,34,35,36,37,38,39]. Therefore, it is necessary to incorporate virtual water into initial water rights allocation [25,40,41,42]. However, most current studies are centered around physical water resources, evading the invisible effect of virtual water [8,9,10,11,12,13,14,15,16,17,18,19,20,21,22,23,24]. In this case, this paper included virtual water into the exploration of water rights allocation in transboundary river basins.
To include virtual water in physical water rights allocation, an underlying issue—unfairness between economic benefit and environmental cost—must be considered. So, this paper is grounded in the inequality index of VWT (VWI). Methodologies such as the Gini coefficient, Theil index, Lorenz curve, and coefficient of variation were utilized to measure inequality [43,44,45,46,47,48], and focused on the holistic perspective of trade–environmental inequality. Some scholars have probed into the equivalence between the implicit resource cost and economic value added of trade [49,50,51,52]. On such basis, this paper employed the environmentally extended multiregional input–output (MRIO) model to measure VWT and trade in value-added (TiVA) transfer to construct VWI, to analyze the imbalance between them and integrate it into an allocation model.
The principles of consensus among scholars regarding physical water rights allocation are domestic water first, food security, respect for the history and status quo, and sustainable development [5,6,7]. In terms of methodology, this paper, drawing from previous studies, thus constructed an index system grounded in principles of status quo, equity, efficiency, sustainability, and macro regulation. Second, as for VWT methodology, many scholars found that the multiregional input–output approach can clarify the interdependence among sections of an entire supply chain in an economy [53,54,55,56,57,58,59,60]. It provides a clearer quantification of the amount of water deployed in trade and makes the virtual water calculation more intuitive and accurate [53,54,55,56,57,58,59,60]. Therefore, this paper drew an input–output tablet for modelling to calibrate water resources allocation in trade [35,36,37,38,39,40,41,42,43,44,45]. Third, VWT is measured among provinces, while water rights allocation is measured in the riparian areas of a transboundary drainage basin. So, VWT needs to be converted. However, there are only a few studies to refer to. Some scholars have adopted water efficiency coefficient to convert from a qualitative perspective [41,61,62]. Considering this, we also measured and converted VWT using the proportion of the water efficiency coefficient of basin area to that of the corresponding province.
In general, many studies have proven the VWT included in trade and its influence, yet still mainly taken physical water into consideration while formulating water rights allocation schemes. Therefore, to fill this gap, this paper first makes clear the physical water rights allocation in the transboundary river, then calculates provincial VWT and constructed VWI and convert provincial VWT into riparian VWT. Last, the converted VWT and VWI are integrated into the water rights allocation model.
So, based on the preceding analysis, the research framework underpinning this paper is meticulously assembled (Figure 1). First, according to the allocation rules, this paper makes clear the physical water rights allocation in the transboundary river. Next, the MRIO approach is employed to measure the VWT and TiVA transfer, and VWI is constructed accordingly. Third, considering that the provincial VWT was predicted at the provincial level, while the physical water allocation at the basin level within the provincial jurisdiction, a conversion of provincial VWT into riparian VWT with water efficiency coefficient is necessitated to reduce errors. Last, the converted VWT and VWI are integrated into the water rights allocation model.
This paper makes the following contributions: (1) integrating virtual water into physical water rights allocation to enrich the theories of initial water rights allocation of transboundary rivers; (2) constructing VWI to make allocation schemes more equal and reasonable.
The rest of this paper is arranged as follows: Section 2 introduces the methodology and data collection; Section 3 summarizes the main results; Section 4 is discussion; Section 5 presents the conclusion.

2. Methodology and Data Collection

2.1. Methodologies

2.1.1. Modelling of Physical Water Rights Allocation

Constructing an Index System of Physical Water Rights Allocation

Drawing from previous research [5,6,7,8], this paper builds an index system of physical water rights allocation (Table 1).
In Table 1, the lower grades of cost-based coefficients mean that more initial water rights should be allocated, while the higher grades of benefit-based coefficients mean that more initial water rights should be allocated.

Allocating Physical Water Rights

(1)
Decision making matrix
Suppose n regions in a drainage basin are involved in the initial water rights allocation, each having a total of m m = 1 , 2 , , 19 indicators, so m indicators of n regions constitute a decision making matrix below:
X = x 11 x 12 x 1 n x 21 x 22 x 2 n x m 1 x m 2 x m n = x i j m × n
(2)
Data normalization
The matrix X needs to be normalized to unitize the indicator standards.
For cost-based indicators, Formula (2) is used for standardization to eliminate the influence of inconsistent dimensions:
y i j = max i   x i j x i j max i   x i j min i   x i j , i = 1 , 2 , , m ; j = 1 , 2 , , n
For benefit-based indicators, Formula (3) is used for standardization to eliminate the influence of inconsistent dimensions:
y i j = x i j min i   x i j max i   x i j min i   x i j , i = 1 , 2 , , m ; j = 1 , 2 , , n
where max i   x i j represents the maximum of indicator i in region n , and min i   x i j is the minimum.
(3)
Project indicator function
Matrixes of both positive-ideal and negative-ideal solutions are below:
Y j + = max y 1 j , y 2 j , , y m j Y j = min y 1 j , y 2 j , , y m j
Distance from every region to the positive-ideal solution is:
d j + = i = 1 m ω i ( y i j y i j + ) 2 0.5
where ω i stands for the weight of indicator i , and the smaller d j + is, the closer region j , j = 1 , 2 , , n is to the positive-ideal point, and the more water rights should be allocated to the region.
Similarly, the distance from every region to the negative-ideal solution is:
d j = i = 1 m ω i ( y i j y i j ) 2 0.5
where the bigger d j is, the further region j is from the negative-ideal point, and the more water rights should be allocated to the region.
Relative proximity is used according to TOPSIS:
D j = d j d j + d j +
In terms of ω j , qualitative indicators ( p 51 , p 52 ) and quantitative indicators are included, so an analytic hierarchy process (AHP) combining both indicators is employed to calculate the weights of indicators.
(4)
Water rights allocation scheme
Based on Equations (5)–(7), the quantity of water rights allocated for every region is:
φ j = D j j = 1 n D j
Quantity of initial water rights is:
C r = φ r C 0
where C 0 stands for the available water resources, and C 1 , C 2 C n is the initial water rights allocation schemes.

2.1.2. Model for Calculating VWT and VWI

2.1.2.1. Provincial VWT Calculation

Provincial VWT is calculated based on the MRIO model. By constructing input–output matrices between regions, it can determine the virtual water input–output relationship generated in the trade of intermediate and final products between regions and reflect the distribution of virtual water in different sectors of different regions. Additionally, according to the CEADs’ MRIO database, the VWT of each region is calculated. The specific steps are as follows:
A transboundary basin contains n provinces –province 1 , 2 , , n . Other provinces are treated as province ( n + 1 ). In addition, this paper modified the MRIO table, as shown in Table A1 in Appendix A.
Based on the modified MRIO table, we can obtain
Z r s = p = 1 n + 1 W r L r p F p s
To be specific, r   a n d   s refer to basin provinces, p stands for the provinces trading with province r   a n d   s , and n + 1 is the number of provinces trading with province r a n d s . When p = r , VWT is included in the direct trade from province r to province s . When p r , province r exports semifinished products to province p , which then further process into final products and export to province s , transferring water resources from province r to province s . It is, in other words, indirect VWT from province r to province s .
Z r s represents VWT from province r to province s , W the direct water coefficient matrix, and W r the direct water coefficient matrix of province r , which is directly obtained from the China Statistic Yearbook. L stands for the well-known Leontief inverse, representing the gross output generated throughout the production process of one unit of consumption; L r p refers to the submatrices of Leontief inverse matrix for province r to province p , which is calculated by MRIO; F is the final demand matrix, and F p s represents the submatrices of the final demand matrix for province p to province s , which is directly obtained by MRIO.
In the same way, VWT from province s to province r can be attained:
Z s r = p = 1 n + 1 W s L s p F p r
where W s stands for the direct water coefficient matrix of province s , L s p the submatrices of the Leontief inverse matrix for province s to province p , and F p r the submatrices of the final demand matrix for province p to province r .
In conclusion, the net VWT from province r to other provinces via trade is represented as follows:
k z r = s = 1 n Z r s Z s r
If k z r > 0 , province r is a net exporter of virtual water; if k z r < 0 , it is a net importer.

VWI

Trade brings economic benefits to all parties involved, and the most direct benefits is domestic economic growth, namely, an increase in domestic value added. However, the value added of each country exists in two forms: imports and exports. Imports represent an increase in value added in other countries, while exports represent an increase in value added in one’s own country. The net transfer of value added can be expressed as the difference between the value added of exports and imports. A positive value indicates that the country is in generally economic benefit, while a negative value results in economic losses.
From an environmental perspective, trade brings virtual water to different countries in either imported or exported forms. Countries with a net import of virtual water are the beneficiaries, while those with a net export are the losers. However, when two trading partners divide up the work differently in the global supply chain, the “hidden” water and added value in their traded goods also differ greatly. This means that the water and environmental costs that the trading countries pay can be much more than the economic benefits they receive, which is known as the unfairness of virtual water transfer, also known as the unfairness of trade value-added and virtual water transfer.
Therefore, this paper constructed the VWI based on the input–output of virtual water and trade value-added, and measured the gains (losses) of regions.
(1)
Model of provincial TiVA transfer
By using a MRIO model, we can calculate the impact of each region’s trade on the value added of other regions, that is, TiVA transfer. The TiVA transfer of each region is decomposed to track the impact of final demand from other regions on the implied TiVA of the region. Meanwhile, if a region has a net output of value-added in its trade with other regions, it indicates that other regions are driving the economic growth; conversely, if a region is driving the economic growth of other regions, it indicates that the region is a net importer of value-added.
In the way mentioned in Section 2.1.2.1, TiVA transfer matrix (from province r to province s ) is obtained:
V r s = p = 1 n + 1 TiVA r L r p F p s
where TiVA r stands for the trade value added matrix of province r , which is obtained from MRIO directly. V r s means TiVA transfer matrix.
The TiVA transfer matrix from province s to province r is
V s r = p = 1 n + 1 TiVA s L s p F p r
Net TiVA transfer from province r to other provinces via trade is
k v r = s = 1 n V r s V s r
If k v r > 0 , province r is a net exporter of TiVA; if k v r < 0 , province r is a net importer.
(2)
Model of Inequality Index
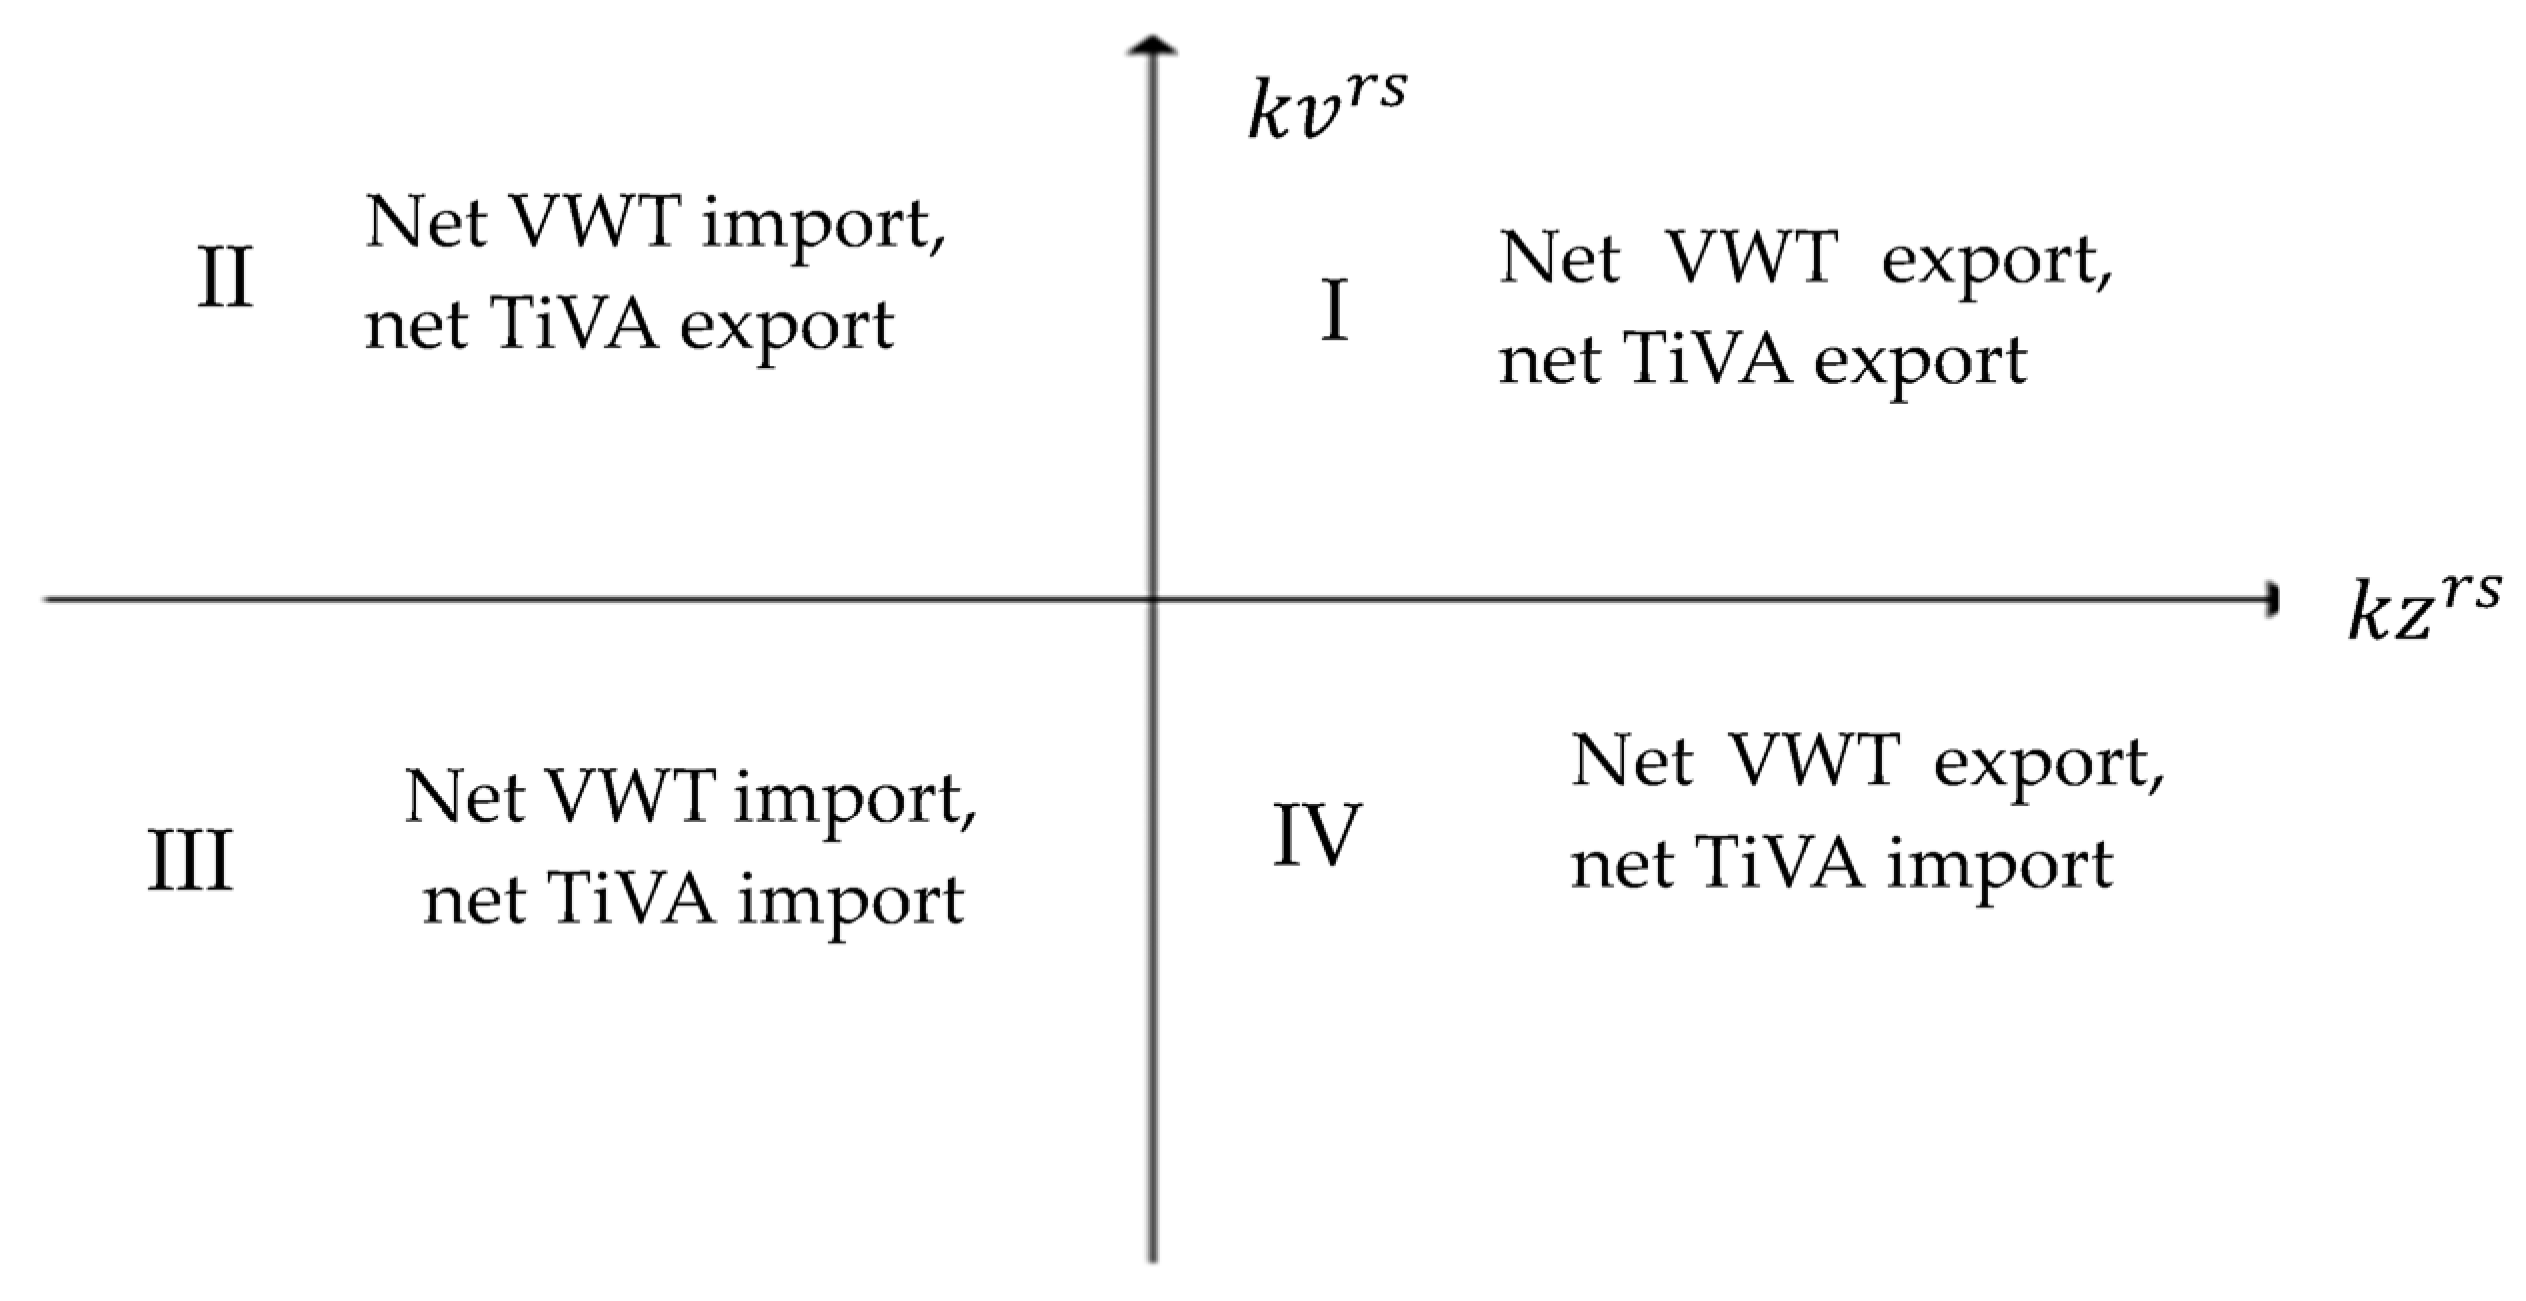
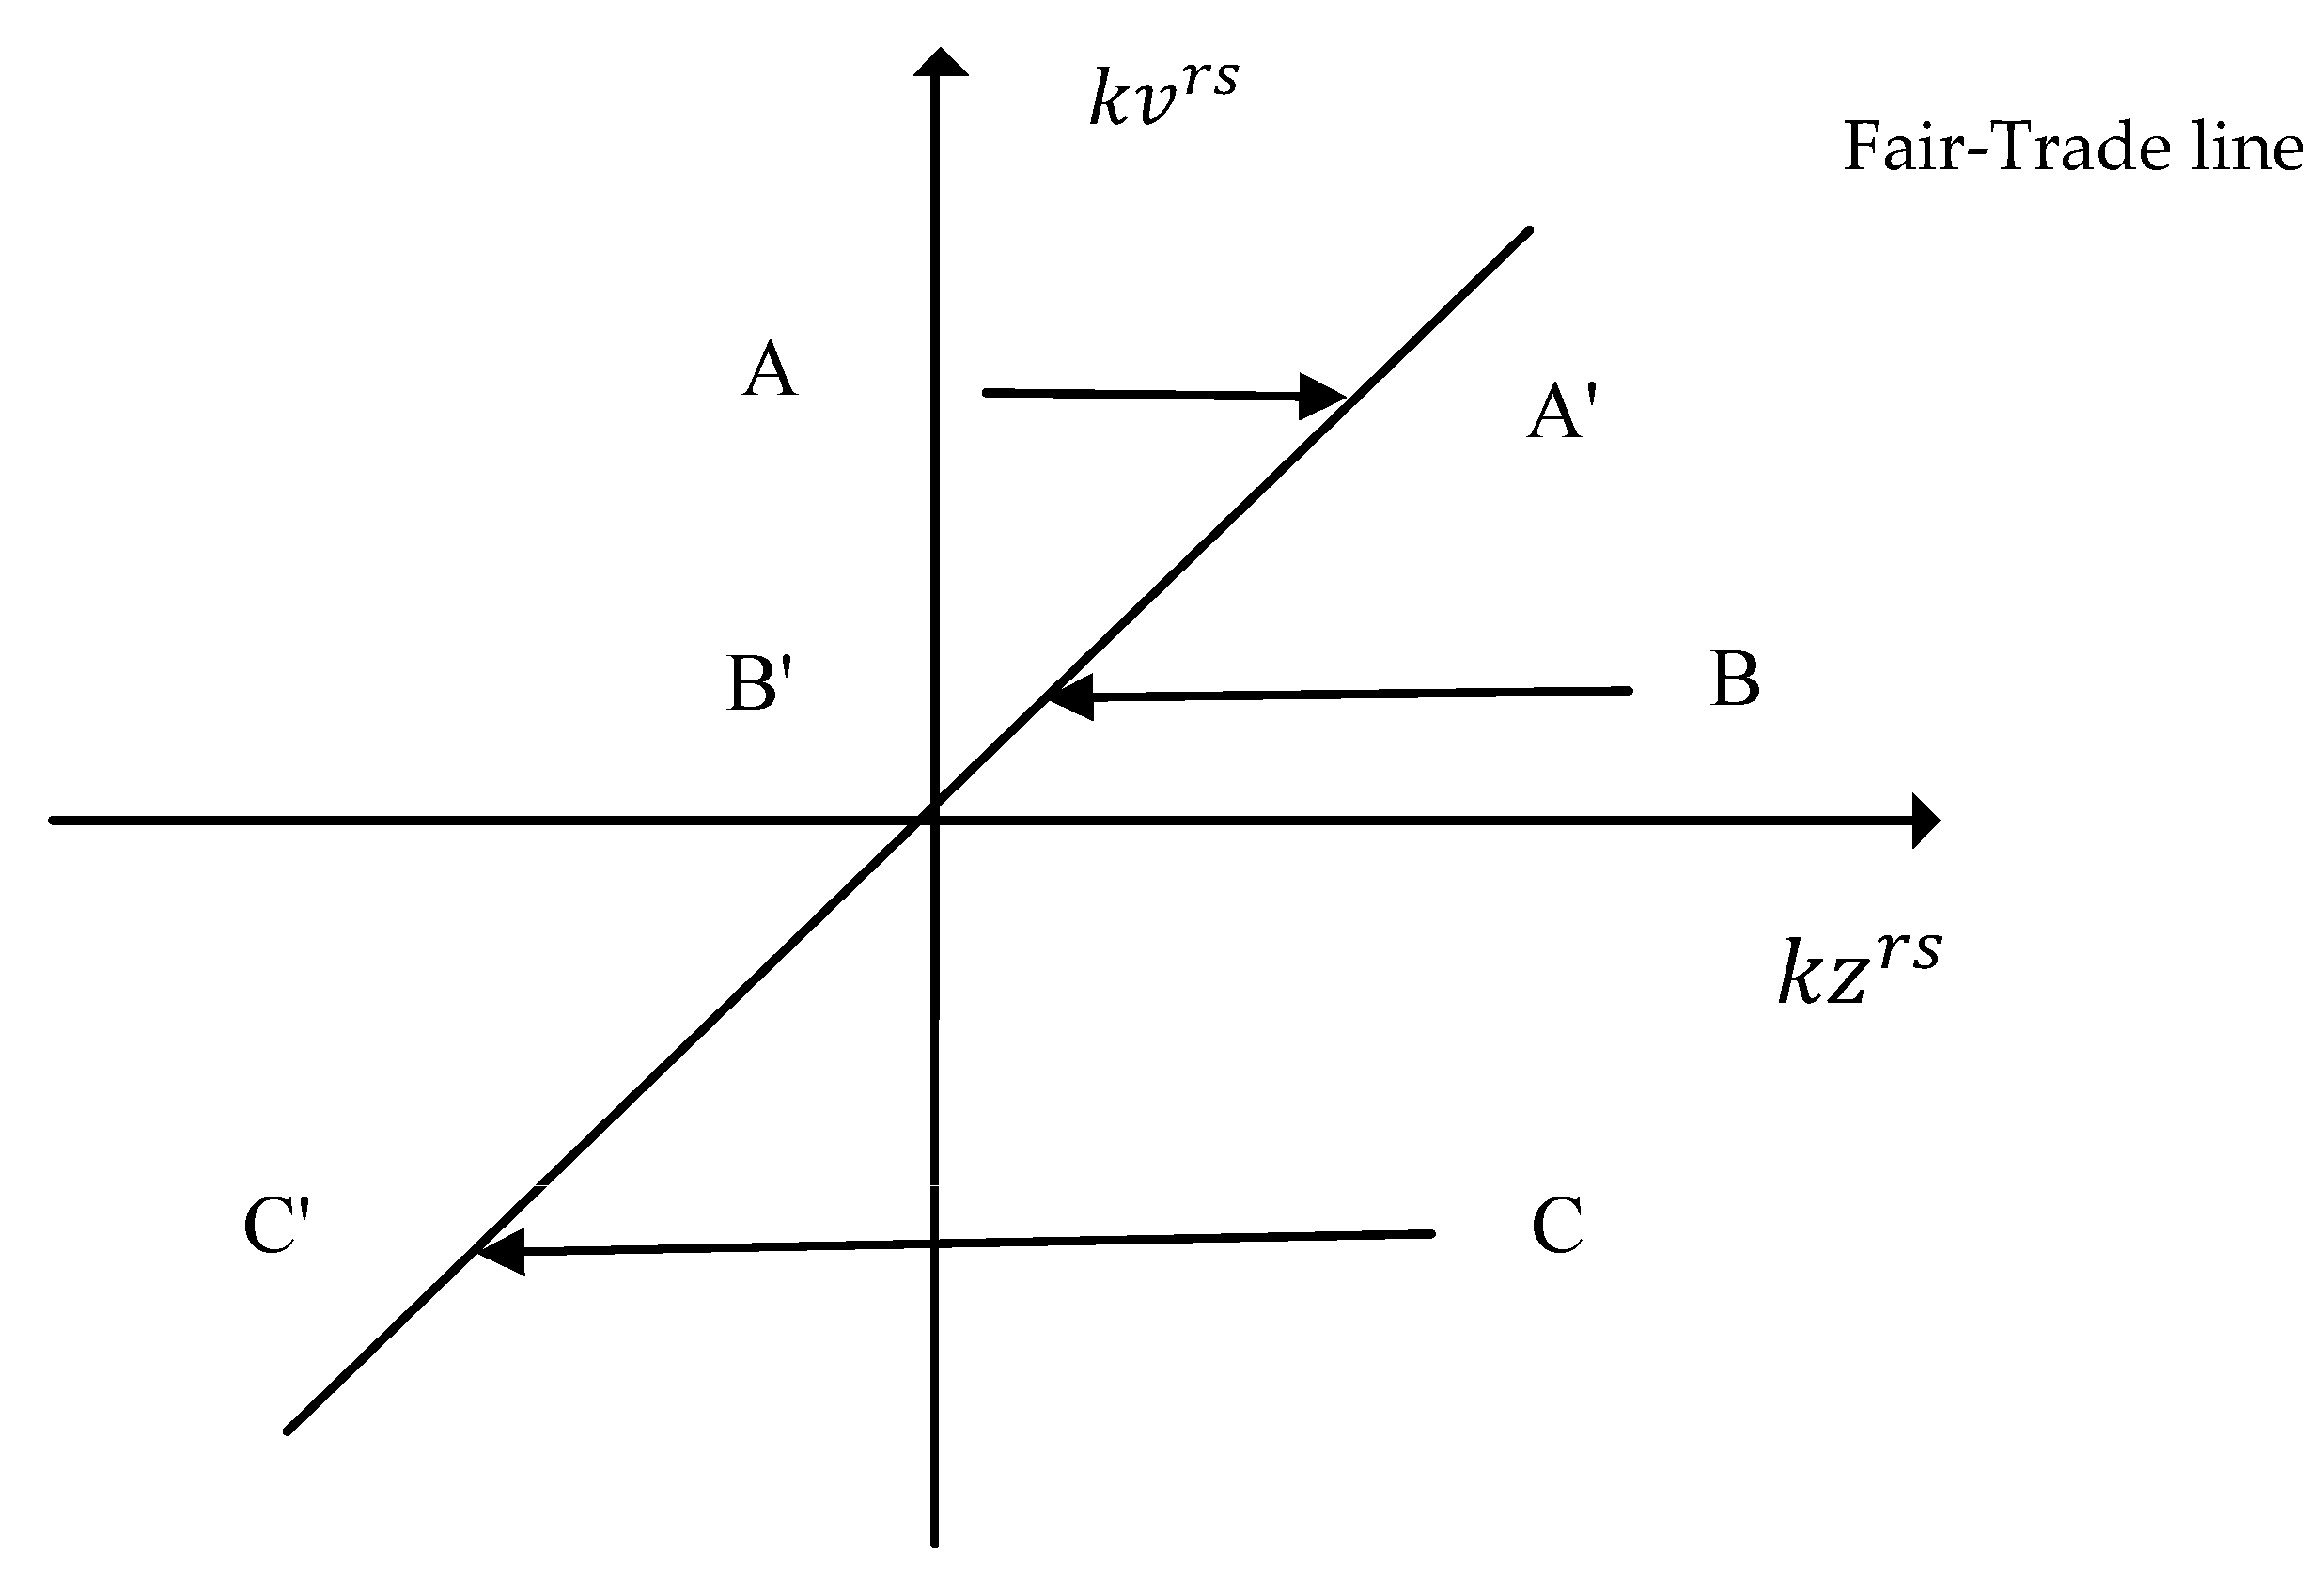
TiVA estimates the value added in the production of goods and services for trade. Net TiVA transfer equals export minus import—if the result is positive then the province profits; if negative, the province loses. The relations between VWT and TiVA transfer, as shown in Figure 2, mainly fall into two categories: same direction and opposite direction. On such basis, suppose province r has positive net VWT and either positive or negative net TiVA transfer, then three relations can be formed—AA′, BB′ and CC′—as shown in Figure 3.
In general, suppose the straight line cutting through the origin in Figure 3 is the fair-trade line, and the dots on it stand for the national mean of the relation between VWT and TiVA transfer. Namely, the net TiVA export (import) from unit net virtual water export (import) is up to the national mean. So, TiVA transfer caused by unit net VWT—slope of the fair trade line, is:
β = r = 1 m s = 1 , r s m k v r s r = 1 m s = 1 , r s m k z r s
where β represents the slope of the fair trade line for TiVA-VWT and β 0 ; k v r s represents the absolute value of TiVA transfer from province r to province s ; k z r s represents the absolute value of VWT from province r to province s ; r = 1 m s = 1 , r s m k v r s / 2 stands for the sum of net TiVA transfer of all provinces/cities in China; and r = 1 m s = 1 , r s m k z r s / 2 stands for the sum of net VWT of all provinces/cities in China.
This paper hypothesized k z r > 0 so that the dots only show up to the right of the Y-axis in Figure 3, namely Quadrant I. The dots A, B, and C away from the fair trade line are counterparts of A′, B′, and C′ on the line, and segments AA′, BB′, and CC′ refer to the net VWT to be added or subtracted for the dots to reach the line. Furthermore, DP, deflection distance, represents the deviation degree from the fair trade line:
D P = k v r s β k z r s k v r s β = 1 β k z r s k v r s ,   k v r s β > k z r s > 0 , 0 D P < 1 k z r s k v r s β k z r s = 1 k v r s β k z r s ,   0 < k v r s β < k z r s , 0 D P < 1 k z r s k v r s β k z r s = 1 k v r s β k z r s , k v r s β < 0 , D P > 1
where if the TiVA transfer and VWT are in Quadrant I, DP is 0 , 1 ; if in Quadrant IV, DP is 1 , ; the higher DP is, the further away the dot is from the fair trade line; if DP = 0, the dot is on the line, standing for equality.
On such basis, this paper constructed the exponential function y = e x to build the VWI within 0 , 1 as follows:
V W I = e D P = e 1 β k z r s k v r s ,   k v r s β k z r s ,   D o t   a b o v e   f a i r t r a d e   l i n e e 1 k v r s β k z r s ,   k v r s β k z r s ,   D o t   b e l o w   f a i r t r a d e   l i n e
The closer VWI gets to 1, the more equal it is; the closer VWI gets to 0, the more unequal it is. In conclusion, the inequality between VWT and TiVA transfer is obtained and integrated into the initial water rights allocation model to make the model more equal and reasonable.

2.1.3. Coupling of Physical and Virtual Water

Regional VWT

Based on water use coefficient, the provincial VWT was then converted into the riparian level—VWT of the riparian area of each province:
K Z b r = τ K Z r
where τ is the conversion percentage and K Z b r is the net VWT of basin r .

Model Integrated with Virtual Water

Higher VWI means higher influence from VWT. As a result, once the physical water transfer, VWT, and VWI are made clear, a model of water rights allocation in a transboundary river included with virtual water is constructed below:
C r = C r + k z b r × 1 n V W I r r = 1 n V W I r
where C r is the amount of water allocation for region r with virtual water included.

2.2. Data Collection

2.2.1. Study Area

Taihu Lake Basin covers Jiangus Province, Zhejiang Province, Anhui Province, and Shanghai City. Additionally, the Taihu Lake Basin lies in the central area of the Yangtze River Delta region, bordered by the Yangtze River to the north, the East China Sea to the east, the Qiantang River to the south, and Tianmu and Maoshan Mountain to the west. It covers a water surface area of 2338 square kilometers, with an average water depth of 1.89 m and a maximum of 2.60 m. Its annual average water level and annual average water storage capacity are 3.21 m and 4.956 billion m3 [63]. Water areas and administrative boundaries within the Taihu Lake Basin are shown in Figure 4.
Additionally, Taihu Lake is situated in the subtropical zone with a mild and humid monsoon climate and interacts with more than 50 major inflowing and outflowing rivers. Figure 5 depicts the main water inflow and outflow in the Taihu Lake in 2021 [63].
In addition, in order to better manage the Taihu Lake Basin, China established the Taihu Lake Basin Authority, which oversees multiple administrative regions. It monitors the Taihu Lake Basin areas across three provinces and one city. Since the surface water is main water source for Taihu Lake, with an average annual supply 33.78 billion m3 (groundwater sources and other sources supply 0.023 billion m3 and 0.526 billion m3, respectively) [63]. Therefore, the Authority mainly considers the surface water of these regions in its assessment indicators to ensure that the total amount of surface water used is within acceptable limits.
In 2021, the total population of the Taihu Lake Basin was 68.11 million, accounting for 4.8% of China’s total population. The regional gross domestic product (GDP) was 11.2736 trillion yuan, accounting for 9.9% of the national GDP. The per capita GDP was 165,000 yuan, double the national average [63]. As of 2021, the annual water resource consumption along the Basin reached 34.23 billion m3, while it only supplied 28.99 billion m3 of water, leading to a huge supply–demand gap [63]. The specific water consumption of the three provinces and one city is shown in Table 2.
We know that the Basin is under tremendous pressure of worsening water scarcity, water pollution, and carrying capacity. Therefore, to facilitate cross-regional ecological compensation and water rights trading in the Taihu Lake Basin, it is imperative to establish an initial allocation of water rights based on the allocation plans from various provinces and regions. A well-designed water rights allocation plan is essential for promoting the development of the water rights market and ensuring its sustainability [8].
Meanwhile, the four regions constitute integral parts of the Regional Integrated Development Plan for Yangtze River Delta and contribute to many VWT and transactions, which produces an invisible effect on the actual virtual water amount. Therefore, this paper incorporated VWI and VWT into the initial water rights allocation scheme of the Taihu Lake Basin.

2.2.2. Data Sources

This paper chose data on virtual water in 2017—the latest public data on virtual water from Carbon Emission Accounts & Datasets (CEADs) [64]. The CEADs’ input–output intermediate use table covers the input and output scenarios of various industries, and these industries can be classified as manufacturing, agriculture, and services. Therefore, this paper mainly combined specific industries of agriculture, manufacturing, and services for VWT calculation.
Data on physical water of Taihu Lake Basin from the communiques on water of the four regions and the Taihu Basin Authority in 2017 as well as the China Statistic Yearbook (2017) [63,65,66,67,68].

3. Result

3.1. Physical Water Allocation

3.1.1. Characteristic Value of Indicators

The characteristic values of indicators in Table 1 were attained based on relevant datasets, as detailed in Table 3.

3.1.2. Normalization

Next, the characteristic values above were normalized using Equations (2) and (3) to formulate the following matrix:
X = 0.00 1.00 0.24 0.50 0.31 1.00 0.00 0.11 0.00 0.60 0.26 1.00 0.00 1.00 0.87 0.29 0.00 1.00 0.62 0.26 0.00 1.00 0.62 0.26 0.00 1.00 0.62 0.26 0.00 0.28 0.68 1.00 0.00 0.37 0.77 1.00 0.79 1.00 0.46 0.00 0.00 0.90 1.0 1.00 0.00 0.10 0.10 1.00 0.16 0.00 1.00 0.11 1.00 0.19 0.56 0.00 1.00 0.00 0.593 0.00 1.00 0.35 0.28 0.00 0.08 0.24 0.00 1.00 0.00 1.00 1.00 0.50 1.00 0.00 0.00 0.00

3.1.3. Indicator Weight

Then, AHP was utilized to make clear of the indicator weights, as detailed in Table 4.

3.1.4. Physical Water Allocation

The quantity and ratio of physical water allocation are calculated using Equations (6)–(10). Specifically, Anhui accounts for the least quantity (1.683 billion m3) and ratio (5.51%) in the Taihu Lake Basin, whereas Jiangsu ranks the first, taking up 14.491 billion m3 of physical water, followed by Zhejiang of 9.018 billion m3 and then Shanghai of 6.318 billion m3 (17.43%). Details are shown in Table 5.

3.2. VWT among Regions in Taihu Lake Basin

3.2.1. Provincial VWT Calculation

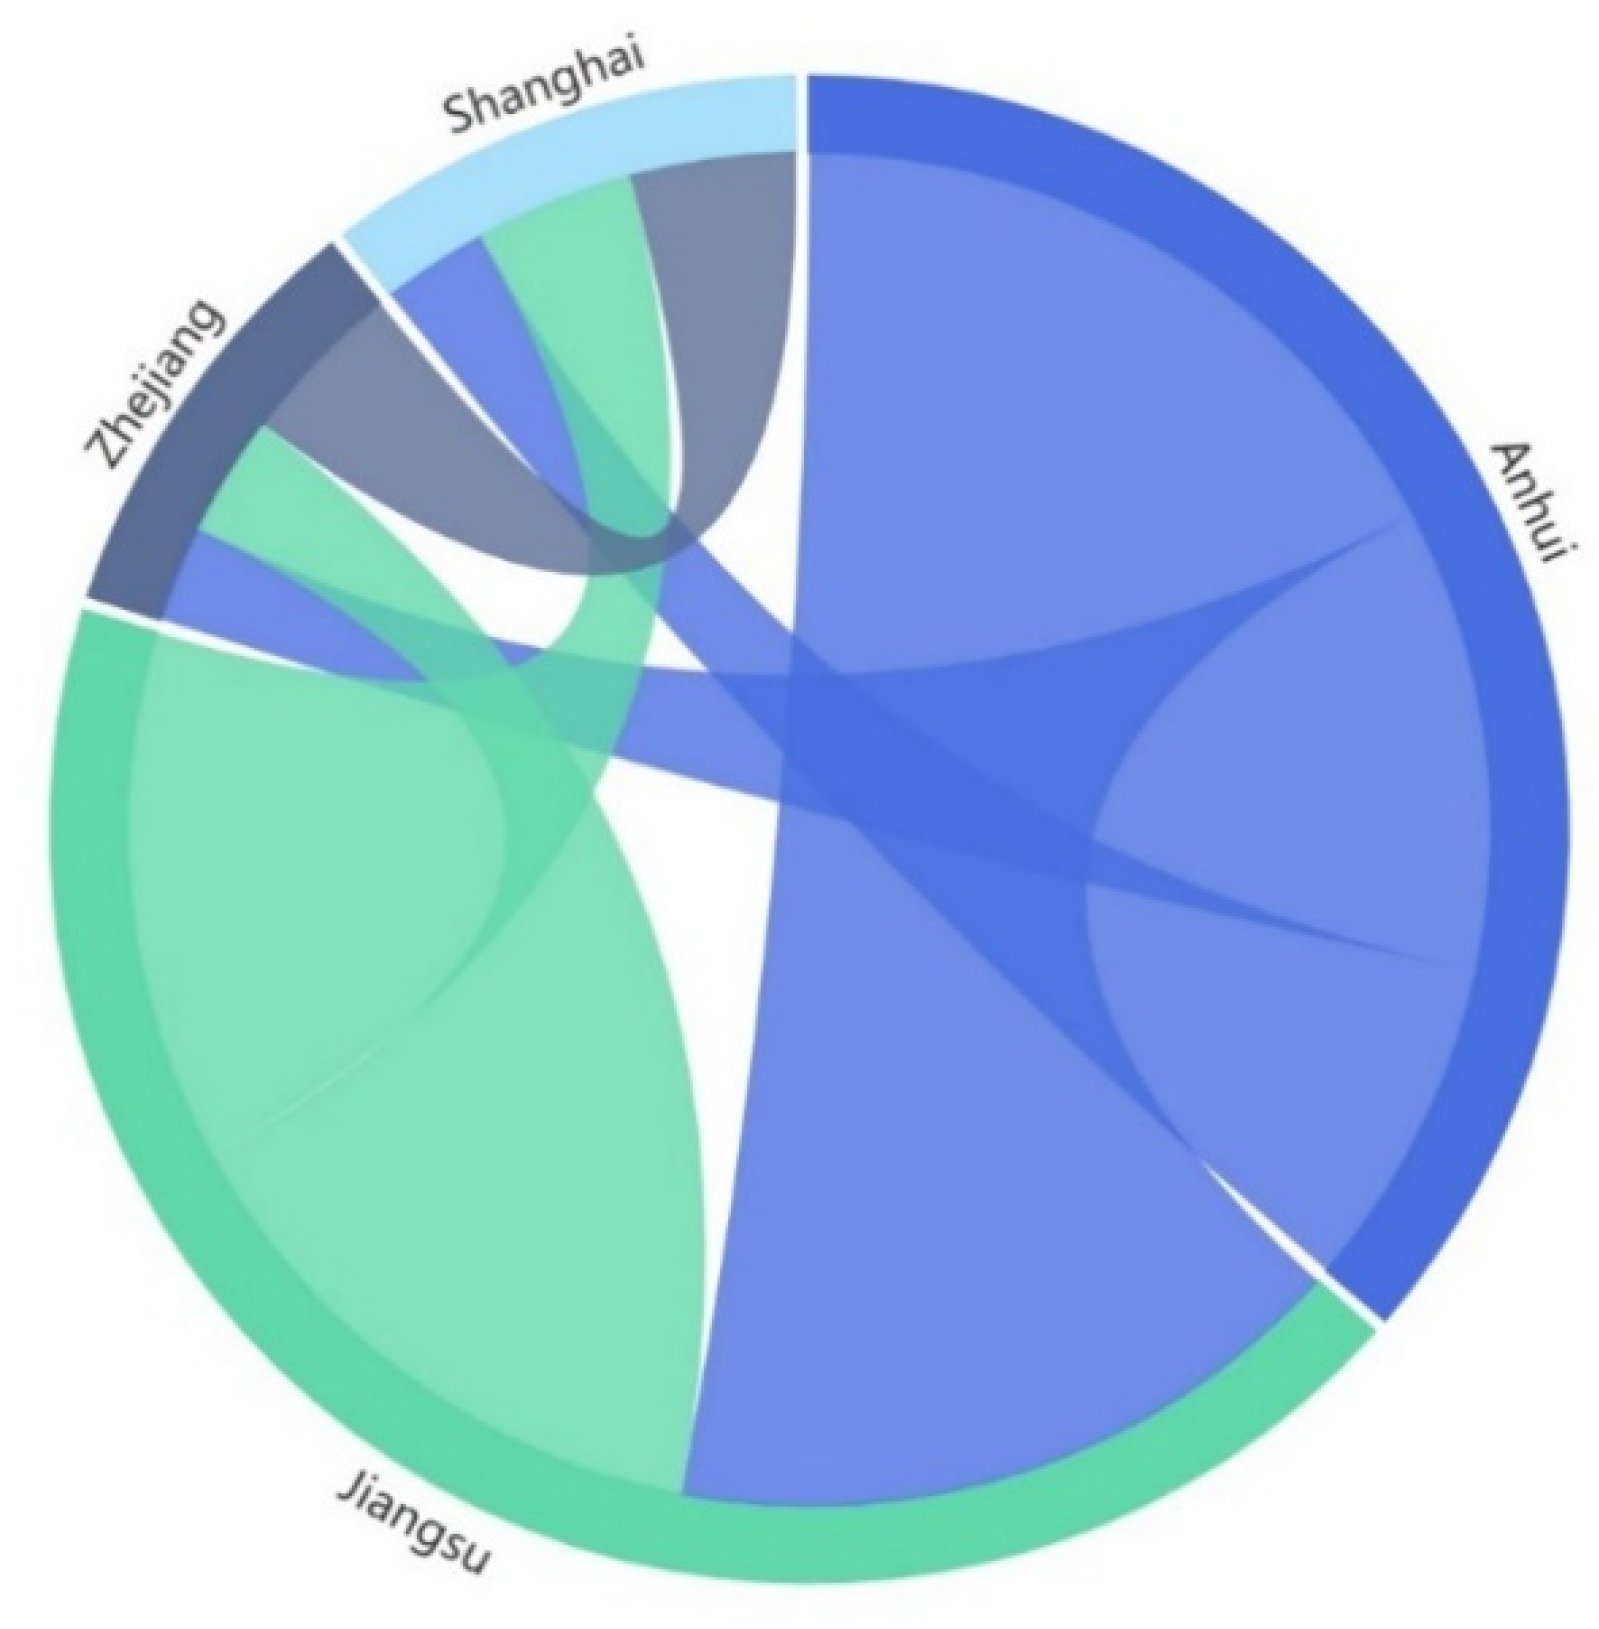
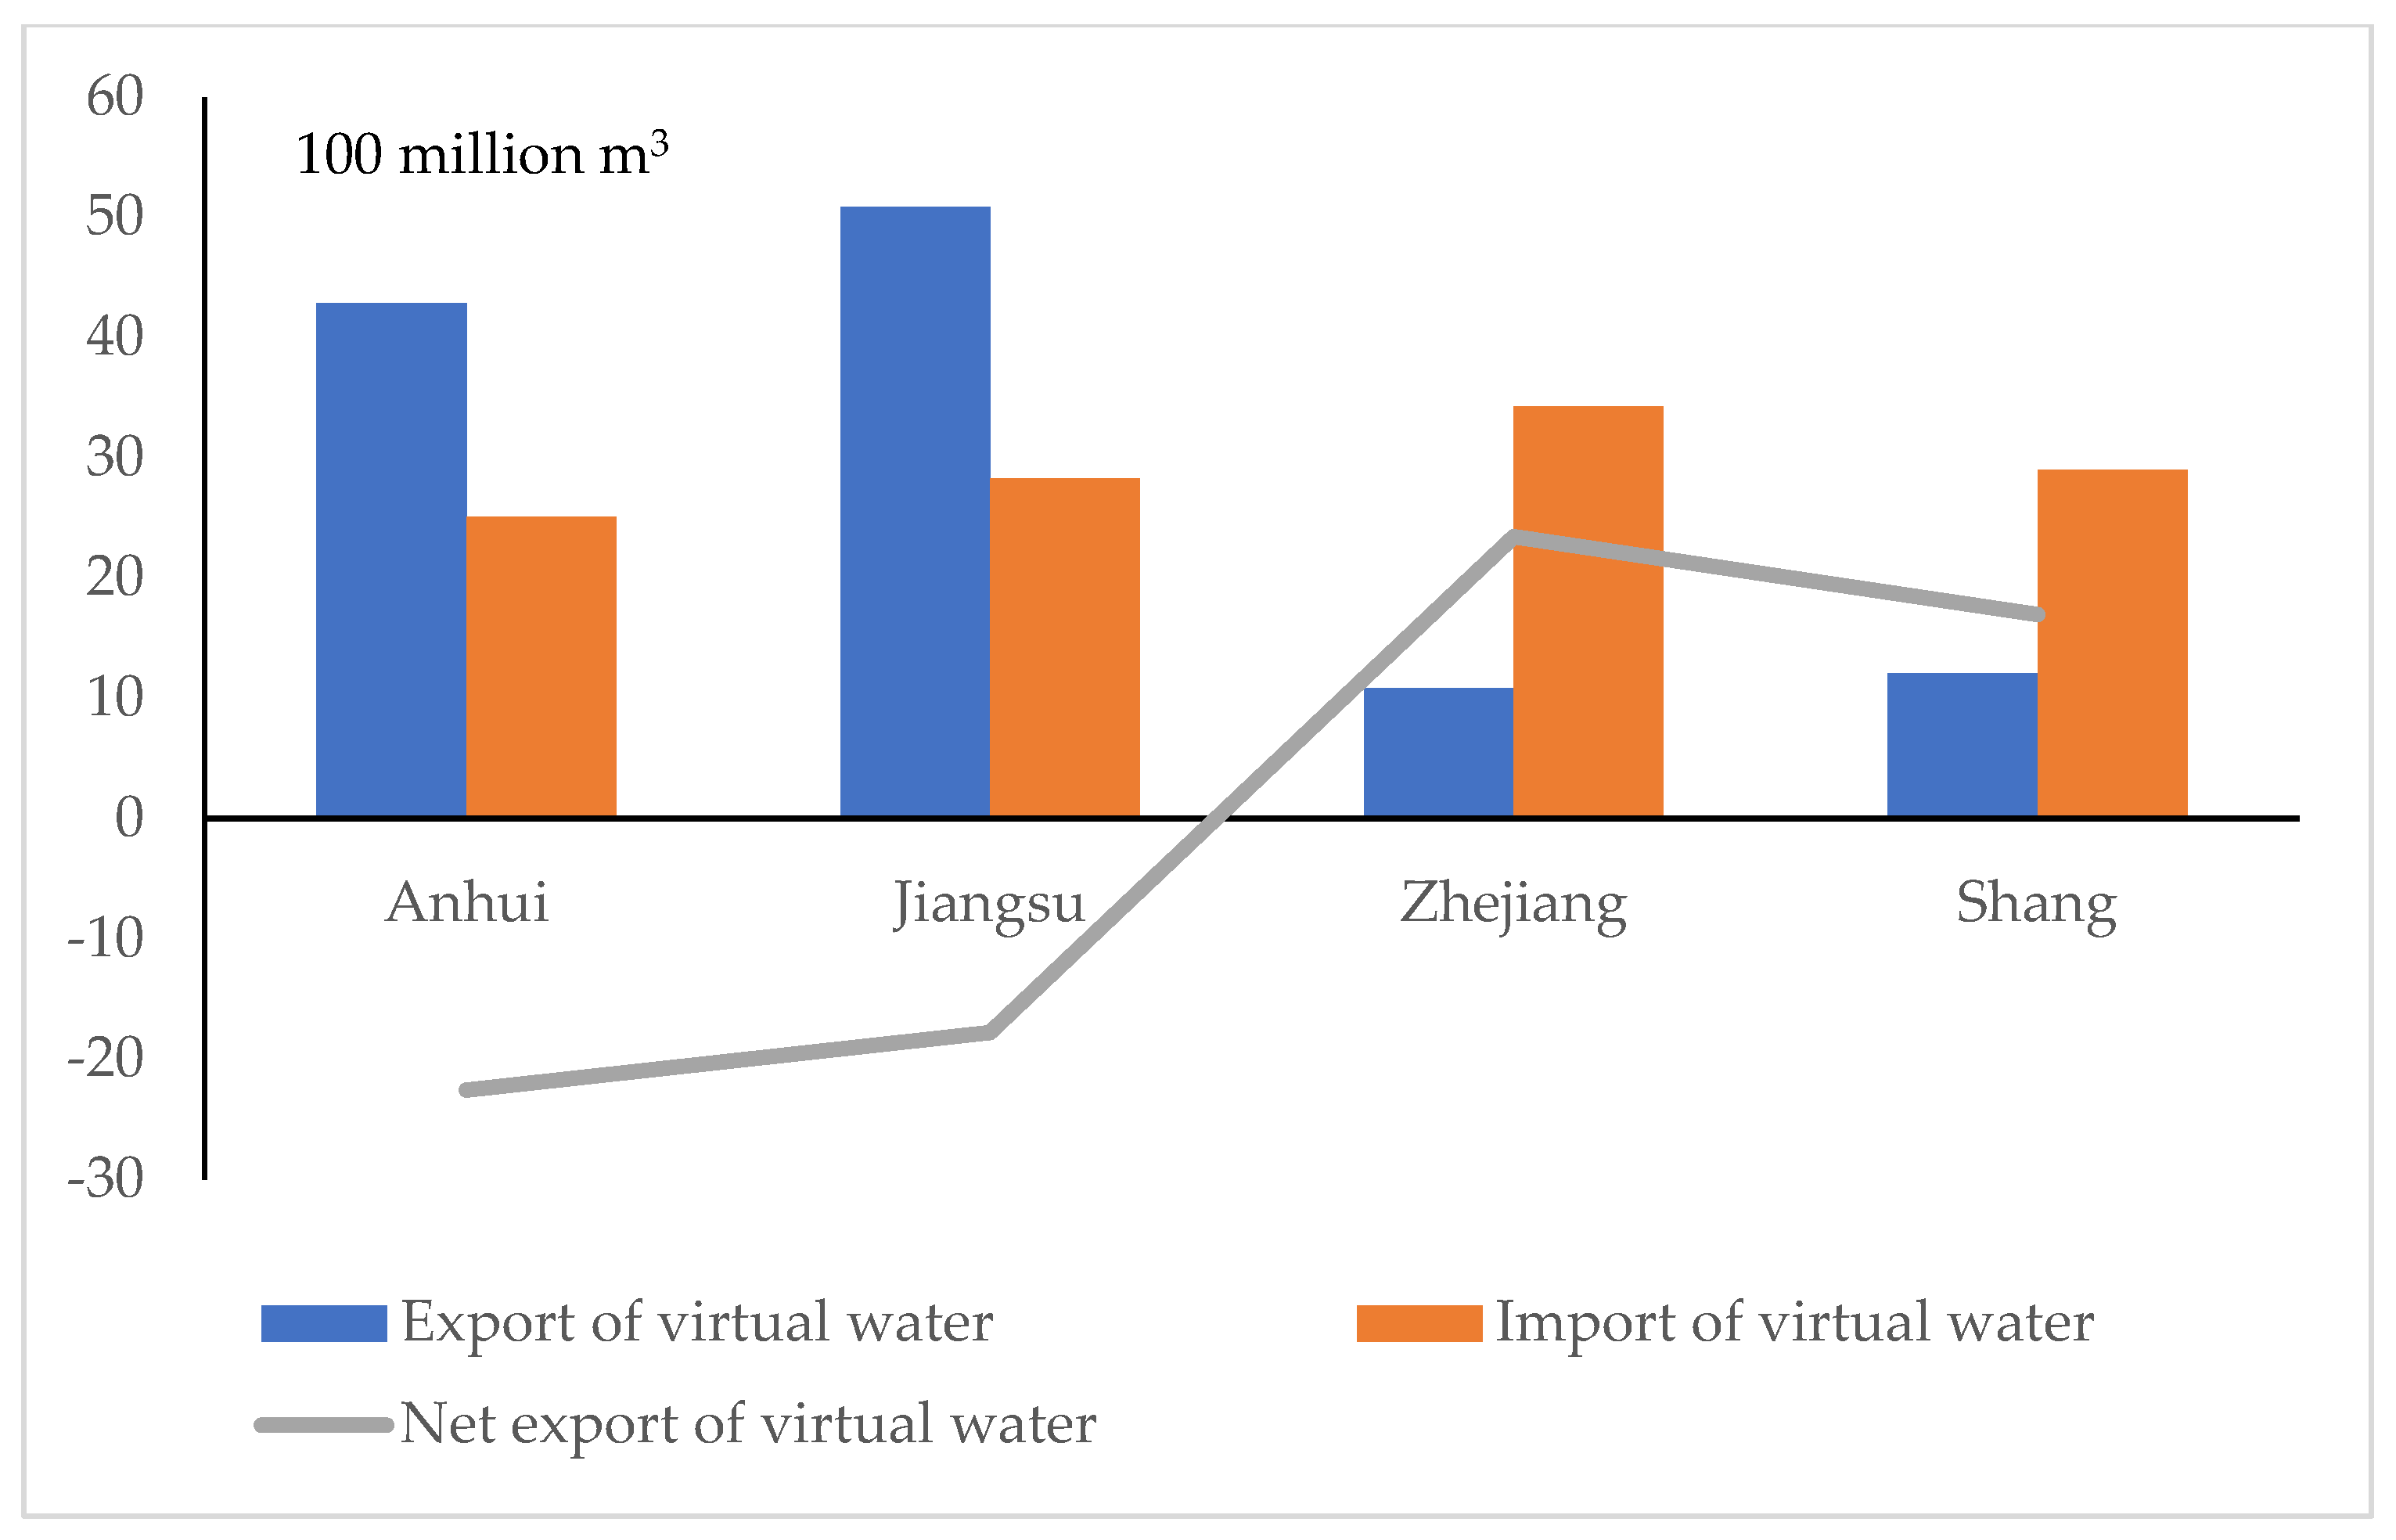
The import, export, and net import of virtual water among regions in Taihu Lake Basin are calculated using Equations (10)–(12), as detailed in Figure 6 and Figure 7.
In accordance with Figure 4 and Figure 5, Anhui exports the most virtual water, 4.285 billion m3; Anhui and Jiangsu are the top net exporters −2.259 billion m3 and −1.78 billion m3, respectively—and they share a similar mutual VWT. Zhejiang, on the other hand, imports the most virtual water, 3.424 billion m3, while Anhui the least, 2.505 billion m3. Zhejiang and Shanghai are net importers 2.344 billion m3 and 1.695 billion m3, respectively.

3.2.2. VWI

VWI of the four regions was measured using their TiVA and VWT. Anhui has the lowest VWI 0.4401, indicating that it suffers the highest inequality between TiVA and VWT, while Zhejiang has the highest VWI 0.7012, indicating that VWT and TiVA in Zhejiang are in the most equal relation (Table 6).

3.3. The Water Allocation Coupling Physical and Virtual Water Resources

Equations (19) and (20) lead to the result of water rights allocation considering both VWT and VWI, as detailed in Table 7.
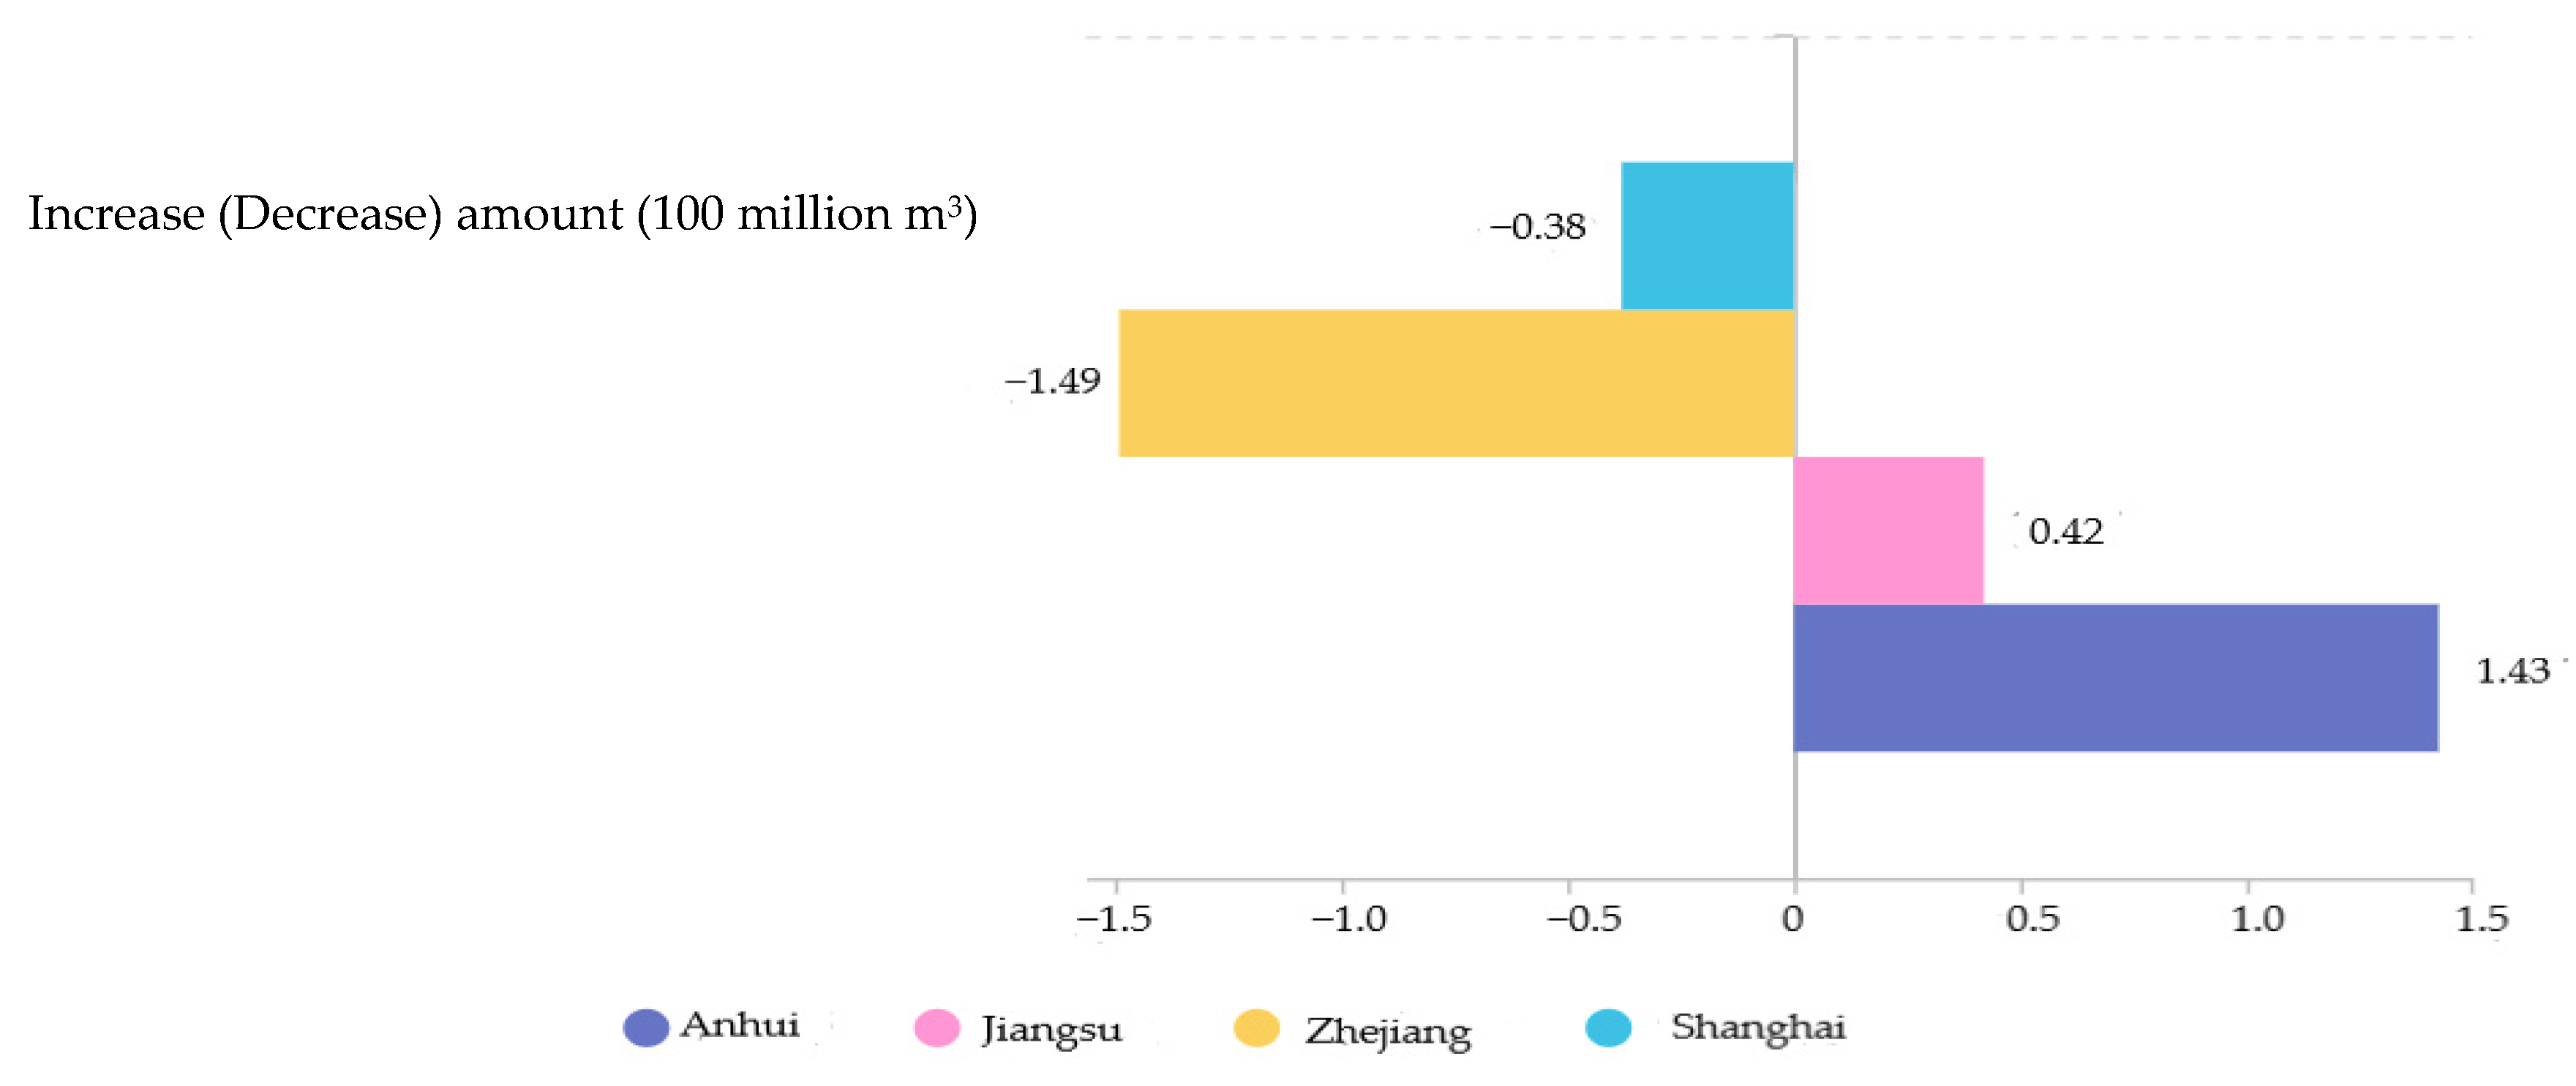
In detail, in terms of absolute quantity, Jiangsu still enjoys the most allocated water—14.533 billion m3, accounting for 45.58%—followed by Zhejiang—8.869 billion m3 and 28.15%. Anhui suffers the highest inequality and exports the most virtual water, so it witnesses the largest growth in water allocation, increasing by 1.683 billion m3 to 1.827 billion m3, whereas Shanghai drops to 6.28 billion m3. Moreover, Zhejiang, even though boasting the most equal VWT, declines by 149 million m3 of allocated water, even more than that of Shanghai, because it exports the most virtual water.

4. Discussion

4.1. Physical Water Allocation

To sum up, the allocation results in this paper are fundamentally in line with the findings of other scholars, except Anhui. Anhui Province was not considered in previous studies for its little-to-no share of the basin area. As for the allocation quantity of other regions, Jiangsu has the most allocated water, followed by Zhejiang and Shanghai; as for allocation ratio, Jiangsu declines by 6.44% while Zhejiang and Shanghai grow by 5.30% and 6.65%, respectively, in comparison with previous studies. When it comes to total ratio, however, Jiangsu still takes the largest proportion, 47.50%, while Shanghai takes the least, 17.43%, as shown in Table 8. The results above are basically in line with the actual conditions—Jiangsu takes the largest share of cities in the Basin and needs the most water; Anhui, on the other hand, only takes 0.6% of the basin area so it needs the least water, which also accords with the principle of status quo.
Comparing with Table 8, it is found that the absolute amount of water allocation and the allocation ratio in this paper is in line with that of previous studies. This can explain that the results of the physical water allocation in this paper are applicable and consistent with reality (Jiangsu has the largest water area, followed by Zhejiang, Shanghai, and Anhui). The difference is that previous studies ignored the Anhui. This is unfair to Anhui province, especially in the context of China’s strict water resources management and control over water withdrawals in various regions. Therefore, we included the Anhui region in the allocation process. Additionally, this is one main contribution of this paper in terms of physical water allocation.

4.2. VWT

As for VWT of the four regions, Anhui exports the most virtual water (see Table 7 and Figure 7); as for VWI, Anhui trades a relatively large number of VWT for little economic benefit, indicating that Anhui accommodates many water-consuming yet few high-tech and water-saving industries, and thus is in greater need of economic structure reshaping. Meanwhile, Jiangsu, in comparison with Zhejiang and Shanghai, is also a net exporter, with its inequality ranking second (see Table 6 and Figure 7), mainly because Jiangsu also houses many water-consuming industries, especially in northern Jiangsu. As a result, Anhui and Jiangsu need to be allocated more water rights. On the other hand, Zhejiang and Shanghai are net importers—2.344 billion m3 and 1.695 billion m3, respectively. Hence, the two regions need to relinquish some water rights to Jiangsu and Anhui.
Additionally, the increased (decreased) amount in water rights allocation of the four regions experience certain changes after the inclusion of virtual water and VWI, as detailed in Figure 8. It illustrates the significant impact of virtual water on physical water and proves the necessity of including virtual water in physical water rights allocation. At the same time, after including the effect of virtual water, Anhui suffers the most loss in trade with the other regions and thus has the largest compensation, as Figure 8 suggests. It conforms to China’s Regional Integrated Development Plan for Yangtze River Delta.
According to Table 5 and Table 7, and Figure 8, we can see that the change quantity of allocation of the three provinces and one city is not significant before and after virtual water transfer. Although the Anhui, Jiangsu, Zhejiang, and Shanghai changes in volume are close to 100 million m3, especially Anhui and Zhejiang, the changes exceeded 100 million m3. In the case of abundant water, 100 million m3 is a small proportion of Taihu Lake. However, in the case of water scarcity, it becomes extremely important. For example, in 2022, a severe drought occurred in the Yangtze River Basin, and water resource was scarce in each region; 100 million m3 of water could provide water for one million people for one year. Therefore, 100 million m3 of water becomes extremely precious.
Additionally, as strict water resource management and total water consumption control policies are implemented in China, the water consumption in Anhui, Zhejiang, and Shanghai have been included in the assessment. Failure to pass the assessment results in punishment. Therefore, even slight fluctuations in water consumption alert local governments.
Thirdly, the data in this paper are based on 2018. With the implementation of the Yangtze River Integration Strategy, the trade between these four regions will become closer. The VWT may increase, and the impact of virtual water would also become greater. This is also a topic that will be studied in the future to dynamically track the impact of virtual water.
Finally, the data in this paper are based on riparian VWT. If only the impact of provincial VWT was considered, the impact would be greater than it is now.
So, the transfer of interprovincial virtual water has an invisible impact on the absolute amount of water resources in the regions surrounding Taihu Lake. Therefore, virtual water should be incorporated into the allocation of physical water resources.
To conclude, virtual water yields a considerable invisible effect on physical water. If a region produces higher net export (net import) of virtual water with higher inequality, it suffers a higher imbalance between economy and environment, and it needs more compensation. Thus, virtual water must be included in ecological compensation as well as water rights allocation of transboundary rivers.

5. Conclusions

Increased transactions lead to higher interregional VWT, which further yields a higher impact on regional water resources. However, the role of virtual water is not considered in current studies on water rights allocation of transboundary rivers. On such basis, this paper ran a case study on Taihu Lake Basin to make clear the physical water rights of the four regions—Jiangsu, Zhejiang, Anhui, and Shanghai—along the Basin, then built a model on VWI. After that, the water use coefficient was employed to convert the provincial VWT into riparian VWT. Last, VWT and VWI were included in the model of physical water rights allocation, to form up a comprehensive allocation scheme for the Basin.
(1)
Jiangsu enjoys the most allocated water, followed by Zhejiang, Shanghai, and then Anhui.
(2)
Anhui and Jiangsu are net exporters of virtual water (Anhui > Jiangsu), whereas Zhejiang and Shanghai are net importers (Zhejiang > Shanghai).
(3)
Anhui suffers the highest inequality, while Zhejiang boasts the most equal environment where economic benefit and environment are most matched.
(4)
VWT and VWI exert an impact on the water rights allocation of the four regions. Anhui in particular experiences the largest growth in allocated water rights due to the dual effects from VWT and VWI.
(5)
Anhui and Jiangsu are net exporters of virtual water, indicating that the two regions need economic structure reshaping more urgently.

Author Contributions

X.X.: Writing; J.Y.: Providing case and idea; Q.Y.: Providing revised advice. Additionally, the contributions of J.Y. and Q.Y. are the same, so both are recognized as corresponding authors. All authors have read and agreed to the published version of the manuscript.

Funding

This paper was supported by the National Natural Science Foundation of China, Yuan J, grant number 42271301; Anhui University Excellent Research and Innovation Project, Yuan J, grant number 2022AH010094; Anhui Provincial Education Department Humanities Key Fund, Xu X, grant number SK2021A0652; and Tongling College Talent Fund, Xu X, grant number 2021tlxyr15. Besides, the APC was funded by Wanjiang scholarship, Yuan J.

Data Availability Statement

The relevant data can be found in this article.

Acknowledgments

The Ministry of Education of Humanities and Social Science Project (no. 21YJCZH206).

Conflicts of Interest

The authors declare no conflict of interest.

Appendix A

Table A1. Multi regional input–output table.
OutputIntermediate UseFinal DemandTotal Output
Basin Province 1Basin Province (n)Basin Province
(n + 1)
Basin Province 1Basin
Province n
Other Province (n + 1)
Input Industry
1
Industry
m
Industry
1
Industry
m
Industry
1
Industry
m
Intermediate useBasin province
1
Industry
1
y 11 11 y 1 m 11 y 11 1 n y 1 m 1 n y 11 1 ( n + 1 ) y 1 m 1 ( n + 1 ) f 1 11 f 1 1 n f 1 1 ( n + 1 ) y 1 1
Industry
m
y m 1 11 y m m 11 y m 1 1 n y m m 1 n y m 1 1 ( n + 1 ) y m m 1 ( n + 1 ) f m 11 f m 1 n f m 1 ( n + 1 ) y m 1
Basin province nIndustry
1
y 11 n 1 y 1 m n 1 y 11 n n y 1 m n n y 11 n ( n + 1 ) y 1 m n ( n + 1 ) f 1 n 1 f 1 n n f 1 1 ( n + 1 ) y 1 n
Industry
m
y m 1 n 1 y m m n 1 y m 1 n n y m m n n y m 1 n ( n + 1 ) y m m n ( n + 1 ) f m n 1 f m n n f m 1 ( n + 1 ) y m n
Other province (n + 1)Industry
1
y 11 ( n + 1 ) 1 y 1 m n + 1 1 y 11 n ( n + 1 ) y 1 m ( n + 1 ) ( n + 1 ) f 1 ( n + 1 ) 1 f 1 n n + 1 f 1 ( n + 1 ) ( n + 1 ) y 1 ( n + 1 )
Industry
m
y m 1 ( n + 1 ) 1 y m m ( n + 1 ) 1 y m 1 ( n + 1 ) ( n + 1 ) y m m ( n + 1 ) ( n + 1 ) f m ( n + 1 ) 1 f m ( n + 1 ) n f m ( n + 1 ) ( n + 1 ) y m n + 1
Added value v 1 1 v m 1 v 1 n + 1 v m n + 1
Total input y 1 1 y m 1 y 1 n + 1 y m n + 1
Direct water input w n r

References

  1. Zuo, Q.T.; Zhang, Z.Z.; Ma, J.X. The relationship between the utilization level of water resources in the Yellow River Basin and economic and social development China Population. Resour. Environ. 2021, 31, 10. [Google Scholar]
  2. Straffin, P.D.; Heaney, J.P. Game theory and the tennessee valley authority. Int. J. Game Theory 1981, 10, 35–43. [Google Scholar] [CrossRef]
  3. Connell, D.; Grafton, R.Q. Water reform in the Murray-Darling Basin. Water Resour. Res. 2011, 47, 1–9. [Google Scholar] [CrossRef] [Green Version]
  4. Genova, P.; Wei, Y. A socio-hydrological model for assessing water resource allocation and water environmental regulations in the Maipo River basin. J. Hydrol. 2023, 617, 129159. [Google Scholar] [CrossRef]
  5. Hu, J.L.; Ge, Y.X. The allocation mode and coordination mechanism of water resources in the Yellow River—Also on the construction and management of the Yellow River water rights market. Manag. World 2004, 8, 43–60. [Google Scholar]
  6. Feng, J. Optimal allocation of regional water resources based on multi-objective dynamic equilibrium strategy. Appl. Math. Model. 2021, 90, 1183–1203. [Google Scholar] [CrossRef]
  7. Wu, D.; Liu, M.G. Research progress on initial water rights allocation methods in river basins. People’s Pearl River 2022, 43, 7. [Google Scholar]
  8. Ge, M.; Wu, F.P.; You, M. Initial provincial water rights dynamic projection pursuit allocation based on the most stringent water resources management: A case study of Taihu Basin, China. Water 2017, 9, 35. [Google Scholar] [CrossRef] [Green Version]
  9. Wu, D.; Wu, F.P.; Chen, Y.P. A Double Layer Optimization Model for the Composite System of Initial Water Rights Allocation in a Basin. Syst. Eng. Theory Pract. 2012, 32, 196–202. [Google Scholar]
  10. Van Campenhout, B.; D’Exelle, B.; Lecoutere, E. Equity–efficiency optimizing resource allocation: The role of time preferences in a repeated irrigation game. Oxf. Bull. Econ. Stat. 2015, 77, 234–253. [Google Scholar] [CrossRef] [Green Version]
  11. Wang, L.; Fang, L.; Hipel, K.W. Basin-wide cooperative water resources allocation. Eur. J. Oper. Res. 2008, 190, 798–817. [Google Scholar] [CrossRef]
  12. Zhang, W.; Wang, Y.; Peng, H.; Li, Y.; Tang, J.; Wu, K.B. A coupled water quantity–quality model for water allocation analysis. Water Resour. Manag. 2010, 24, 485–511. [Google Scholar] [CrossRef]
  13. Read, L.; Madani, K.; Inanloo, B. Optimality versus stability in water resource allocation. J. Environ. Manag. 2014, 133, 343–354. [Google Scholar] [CrossRef]
  14. Zeng, X.T.; Li, Y.P.; Huang, G.H.; Liu, J. Modeling of water resources allocation and water quality management for supporting regional sustainability under uncertainty in an arid region. Water Resour. Manag. 2017, 31, 3699–3721. [Google Scholar] [CrossRef]
  15. Wu, D.; Wang, Y.H. A Multilayer Hierarchical Decision Model for Initial Water Rights Allocation in Watersheds under Dual Control Action. China Popul. Resour. Environ. 2017, 27, 10. [Google Scholar]
  16. Milly, P.C.D.; Betancourt, J.; Falkenmark, M.; Hirsch, R.M.; Kundzewicz, Z.W.; Lettenmaier, D.P.; Stouffer, R.J. Stationarity is dead: Whither water management? Science 2008, 319, 573–574. [Google Scholar] [CrossRef]
  17. Null, S.E.; Prudencio, L. Climate change effects on water allocations with season dependent water rights. Sci. Total Environ. 2016, 571, 943–954. [Google Scholar] [CrossRef] [Green Version]
  18. Dau, Q.V.; Momblanch, A.; Adeloye, A.J. Adaptation by himalayan water resource system under a sustainable socioeconomic pathway in a high-emission context. J. Hydrol. Eng. 2021, 26, 50–55. [Google Scholar] [CrossRef]
  19. Zhang, L.N.; Wu, F.P. A study on the coupling configuration model of quantity and quality of initial water rights in provinces and regions based on GSR theory. Resour. Sci. 2017, 39, 12. [Google Scholar]
  20. Wang, H.M.; Yu, R.; Niu, W.J. Design of Water Quantity Coordination Scheme for Cross boundary Water Resources Conflict in the Zhanghe River Basin Based on Strong Reciprocity. Theory Syst. Eng. Theory Pract. 2014, 34, 2170–2178. [Google Scholar]
  21. Lou, S.; Wang, H.M.; Niu, W.J.; Xu, Y. Research on group decision-making of water resource allocation based on interval intuitionistic fuzzy sets. Resour. Environ. Yangtze River Basin 2014, 23, 9. [Google Scholar]
  22. Xevi, E.; Khan, S. A multi-objective optimisation approach to water management. J. Environ. Manag. 2005, 77, 269–277. [Google Scholar] [CrossRef] [PubMed]
  23. Hong, S.; Xia, J.; Chen, J.; Wan, L.; Ning, L.; Shi, W. Multi-object approach and its application to adaptive water management under climate change. J. Geogr. Sci. 2017, 27, 259–274. [Google Scholar] [CrossRef]
  24. Dadmand, F.; Naji-Azimi, Z.; Farimani, N.M.; Davary, K. Sustainable allocation of water resources in water-scarcity conditions using robust fuzzy stochastic programming. J. Clean. Prod. 2020, 276, 123812. [Google Scholar] [CrossRef]
  25. Allan, J.A. Virtual water: A strategic resource global solutions to regional deficits. Ground Water 1998, 36, 545–546. [Google Scholar] [CrossRef]
  26. Ye, Q.; Li, Y.; Zhuo, L.; Zhang, W.; Xiong, W.; Wang, C.; Wang, P. Optimal allocation of physical water resources integrated with virtual water trade in water scarce regions: A case study for Beijing, China. Water Res. 2018, 129, 264–276. [Google Scholar] [CrossRef]
  27. Duarte, R.; Pinilla, V.; Serrano, A. The water footprint of the Spanish agricultural sector: 1860–2010. Ecol. Econ. 2014, 108, 200–207. [Google Scholar] [CrossRef]
  28. Brindha, K. International virtual water flows from agricultural and livestock products of India. J. Clean. Prod. 2017, 161, 922–930. [Google Scholar] [CrossRef]
  29. Hoekstra, A.Y.; Mekonnen, M.M. Imported water risk: The case of the UK. Environ. Res. Lett. 2016, 11, 055002. [Google Scholar] [CrossRef]
  30. Wang, R.; Zimmerman, J. Hybrid analysis of blue water consumption and water scarcity implications at the global, national, and basin levels in an increasingly globalized world. Environ. Sci. Technol. 2016, 50, 5143–5153. [Google Scholar] [CrossRef]
  31. Weinzettel, J.; Pfister, S. International trade of global scarce water use in agriculture: Modeling on watershed level with monthly resolution. Ecol. Econ. 2019, 159, 301–311. [Google Scholar] [CrossRef]
  32. Zhao, X.; Liu, J.; Liu, Q.; Tillotson, M.R.; Guan, D.; Hubacek, K. Physical and virtual water transfers for regional water stress alleviation in China. Proc. Natl. Acad. Sci. USA 2015, 112, 1031–1035. [Google Scholar] [CrossRef] [PubMed] [Green Version]
  33. Zhao, Y.; He, G.; Wang, J.; Gao, X.; Li, H.; Zhu, Y.; Jiang, S. Water stress assessment integrated with virtual water trade and physical transfer water: A case study of Beijing, China. Sci. Total Environ. 2020, 708, 431–478. [Google Scholar] [CrossRef] [PubMed]
  34. Zhao, H.; Qu, S.; Guo, S.; Zhao, H.; Liang, S.; Xu, M. Virtual water scarcity risk to global trade under climate change. J. Clean. Prod. 2019, 230, 1013–1026. [Google Scholar] [CrossRef]
  35. Xu, C.X.; Ma, C.; Tian, G.L.; Xie, W. Research on the Mechanism and Contribution Share of Virtual Water Trade on Regional Economy. China Soft Sci. 2011, 12, 110–119. [Google Scholar]
  36. Islam, M.S.; Oki, T.; Kanae, S.; Hanasaki, N.; Agata, Y.; Yoshimura, K. A grid-based assessment of global water scarcity including virtual water trading. Water Resour. Manag. 2007, 21, 19–37. [Google Scholar] [CrossRef]
  37. Brindha, K. National water saving through import of agriculture and livestock products: A case study from India. Sustain. Prod. Consum. 2019, 18, 63–71. [Google Scholar] [CrossRef]
  38. Yu, C.; Yue, D.M.; Gong, M.D.; Wang, L.; Cheng, B. Log water footprint accounting and spatial flow pattern of countries along the “the Belt and Road”. For. Econ. 2021, 42, 16–27. [Google Scholar]
  39. Angelis, E.; Metulini, R.; Bove, V.; Riccaboni, M. Virtual water trade and bilateral conflicts. Adv. Water Resour. 2017, 110, 549–561. [Google Scholar] [CrossRef] [Green Version]
  40. Tian, G.L.; Wang, X.W. A study on the virtual water flow relationship between China and countries along the Mekong River driven by agricultural trade. J. North China Univ. Water Resour. Hydropower 2018, 39, 16–23. [Google Scholar]
  41. Wu, P.; Gao, X.R.; Zhao, X.N.; Wang, Y.B.; Sun, S.K. Basic framework of “two-dimensional and three-dimensional” coupled flow theory of solid water virtual water. J. Agric. Eng. 2016, 32, 1–10. [Google Scholar]
  42. Heil, M.T.; Wodon, Q.T. Inequality in CO2 emissions between poor and rich countries. J. Environ. Dev. 1997, 6, 426–452. [Google Scholar] [CrossRef]
  43. Yang, T.; Liu, W. Inequality of household carbon emissions and its influencing factors: Case study of urban China. Habitat Int. 2017, 70, 61–71. [Google Scholar] [CrossRef]
  44. Hedenus, F.; Azar, C. Estimates of trends in global income and resource inequalities. Ecol. Econ. 2006, 55, 351–364. [Google Scholar] [CrossRef]
  45. Padilla, E.; Serrano, A. Inequality in CO2 emissions across countries and its relationship with income inequality: A distributive approach-science direct. Energy Policy 2006, 34, 1762–1772. [Google Scholar] [CrossRef] [Green Version]
  46. Wang, D.; Nie, R.; Wang, S.Z. Measurement and Decomposition of Regional Inequality in Carbon Dioxide Emissions in China: From the Perspective of Interpersonal Equity. Sci. Res. 2012, 30, 1662–1670. [Google Scholar]
  47. Shang, H.Y. Comparison of methods for measuring the unfairness of virtual water consumption. Rural. Water Resour. Hydropower China 2011, 5, 1–5. [Google Scholar]
  48. Wang, H.H.; Liu, H.C.; He, X.J.; Zeng, W. Research on Carbon Emission Fairness from the Perspective of Historical Accumulated Carbon Emissions. China Popul. Resour. Environ. 2016, 26, 22–25. [Google Scholar]
  49. Sun, H.; Liu, Y.Y. Analysis of Interregional Carbon Emission Differences and Profit and Loss Deviation in China. Manag. Rev. 2016, 28, 89–96. [Google Scholar]
  50. Yan, M.; Sun, H.A. Study on the Implied Carbon Transfer and Profit and Loss Deviation in Domestic Trade: Based on the Perspective of Economic Internal Circulation. Technol. Econ. Manag. Res. 2021, 12, 12–16. [Google Scholar]
  51. Zhang, W.; Liu, Y.; Feng, K.; Hubacek, K.; Wang, J.; Liu, M.-M.; Jiang, L.; Jiang, H.; Liu, N.; Zhang, P.; et al. Revealing environmental inequality hidden in China’s inter-regional trade. Environ. Sci. Technol. 2018, 52, 7171–7181. [Google Scholar] [CrossRef]
  52. Leontief, W. Environmental repercussions and the economic structure: An input-output approach. Rev. Econ. Stat. 1970, 52, 262–271. [Google Scholar] [CrossRef]
  53. Chapagain, A.K.; Hoekstra, A.Y. Virtual Water Flows between Nations in Relation to Trade in Livestock and Livestock Products; UNESCO-IHE: Delft, The Netherlands, 2003. [Google Scholar]
  54. Antonelli, M.; Roson, R.; Sartori, M. Systemic input-output computation of green and blue virtual water ‘flows’ with an illustration for the Mediterranean region. Water Resour. Manag. 2012, 26, 4133–4146. [Google Scholar] [CrossRef]
  55. Deng, G.; Lu, F.; Wu, L.; Xu, C. Social network analysis of virtual water trade among major countries in the world. Sci. Total Environ. 2021, 753, 142043. [Google Scholar] [CrossRef]
  56. Zhu, Q.R.; Yang, L.; Liu, X. Research on water footprint of China’s export trade and trade structure optimization. Quant. Econ. Technol. Econ. Res. 2016, 12, 42–60. [Google Scholar]
  57. Dietzenbacher, E.; Velazquez, E. Analysing Andalusian virtual water trade in an Input-Output Framework. Reg. Stud. 2007, 41, 185–196. [Google Scholar] [CrossRef] [Green Version]
  58. Lutter, S.; Pfister, S.; Giljum, S.; Wieland, H.; Mutel, C. Spatially explicit assessment of water embodied in European trade: A product-level multi-regional input-output analysis. Glob. Environ. Chang. 2016, 38, 171–182. [Google Scholar] [CrossRef] [Green Version]
  59. Chen, Z.M.; Chen, G.Q. Virtual water accounting for the globalized world economy: National water footprint and international virtual water trade. Ecol. Indic. 2013, 28, 142–149. [Google Scholar] [CrossRef]
  60. Xu, X.; Wu, F.; Yu, Q.; Chen, X.; Zhao, Y. Invisible Effect of Virtual Water Transfer on Water Quantity Conflict in Transboundary Rivers—Taking Ili River as a Case. Int. J. Environ. Res. Public Health 2022, 19, 8917. [Google Scholar] [CrossRef]
  61. Xu, X.; Wu, F.; Yu, Q.; Chen, X.; Zhao, Y. Analysis on Management Policies on Water Quantity Conflict in Transboundary Rivers Embedded with Virtual Water—Using Ili River as the Case. Sustainability 2022, 14, 9406. [Google Scholar] [CrossRef]
  62. Bureau of Taihu Lake Basin. Available online: http://www.tba.gov.cn/slbthlyglj/sj/sj.html (accessed on 10 April 2023).
  63. Carbon Emission Accounts & Datasets. Available online: https://www.ceads.net/user/login.php?lang=cn (accessed on 10 March 2023).
  64. China Statistical Yearbook. Available online: http://www.stats.gov.cn/sj/ndsj/2017/indexch.htm (accessed on 10 April 2023).
  65. Anhui Provincial Department of Water Resources. Available online: http://slt.ah.gov.cn/tsdw/swj/szyshjjcypj/119406621.html (accessed on 10 March 2023).
  66. Jiangsu Provincial Department of Water Resources. Available online: http://jssslt.jiangsu.gov.cn/art/2018/7/31/art_84437_10430538.html (accessed on 10 March 2023).
  67. Zhejiang Provincial Department of Water Resources. Available online: http://slt.zj.gov.cn/col/col1229243017/index.html (accessed on 10 March 2023).
  68. Shanghai Municipal Water Affairs Bureau. Available online: http://swj.sh.gov.cn/szy/20200910/138eca2189d24dfda9e6f2b40a24797a.html (accessed on 10 March 2023).
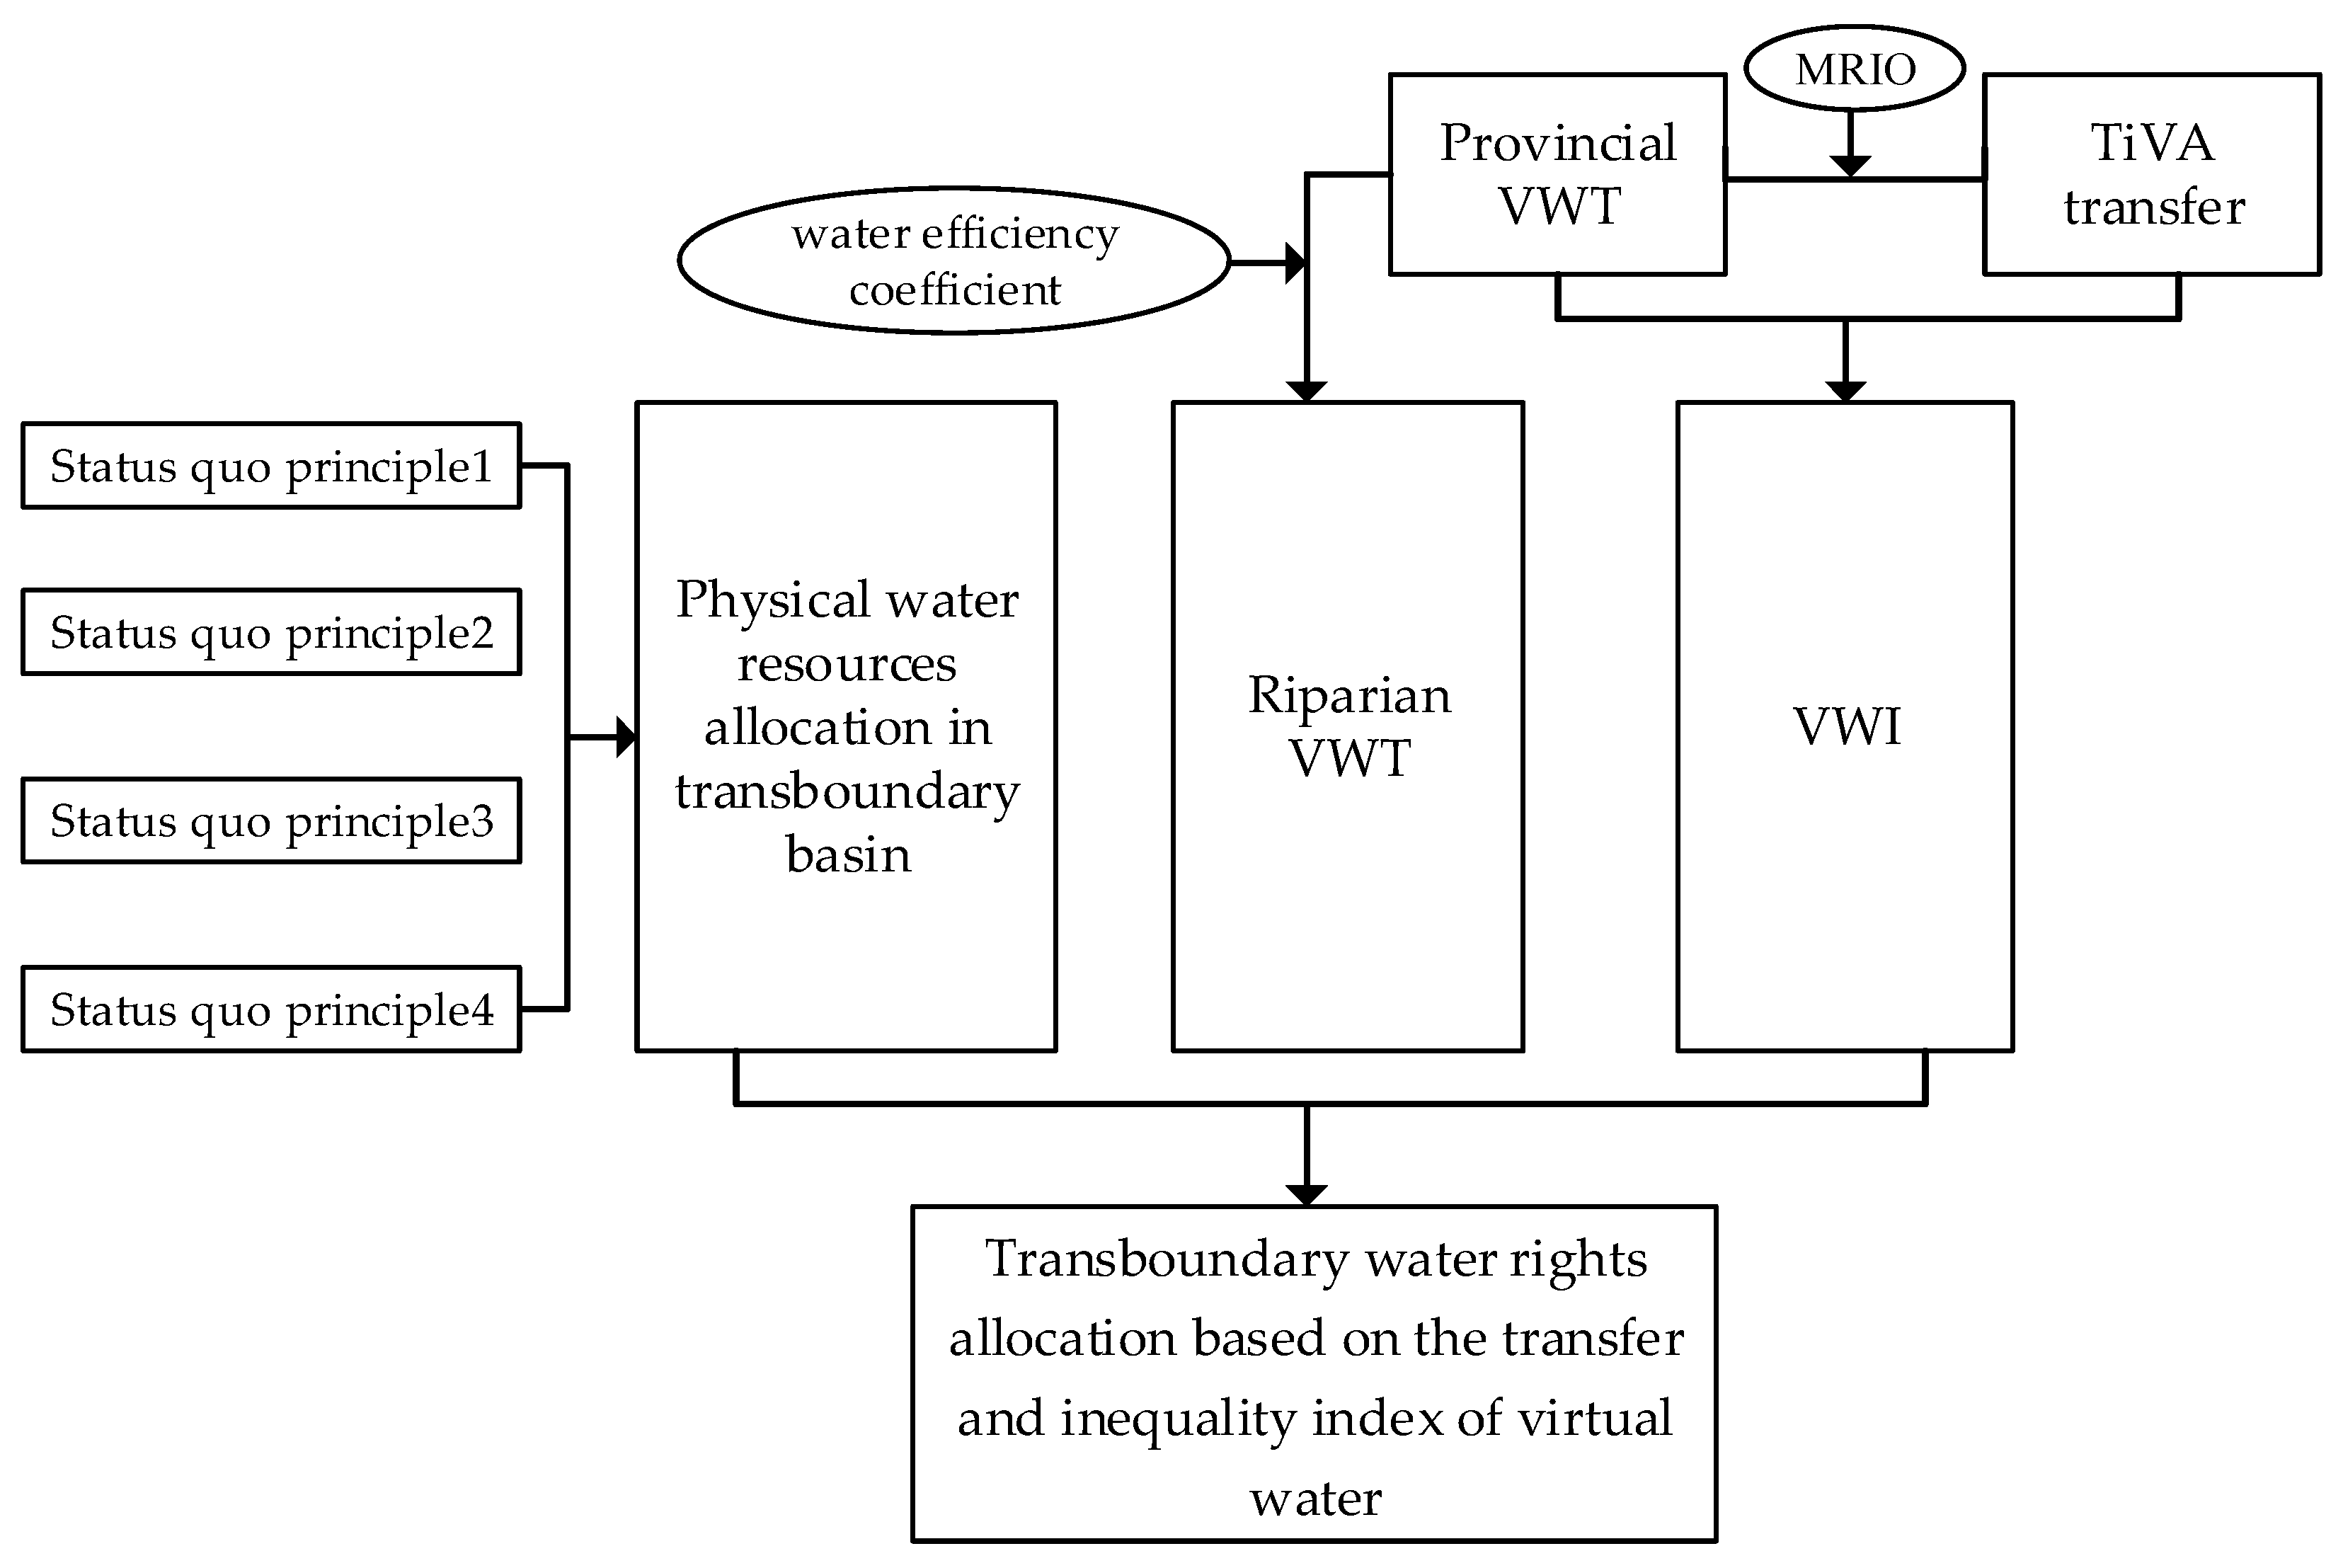
Figure 1. Research framework.
Water 15 02379 g001
Figure 2. Relations between VWT and net TiVA transfer.
Water 15 02379 g002
Figure 3. VWI.
Figure 3. VWI.
Water 15 02379 g003
Figure 4. Map of Water Areas and Administrative Boundaries in the Taihu Lake Basin.
Water 15 02379 g004
Figure 5. Water inflow and outflow quantity in the Taihu Lake in 2021 (100 million m3).
Water 15 02379 g005
Figure 6. VWT of Taihu Lake Basin (100 million m3).
Water 15 02379 g006
Figure 7. VWT within Taihu Lake Basin (100 million m3).
Water 15 02379 g007
Figure 8. Increased (decreased) amount in water rights allocation of Taihu Lake Basin before and after embedded virtual water.
Water 15 02379 g008
Table 1. Index system of physical water rights allocation.
SchemePrincipleIndicatorUnitsSymbolAttribute
Physical water rights allocation scheme AStatus quo B1Current water useBillion m3P11Benefit-based
Water use per capita m3/personP12Benefit-based
Water use per farmland unit m3/muP13Benefit-based
Current water supply scale 10,000 m3P14Benefit-based
Equity B2Annual average runoff volume Billion m3P21Benefit-based
Population 10,000 peopleP22Benefit-based
Effective Irrigated aream3P23Benefit-based
Efficiency B3GDP per capita10,000 yuanP31Benefit-based
Industrial output per capita 10,000 yuanP32Benefit-based
Agricultural output per capita 10,000 yuanP33Benefit-based
Water consumption per
10,000 yuan GDP
m3P34Cost-based
Water consumption per
10,000 yuan agricultural output
m3P35Cost-based
Water consumption per
10,000 yuan industrial output
m3P36Cost-based
Sustainability B4Economic growth rate%P41Benefit-based
Greening rate %P42Benefit-based
Population growth rate%P43Benefit-based
Proportion of waste water meeting discharge standards%P44Benefit-based
Macro regulation B5Priority of regional development pointsP51Benefit-based
Protection of vulnerable groups pointsP52Benefit-based
Table 2. The specific water consumption of the three provinces and one city (billion m3).
Water UseDomestic
Water
Industrial WaterTotal Water Consumption
Region
Anhui0.0020.0160.018
Jiangsu1.5918.2720.02
Zhejiang0.773.434.32
Shanghai1.378.429.87
Table 3. Indicator characteristic value of physical water allocation.
IndicatorAnhui N1Jiangsu N2Zhejiang N3Shanghai N4
P110.2419547.198.2
P12503802370418
P13331446381524
P141.394.682.628.4
P210.1210.686.662.84
P2236.353186.511987.02848.12
P2311.751030.43642.55274.26
P312.87.0213.618.6
P321.914.817.979.82
P330.370.450.240.06
P34214523533
P351.850.0110.010.0052
P3672822175
P418.57.27.86.9
P420.0820.0280.060.028
P4358.0339.8437.830
P4458.360.457.270.53
P516887
P527666
Table 4. Indicator weight.
Bi P i ω i
AB1P110.1472
P120.0503
P130.0503
P140.0172
B2P210.0983
P220.1967
P230.1967
B3P310.0272
P320.0272
P330.0272
P340.0136
P350.0272
P360.0136
B4P410.0363
P420.0140
P430.0140
P440.0054
B5P510.0251
P520.0125
Table 5. Result of physical water allocation in Taihu Lake Basin.
Region Distance   to   Positive - Ideal   Solution   d k + Distance   to   Negative - Ideal   Solution   d k Relative   Proximity   D k φ k
Ratio   φ k
Quantity (Billion m3)
Anhui0.86590.09920.10285.51%1.683
Jiangsu0.10700.82330.885047.50%14.491
Zhejiang0.28100.34440.550729.56%9.018
Shanghai0.47670.22930.324817.43%6.318
Table 6. VWI of the four regions.
Region V W I V W I r = 1 n V W I 1 n V W I r = 1 n V W I
Anhui0.44010.19570.0543
Jiangsu0.50760.22570.0243
Zhejiang0.70120.3118−0.0618
Shanghai0.59990.2668−0.0168
Table 7. Water rights allocation of Taihu Lake Basin with virtual water included.
Region Net   VWT   ( K Z r )
(Billion m3)
τ Ratio   φ k Quantity (Billion m3)
Anhui2.2591.175.73%1.827
Jiangsu1.7800.9645.58%14.533
Zhejiang−2.3441.03 28.15%8.869
Shanghai−1.6951.3419.93%6.280
Table 8. Physical water rights allocation of Taihu Lake Basin.
RegionAnhuiJiangsuZhejiangShanghaiUnits
Allocation Amount
Amount in this paper16.83144.9190.1853.18100 million m3
Amount in previous studies0147.33125.0786.39100 million m3
Proportion in this paper5.5247.5029.5617.43%
Proportion in previous studies041.0634.8624.08%
Disclaimer/Publisher’s Note: The statements, opinions and data contained in all publications are solely those of the individual author(s) and contributor(s) and not of MDPI and/or the editor(s). MDPI and/or the editor(s) disclaim responsibility for any injury to people or property resulting from any ideas, methods, instructions or products referred to in the content.