Article

Groundwater–Surface Water Exchange and Spatial Distribution of Arsenic in Arid and Semi-Arid Regions: The Case of Aksu River in Xinjiang, Northwestern China

1
School of Resources and Geosciences, China University of Mining and Technology, Xuzhou 221008, China
2
School of Geology and Mining Engineering, Xinjiang University, Urumqi 830046, China
3
SINOPEC Northwest Company of China Petroleum and Chemical Corporation, Urumqi 830011, China
*
Author to whom correspondence should be addressed.
Water 2023, 15(13), 2391; https://doi.org/10.3390/w15132391
Submission received: 13 June 2023 / Revised: 25 June 2023 / Accepted: 27 June 2023 / Published: 28 June 2023
(This article belongs to the Special Issue Groundwater Quality and Human Health Risk)

Abstract

:
The Aksu River, a quintessential inland river, exhibits elevated arsenic (As) concentrations in certain sections of its natural waters. Further investigation is necessary to determine the role of surface water and groundwater (SW-GW) exchanges in contributing to these high As concentrations. Both surface water and groundwater constitute crucial components of the basin water cycle, and the interaction between the two has been a central focus in basin water cycle research. In this study, a total of 59 groundwater samples and 41 surface water samples were collected along the river’s course within the basin. Among the groundwater samples, 18.64% exceeded the permissible drinking limit for As concentrations (10 μg/L), while 39.02% of the surface water samples exceeded this threshold. The water bodies in the Aksu River Basin are mildly alkaline, with total dissolved solids (TDSs) in surface water significantly surpassing those in groundwater. The chemical compositions of surface water and groundwater are strikingly similar, with the predominant anions being chloride (Cl) and sulfate (SO42−) and the principal cations being sodium (Na+). The dissolution of silicate and carbonate minerals primarily influences the water chemistry characteristics of surface water and groundwater in the Aksu River Basin, followed by the dissolution of salt rocks. Human activities also play a major role in affecting the river’s water quality. The distribution of groundwater with elevated As content is entirely encompassed within the spatial distribution of surface water. Groundwater–surface water exchange plays a vital role in As enrichment in surface water.

1. Introduction

Drinking-water quality is intricately linked to human health and the sustainable development of human society [1,2]. Arsenic is a non-metallic element commonly found in groundwater, and its ingestion in high concentrations can cause neurological and skin diseases [3]. Long-term exposure to high levels of arsenic can elevate the risk of cancer in the liver, bladder, and other organs [4]. According to the Global Burden of Diseases, Injuries, and Risk Factors Study (GBD), unsafe drinking water ranks 11th (for women) and 13th (for men) among the risk factors leading to death [5]. Consequently, groundwater pollution has garnered significant attention from researchers and policymakers worldwide in recent years [6,7].
Arsenic is a naturally occurring element found in rocks, soils, and natural waters, as well as in living organisms [8,9]. The average concentration of arsenic in the upper crust is 1.5 mg/kg, while arsenic levels in natural waters are typically low, mostly below 1.0 μg/L. However, over 200 known natural minerals containing arsenic exist, and the dissolution of these minerals is often considered to be the primary source of arsenic contamination in groundwater [10,11]. Anthropogenic sources, such as mining activities, smelting, combustion, agrochemicals, wood treatment, paints, cosmetics, and dyes, also release significant amounts of arsenic into the aquatic environment [12]. Elemental arsenic is enriched in the environment through leaching, enrichment, burial dissolution, compaction release, evaporation concentration, and food-chain cycling [13,14]. Given the potential toxicity of arsenic and its compounds to humans, the World Health Organization and China have established a guideline value of no more than 10 μg/L for arsenic in drinking water.
Although many researchers have utilized modeling software to predict the potential impact of arsenic contamination in groundwater in Xinjiang, China [15], there are limited studies on the occurrence of arsenic in groundwater, particularly in the Aksu River Basin [16]. In arid and semi-arid regions, which are characterized by limited precipitation and intense evaporation, surface water and groundwater serve as essential components of the ecosystem water cycle and are the primary sources of potable water [17]. As interrelated hydrological phenomena, surface water and groundwater are interdependent, mutually constrained, and independently functioning. Comprehending their roles and connections bears significant scientific importance for water resource evaluation, rational water resource utilization, and ecological conservation in arid and semi-arid regions. China’s total water resources amount to approximately 2.8 trillion m3, with inland river areas representing a mere 5% of the total, thereby rendering it a prototypical “water-scarce” region. Moreover, a large population is concentrated in oasis areas, leading to prominent water-use conflicts and a sensitive ecological environment. Understanding the chemical composition and formation mechanisms of water bodies in arid inland river basins is crucial for managing water resources [18,19].
The Aksu River Basin is a critical area in southern Xinjiang due to its high fertility and population density. The inhabitants of this area rely on the basin’s water resources for agricultural cultivation, industrial production, and daily livelihoods [20]. However, the continuous and massive exploitation of groundwater as a result of rapid agricultural and industrial development has led to a significant decline in water quality, with some areas downstream of the basin showing severely elevated arsenic levels. Consequently, it is imperative to conduct a study examining the relationship between the SW-GW exchange in the Aksu River Basin and its impact on As distribution. The findings of this study can provide a scientific foundation for the prevention and control of water pollution as well as water ecological conservation within the Aksu River Basin.

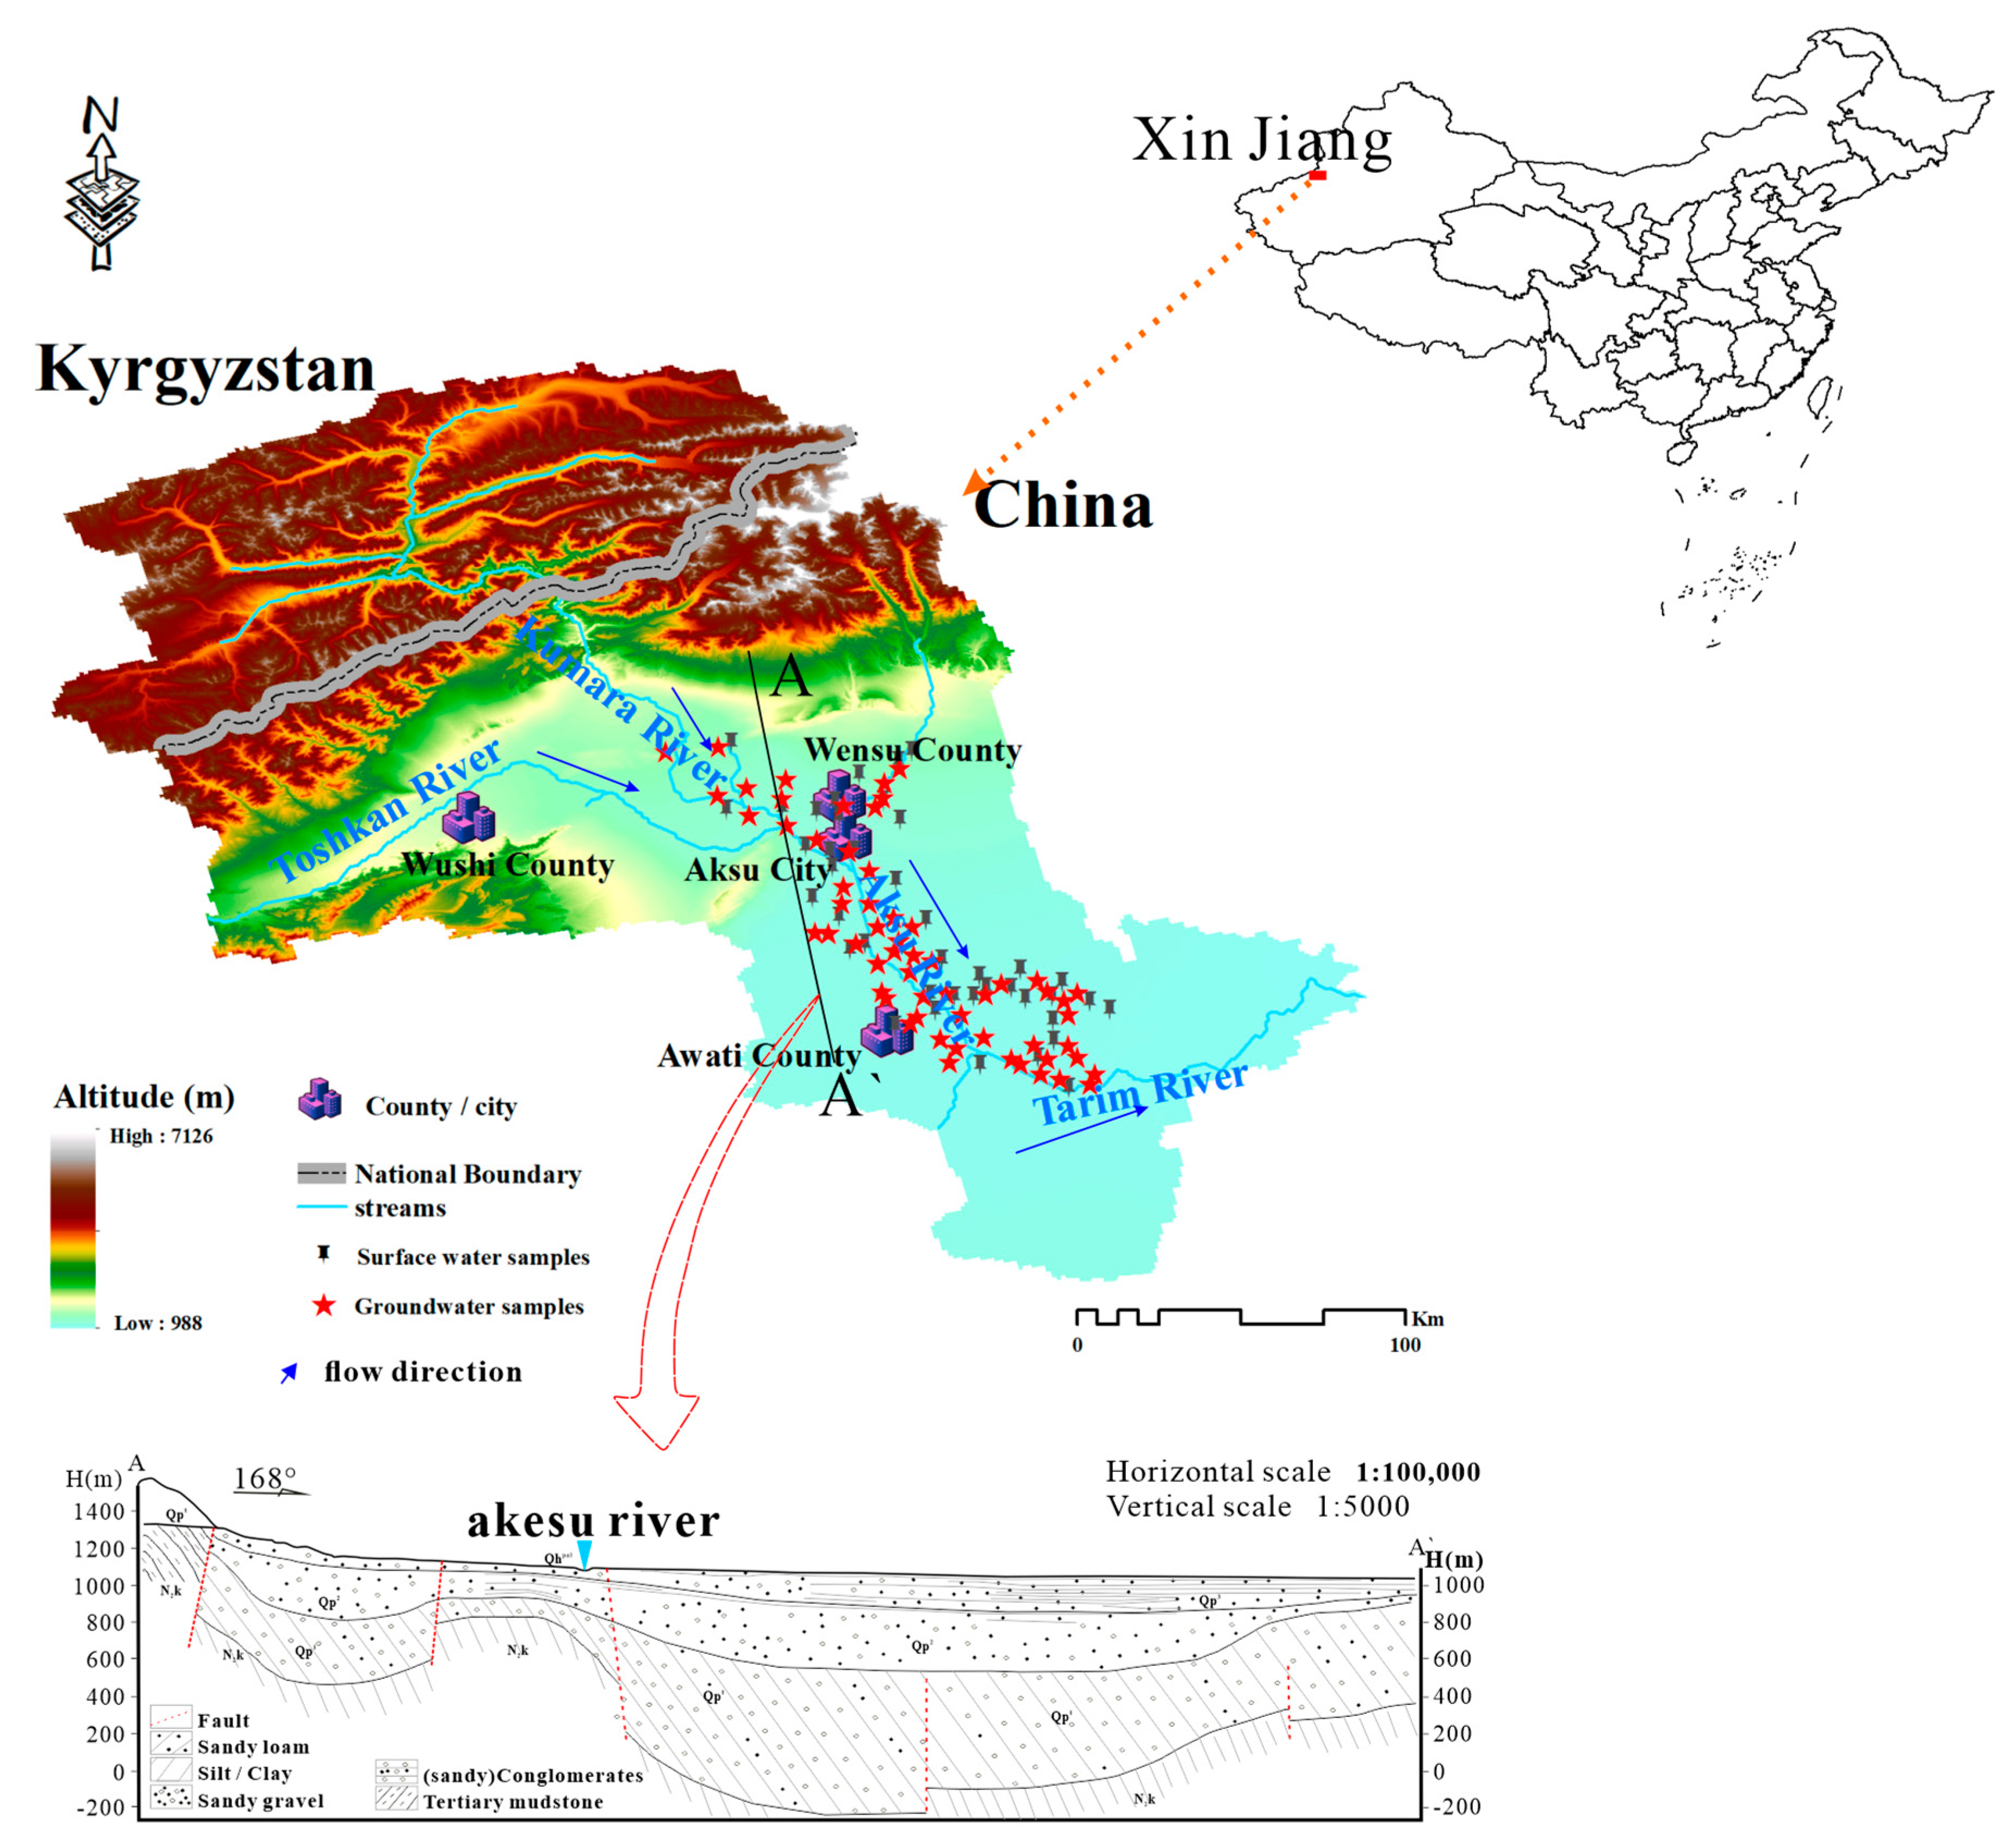
2. Overview of the Study Area

The Aksu River is situated in the Aksu region of northwestern Xinjiang, China, on the northern periphery of the Tarim Basin. The general topography of the region slopes from the northwest to the southeast, with landforms progressing from low- and middle-mountainous areas to hilly areas and, finally, to a plain area. The northwestern part of the study area is dominated by Mount Latagayi of the Tianshan Mountains, which form a northwest-trending range with the highest elevation of 2759 m above sea level and a general slope of 5–10‰ in the foothills [19,20]. The southern part of the study area is an alluvial plain with an altitude of 1100 m. The plain area’s average topographic slope ranges from 1 to 3‰, and the maximum difference in elevation is 2568 m.
The Aksu River Basin has a warm, temperate continental climate and is located in an arid–semi-arid region. This climate is characterized by four distinct seasons, low precipitation, high evaporation, and significant diurnal temperature differences. The Aksu River is one of the three major international rivers in Xinjiang and is also the primary source river of the Tarim River. The Aksu River originates from the confluence of the West Branch and the North Branch rivers, which flow southwards to Xiaojiake, Aksu, before joining the Tarim River. The western branch, i.e., Taushgan Darya (Tuoshikan River), originates from the Aksai River in the Khrebet At-Bash of Kyrgyzstan, while the northern branch, i.e., the Kumara River, originates from the Khan Tengri Peak in the Tian Shan Mountains (Figure 1).
Quaternary loose sediments provide good space for the storage of groundwater. In the upper and middle regions of the floodplain of the Aksu River, the sediment typically exhibits a thickness of approximately 1000 m; other parts of the pre-mountain floodplain feature a thickness of around 500 m. On the other hand, the Tarim River floodplain is characterized by relatively thin Quaternary sediments, measuring less than 100 m in thickness (Figure 1).

3. Materials and Methods

3.1. Sample Collection and Testing

To elucidate the influence of the SW-GW exchange on As concentrations in the Aksu River Basin under the combined impact of natural conditions and human activities, a comprehensive field survey was conducted in July 2022. Relevant water samples were collected along the river at the locations depicted in Figure 1.
In this study, a total of 59 groundwater samples and 41 surface water samples were collected along the river’s course within the basin. Groundwater from each site was sampled to a depth of 0.5 m below the groundwater surface, with the location of each sample recorded using GPS technology. Groundwater was collected from each site in duplicate, stored in plastic bottles with airtight caps, and labeled appropriately. Membrane filtration (0.45 μm) of all samples was conducted on site. One of the duplicate samples was acidified on site using 2–3 drops of concentrated nitric acid to ensure a pH value lower than 2 and to stabilize arsenic and metal ions and prevent their precipitation. This acidified water sample was subsequently used to analyze the total arsenic content and other elements. The second duplicate sample, which was not acidified, was utilized to analyze various cations and anions. All samples were transported to a laboratory at 4 °C and analyzed within 7 days.
The samples were analyzed at the School of Resources and Geosciences, China University of Mining and Technology. The concentrations of major cations and trace elements were determined using inductively coupled plasma atomic emission spectroscopy (ICP-AES). The concentrations of the anions were determined using ionic chromatography, while arsenic in GW/SW was measured using inductively coupled plasma mass spectrometry (ICP-MS). The error range of the cation and anion concentrations for all samples was less than 5%, ensuring the accuracy of all data.

3.2. Data Handling

A statistical analysis aids in deciphering various behaviors within a dataset. In this study, the distribution of elements in different water bodies was described using an inter-elemental violin-plot statistical analysis, which condensed information and grouped data for analysis using the Origin2023 software. Origin was employed to generate relevant plots, such as Piper trilinear plots, Gibbs plots, and ion-scale plots. A spatial distribution analysis of elemental As in the water samples was conducted utilizing ArcGIS (10.8), which effectively highlighted key areas. A principal component analysis (PCA) is a multivariate technique employed to reduce numerous relevant variables to a manageable set of uncorrelated variables, relying on covariance to reveal the interactions between ions in a water body. This approach extracts valuable information from extensive water chemistry datasets. The principal component analysis was obtained through maximum variance rotational normalization, and the PCA calculations were performed using the SPSS 19.0 software.

4. Results and Discussion

4.1. Hydrochemical Characteristics of Groundwater and Surface Water

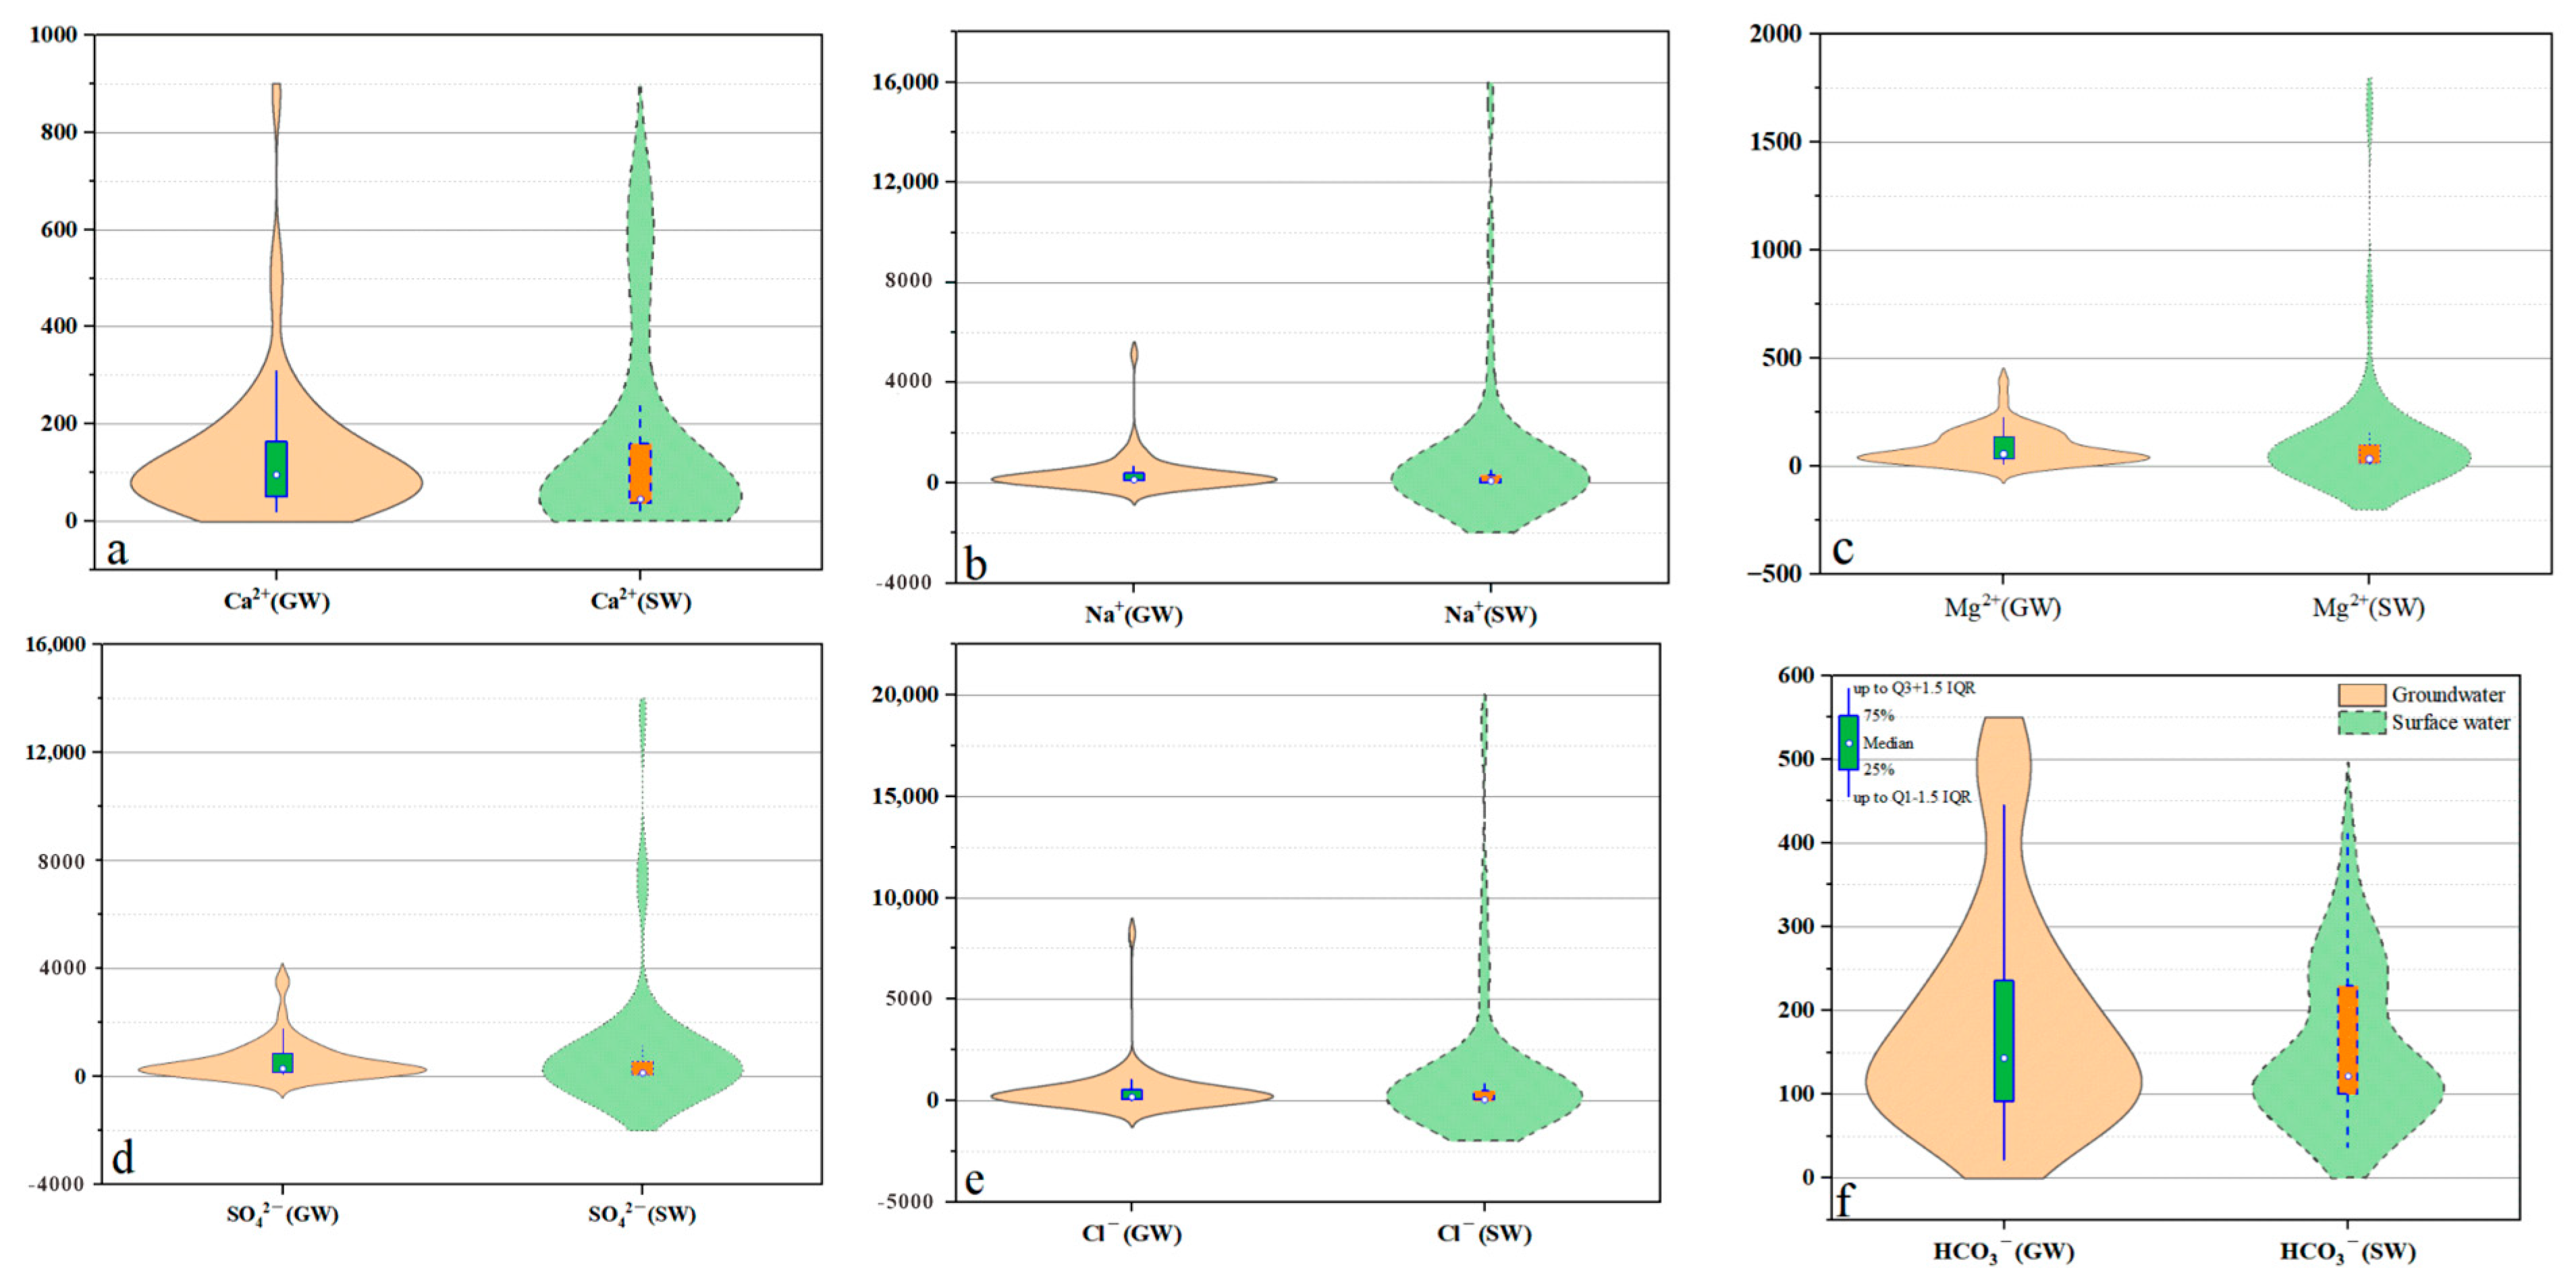
4.1.1. Analysis of Anion and Cation Composition

In examining the formation and evolution of water bodies and runoff patterns, both qualitative and quantitative methods involve analyses of the anionic and cationic compositions of water in a watershed. Basin water chemistry is influenced by the lithology and soil properties of the regions it traverses, with its composition evolution closely governed by various chemical interactions. The topographic and geological conditions within the basin can help with a thorough investigation of the water circulation pathways.
The majority of water bodies in the study area exhibited a pH distribution around 8.20, indicating weak alkalinity (Figure 2a). In the study area, 49.15% of the groundwater samples displayed TDS concentrations exceeding the permissible drinking limit (Figure 2b). The higher values suggest increased influence from salt leaching, sewage infiltration, and proximate saltwater sources. This indicates that it is mainly based on bicarbonate. The As concentration in the water body predominantly ranged between 0.05 and 10 μg/L (Figure 2c), with some samples (27%) surpassing the World Health Organization’s (WHO) 2022 guideline limits for drinking water (10 μg/L), reaching levels up to 46.9 μg/L in groundwater and 66.98 μg/L in surface water. Available studies propose that the dissolution of arsenic-containing minerals is the principal source of As contamination in groundwater [9,21,22].
The concentration distribution of calcium (Ca2+) in the study area differs from those of sodium (Na+) and magnesium (Mg2+) (Figure 3a–c). The concentration intervals of Ca2+ in the water body are more consistent, whereas those of Na+ and Mg2+ in GW and SW differ substantially. Ca2+ and Mg2+ are characteristic ions of dissolved carbonate rocks, and such disparate concentration differences between ions suggest strong cation exchange and/or water–rock interactions within the basin.
In the study area, surface water has a significantly higher sulfate (SO42−) concentration than groundwater, with a maximum value of 13,450 mg/L. Mineral dissolution, atmospheric deposition, and other anthropogenic sources contribute to groundwater sulfate (Figure 3d). The distribution of Cl in the water body remains higher in surface water than in groundwater, indicating the impact of domestic, industrial, and agricultural wastewater on the water body. A total of 45.76% of the groundwater samples exceeded the WHO’s 2022 drinking-water guideline limits for Cl, compared to 34.15% in surface water, posing a severe health risk (Figure 3e). This phenomenon is largely attributable to the presence of halide minerals. Groundwater contains considerably higher bicarbonate (HCO3) concentrations than surface water. As a characteristic ion of dissolved carbonate rock, HCO3 indicates stronger hydrochemical action in groundwater than in surface water within the basin (Figure 3f).

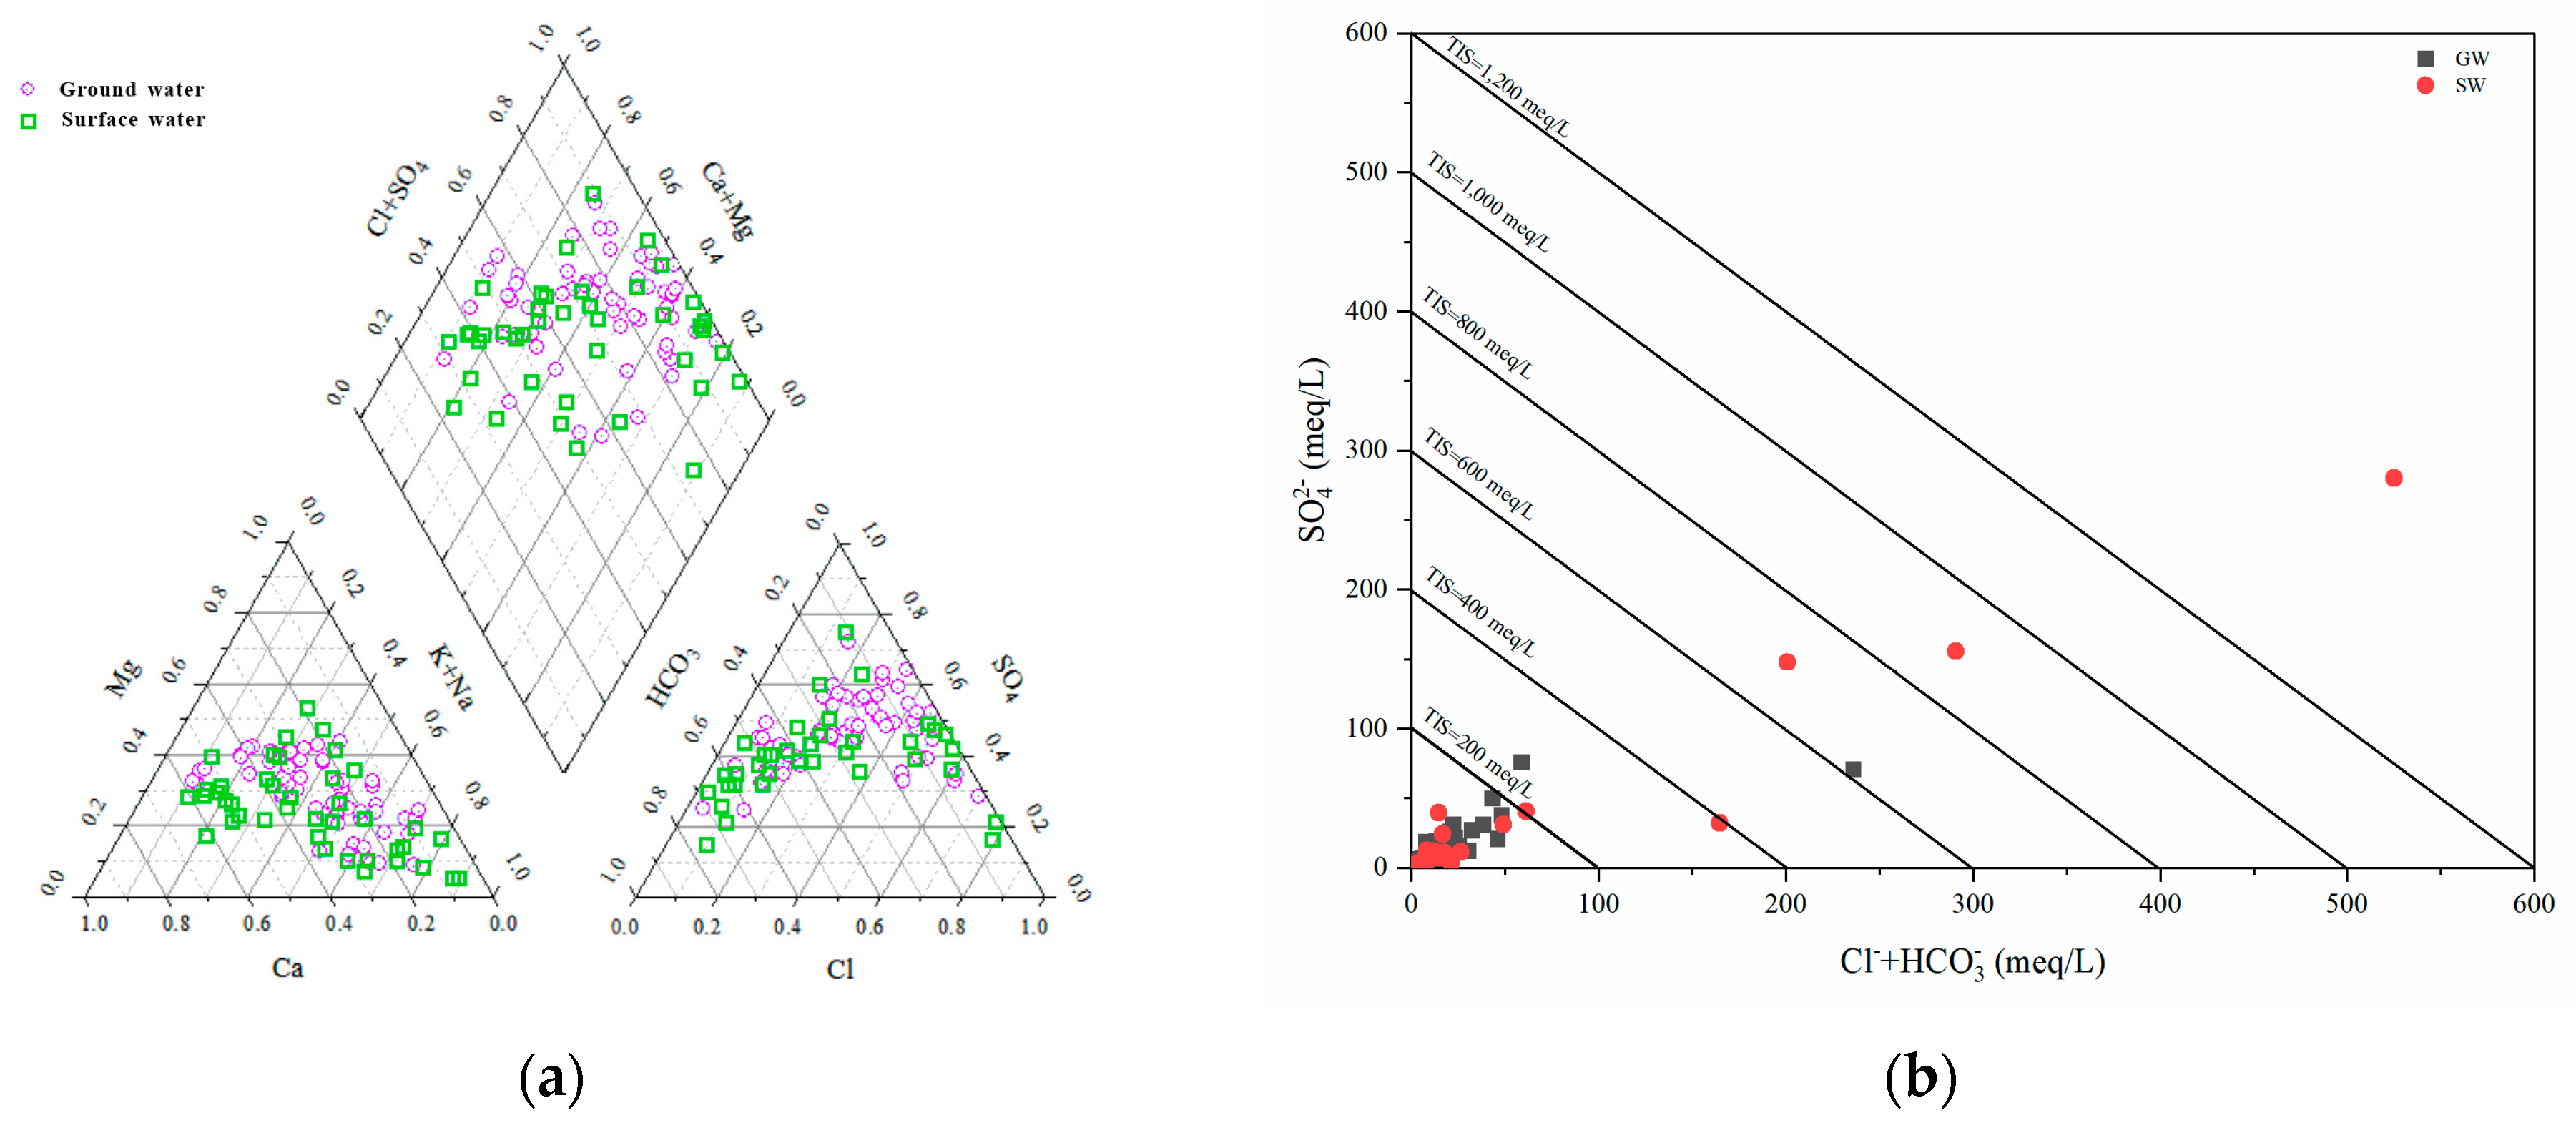
4.1.2. Hydrochemical Type

A statistical summary of the measured physicochemical parameters for the GW and SW samples is presented in Table 1 and compared with the WHO’s 2022 drinking-water guideline limits. The mean concentrations of Na+, Cl, SO42-, TDS, and TH within the Aksu River Basin’s water bodies were all significantly higher than the WHO’s 2022 drinking-water guideline limits. The pH values of GW and SW were similar, with mean values close to 8.20. A water chemistry analysis showed that groundwater TDS concentrations ranged from 200 to 18,112 mg/L, with a mean value of 1847 mg/L, and TH varied between 78.1 and 3443 mg/L, with a mean value of 695 mg/L.
The major cation abundances were in the following order: Na+ > Ca2+ > Mg2+ > K+ (GW), Na+ > Mg2+ > Ca2+ > K+ (SW) (Table 1). Na+ was the major cation in the study area, ranging from 17.4 to 5143 mg/L, with an average of 375 mg/L (GW), and from 5.98 to 15,371 mg/L, with an average of 989 mg/L (SW). In the study area, the abundance of anion content in GW and SW was generally consistent and in the following order: Cl > SO42− > HCO3 > F. The concentration range of HCO3 was 21.4~540 mg/L, with an average value of 192 mg/L (GW), and 36.6~412 mg/L, with an average value of 156 mg/L (SW).
Piper trilinear diagrams, unaffected by anthropogenic factors, visualize the type and evolution of water body hydrochemistry [24]. As shown in Figure 4a, the hydrochemistry in the basin is mainly Cl−Na (Ca) and HCO3−Na types. Hence, the water is highly mineralized, providing further evidence that the ultimate source of water in the basin is hydrochemistry, such as intense hydromorphism, in addition to atmospheric precipitation.
Another useful parameter for water classification is ionic salinity, or total ionic salinity (TIS), which represents the sum of the concentrations of major anions and cations expressed in meq L−1 [25,26]. Iso-TIS lines are shown in the correlation graph of SO4 2− vs. (HCO3 + Cl) (Figure 4b).
In accordance with the data, we suggest the following: (i) GW of low salinity derives its main chemical characteristics from the dissolution of crystalline rocks (mainly granite); and (ii) SW of intermediate and high salinity interacts with evaporite rocks (gypsum and halite).
The analysis indicated that during groundwater recharge to the river, excessive Ca2+ and HCO3 are dissolved in the river water due to altered environmental conditions, generating insoluble CaCO3 precipitation. The groundwater contained relatively high concentrations of highly soluble Na+ and Cl, indicating an increase in groundwater mineralization. The sampling sites are primarily located in the middle and lower reaches of the fine-grained plains formed by alluvial floodplains. The gentle topography of the plains and the low hydraulic gradient of the groundwater result in slower groundwater movement and, thus, a longer basin residence time compared to both springs and rivers. Simultaneously, industrial and agricultural activities developed along the basin and the input of everyday material sources are anthropogenic factors causing generally higher anion and cation concentrations in surface water compared with groundwater.

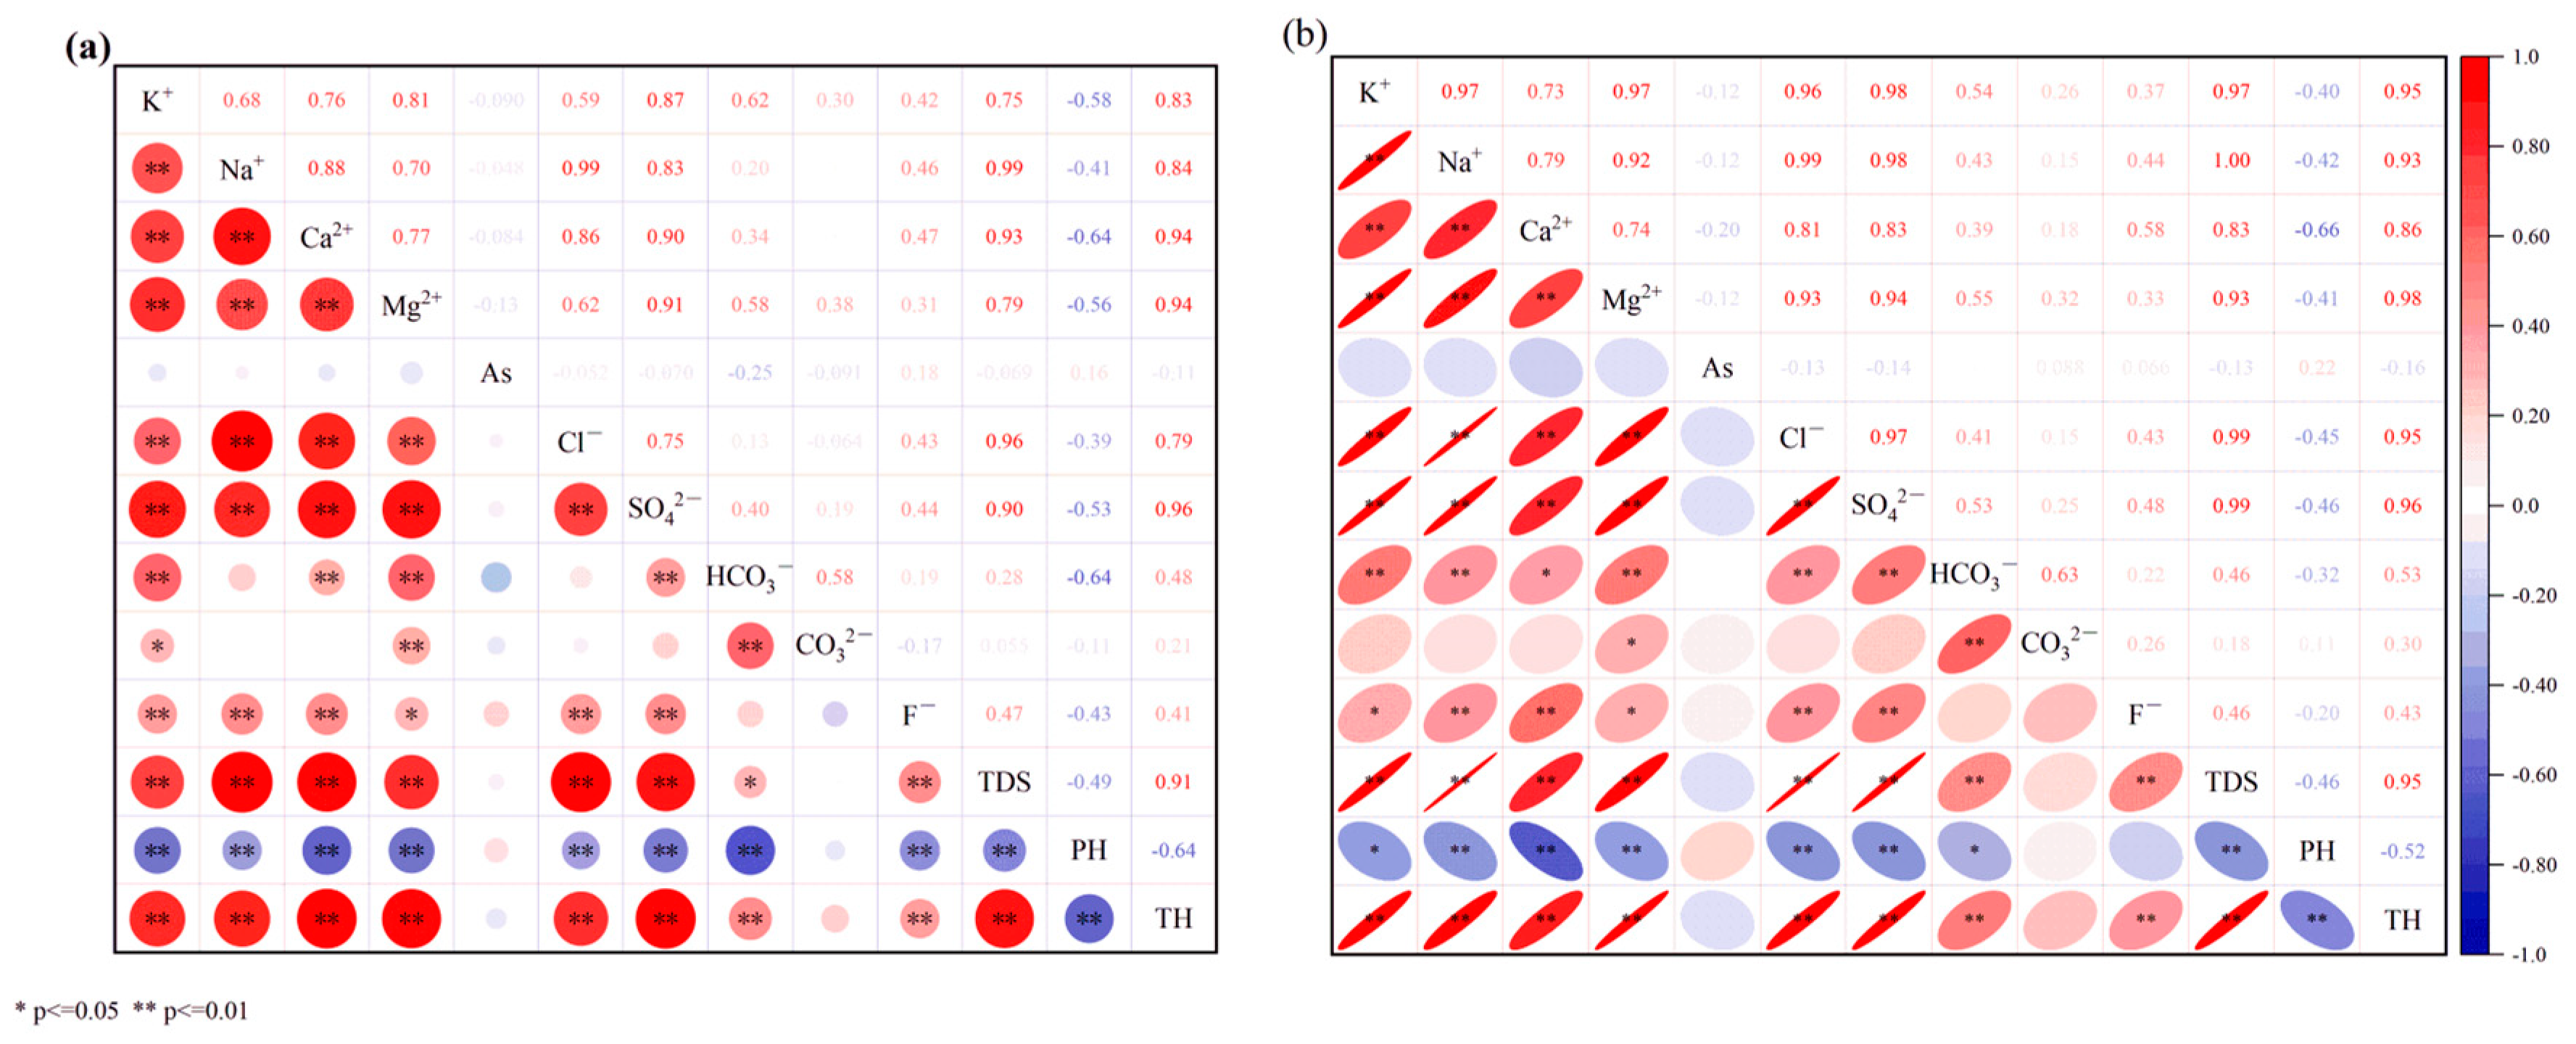
4.1.3. Relationship between Ions in Water

Analyzing the correlation between the water chemistry components of GW or SW allows for the identification of whether different ionic components share the same origin or have similar migration and transformation pathways. The correlation analysis results of hydrochemistry indicators between ions in the Aksu River Basin’s water bodies are shown in Figure 5.
In groundwater, TDS had significant positive correlations with K+, Na+, Ca2+, Mg2+, Cl, SO42−, and F-, indicating that these ions contribute more to TDS (Figure 5a). HCO3 had significant positive correlations with Ca2+ and Mg2+, suggesting that calcite has a noticeable contribution to the HCO3 content in the water. SO42− and Ca2+ showed a significant positive relationship, which is also observed between Mg2+ and Cl, indicating that evaporites contribute significantly to ion concentration. Significant correlations were found between Cl and Na+ and Ca2+ and Mg2+, inferring that there is a relatively consistent source between them, which may be due to the influence of rock-salt dissolution. As has a weak positive correlation with F and pH. The ion with the strongest correlation with As is HCO3, which shows a negative correlation, consistent with the findings of many existing studies in various locations [11,22].
In surface water, TDS had significant positive correlations with K+, Na+, Ca2+, Mg2+, Cl, SO42−, and HCO3, indicating that these ions contribute more to TDS. HCO3 had a significant positive correlation with Mg2+ and an insignificant correlation with Ca2+, indicating that calcite contributes less to HCO3 in water. SO42− had significant positive correlations with K+, Na+, and Cl, suggesting that evaporites have a greater contribution to ion concentration. Cl was significantly correlated with K+ and Na+, based on which we infer that the main sources of ions are consistent and that ion concentrations mainly originate from the influence of human pollution. Additionally, Ca2+ and Mg2+ were significantly correlated, indicating the same source. The correlation between the elemental As content and each of the major ions was stronger in surface water compared to groundwater (Figure 5b).
Cl and SO42− in both GW and SW showed highly significant positive correlations (Figure 5a). With an extensive distribution of farmland and villages in the study area and intensive human activities in the sample collection area, Cl is often used to trace the effects of human activities, such as domestic sewage and agricultural fertilizers, on groundwater, while SO42− comes from the decomposition of organic matter input from human activities. Based on the analysis above, surface water is influenced by anthropogenic inputs and groundwater by evaporite dissolution (Figure 3d,e and Figure 5).

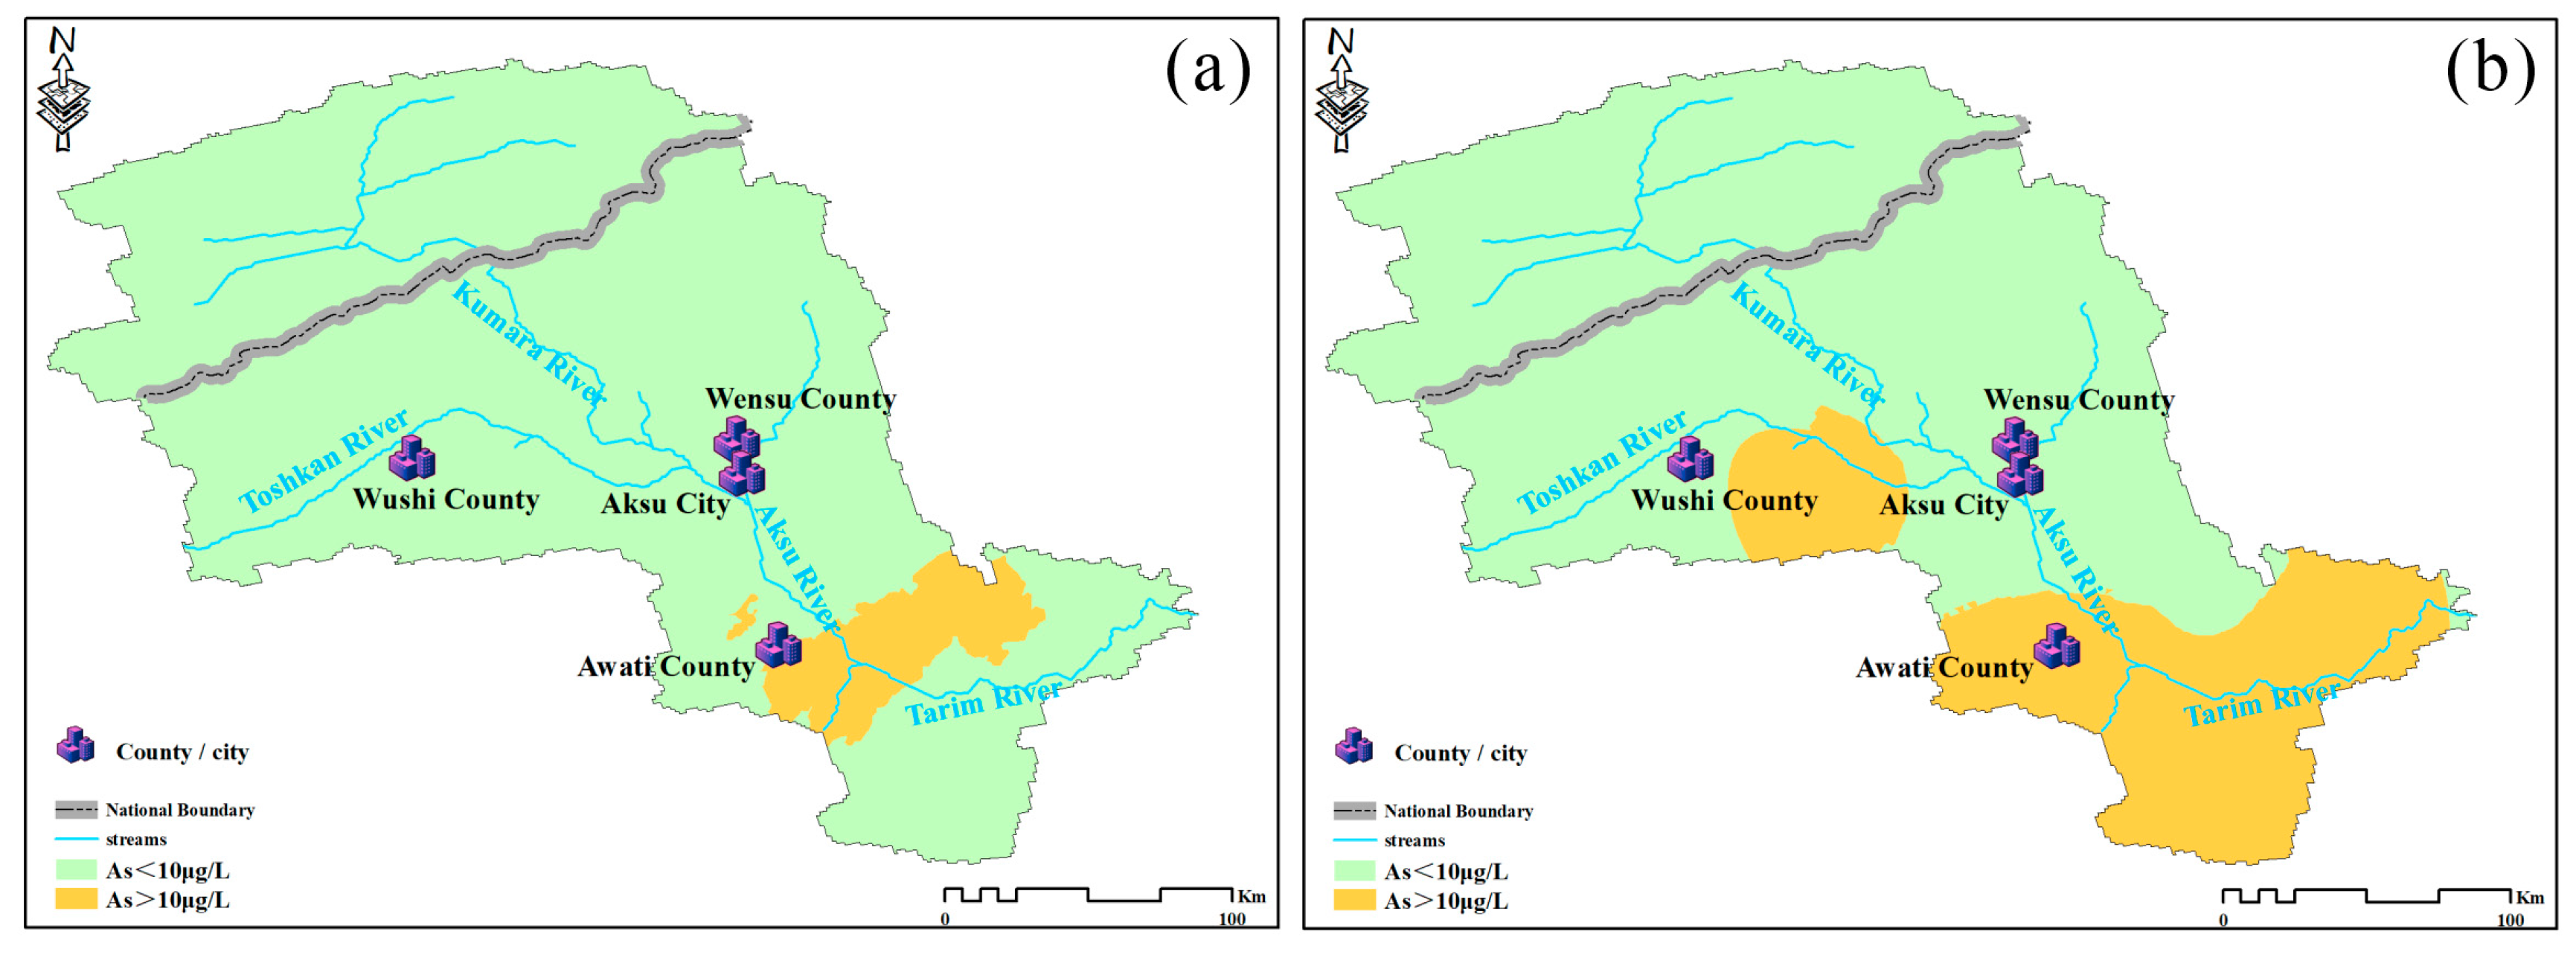
4.2. Spatial Distribution of Arsenic (As)

The spatial distribution analysis elucidated water-quality anomalies within the research area, highlighting the prevalence of high As concentrations in specific water bodies. Elevated levels of As in groundwater were predominantly observed in the southeastern region of the research area, within the plain confluence zone of the Aksu and Tarim rivers (Figure 6a). In terms of surface water, increased As concentrations were primarily detected in the lower reaches of the Tashkent River and in the expansive plains where the Aksu and Tarim rivers intersect (Figure 6b). The basin’s downstream areas exhibited a rise in As concentrations, which can be attributed to a combination of factors. First, the topographic slope and minimal hydraulic gradient contribute to this increase. Second, the study area experiences intense evaporation and low precipitation, both of which facilitate As enrichment within sediments.
Upon comparing Figure 6a,b, it becomes apparent that the distribution of groundwater with elevated As content is entirely encompassed within the spatial distribution of surface water. This observation, in conjunction with Figure 2c and Table 1, suggests significant ion exchange between GW and SW in the plains where the rivers converge, ultimately resulting in the enrichment of certain elements, such as arsenic.
The As concentrations in groundwater ranged from 0.05 to 46.9 μg/L, with a mean value of 7.23 μg/L, while in surface water, the values ranged from 0.50 to 66.98 μg/L, with a mean value of 11.2 μg/L (Table 2). As per the World Health Organization’s 2022 guidelines, 18.64% of the arsenic concentrations in the groundwater samples exceeded the acceptable drinking limit (10 μg/L) compared to 39.02% in the surface water samples. This indicates that the exchange of the two waters is an important factor in the enrichment of As in surface water.

4.3. Source Appointment by Principal Component Analysis (PCA)

A principal component analysis (PCA) is a valuable technique for identifying key ion sources and geochemical processes that influence water quality. Factor-loading values, which demonstrate strong correlations between factors and variables, are considered significant when they exceed 0.5.
Upon satisfying the requirements of the Kaiser–Meyer–Olkin (KMO) test and Bartlett’s sphericity test, a PCA was conducted on both SW and GW using SPSS 19.0. Components were extracted based on the criterion of eigenvalues exceeding 1. Three principal components were extracted from GW and SW, with cumulative contributions amounting to 82.62% and 83.45% (Table 2), respectively. These findings essentially explain the majority of the information regarding water in the study area.
The principal component F1 of groundwater exhibits strong positive loadings, particularly for TDS, Na+, Ca2+, SO42−, and TH, accounting for 59.60% of the variance. A significant correlation exists between these factors. F1 primarily comprises crucial cations and anions originating from both anthropogenic and natural sources. Mineral weathering/water–rock interactions represent natural processes occurring in aquifers. High concentrations of Cl and SO42− in groundwater typically signify evaporite dissolution, while Ca2+ and Mg2+ primarily suggest cation exchange and water–rock interactions within the basin. As a result, F1 for groundwater reflects the impact of water–rock interactions between evaporites and carbonates on groundwater composition. F2 is dominated by HCO3 and CO32−, accounting for 14.84% of the variance. HCO3 exhibits a significant positive correlation with Na+, which primarily originates from the weathering dissolution of silicates and evaporites, while HCO3 serves as a characteristic ion for carbonate dissolution. Therefore, F2 represents the influence of water–rock interactions among silicate, evaporite, and carbonate rocks on groundwater composition. F3, dominated by As and F, accounts for 8.18% of the variance, indicating that the concentration of F in the water body affects the concentration of As and that a positive correlation exists between As and F (Figure 5).
The loadings of the principal components for surface water and groundwater are essentially the same. The surface water principal component F1 is dominated by TDS, K+, Na+, Mg2+, SO42−, Cl, and TH, accounting for 64.05% of the variance and exhibiting a significant correlation between the two factors. Surface-water Piper trilinear plots show that the water chemistry types are primarily Cl−Na (Ca) and HCO3−Na, indicating that surface water is influenced by water−rock interactions. F1 is mainly composed of essential cations and anions originating from human sources. Increased human activities, such as agricultural production and mining, lead to a significant increase in the ion content of surface water. SO42− and Cl are sources of input from human activities in addition to evaporite dissolution, with Cl being the characteristic ion of domestic wastewater. The high contribution of K+ exhibits a significant correlation with numerous ions, primarily derived from agricultural fertilizers. The study area is dominated by the application of nitrogen, phosphorus, potassium, and compound fertilizers. It is hypothesized that F1 reflects the impact of human activities, such as domestic sewage and agricultural activities, on surface-water quality. F2 is dominated by HCO3 and CO32−, accounting for 11.55% of the variance. Based on the ion ratios and correlations, the chemical composition of surface water is primarily controlled by rock salts. Moreover, various-sized mines are distributed within the watershed. Therefore, F2 mainly reflects the rock-salt water−rock interactions influenced by human activities. F3, accounting for 7.86% of the variance, is dominated by As.

4.4. Major Factors Controlling Hydrogeochemical Processes

4.4.1. Water−Rock Interaction Mechanism

Various factors significantly influence hydrogeochemical processes, including groundwater conditions, aquifer lithology, and climatic conditions. Gibbs diagrams allow for the determination of lithology−hydrochemistry relationships in aquifers. Figure 7a shows that most groundwater samples are located in lithologically dominant and evapotranspiration-dominant zones, indicating that these processes primarily regulate groundwater hydrochemistry. Due to the arid climate and sparse rainfall in the study area, the input of soluble ions from atmospheric precipitation is negligible. Groundwater chemistry is mainly derived from the weathering hydrolysis of minerals. High As concentrations in groundwater are more influenced by evaporation than low-As groundwater, which is evident from the local arid climate.
The relationship between (Ca2+/Na+) and (HCO3/Na+) can be used to determine the source of major ions in the water body. As seen in Figure 7b, the samples are primarily distributed near the endpoints of silicate minerals and evaporites, suggesting that the water chemistry of groundwater mainly originates from the dissolution of evaporites and the weathering hydrolysis of silicate minerals, with relatively little influence from carbonate weathering. Consequently, the abundance of As in the water body is likely to be primarily caused by the dissolution of silicate-bearing minerals.

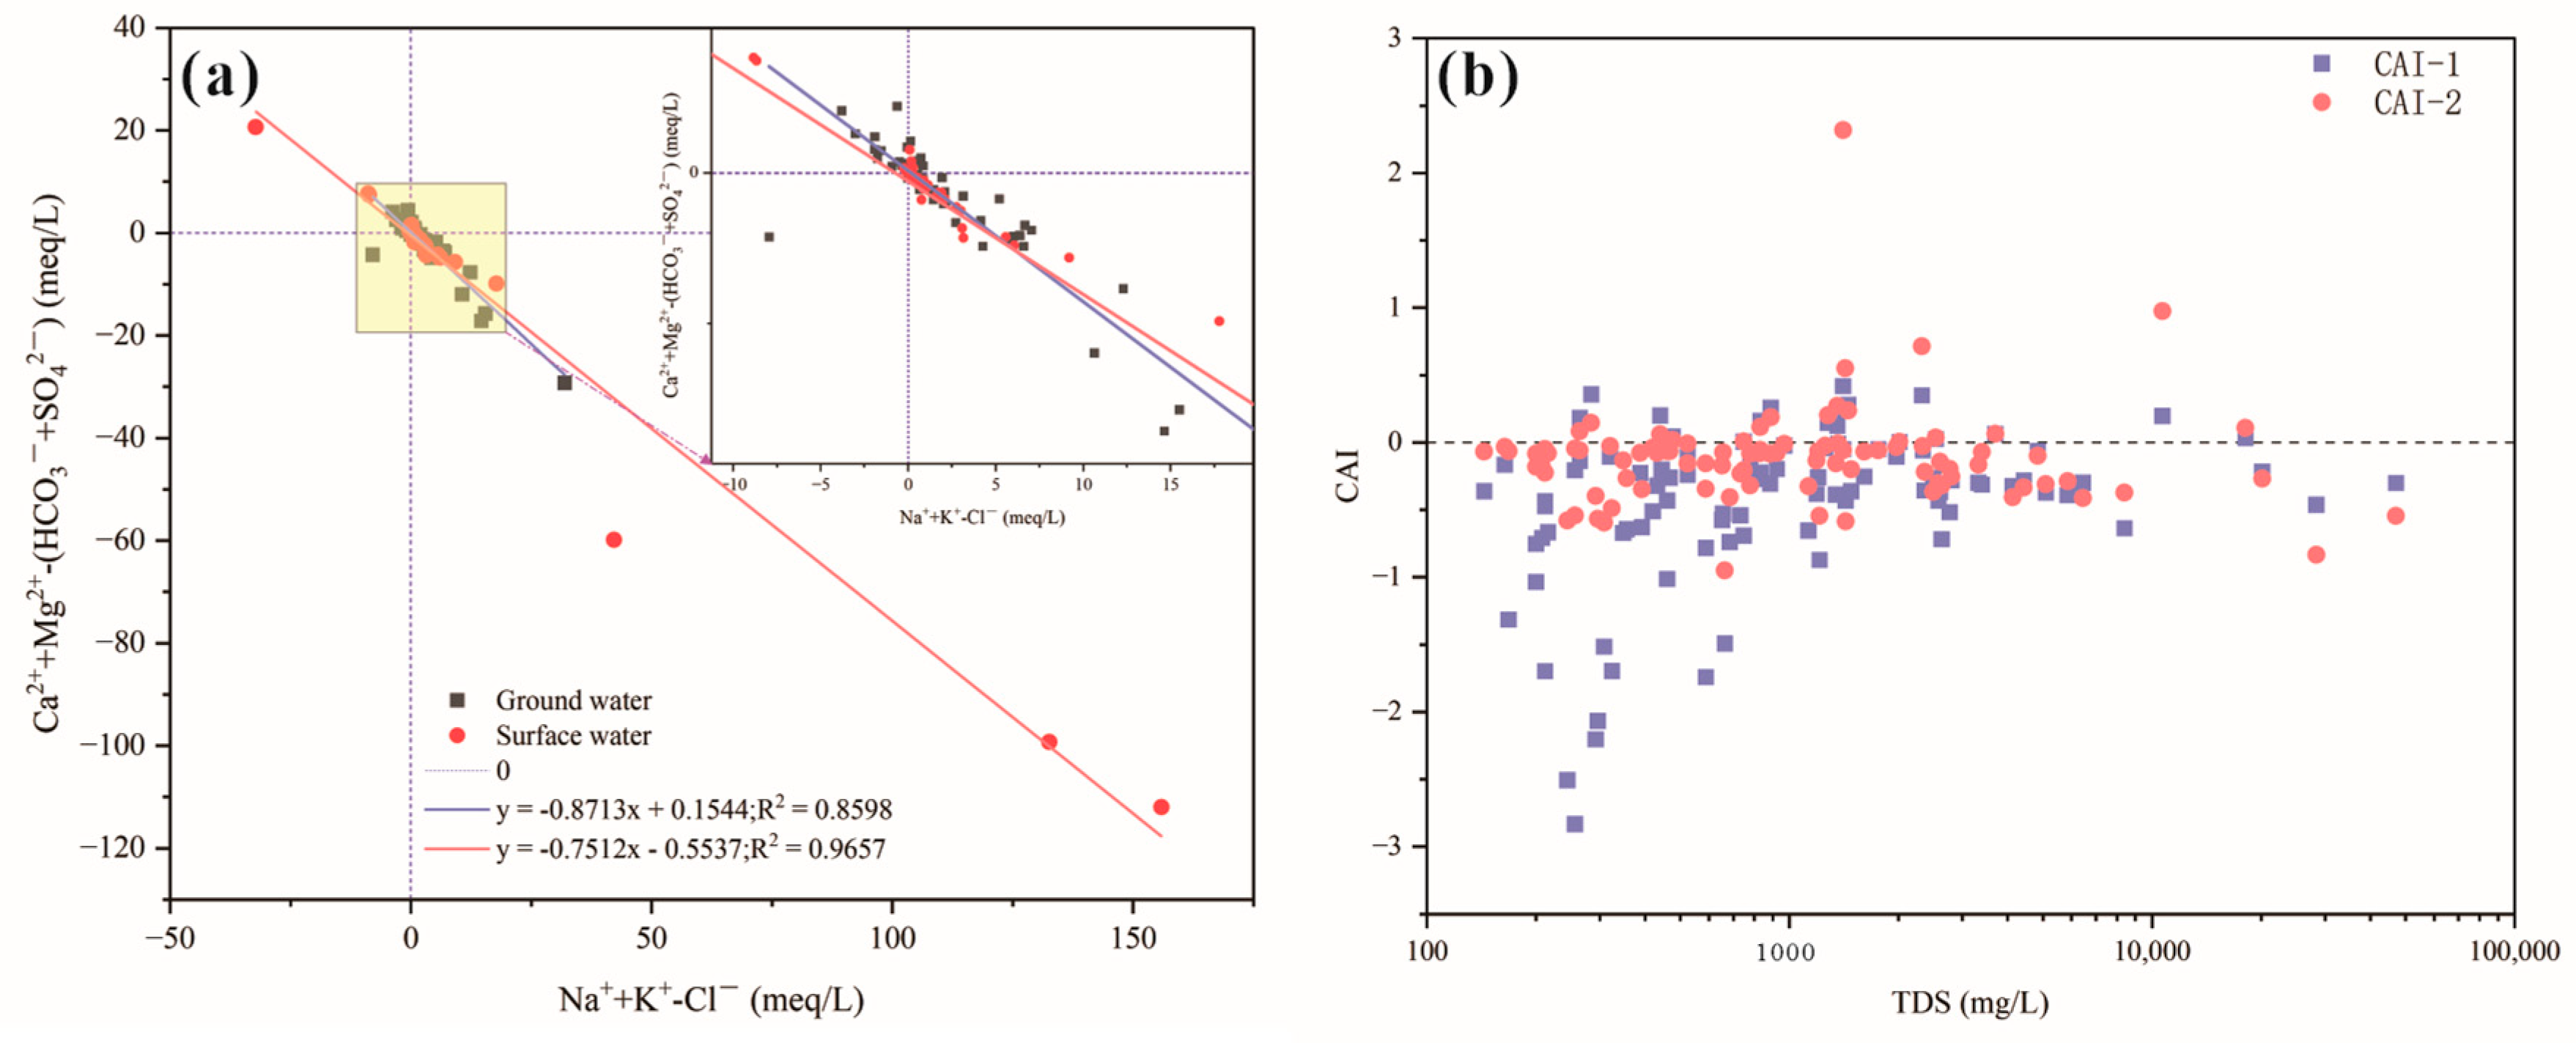
4.4.2. Cation-Exchange Reaction

The equivalent concentration ratio of (Na+ + K+ − Cl) to [(Ca2+ + Mg2+) − (SO42− + HCO3)] can be utilized to identify the intensity of cation-exchange adsorption. As illustrated in Figure 8a, all sample points within the study area exhibit a pronounced negative correlation, with a correlation coefficient of 0.97 (0.86) for SW (GW) and a slope approaching −1. This indicates that both GW and SW in the study area experience a strong degree of cation-exchange adsorption.
Schoeller introduced two indices, CAI-1 and CAI-2, to demonstrate the possibility of cation exchange [21,27]. These indices characterize the type and intensity of cation exchange in groundwater or surface water, with their respective formulae and meanings provided in the literature. As shown in Figure 8b, the CAI index increases with the rise in TDS within the watershed. This suggests that Ca2+ and Mg2+ ions in GW and SW replace Na+ ions in the surrounding rock in the study area and that the alternate adsorption in groundwater is more robust than that in surface water. A significant positive correlation exists between Na+ and SO42− in surface water and groundwater (Figure 5). The dissolution of sulfate leads to a substantial increase in Ca2+ and Mg2+ concentrations in both GW and SW, approaching saturation. However, the remaining SO42− in the system still requires a significant amount of cations, such as Ca2+ and Mg2+, to replace Na+ in order to maintain equilibrium.

4.4.3. Main Weathering Processes and Evolution Mechanisms

SO42− can serve as a reliable indicator of the environment in which As forms in the water body [22,28,29,30]. Figure 9a shows that most samples are distributed in areas of high SO42− concentrations, with As concentrations generally below 10 μg/L. Low SO42− concentrations foster the formation of elevated As concentrations, indicating that high As concentrations in the study area primarily occur in weakly oxidizing environments.
The milligram equivalent ratio of (Ca2+ + Mg2+) − HCO3 to SO42− − (Na+ − Cl) is used to determine whether SO42− originates from gypsum dissolution. Except for a few sample points deviating from the 1:1 milligram-equivalent ratio (Figure 9b), all other points lie near this line, signifying that SO42− in groundwater primarily stems from gypsum dissolution.
The source of Na+ can be deduced from the equivalent concentration ratio of Na+ to Cl. Na+ mainly derives from the weathering dissolution of silicates and evaporites, while Cl remains relatively stable in groundwater, primarily resulting from the weathering dissolution of evaporites. In general, a Na+/Cl ratio greater than 1 indicates Na+ originating from silicate weathering. Figure 9c demonstrates that the Na+/Cl ratio is greater than 1 for most GW samples. The surface-water sample points, however, are mainly distributed on both sides of a 1:1 straight line, indicating a more complex source of Na+, likely contributed by cation exchange in addition to mineral dissolution, such as rock-salt minerals and silicates. A small number of groundwater samples exhibit a Na+/Cl ratio of less than 1, indicating potential anthropogenic contamination. Figure 9d reveals that Na+ significantly exceeds HCO3 in both SW and GW, except for a few samples, meaning that HCO3 is not sufficiently balanced in GW or SW. Therefore, Na+ in these waters may originate from cation exchange in addition to silicate mineral dissolution.
Two-water exchange is a complex process, and a single mechanism is insufficient to explain the relationship or impact of two-water exchange on As transport and enrichment. A combination of various methods can provide a more rational explanation for the mechanisms of As release and enrichment in the water body (Figure 10).

5. Conclusions

Surface water and groundwater in the Aksu River Basin area exhibit weak alkalinity, with surface water TDS being significantly higher than that of groundwater. The frequent GW and SW exchange, which is due to agricultural irrigation at the oasis edge, leads to highly similar water chemistry in both types of water. The dominant anions are Cl and SO42−, while the dominant cation is Na+.
The As distribution in GW and SW shows a positive correlation with pH. Sufficient ion exchange between GW and SW occurs in the plains where rivers converge, which consequently leads to the enrichment of certain elements, such as arsenic. The exchange of the two waters is an essential factor in the enrichment of As in surface waters.
The water chemistry characteristics of SW and GW in the Aksu River Basin are primarily influenced by silicate and carbonate minerals and gypsum dissolution. Secondary influences include the dissolution of saline rocks. Other factors include human activities, evapotranspiration, and ion-exchange processes. In the future, with increasing human activities, concerns for the upper mountainous basin of the Aksu River should not only focus on reductions in the total flow but also on issues such as sulfate pollution caused by mining and ionic pollution, including K+, SO42−, and Cl, arising from municipal wastewater and agricultural irrigation.

Author Contributions

Investigation, F.S.; writing—original draft, F.S.; methodology, F.S.; supervision, W.W.; resources, F.S.; project administration, W.W.; writing—review and editing, W.W. and F.S.; field support, F.S. and J.H. All authors have read and agreed to the published version of the manuscript.

Funding

This research was funded by the Science and Technology Basic Work of Science and Technology (No. 2022xjkk1003), and the Major Science and Technology Special Project of Xinjiang Uygur Autonomous Region ((No. 2022A03014). The APC was funded by the Science and Technology Basic Work of Science and Technology (No. 2022xjkk1003).

Data Availability Statement

The data used to support the findings of this study are included within the manuscript.

Acknowledgments

The authors would like to thank the reviewers and editors for their helpful comments and suggestions.

Conflicts of Interest

The authors declare no conflict of interest.

References

  1. Niazi, N.K.; Bibi, I.; Fatimah, A.; Shahid, M.; Javed, M.T.; Wang, H.; Ok, Y.S.; Bashir, S.; Murtaza, B.; Saqib, Z.A.; et al. Phosphate-assisted phytoremediation of arsenic by Brassica napus and Brassica juncea: Morphological and physiological response. Int. J. Phytoremediation 2017, 19, 670–678. [Google Scholar] [CrossRef]
  2. Niazi, N.K.; Bibi, I.; Shahid, M.; Ok, Y.S.; Burton, E.D.; Wang, H.; Shaheen, S.M.; Rinklebe, J.; Lüttge, A. Arsenic removal by perilla leaf biochar in aqueous solutions and groundwater: An integrated spectroscopic and microscopic examination. Environ. Pollut. 2018, 232, 31–41. [Google Scholar] [CrossRef]
  3. Ivy, N.; Mukherjee, T.; Bhattacharya, S.; Ghosh, A.; Sharma, P. Arsenic contamination in groundwater and food chain with mitigation options in Bengal delta with special reference to Bangladesh. Environ. Geochem. Health 2023, 45, 1261–1287. [Google Scholar] [CrossRef] [PubMed]
  4. Sheng, D.; Wen, X.; Wu, J.; Wu, M.; Yu, H.; Zhang, C. Comprehensive Probabilistic Health Risk Assessment for Exposure to Arsenic and Cadmium in Groundwater. Environ. Manag. 2021, 67, 779–792. [Google Scholar] [CrossRef]
  5. GBD 2019 Risk Factors Collaborators. Global burden of 87 risk factors in 204 countries and territories, 1990–2019: A systematic analysis for the Global Burden of Disease Study 2019. Lancet 2020, 396, 1223–1249. [Google Scholar] [CrossRef] [PubMed]
  6. Gunduz, O.; Bakar, C.; Simsek, C.; Baba, A.; Elci, A.; Gurleyuk, H.; Mutlu, M.; Cakir, A. The Health Risk Associated with Chronic Diseases in Villages with High Arsenic Levels in Drinking Water Supplies. Expo. Health 2017, 9, 261–273. [Google Scholar] [CrossRef]
  7. Rafiq, M.; Shahid, M.; Shamshad, S.; Khalid, S.; Niazi, N.K.; Abbas, G.; Saeed, M.F.; Ali, M.; Murtaza, B. A comparative study to evaluate efficiency of EDTA and calcium in alleviating arsenic toxicity to germinating and young Vicia faba L. seedlings. J. Soils Sediments 2018, 18, 2271–2281. [Google Scholar] [CrossRef]
  8. Guo, H.; Wen, D.; Liu, Z.; Jia, Y.; Guo, Q. A review of high arsenic groundwater in Mainland and Taiwan, China: Distribution, characteristics and geochemical processes. Appl. Geochem. 2014, 41, 196–217. [Google Scholar] [CrossRef]
  9. Podgorski, J.; Berg, M. Global threat of arsenic in groundwater. Science 2020, 368, 845–850. [Google Scholar] [CrossRef] [PubMed]
  10. Mandal, B.K.; Suzuki, K.T. Arsenic round the world: A review. Talanta 2002, 58, 201–235. [Google Scholar] [CrossRef] [PubMed]
  11. Smedley, P.L.; Kinniburgh, D.G. A review of the source, behaviour and distribution of arsenic in natural waters. Appl. Geochem. 2002, 17, 517–568. [Google Scholar] [CrossRef] [Green Version]
  12. Rosas-Castor, J.; Portugal, L.; Ferrer, L.; Guzmán-Mar, J.; Hernández-Ramírez, A.; Cerdà, V.; Hinojosa-Reyes, L. Arsenic fractionation in agricultural soil using an automated three-step sequential extraction method coupled to hydride generation-atomic fluorescence spectrometry. Anal. Chim. Acta 2015, 874, 1–10. [Google Scholar] [CrossRef]
  13. He, X.; Li, P.; Ji, Y.; Wang, Y.; Su, Z.; Elumalai, V. Groundwater Arsenic and Fluoride and Associated Arsenicosis and Fluorosis in China: Occurrence, Distribution and Management. Expo. Health 2020, 12, 355–368. [Google Scholar] [CrossRef]
  14. Wang, Y.; Li, J.; Ma, T.; Xie, X.; Deng, Y.; Gan, Y. Genesis of geogenic contaminated groundwater: As, F and I. Crit. Rev. Environ. Sci. Technol. 2020, 51, 2895–2933. [Google Scholar] [CrossRef]
  15. Rodríguez-Lado, L.; Sun, G.; Berg, M.; Zhang, Q.; Xue, H.; Zheng, Q.; Johnson, C.A. Groundwater Arsenic Contamination Throughout China. Science 2013, 341, 866–868. [Google Scholar] [CrossRef] [PubMed]
  16. Wang, H.-B.; Xu, J.-M.; Gomez, M.A.; Shi, Z.-L.; Li, S.-F.; Zang, S.-Y. Arsenic concentration, speciation, and risk assessment in sediments of the Xijiang River basin, China. Environ. Monit. Assess. 2019, 191, 663. [Google Scholar] [CrossRef]
  17. Li, M.; Ma, Z.; Niu, G.-Y. Modeling spatial and temporal variations in soil moisture in China. Chin. Sci. Bull. 2011, 56, 1809–1820. [Google Scholar] [CrossRef] [Green Version]
  18. Zhou, Y.; Tu, Z.; Zhou, J.; Han, S.; Sun, Y.; Liu, X.; Liu, J.; Liu, J. Distribution, dynamic and influence factors of groundwater arsenic in the Manas River Basin in Xinjiang, P.R.China. Appl. Geochem. 2022, 146, 105441. [Google Scholar] [CrossRef]
  19. Zhou, Y.; Zeng, Y.; Zhou, J.; Guo, H.; Li, Q.; Jia, R.; Chen, Y.; Zhao, J. Distribution of groundwater arsenic in Xinjiang, P.R. China. Appl. Geochem. 2017, 77, 116–125. [Google Scholar] [CrossRef]
  20. Yang, P.; Xia, J.; Zhan, C.; Mo, X.; Chen, X.; Hu, S.; Chen, J. Estimation of water consumption for ecosystems based on Vegetation Interfaces Processes Model: A case study of the Aksu River Basin, Northwest China. Sci. Total. Environ. 2018, 613–614, 186–195. [Google Scholar] [CrossRef]
  21. Wang, Y.; Pi, K.; Fendorf, S.; Deng, Y.; Xie, X. Sedimentogenesis and hydrobiogeochemistry of high arsenic Late Pleistocene-Holocene aquifer systems. Earth-Science Rev. 2019, 189, 79–98. [Google Scholar] [CrossRef]
  22. Benner, S.G.; Fendorf, S. Arsenic in South Asia Groundwater. Geogr. Compass 2010, 4, 1532–1552. [Google Scholar] [CrossRef]
  23. WHO. Guidelines for Drinking-Water Quality: Incorporating the First and Second Addenda; WHO: Geneva, Switzerland, 2022. [Google Scholar]
  24. Wang, Y.; Li, P.; Guo, Q.; Jiang, Z.; Liu, M. Environmental biogeochemistry of high arsenic geothermal fluids. Appl. Geochem. 2018, 97, 81–92. [Google Scholar] [CrossRef]
  25. Apollaro, C.; Tripodi, V.; Vespasiano, G.; De Rosa, R.; Dotsika, E.; Fuoco, I.; Critelli, S.; Muto, F. Chemical, isotopic and geotectonic relations of the warm and cold waters of the Galatro and Antonimina thermal areas, southern Calabria, Italy. Mar. Pet. Geol. 2019, 109, 469–483. [Google Scholar] [CrossRef]
  26. Apollaro, C.; Marini, L.; De Rosa, R. Use of reaction path modeling to predict the chemistry of stream water and groundwater: A case study from the Fiume Grande valley (Calabria, Italy). Environ. Geol. 2007, 51, 1133–1145. [Google Scholar] [CrossRef]
  27. Liu, T.; Shao, F.; Zhang, Z.; Li, T. Fluorine-Rich Shallow Groundwater in Weigan River Basin (Xinjiang): Enrichment Factors and Spatial Distribution. Water 2023, 15, 926. [Google Scholar] [CrossRef]
  28. Ke, T.; Zhang, D.; Guo, H.; Xiu, W.; Zhao, Y. Geogenic arsenic and arsenotrophic microbiome in groundwater from the Hetao Basin. Sci. Total. Environ. 2022, 852, 158549. [Google Scholar] [CrossRef]
  29. Qiao, W.; Guo, H.; He, C.; Shi, Q.; Xing, S.; Gao, Z. Identification of processes mobilizing organic molecules and arsenic in geothermal confined groundwater from Pliocene aquifers. Water Res. 2021, 198, 117140. [Google Scholar] [CrossRef]
  30. Li, D.; Gao, X.; Wang, Y.; Luo, W. Diverse mechanisms drive fluoride enrichment in groundwater in two neighboring sites in northern China. Environ. Pollut. 2018, 237, 430–441. [Google Scholar] [CrossRef] [PubMed]
Figure 1. Location of the Aksu River Basin and sampling sites.
Water 15 02391 g001
Figure 2. Inter-elemental violin plot. (a) pH, (b) TDS, and (c) As.
Water 15 02391 g002
Figure 3. Inter-elemental violin plot. (a) Ca2+, (b) Na+, (c) Mg2+, (d) SO42−, (e) Cl, and (f) HCO3.
Water 15 02391 g003
Figure 4. (a) Piper diagram of groundwater and surface water of the Aksu River Basin. (b) Correlation diagram of SO4 vs. HCO3 + Cl for the GW and SW samples. Iso-salinity lines are drawn for reference.
Water 15 02391 g004
Figure 5. Ion correlations of groundwater (a) and surface water (b).
Water 15 02391 g005
Figure 6. Spatial distribution of arsenic in groundwater (a) and surface water (b).
Water 15 02391 g006
Figure 7. Na+/(Na+ + Ca2+) mg/L versus log TDS (a) and Na-normalized HCO3 versus Na-normalized Ca.2+ (mM/mM) (b).
Water 15 02391 g007
Figure 8. Cation exchange and adsorption (a) and chlor-alkali index (CAI) of groundwater and surface water in the study area (b).
Water 15 02391 g008
Figure 9. Ionic-ratio plots. Cl-normalized SO42− versus As (a); Plots of (SO42− − Na+ − Cl) vs. (Ca2+ + Mg2+) − (HCO3) (b) and Cl vs. Na+ (c) and Na+ vs. HCO3 (d) for the samples.
Water 15 02391 g009
Figure 10. A proposed conceptual model of GW-SW interactions and the effects of arsenic pollution in the Aksu River Basin based on existing data.
Water 15 02391 g010
Table 1. Statistical physicochemical parameters of groundwater (n = 59) and surface water (n = 41) samples collected from the Aksu River Basin.
Groundwater (n = 59)Surface Water (n = 41)WHO
2022 [23]
Standard
MinMaxAve ± s.es.d.MinMaxAve ± s.es.d.
K+mg/L18610.9 ± 1.8614.3 1.30251 16.3 ± 6.7643.3 12
Na+mg/L17.4 5143 375 ± 95.0730 5.98 15,371 989 ± 4502880 200
Ca2+mg/L20.7 879 134 ± 18.2140 13.5 739 152 ± 31.8203 200
Mg2+mg/L5.70 394 88.6 ± 10.278.3 5.20 1663 115 ± 44281 150
Asμg/L0.05 46.9 7.23 ± 1.3610.4 0.50 66.9811.2 ± 2.6116.7 10
Clmg/L18.9 8258 501 ± 1441108 4.96 18,403 1238 ± 5363430 250
SO42−mg/L40.6 3646 616 ± 95.1731 20.613,450 1032 ± 3972543 250
HCO3mg/L21.4 540 192 ± 17.7136 36.6 412 156 ± 14.492.4 250
CO32−mg/L042.0 13.4 ± 1.209.23 05111.5 ± 1.9812.7 250
Fmg/L0.20 4.70 1.6 ± 0.141.04 0.32 5.30 1.62 ± 0.191.20 1.5
TDSmg/L200 18,112 1847 ± 3462660 144 47,128 3525 ± 13858868 1000
PH/7.41 8.75 8.16 ± 0.050.35 7.26 8.698.17 ± 0.050.35 6.5–8.5
THmg/L78.1 3443 695 ± 81.5626 64.18668 853 ± 2441563 300
Note: Min is minimum value; Max is maximum value; Ave is average value; Md is mid-value; s.e. is standard error; and s.d. is standard deviation.
Table 2. The matrix of rotated factor loadings of the Aksu River Basin.
IndexPCA Method
Groundwater (n = 59)Surface Water (n = 41)
F1F2F3F1F2F3
123123
K+0.87 −0.22 0.10 0.96 0.02 0.04
Na+0.90 0.33 −0.17 0.96 −0.10 0.14
Ca2+0.95 0.16 −0.05 0.87 −0.16 −0.01
Mg2+0.89 −0.24 −0.05 0.95 0.06 −0.02
As−0.11 0.37 0.66 −0.16 0.46 0.71
Cl0.85 0.40 −0.21 0.97 −0.12 0.13
SO42−0.95 0.02 −0.04 0.99 −0.01 0.06
HCO30.51 −0.75 0.23 0.57 0.56 −0.42
CO32−0.20 −0.78 −0.02 0.29 0.85 −0.28
F0.51 0.31 0.60 0.50 0.18 0.36
TDS0.95 0.24 −0.14 0.98 −0.08 0.11
PH−0.66 0.27 −0.33 −0.53 0.40 0.29
TH0.98 −0.04 −0.06 0.98 −0.01 −0.02
Eigenvalues7.75 1.93 1.06 8.33 1.50 1.02
Variance (%)59.60 14.84 8.18 64.05 11.55 7.86
Cumulative (%)59.60 74.44 82.62 64.05 75.59 83.45
Disclaimer/Publisher’s Note: The statements, opinions and data contained in all publications are solely those of the individual author(s) and contributor(s) and not of MDPI and/or the editor(s). MDPI and/or the editor(s) disclaim responsibility for any injury to people or property resulting from any ideas, methods, instructions or products referred to in the content.

