Abstract
Hongjiannao is the largest inland lake in China’s deserts. In recent years, the water quality and area of the Hongjiannao Lake have continued to decline, which is closely associated with the economic development in the Hongjiannao basin. To explore the coupling relationship between the water quality and economic development in the Hongjiannao basin, the water quality and economic development index of the basin has been analyzed in terms of the monthly water quality and socio-economic development from 2013 to 2020. The coupling relationship and interaction mechanism between water quality and regional economic development has been studied by coupling coordination degree model. The results show that the water pollution increased and then decreased with the seasons, while the water quality was the worst in the summer. The coordinated degree between the water quality and economic development in Hongjiannao shows an upward trend from 2013 to 2020, which has transformed from the process of lagging economic development to the process of primary coordination, finally to the process of lagging water environment. The coupling relationship between water quality and economic development changed from a state of nearly un-coordination to primary coordination from 2013 to 2016, with economic development lagging behind. The coupling relationship between the two systems changed from barely coordinated to the primary coordinated from 2017 to 2018, with the rapid development of economy and slight decline in water quality. After 2018, those two systems gradually stepped into a virtuous cycle during 2019–2020, but the phenomenon of lagging water quality still existed. Therefore, in order to maintain the stable economic development of resource-based cities, it is necessary to keep improving the current situation of water environment and water shortage in Hongjiannao, which will promote the coordinated and sustainable development of water environment and economy.
1. Introduction
Lakes play an important role in supplying freshwater, conserving water, improving climatic conditions, and maintaining regional ecological health [1,2]. However, since the 1940s, the rapid development of economy began to threaten the lake environment [1,3,4], such as shrinking lake area [5], eutrophication [6], accumulation of organic matter [7], and discharge of heavy metals [8]. The coordinative development of the economy and the lake environment has drawn more and more remarkable attention [9,10,11,12].
To alleviate the deterioration of basin environment and promote the coordinated development of water quality and social economy, the domestic and foreign scholars had put forward the environmental resource constraint theory, sustainable development theory, and coordination degree theory [13]. The theory of coordination degree has been widely used to study the relationship between environmental pollution and economic development [14], and the theory of coordination degree points out that environmental quality will show an obvious downward trend along with economic development in the early stage of economic development; environmental quality will be gradually improved and a virtuous cycle of development will be gradually realized with the economic development reaching a higher level [15,16,17]. The development of the regional economy was the key factor in coordinating and stabilizing the development between water quality of the lakes and social development. A previous study had quantitatively evaluated the environmental and economic coordination of Liaoning Province since 1990, and Liaoning Province had experienced a transformation from dissonance to primary coordination [18]. Many foreign research studies focus on quantitative analysis of sustainable development of resources, environment, society, and economy [19,20,21], Jones et al. studied the effects of climate and land-use changes on the lake environment in Southern Australia from 1840 to 1990, and Tamm T. et al. studied the effects of climate and hydrology on dissolved organic carbon load in Lake Vortsjarv (Estonia). Several researchers applied the coupling coordination model to analyze the relationship between water quality and economic development of the Fuxian lake basin in Yunnan province and the Minjiang river basin in Fujian province [22,23,24,25]. However, there is little information about the relationship of coupling coordination between water quality and economic development of the lake basin in the desert area of northwest China, and there is a lack of research on the internal relationship between pollutants (which could reflect the water quality, such as organic matter, total nitrogen, and total phosphorus) and economic development.
Hongjiannao, which is located in Shenmu County, Shaanxi Province, is the largest freshwater lake in western China [26], which is located in the border area between the Mu Us Desert and the Loess Plateau, and plays an important role in maintaining ecosystem stability. Shenmu County is a typical resource-based city near the Hongjiannao basin and has a population density of about 76 people/km2 and a per capita GDP of about 46,100 dollars; its economic level ranks the first among 108 counties in Shaanxi Province and the 9th among 1866 counties in China; its secondary industry accounts for more than 76% and its coal reserves are about 50 billion tons. At the present stage, most studies focused on the changes of water quality, water area, and their influencing factors in Shenmu County under the rapid development of industrial economy [27,28,29,30]. Few studies have described the coupling and coordination relationship between the change of water environmental quality and economic development.
In this study, based on water quality and economic development in the Hongjiannao basin from 2013 to 2020, the temporal evolution characteristics of the water environment in Hongjiannao were analyzed via SPSS one-way variance analysis and Daniel and Mann–Kendall trend test. Then, the coupling coordination relationship between water quality and regional socio-economic development was explored in terms of the comprehensive index method and coupling coordination degree model. Those findings will compensate the data of the coupling and coordination relationship between water quality and economic development in the Hongjianao basin. Meanwhile, this investigation aims to find the node where the water environment quality could be enhanced with the economic development kept stably increasing in order to keep sustainable development of the regional economy.
2. Methods and Materials
2.1. Study Area
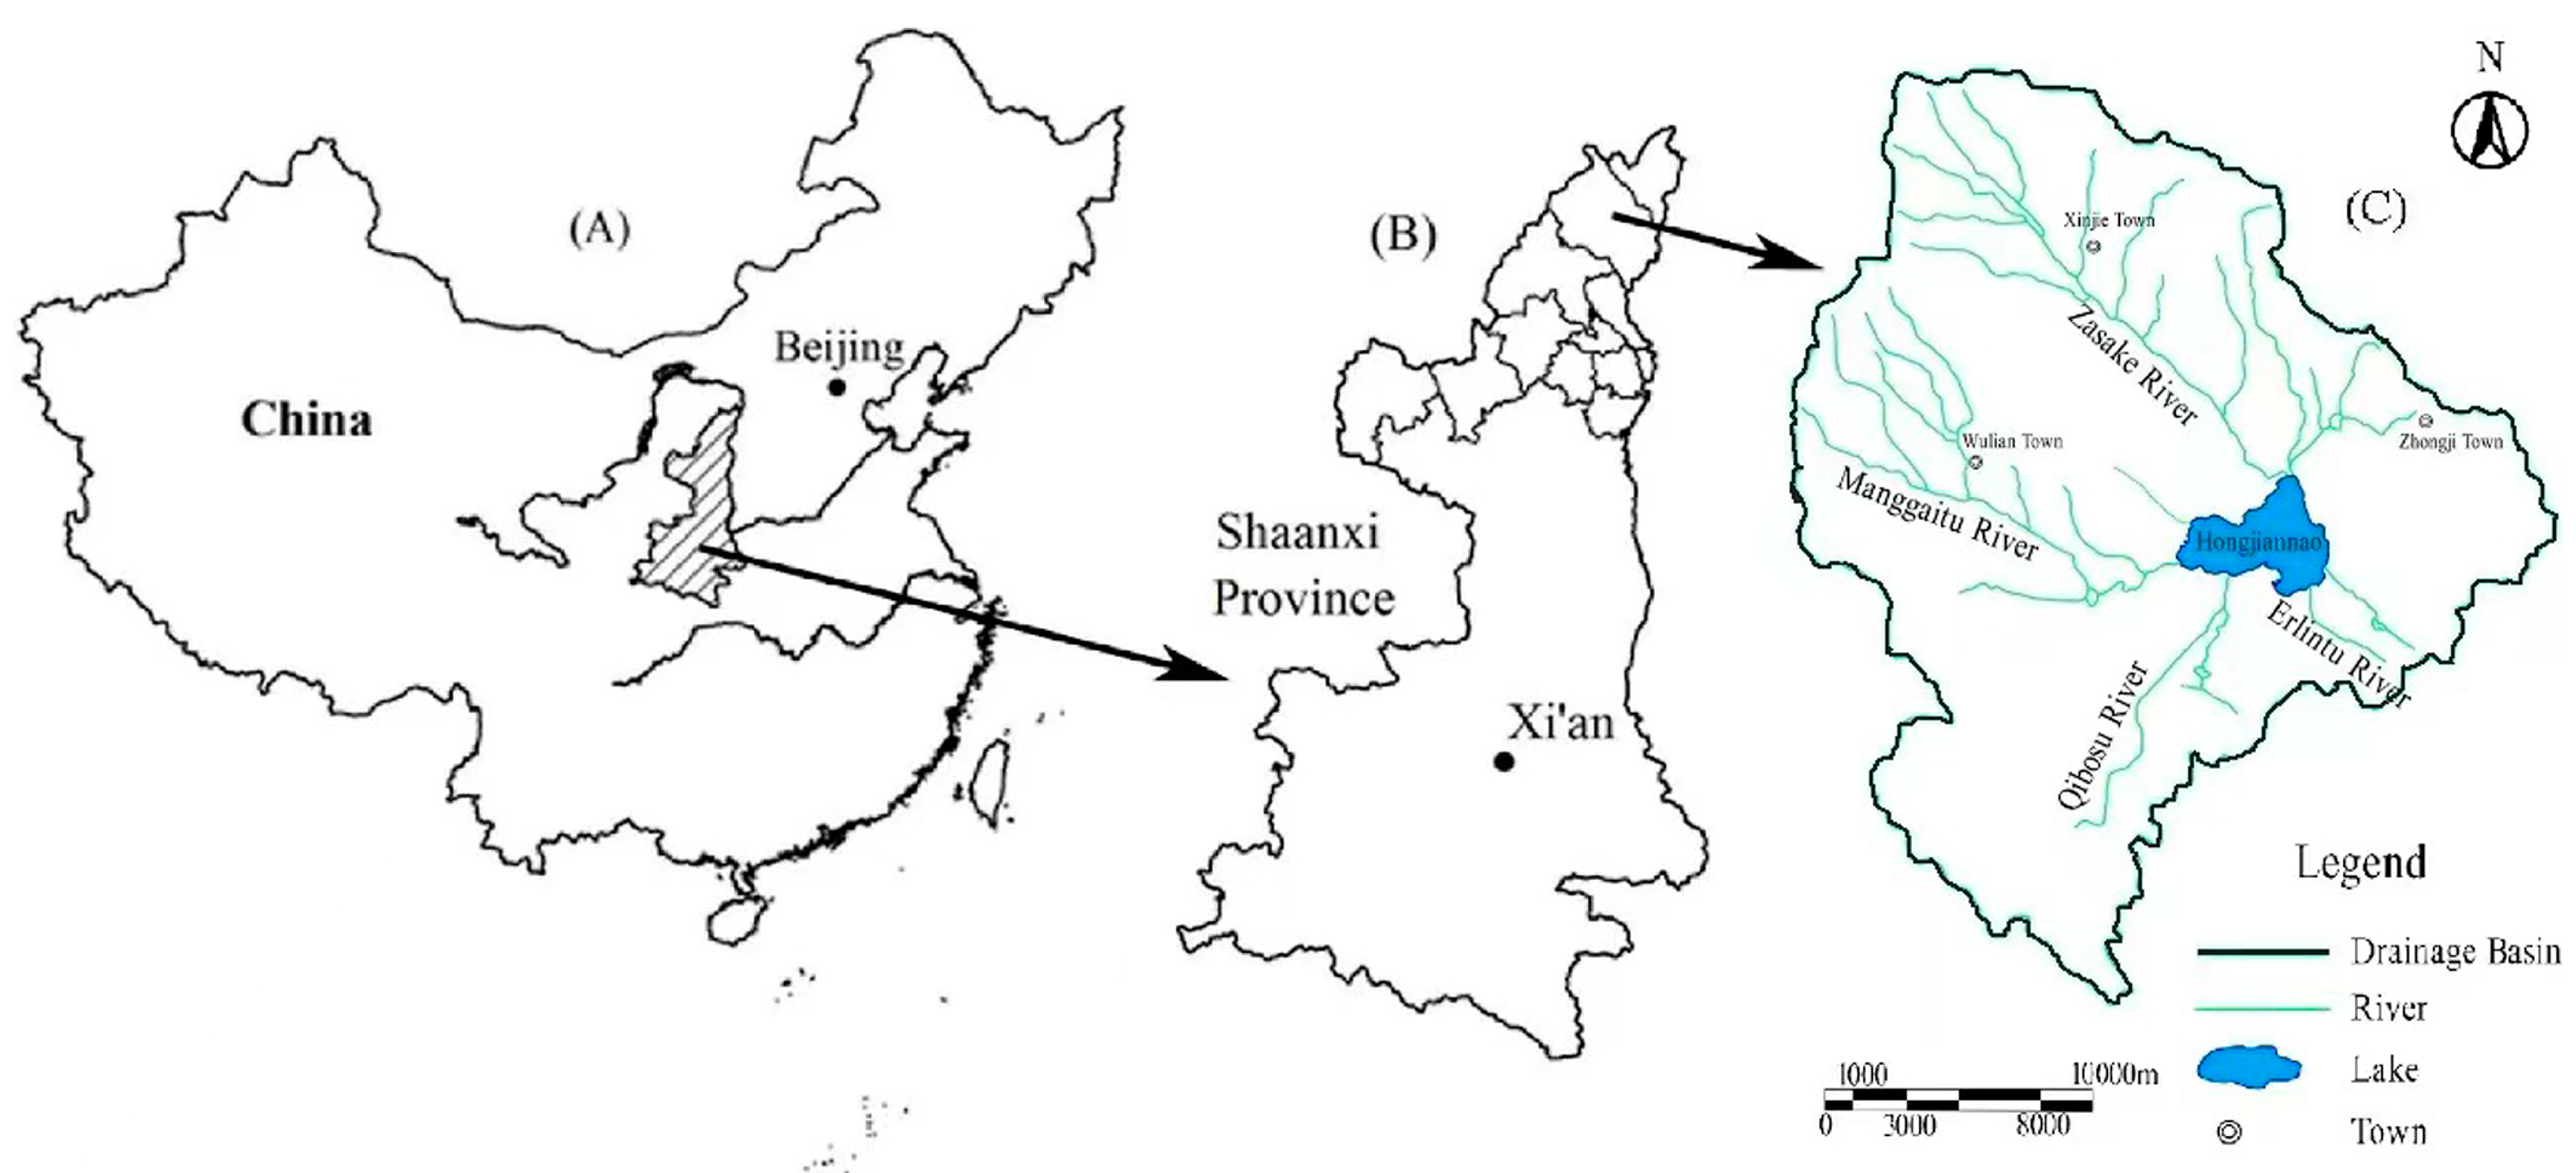
Hongjiannao is located in Shenmu City, Shaanxi Province, China (Figure 1). The geographical coordinates are 39°04′–39°08′ in the north latitude and 109°49′–109°56′ in the east longitude. The current area of Hongjiannao Lake is around 41.8 square kilometers, the altitude of Hongjiannao is around 1100 m, the climate property of Hongjiannao is the continental monsoon, the average of annual rainfall is around 346.8 mm, and the average of water depth is 8.2 m, and there are many kinds of aquatic life (Nitraria tangutorum, Salix cheilophila, etc.) [27]. With the rapid development of industry and tourism economy, the underground water supply of Hongjiannao has been damaged due to coal mining, while the water quality of Hongjiannao has been affected by the discharge of domestic sewage and mineralized mine wastewater [18].

Figure 1.
The location map of the Hongjiannao basin ((A) is for China, (B) is for Shaanxi, (C) is for Yulin).
2.2. Data Description
The water quality monitoring station of Hongjiannao Lake in Shenmu County was built in August of 2012 (http://www.cma.gov.cn/2011xzt/2013zhuant/20131126/2013112606/201311/t20131126_232560.html, accessed on 3 January 2021). The water quality of Hongjianao Lake had been detected from 2013 to 2020. The water quality cannot be effectively monitored from December to February of the next year due to the long ice sealing period in the winter. There are 10 indexes that have been used to evaluate the water quality (http://hb.yl.gov.cn/, accessed on 15 January 2021), including five-day biochemical oxygen demand (BOD5), dissolved oxygen (DO), permanganate index (CODMn), total phosphorus (TP), total nitrogen (TN), ammonia nitrogen (NH4+-N), volatile phenol, chemical oxygen demand (CODCr), petroleum, and anionic surfactant. All those indexes were detected according to the Surface Water Environmental Quality Standards (GB 3838-2002) [31].
Shenmu County has entered a stable period of economic development since 2012. There are 12 economic indicators that have been selected to evaluate the economic structure and economic benefits, and the date of economy was acquired from the Yulin Statistical Yearbook (2013–2020) and the Shenmu National Economic and Social Development Statistics Bulletin (2013–2020) (http://tjj.yl.gov.cn/, accessed on 10 February 2021).
2.3. Characteristics of Water Quality Evolution
2.3.1. Seasonal Differences of Water Quality
The least significant difference (LSD) method in single factor variance (one-way ANOVA) was used to present the characteristics of water quality with seasons, and the variance analysis was applied to compare the mean values of two or more samples for evaluating the water quality [32].
2.3.2. Interannual Variation Trend of Water Quality
The annual average value of each water quality index was calculated from the monthly data, and the Daniel trend test and Mann–Kendall trend test were used to present the changeable tendency of Hongjiannao [33]. The Daniel trend test is one of the most commonly methods to measure the environmental pollution; due to its low requirement for samples number, it is commonly used in trend analysis of time series. The Mann–Kendall trend test is a nonparametric statistical method, which only requires independent data and is not susceptible to outliers, but it has the disadvantage of not being able to detect specific patterns of trends. These two methods are selected to compare and verify each other, and the water quality change trend is more reasonable. [34].
The City Water Quality Index (CWQI) has been used to evaluate water environmental quality. The smaller the index is, the better the environmental quality is. Firstly, the arithmetic mean of the concentration of each individual index is calculated. Then, the water quality index for individual indicators is calculated . Finally, the lake water quality index is calculated comprehensively (https://www.mee.gov.cn/gkml/hbb/bgth/201606/t20160627_356096.htm, accessed on 8 November 2021).
where is the water quality index of a single index, is the monitoring value of the water quality index, is the standard limit of Class III of the water quality index, is the lake water quality index, and is the number of water quality indicators.
2.4. Coupling Model
2.4.1. Construction of Index System
The economic development is reflected by the increase of economic aggregate, the promotion of economic quality, and the improvement and optimization of economic structure [22,35]. There are 12 indicators (as shown in Table 1) that are used to present the social-economic development system of Shenmu County.

Table 1.
The evaluation indexes for the economic development and water quality in Hongjiannao.
2.4.2. Water Environment and Economic Development Index
To eliminate the influence of different indexes, the original data are standardized. The corresponding formulas are shown as follows:
The standardized formula for positive index is:
The standardized formula for negative indicators is:
In this study, the relative importance of each index was reflected by the sum-variation coefficient [32], which multiplies the standardized value to obtain the water environment index (f(x)) and the economic development index (g(x)). xi (i = 1, 2, 3... m) represents the standardized water quality index, xj (j = 1, 2, 3... n) is on behalf of the standardized economic development index, and wi and wj are the corresponding weights of xi and xj, respectively. f(x) and g(x) are obtained by the following formulas:
2.4.3. Coupling Coordination
Coupling degree is a physical concept, which could reflect the mutual influence caused by multiple interactions of two or more systems [33]. In this study, the coupling degree was applied to study the interrelation between water quality and economic development in the Hongjiannao basin, which is indicated by the formula below:
The coupling coordination degree model was also used to characterize the coordinated development between the water quality and economic development. A good coupling and coordination state is not only a benign correlation, but also a guarantee for the stable and sustainable development of each system [35]. Economic development was calculated via the following formulas:
In the formula, f(x) is the water environment index, while g(x) is the economic development index. C, T, and D represent the coupling degree, comprehensive harmonic index, and coupling coordination degree, respectively. α and β represent the contribution of water environment and economic development, separately. In this study, the water environment and economic development were assumed at the same status for the social development, α = β = 1/2. The classification of coupling-coordination types was shown in Table 2.
Table 2.
The types of coupling coordination between water environment and economy.
3. Results and Analysis
3.1. Variation of Water Quality
3.1.1. The Seasonal Variations in Water Quality
The water quality indexes of Hongjiannao from 2013 to 2020 are listed in Table 3. As shown, the content of DO was the lowest in the summer, while the dosage of BOD5, ammonia nitrogen, total nitrogen, total phosphorus, volatile phenol, chemical oxygen demand, petroleum, and anionic surfactant were the highest in the summer, which means that the water quality of Hongjiannao in the summer was the worst throughout the year. Meanwhile, there was no significant variation for the other indexes of water quality with the seasons (p < 0.05). Hence, the water quality of Hongjiannao in the summer was significantly worse than that in the other three seasons.
Table 3.
The variation of water indexes in Hongjiannao with seasons.
3.1.2. The Annual Variation of Water Quality
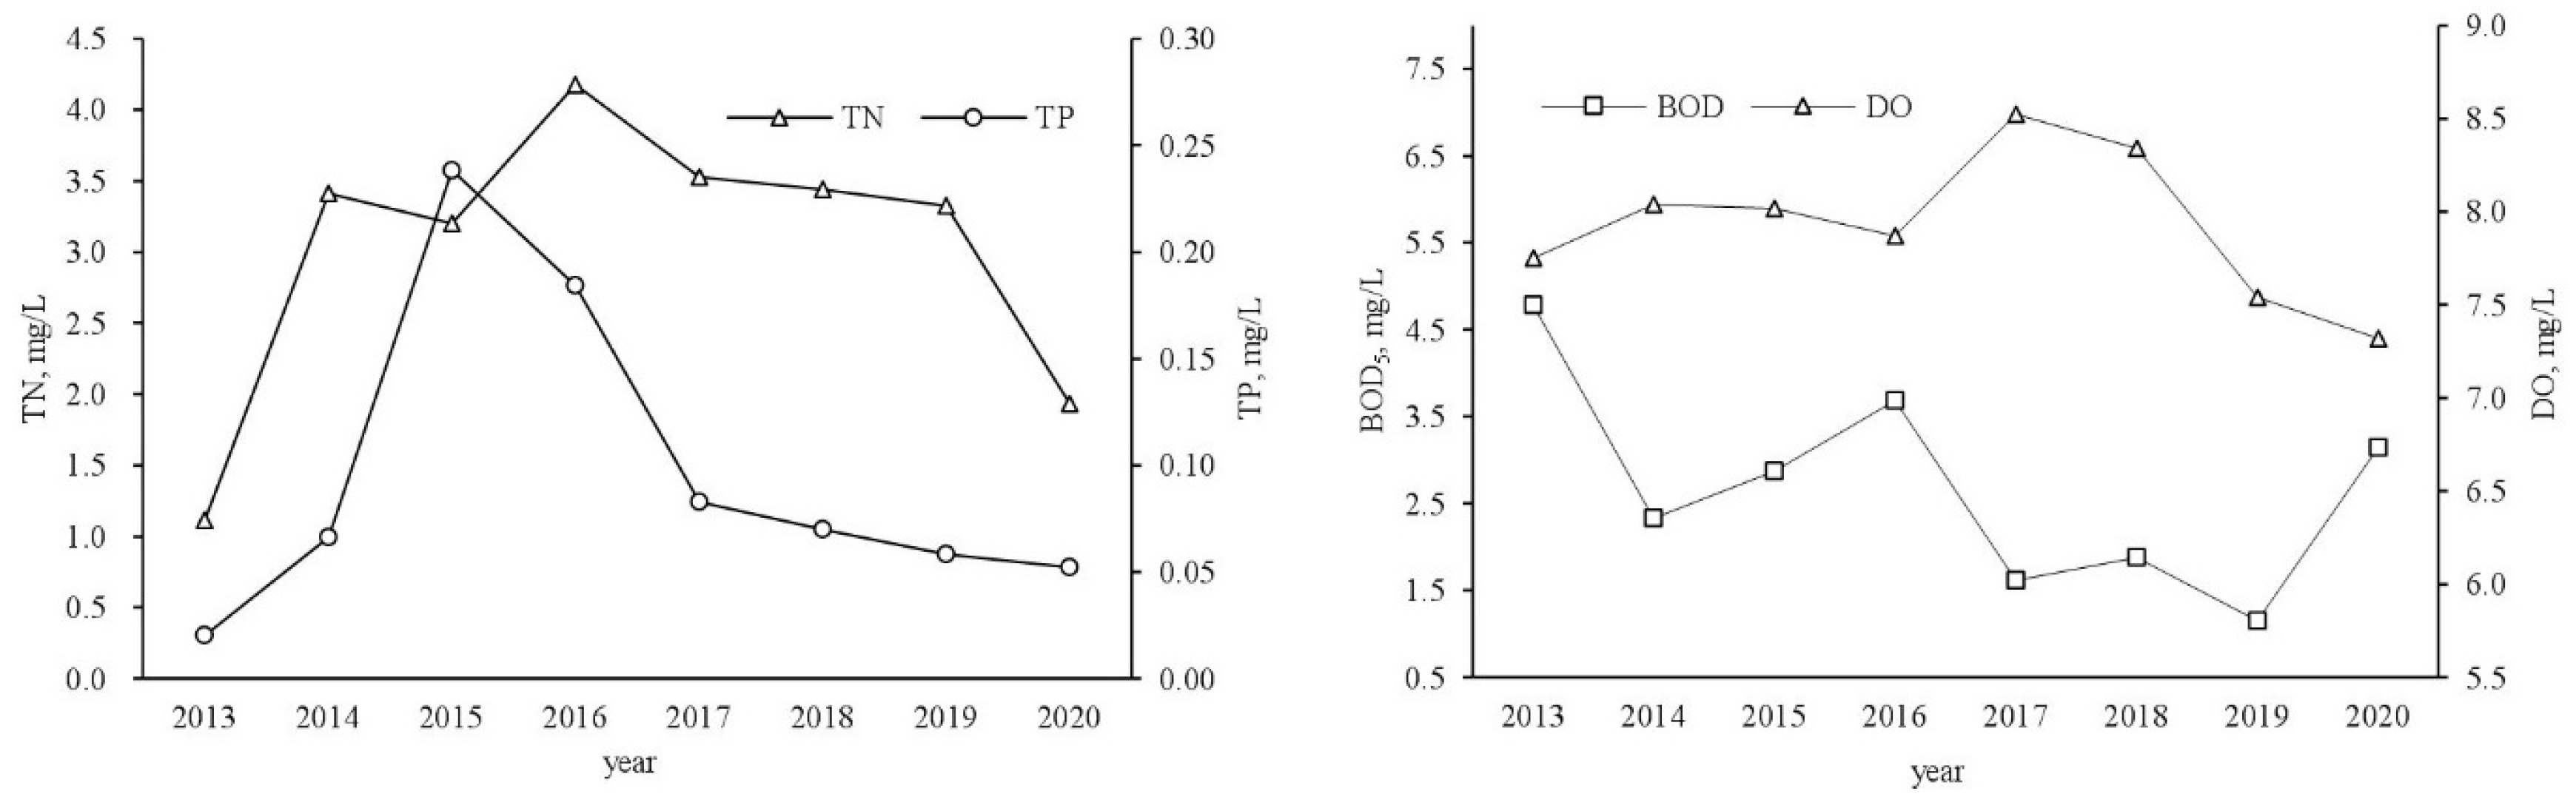
The annual variation of water quality in Hongjiannao was shown in Figure 2 in terms of DO, BOD5, TN, TP, and others. From 2013 to 2020, the DO, BOD5, and TP had a fluctuating downward tendency; the changeable tendency of DO was proportional with that of BOD5. From 2013 to 2016, the content of TN and TP behaved a significant increasing tendency, and the maximum of TN and TP reached 4.18 and 0.24 mg/L, respectively. Meanwhile, from 2014 to 2016, the level of BOD5 and DO increased first and then decreased. Thus, the water quality in Hongjiannao Lake gradually deteriorated with the acceleration of eutrophication before 2016. After 2016, the content of DO, BOD5, TN, and TP had a significant decreasing tendency over years, signifying the improvement of the water quality. This phenomenon was closely related to the regulation of the government for the water environment since 2017. Meanwhile, the decline of the coal economy of Shenmu city was another reason for the improvement in water quality of Hongjiannao Lake since 2015. Moreover, the content of DO kept declining and the dosage of TP became gradually stable since 2020, while the level of BOD5 began to increase again. Thus, the pollution extent of Hongjiannao Lake is still serious.

Figure 2.
The variation of TN, TP, BOD5, and DO in Hongjiannao Lake from 2013 to 2020.
The analytical results of the Daniel trend test and the Mann–Kendall trend test were shown in Table 4 in terms of 10 indexes of water quality, and the variation of those indexes had a similar tendency. From 2013 to 2020, the content of TN and COD kept increasing, whereas the other indexes continued to decrease to different extents, especially for the ammonia nitrogen and anionic surfactant. The pollution of water quality in Hongjiannao increased first, and then decreased with the years (Figure 2).
Table 4.
The results of Daniel test and Mann–Kendall test.
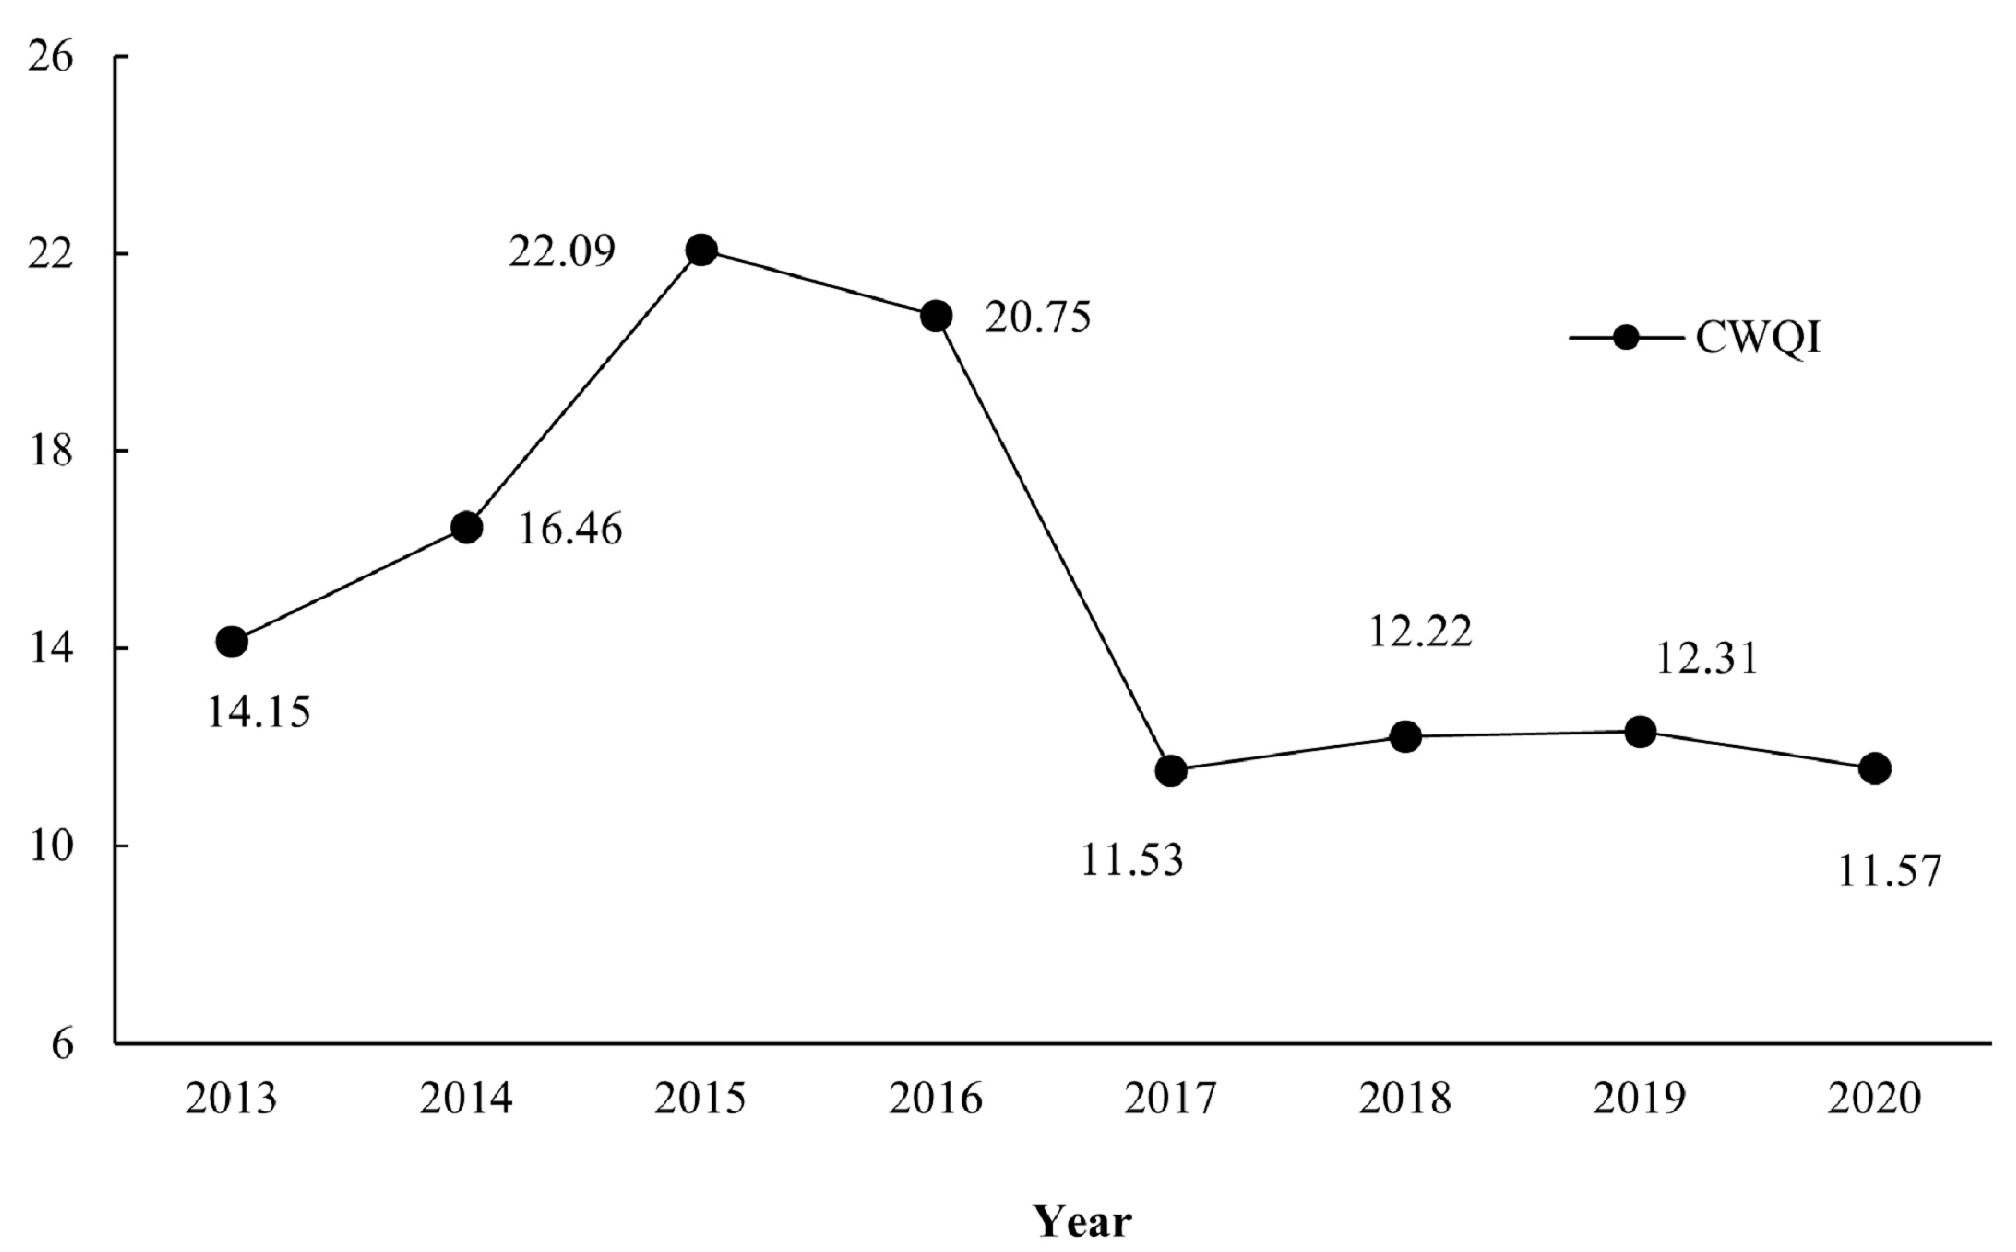
The value of Hongjiannao can be obtained via Formula (1) (Figure 3). From 2013 to 2020, the water quality showed an increasing trend first, and then decreased. Combined with Figure 2, the contents of total nitrogen and total phosphorus in 2015~2016 were 3.4~6.9 times of the Class Ⅲ standard limit in the “Surface Water Environmental Quality Standard” (GB3838-2002) [31], which is also the main reason for the high CWQI level. Shenmu County began to comprehensively implement the river chief system (http://www.sxsm.gov.cn/zwgk/jcxxgk/zfwj/szbf/12370.htm, accessed on 12 February 2022) after 2016, the local government closed and integrated small coal mines with less than 450,000 tons in the Hongjiannao Valley, which effectively improved the water quality. In 2020, the content of total nitrogen and total phosphorus was 1.1–1.8 times of the Class Ⅲ standard limit, indicating the water environment quality was significantly improved.

Figure 3.
The variation of CWQI index in Hongjiannao Lake from 2013 to 2020.
3.2. Coupling Coordination Analysis
3.2.1. Comprehensive Index Analysis
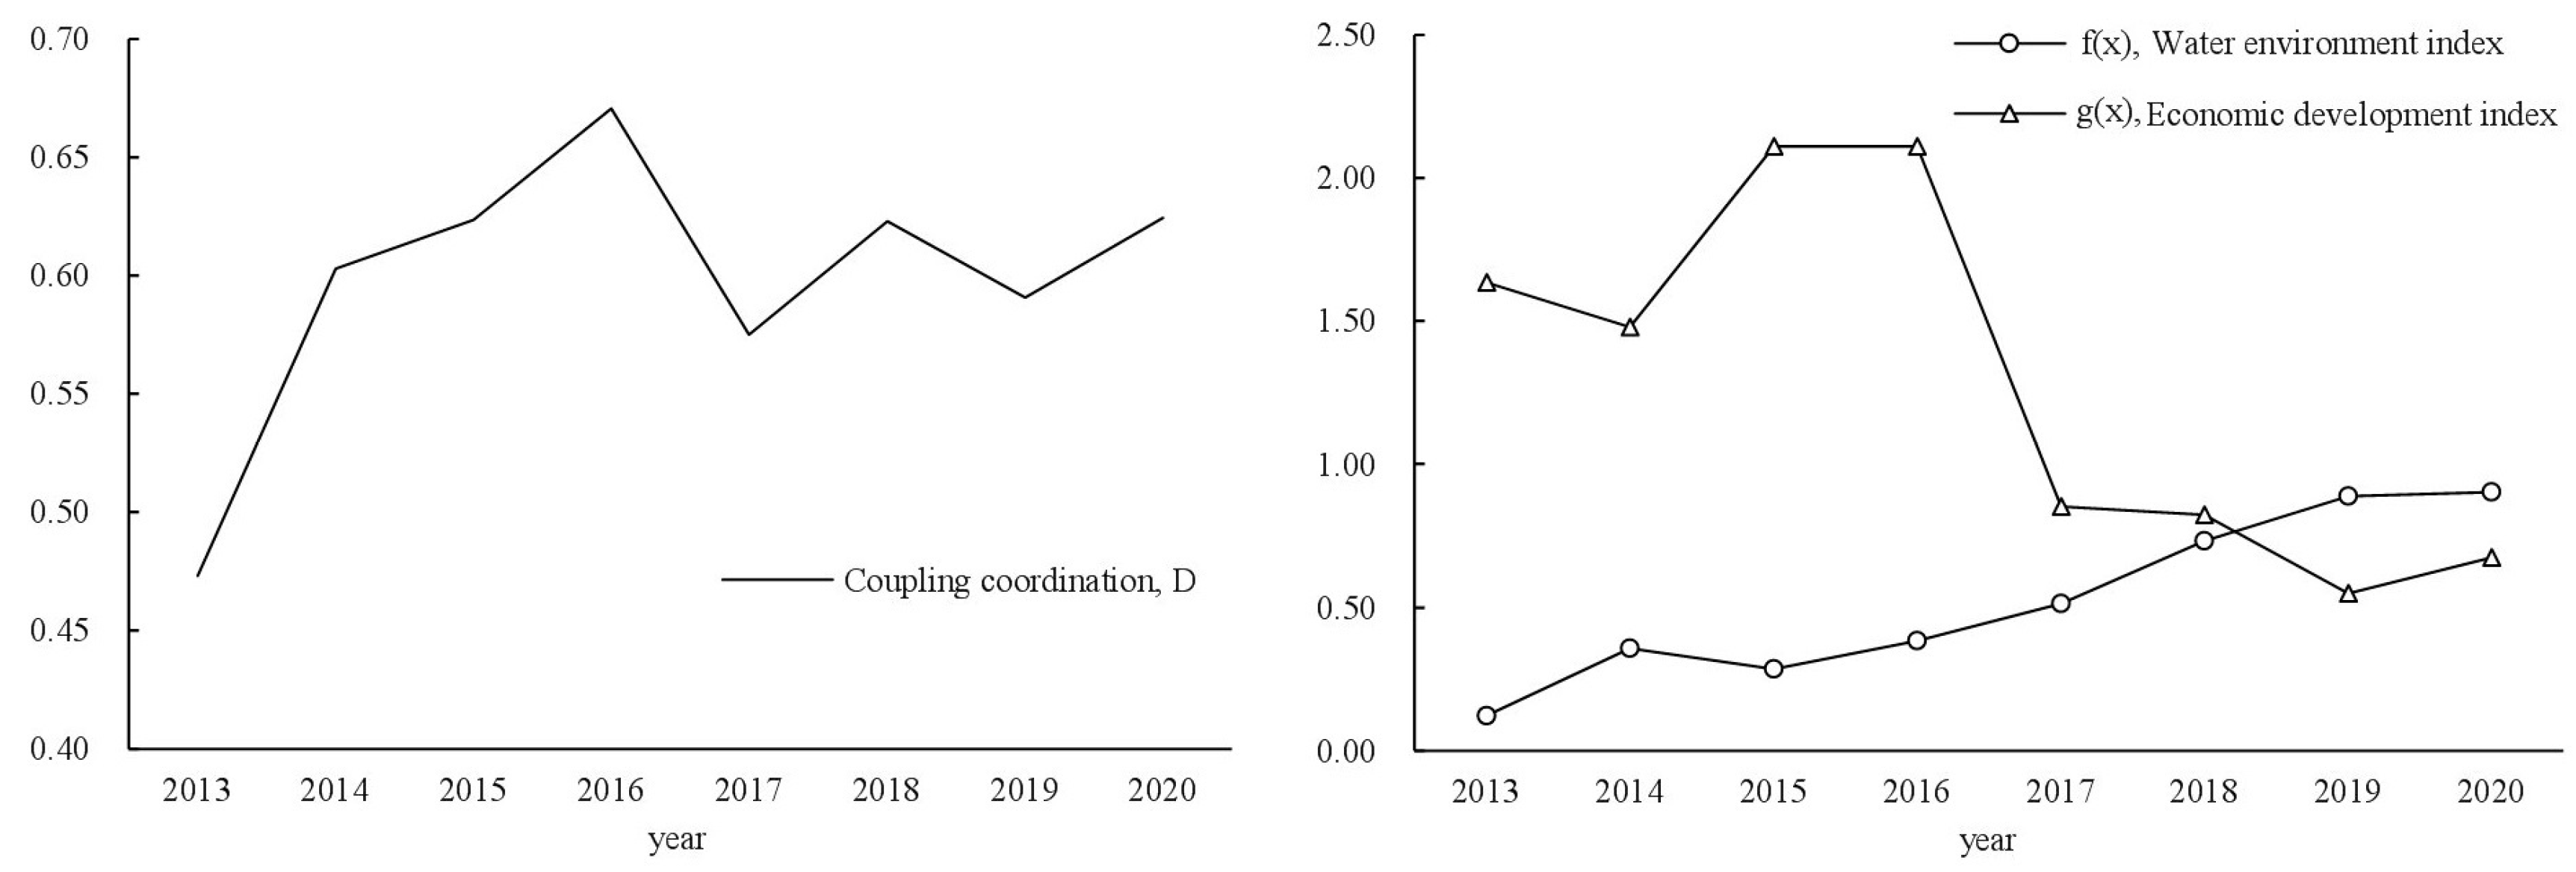
Figure 4 presents the dynamic change of the water quality and economic development in terms of f(x), g(x), and the level of coupling coordination. In detail, the water environment index showed a downward trend from 2013 to 2014; it increased rapidly to a stable level from 2014 to 2016; then, the water quality declined sharply from 2016 to 2019; and finally, it began to grow again in 2020. The changeable tendency of f(x) was consistent with the water quality over years. The economical level, scale, and structure kept rapidly increasing before 2015, and then they were on a downward trajectory due to the decline of the coal economy. Thus, the value of g(x) rose steadily with the years. Moreover the level of f(x) was lower than that of the g(x) during the early stage, and then gradually exceeded that of the g(x) during the later stage, which indicated that the economic development led to a significant impact on the water quality in Hongjiannao basin.
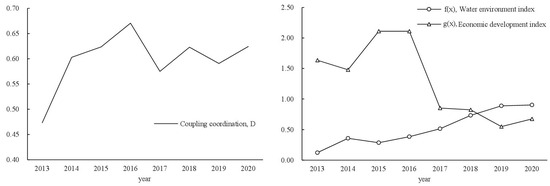
Figure 4.
Tha variation of coupling coordination, g(x), and f(x) in Hongjiannao basin from 2013 to 2020.
3.2.2. Change in Coupling Coordination Degree and Classification of Coupling Coordination Types
The coupling coordination index got a yielding point from 2016 to 2019 (Figure 4). Before the yielding point, the g(x) and f(x) behaved in a synchronous increasing trend from 2013 to 2016; thus, the degree of coupling coordination continued to increase during this period. After the yielding point, the level of g(x) kept declining from 2016 to 2019, while the content of f(x) continued to increase; therefore, the degree of coupling coordination began to decline. However, the level of coupling coordination has increased again since 2019.
As presented in Table 5, the degree of coupling coordination between the water quality and economic development showed an increasing trend with time. In 2013, the type of coupling coordination was at a transition period with the degree of coupling coordination at 0.473, which was ascribed to the lagging of the economic development. The average of coupling coordination was at 0.632 from 2014 to 2016, which was in the primary coordination stage. Being affected by the domestic economic downturn and falling coal prices, the economic development index declined with the enhancement in the water quality. From 2016 to 2019, with the acceleration of industrialization and urbanization, the socio-economic development level of the basin has been growing continuously. During this period, the discharge of industrial sewage and domestic sewage increased, the water environment was seriously polluted, and the water quality began to decline. In 2019, the water environmental quality index lagged behind, which began to restrict the coordinated and stable development of those two subsystems. The coupling coordination type decreased from the coordination period to the transition period, and the coupling coordination degree decreased from 0.671 to 0.591. From 2019 to 2020, the water environment index and economic development index began to increase synchronously, the coupling coordination degree increased to 0.624, and the coordination type entered the coordination period again.
Table 5.
The types of coupling coordination between water environment and economy in Hongjiannao basin.
4. Discussion
4.1. Analysis of Seasonal Variation of Water Quality in Hongjiannao Lake
According to the data of water quality with seasons in Hongjiannao from 2013 to 2020, the water quality of Hongjiannao Lake in the summer was the worst, which behaved significantly different with that in the spring; the content of TN, TP, and COD was significantly higher than the discharge standard. The reasons for the degraded water quality in the summer are as follows: (1) The Zhasak River and Manggaitu River are the main water replenishments for the Hongjiannao Lake, which accounts for more than 50% of the total water resources. The pollutants contained in the Zhasak River and Manggaitu River were seriously brought into Hongjiannao Lake in the summer; (2) the pesticides and fertilizers are widely used in the upstream and surrounding crops in the summer, especially for nitrogen fertilizer, those pollutants will enter the Hongjiannao Lake via the surface runoff. (3) Especially in recent years, the phenomenon of extreme high temperature in the summer occurs frequently, and microorganisms and organic matter proliferate in the lake, causing serious pollution to the water body. (4) With the economic development of Shenmu City, the urbanization construction did not keep the synchronous development with the environmental protection governance. The previous investigation also confirmed this phenomenon [30].
4.2. Interannual Variation Analysis of Hongjiannao Water Quality
In recent years, the area of Hongjiannao Lake continued to shrink. The pH of lake kept increasing, and even reached 9.5. The content of TN, TP, and other indexes were below the IV standard. The high level of pollution in Hongjiannao from 2013 to 2015 was mainly attributed to the discharge of chemical substances from the coal factory [18]. And then, the water quality of Hongjiannao continued to increase from 2016 to 2020. During this period, the improvement of water quality is closely related with the government regulation, which was confirmed by the previous study [11].
4.3. Coupling Coordination Analysis of Hongjiannao Water Environment and Socio-Economic Development
The degree of coupling coordination between water quality and economic development increased from 0.473 to 0.624 (from 2013 to 2020), indicating that the coupling coordination state changed from the nearly un-coordination state of the transition period to the primary coordination state of the coordination period. The coordinated development pattern between f(x) and g(x) is becoming more and more perfect. According to the development process of coupling coordination, Hongjiannao Lake has experienced three main steps: the lagging economic development, the primary coordination, and the lagging water environment.
In the early stage (2013–2016), f(x) and g(x) increased synchronously, while the coupling coordination degree increased from 0.473 to 0.671. At this stage, being affected by the international coal import and coal price decline, Shenmu County’s exhibition economy developed slowly, while the water quality increased. However, due to the low sewage treatment rate of urban sewage treatment plants, the contents of total nitrogen, total phosphorus, and in Hongjiannao Lake became higher.
In the interim phase (2017–2018), the economy of Shenmu County developed rapidly, the water quality declined to some extent, increased slightly, and the coupling coordination degree increased from 0.575 to 0.623. It is worth noting that the lagging state of economic development in this stage has changed (compared with the previous stage). In 2018, f(x) and g(x) basically reached the same level, meaning those two subsystems tended to be balanced. This is mainly related to the optimization of industrial structure and the improvement of sewage treatment rate in Shenmu County. The proportion of the secondary industry in Shenmu County increased from 67% to 71%, and the industrialization level changed from the intermediate stage to the advanced stage [18,36]. In addition, according to the Chinese government’s implementation of the river chief system (http://www.gov.cn/xinwen/2016–12/11/content_5146628.htm, accessed on 12 February 2022), Shenmu County raised the sewage discharge standard for coal mines, increased the recycling and utilization of mine drainage water, and reduced the discharge of highly mineralized industrial wastewater. The sewage treatment rate has increased from 82.9% to 88.7% (from 2015 to 2018).
During 2019–2020, the economic development of Shenmu County slowed down, and the water quality improved again, decreased, and the coupling coordination degree increased from 0.591 to 0.624. The industrial structure and sewage treatment rate of the basin were further improved, the high-end coal chemical industry replaced the original high-polluting enterprises, and the proportion of the secondary industry and sewage treatment rate has been increased to 77% and 93.4%, respectively. The economic development with low emission and high efficiency gradually has been achieved preliminarily. However, there are still some problems restricting economic development, such as water shortage [37], the low level of coupling coordination degree, and the gap between the normal situation and the advanced coordination state. Therefore, with the rapid economic development, we need to strengthen the control of water environmental pollution and promote the coordinated and sustainable development of the water environment and economy in the river basin.
5. Conclusions
This paper analyzes the changeable trend of water quality in Hongjiannao basin and investigates the coupling and coordination development status between water quality and economic development, which provides a theoretical basis for the coordinated development of water pollution treatment and economy. The main conclusions were shown as follows:
- (1)
- The water quality of Hongjiannao in the summer was worse than that in the spring and autumn. And, the water quality of Hongjiannao behaved with an increasing tendency from 2013 to 2020.
- (2)
- The degree of coupling coordination in Hongjiannao Lake was at the middle level, and its level increased first, and then decreased, and finally raised again. From 2013 to 2020, the development of coupling coordination in Hongjiannao basin expired three steps: the lagging economic development, the primary coordination, and the lagging water environment.
- (3)
- It can be seen that under the influence of urbanization, industrialization, and extreme hot weather, lake water levels have fallen, pollution is serious, and water resources are stressed. Therefore, governments at all levels should increase investment and management of pollution control, reduce the discharge of untreated sewage into water bodies, and adopt membrane treatment and other technologies to improve the efficiency of recycled water recovery and realize the resource utilization of sewage, especially in China and other developing countries in the world. Economic development promotes the improvement of water quality, and a good water environment also provides a guarantee for sustainable economic development.
Author Contributions
Conceptualization, Z.L. and S.C.; methodology, P.L.; software, T.L.; formal analysis, H.Z.; investigation, S.Z.; writing—review and editing, X.L.; supervision, Y.W.; project administration, X.Z.; funding acquisition, Z.M. All authors have read and agreed to the published version of the manuscript.
Funding
This study was financially supported by [the National Natural Science Foundation of China] grant number [No. 52170053, 52179043, 51779204] and [the National Forestry and Grassland Administration independent research and development program of China] grant number [No. LC-6-06] and [Yulin City Science and technology plan project] grant number [YF-2022-197] and [Yulin High-tech Zone Science and technology plan project] grant number [ZD-2021-08, YGXKG-2022-107]. The research was conducted by the “Water Saving and Reuse Innovation Team” which is supported by the Educational Department of the Shaanxi Provincial Government under The Youth Innovation Team of Shaanxi Universities.
Data Availability Statement
The datasets used and/or analysed during the current study are available from the corresponding author on reasonable request.
Conflicts of Interest
The authors declare no conflict of interest.
References
- Yang, G.; Ma, R.; Zhang, L.; Yao, S.; Zhang, M.; Zeng, H. Lake status, major problems and protection strategy in China. J. Lake Sci. 2010, 22, 799–810. [Google Scholar]
- Sellinger, C.E.; Stow, C.A.; Lamon, E.C.; Qian, S.S. Recent Water Level Declines in the Lake Michigan−Huron System. Environ. Sci. Technol. 2008, 42, 367. [Google Scholar] [CrossRef]
- Song, J.X.; Tang, B.; Zhang, J.L.; Dou, X.Y.; Liu, Q.; Shen, W.B. System dynamics simulation for optimal stream flow regulations under consideration of coordinated development of ecology and socio-economy in the Weihe River Basin, China. Ecol. Eng. 2018, 124, 51–68. [Google Scholar] [CrossRef]
- Cohen, J.E. Population growth and earth’s human carrying capacity. Science 1995, 269, 341–346. [Google Scholar] [CrossRef] [PubMed]
- Cao, H.; Han, L.; Liu, Z.; Li, L. Monitoring and driving force analysis of spatial and temporal change of water area of Hongjiannao Lake from 1973 to 2019. Ecol. Inform. 2021, 61, 101230. [Google Scholar] [CrossRef]
- García-Nieto, P.; García-Gonzalo, E.; Alonso-Fernández, J.; Díaz-Muñiz, C. Using evolutionary multivariate adaptive regression splines approach to evaluate the eutrophication in the Pozón de la Dolores lake (Northern Spain). Ecol. Eng. 2016, 94, 136. [Google Scholar] [CrossRef]
- Chang, J.; Zhang, E.; Liu, E.; Liu, H.; Yang, X. A 60-year historical record of polycyclic aromatic hydrocarbons (PAHs) pollution in lake sediment from Guangxi Province, Southern China. Anthropocene 2018, 24, 51–60. [Google Scholar] [CrossRef]
- Ioannides, K.; Stamoulis, K.; Papachristodoulou, C.; Tziamou, E.; Markantonaki, C.; Tsodoulos, I. Distribution of heavy metals in sediment cores of Lake Pamvotis (Greece): A pollution and potential risk assessment. Environ. Monit. Assess. 2014, 187, 4209. [Google Scholar] [CrossRef]
- Zhang, K.M.; Wen, Z.G. Review and challenges of policies of environmental protection and sustainable development in China. J. Environ. Manag. 2008, 88, 1249. [Google Scholar] [CrossRef] [PubMed]
- Joshi, A.; Seth, G. Hydrochemical profile for assessing the groundwater quality of Sambhar lake City and its Adjoining area. Environ. Monit. Assess. 2011, 174, 547. [Google Scholar] [CrossRef]
- Zhang, N.; Wu, T.; Wang, B.; Dong, L.; Ren, J.Z. Sustainable water resource and endogenous economic growth. Technol. Forecast. Soc. Chang. 2016, 112, 237–244. [Google Scholar] [CrossRef]
- Gao, W.; Chen, Y.; Xu, M.; Guo, H.C.; Xie, Y.C. Trend and driving factors of water quality change in Lake Fuxian (1980–2011). J. Lake Sci. 2013, 25, 635–642. [Google Scholar]
- Haken, H. Synergetics are cooperative phenomena governed by universal principles. Naturwissenschaften 1980, 67, 121. [Google Scholar] [CrossRef]
- Liu, N.N.; Liu, C.Z.; Xia, Y.F.; Da, B. Examining the coordination between urbanization and eco-environment using coupling and spatial analyses: A case study in China. Ecol. Indic. 2018, 93, 1163–1175. [Google Scholar] [CrossRef]
- Ouyang, X.; Shao, Q.; Zhu, X.; He, Q.; Xiang, C.; Wei, G. Environmental regulation, economic growth and air pollution: Panel threshold analysis for OECD countries. Sci. Total Environ. 2019, 657, 234–241. [Google Scholar] [CrossRef]
- Xie, Q.; Xu, X.; Liu, X. Is there an EKC between economic growth and smog pollution in China? New evidence from semiparametric spatial autoregressive models. J. Clean. Prod. 2019, 220, 873–883. [Google Scholar] [CrossRef]
- Isik, C.; Ongan, S.; Özdemir, D. The economic growth development and environmental degradation: Evidence from the US state-level EKC hypothesis. Environ. Sci. Pollut. Res. 2019, 26, 30772–30781. [Google Scholar] [CrossRef]
- Liu, L.; Qiu, X.; Zhang, M.; Li, Y. Main Environmental Impact of Coal Exploitation on Hongjiannao Lake and Protective Measures. Yellow River 2019, 41, 59–62. [Google Scholar]
- Jones, R.N.; McMahon, T.A.; Bowler, J.M. Modelling historical lake levels and recent climate change at three closed lakes, Western Victoria, Australia (c.1840–1990). J. Hydrol. 2001, 246, 159–180. [Google Scholar] [CrossRef]
- Tamm, T.; Tiina, N.; Arvo, J.; Faycal, B. Contributions of DOC from surface and groundflow into Lake Võrtsjärv (Estonia). Hydrobiologia 2008, 599, 213–220. [Google Scholar] [CrossRef]
- Ronchi, E.; Federico, A.; Musmeci, F. A system oriented integrated indicator for sustainable development in Italy. Ecol. Indic. 2002, 2, 197–210. [Google Scholar] [CrossRef]
- Zhang, S.; Zhang, L.; Li, G.; Li, C.; Wu, Z. Coordination analysis between water quality and economic development in Lake Qiandao basin. J. Lake Sci. 2014, 26, 948–954. [Google Scholar]
- Rao, Q.; Lin, X.; Li, J.; Chen, Q.; Chen, W. Analysis of coupling coordination between social economy and water environment quality in river basin. China Environ. Sci. 2019, 39, 1784–1792. [Google Scholar]
- Xu, G.C.; Cheng, Y.T.; Zhao, C.Z.; Mao, J.S.; Li, Z.B.; Jia, L.; Zhang, Y.X.; Wang, B. Effects of driving factors at multi-spatial scales on seasonal runoff and sediment changes. Catena 2023, 222, 106867. [Google Scholar] [CrossRef]
- Liu, X.J.; Zhang, Y.; Zhang, L.; Fang, X.M.; Deng, W.P.; Liu, Y.Q. Aggregate-associated soil organic carbon fractions in sub-tropical soil undergoing vegetative restoration. Land Degrad. Dev. 2023, 72, 446–459. [Google Scholar]
- Zhuo, J.; Zhu, Y.; Wang, J.; He, H.; Zou, J. Spatio-temporal Change of Water Area in Hongjiannao Lake and the Effectiveness of Protection Measures. J. Desert Res. 2019, 39, 195–203. [Google Scholar]
- Zhang, G.; Yao, T.; Chen, W.; Zheng, G.; Shum, C.K.; Yang, K.; Piao, S.; Sheng, Y.; Yi, S.; Li, J.; et al. Regional differences of lake evolution across China during 1960s–2015 and its natural and anthropogenic causes. Remote Sens. Environ. 2019, 221, 386–404. [Google Scholar] [CrossRef]
- Borsuk, M.E.; Stow, C.A.; Reckhow, K.H. A bayesian network of eutrophication modles for synthesis prediction and uncertainty analysis. Ecol. Model. 2004, 173, 219–239. [Google Scholar] [CrossRef]
- Zhao, M.; Xu, Y.; Zhang, C.; Rong, H.; Zeng, G. New trends in removing heavy metals from wastewater. Appl. Microbiol. Biotechnol. 2016, 100, 6509–6518. [Google Scholar] [CrossRef]
- Paer, H.W. Assessing and Managing Nutrient Enhanced Eutrophicationin Estuarine and Coastal Waters: Interactive Effects of Human and Climatic Perturbations. Ecol. Eng. 2006, 26, 40–54. [Google Scholar] [CrossRef]
- GB 3838-2002; Surface Water Environmental Quality Standards, China. 2002. Available online: https://www.mee.gov.cn/ywgz/fgbz/bz/bzwb/shjbh/shjzlbz/200206/t20020601_66497.shtml (accessed on 12 February 2022).
- Zhang, G.; Christensen, R.; Pesko, J. Parametric boostrap and objective Bayesian testing for heteroscedastic one-way ANOVA. Stat. Probab. Lett. 2021, 174, 109095. [Google Scholar] [CrossRef]
- Das, S.; Banerjee, S. Investigation of changes in seasonal streamflow and sediment load in the Subarnarekha-Burhabalang basins using Mann-Kendall and Pettitt tests. Arab. J. Geosci. 2021, 14, 946. [Google Scholar] [CrossRef]
- Xin, Z. Study on the Water Environment of Larus Relictus Nature Reserve in Erdos Plateau. Ph.D. Thesis, Beijing Forestry University, Beijing, China, 2015. (In Chinese). [Google Scholar]
- Yang, H.; Zhong, Y.; Luo, L.; Tian, X.; Wang, Z. Water Quality Evaluation and Characteristics Analysis of Xinghai Lake Wetland Based on Bayesian Method. Water Sav. Irrig. 2018, 4, 92–95. [Google Scholar]
- Wang, Q.; Su, M. The effects of urbanization and industrialization on decoupling economic growth from carbon emission—A case study of China. Sustain. Cities Soc. 2019, 51, 101758. [Google Scholar] [CrossRef]
- Labhasetwar, P.K.; Yadav, A. Membrane Based Point-of-Use Drinking Water Treatment Systems; IWA Publishing: London, UK, 2023. [Google Scholar]
Disclaimer/Publisher’s Note: The statements, opinions and data contained in all publications are solely those of the individual author(s) and contributor(s) and not of MDPI and/or the editor(s). MDPI and/or the editor(s) disclaim responsibility for any injury to people or property resulting from any ideas, methods, instructions or products referred to in the content. |
© 2023 by the authors. Licensee MDPI, Basel, Switzerland. This article is an open access article distributed under the terms and conditions of the Creative Commons Attribution (CC BY) license (https://creativecommons.org/licenses/by/4.0/).