Article

Optimized Design of Sponge-Type Comprehensive Pipe Corridor Rainwater Chamber Based on NSGA-III Algorithm

1
School of Water Conservancy, Yunnan Agricultural University, Kunming 650500, China
2
School of Civil Engineering and Architecture, Zhengzhou University of Aeronautics, Zhengzhou 450046, China
3
Yunnan Jiaofa Consulting Co., Kunming 650100, China
*
Author to whom correspondence should be addressed.
Water 2023, 15(18), 3319; https://doi.org/10.3390/w15183319
Submission received: 28 July 2023 / Revised: 18 September 2023 / Accepted: 19 September 2023 / Published: 21 September 2023

Abstract

:
Currently, most of the studies using optimization algorithms to mitigate the urban flooding problem have no more than three optimization objectives, and few of them take the operation status of the traditional drainage system as one of the optimization objectives, which is not conducive to the overall design of the city. This study proposes to mitigate the urban flooding problem by using a sponge-type comprehensive pipe corridor rainwater chamber. A four-objective optimization model is established by coupling the Storm Water Management Model (SWMM) and the Non-dominated Sorting Genetic Algorithm-III (NSGA-III), and two traditional drainage system state indicators (pipe overload time, node overflow volume), surface runoff coefficient, and total investment cost are selected as the optimization objectives for solving the problem. The results show that (1) the reduction rates of surface runoff coefficient, pipe overload time, and node overflow volume rate by the optimization model are 37.015–56.917%, 81.538–91.435%, and 51.578–84.963%, respectively; and the total investment cost is RMB 4.311–4.501 billion. (2) The effectiveness of combining SWMM and NSGA-III for an optimization solution is verified, and the relationship between the four objectives is explored. The study may provide useful information for urban flood control.

1. Introduction

Nowadays, with global warming and accelerated urbanization, high-intensity rainstorms occur frequently [1], and urban flooding will become more severe [2,3]. Urban flooding not only causes economic losses by damaging public facilities such as buildings and transportation in cities but also poses a serious threat to the safety of citizens’ lives and properties [4,5]. Therefore, how to effectively solve the problem of urban flooding has attracted a lot of attention from various parties around the world [6].
There are currently two methods to mitigate urban flooding. The first method is to optimize and upgrade the rainwater pipe network system, which can also combine optimization algorithms and hydrodynamic models to optimize the layout of the rainwater pipe network and reduce the corresponding construction costs [7,8,9,10,11]. The second method is to use Low Impact Development (LID) techniques to mitigate urban flooding. LID is a rainwater management concept that refers to minimizing the environmental impact of land development and maintaining surface runoff at natural levels [12]. In the early stages, scholars mainly studied the runoff reduction effect of a single LID measure [13,14,15]. Subsequent studies have shown that combination LID measures have better results in increasing surface infiltration and reducing runoff and are widely used in the construction of sponge cities [16,17,18,19]. In addition, the current, more widely used comprehensive pipe corridor rainwater chamber has a significant effect on the mitigation of urban flooding [20]. The construction goals of future sponge cities include not only the alleviation of urban flooding problems but also rainwater harvesting, ecological restoration, etc. The balance between multiple goals should be considered comprehensively to determine the best design solution [21].
The combination of hydrological models and multi-objective optimization algorithms is a very effective optimization method, and the more widely used hydrological models are the Storm Water Management Model (SWMM), InfoWorks Integrated Catchment Management (InfoWorks ICM), Stormwater treatment and analysis integration SUSTAIN, Digital Water Drainage System (Digital Water DC), etc. [22,23]. Among the existing optimization methods, genetic algorithms (GA), particle swarm algorithms (PSO), and simulated annealing (SA) are considered to be some of the most suitable optimization algorithms to deal with this type of problem [17,24,25]. Lopes and da Silva et al. [21] combined the SWMM model and NSGA-II algorithm to obtain the best design solution for LID by considering the relationship between investment cost and surface runoff at different rainfall intensities. Boyuan Yang et al. [26] calibrated the parameters of the LID module in the SWMM model by conducting LID experiments, combined the SWMM model with the NSGA-II algorithm to optimize the solution by minimizing the overload time of the pipe section, minimizing the integrated surface runoff coefficient, and minimizing the total investment cost as the objectives, and obtained a set of optimal solution sets. Long Chen et al. [27] proposed a low-impact development method based on the SWMM model and NSGA-II to simulate and evaluate the combined benefits under different spatial layout schemes.
An increasing number of studies have been published in the field of urban flood control, but the study area is generally small, and these studies have limitations when the study area is large. In addition, although LID measures are often combined with traditional urban drainage systems to control stormwater runoff and optimization algorithms are often combined with stormwater flood management models to build optimization models, very few studies have included the operational status of traditional drainage systems as part of the optimization objective. Most scholars choose to combine the SWMM model and the NSGA-II algorithm to build an optimization model with three objectives or less than three objectives, but when the optimization objectives are greater than three, the optimization effect of the NSGA-III algorithm is more significant than that of the NSGA-II algorithm. The current research on the combination of the NSGA-III and SWMM models to build a model with more than three objectives is still relatively limited. The concept of combining a comprehensive pipe corridor rainwater chamber and combination LID measures to form a sponge-type comprehensive pipe corridor rainwater chamber system to alleviate urban flooding is a more advanced concept, so it is necessary to carry out new research to supplement the existing research results.
In this context, the main objectives of this paper are: (1) Combining the comprehensive pipe corridor rainwater chamber and LID measures to form a sponge-type comprehensive pipe corridor rainwater chamber system to alleviate the urban flooding problem. (2) Construct a four-objective optimization model by combining the SWMM model and NSGA-III to obtain an optimized solution by taking into account two traditional drainage system state indicators (pipe overload time, node overflow volume), surface runoff coefficient, and the total investment cost. (3) Verify the feasibility and effectiveness of the NSGA-III optimization algorithm in this field. (4) Explore the relationship between the four objectives and provide reasonable construction suggestions for the design of rainwater chambers in sponge-type comprehensive pipeline corridors.

2. Materials and Methods

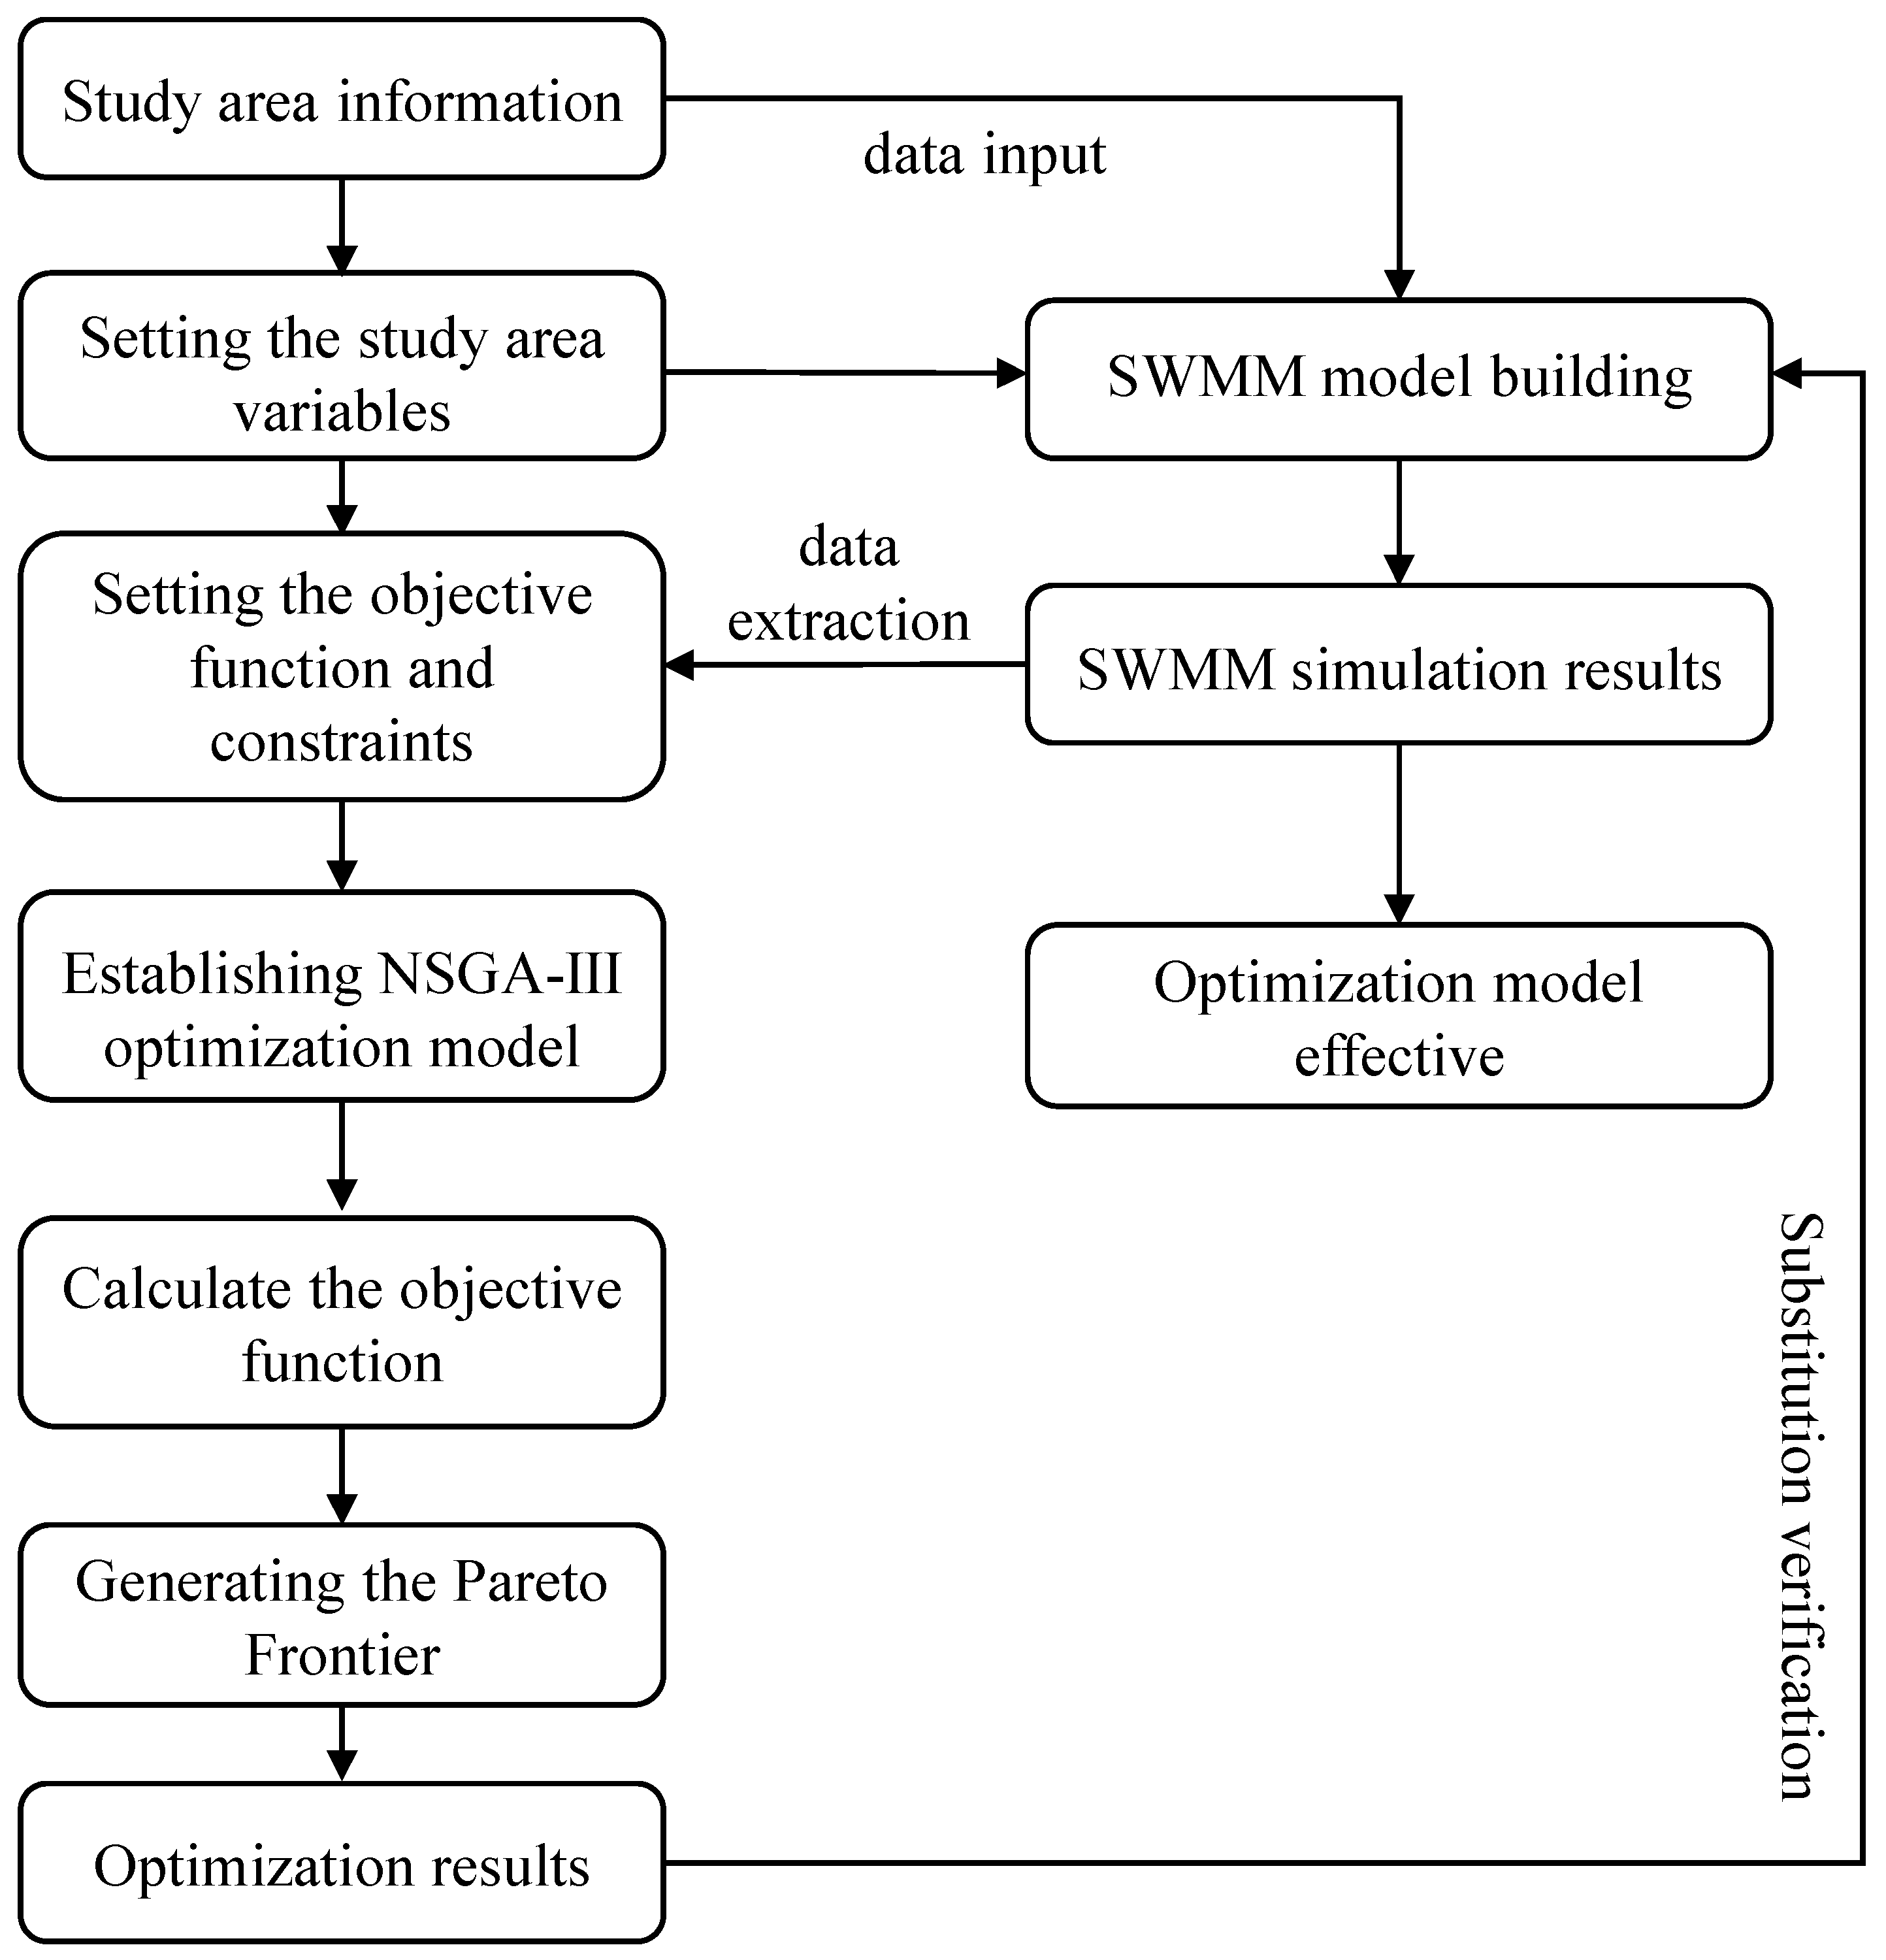
The overall flow chart of this study is shown in Figure 1.

2.1. Scheme Design

Based on the planning information for the study area, the following four design schemes were set up in this study: ① Comprehensive pipe corridor rainwater chamber scheme; ② combination LID measures scheme; ③ manual optimization scheme; ④ NSGA-III optimization model scheme. The first three schemes are manual, subjective design schemes. In addition to this, a control group is set up with the initial design scheme, which is established based on the existing planning and design information of the study area without adding any measures. The hierarchical recursion of several design schemes is shown in Figure 2.

2.2. Study Area

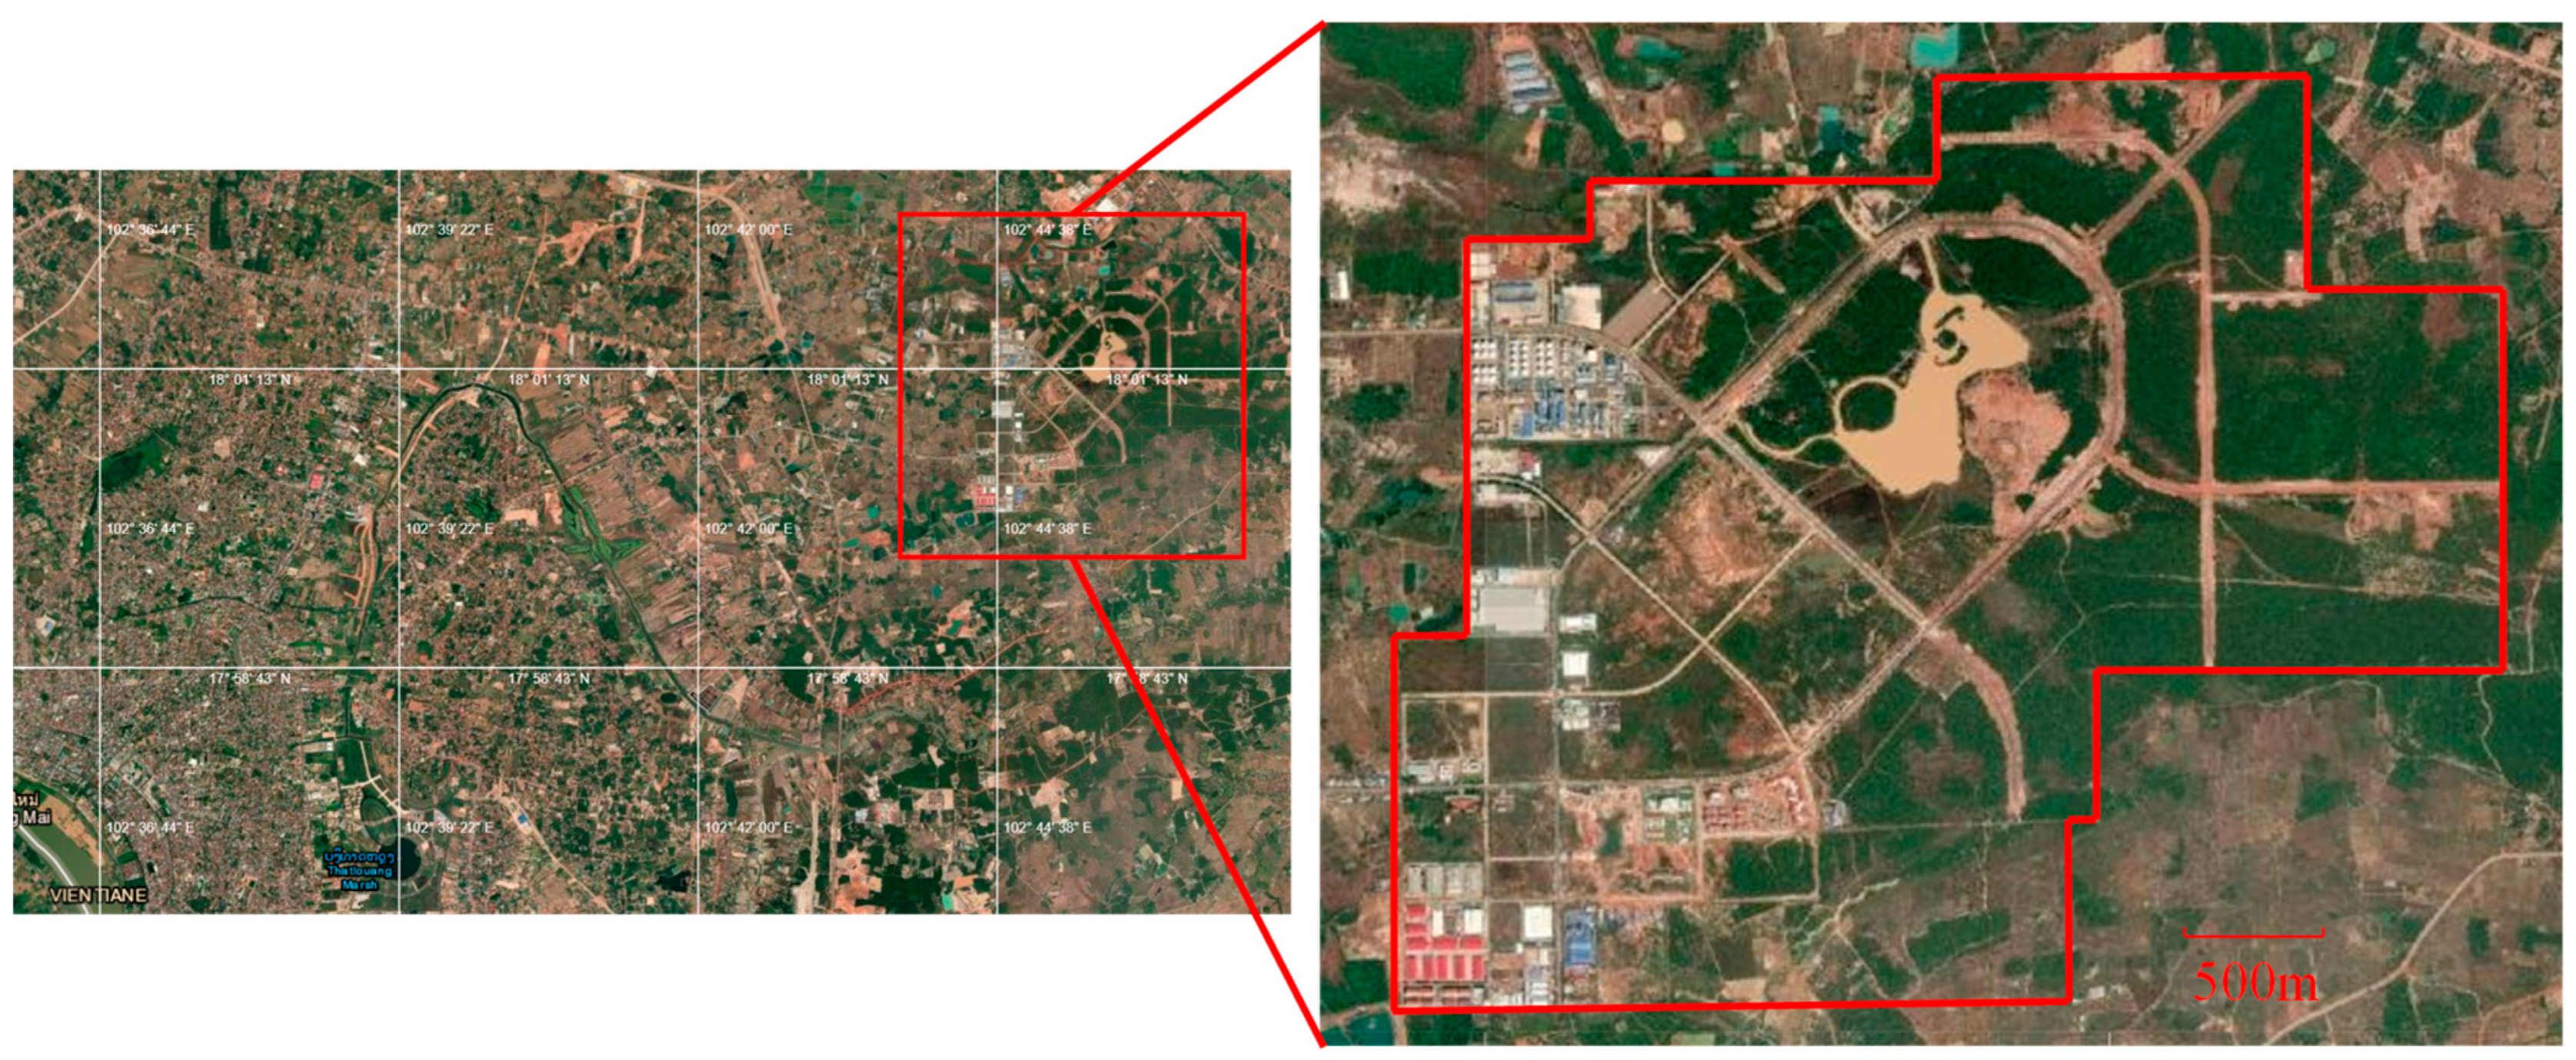
The study area is located in an economic development zone being planned and constructed in Southeast Asia, with a total planning area of 1150 ha. The planning area is generally high in the northeast and low in the northwest, with an average elevation between 167 and 180 m, an average temperature of 24.5 to 27.3 °C, and an average annual rainfall of about 1700 mm.
The design drawings and information for the study area were obtained from the Project Development Department (PDD), and according to the planning information, the total length of the rainwater pipe network exceeds 73 km in length, with a variety of types and sizes. However, the simulation results from the SWMM model developed from the initial design plan show that the rainwater pipe network currently planned has limited drainage capacity, and there are no LID measures planned and designed for this economic development area, which will be prone to flooding after completion. The study area is shown in Figure 3.

2.3. Storm Water Management Model

2.3.1. Model Description

SWMM is a dynamic runoff model developed by the U.S. Environmental Protection Agency (EPA) in the 1970s. It has been widely used worldwide for the simulation of urban rainfall runoff, piped water conveyance, pollutant transfer, and other aspects [28]. The latest version of SWMM is SWMM version 5.2, which includes a LID control module and provides a total of eight typical low-impact measures, such as green roofs, permeable paving, and rainwater bioretention facilities, which allow users to add LID measures to the traditional drainage system according to the planning information and evaluate the effects.

2.3.2. Establishment of the SWMM

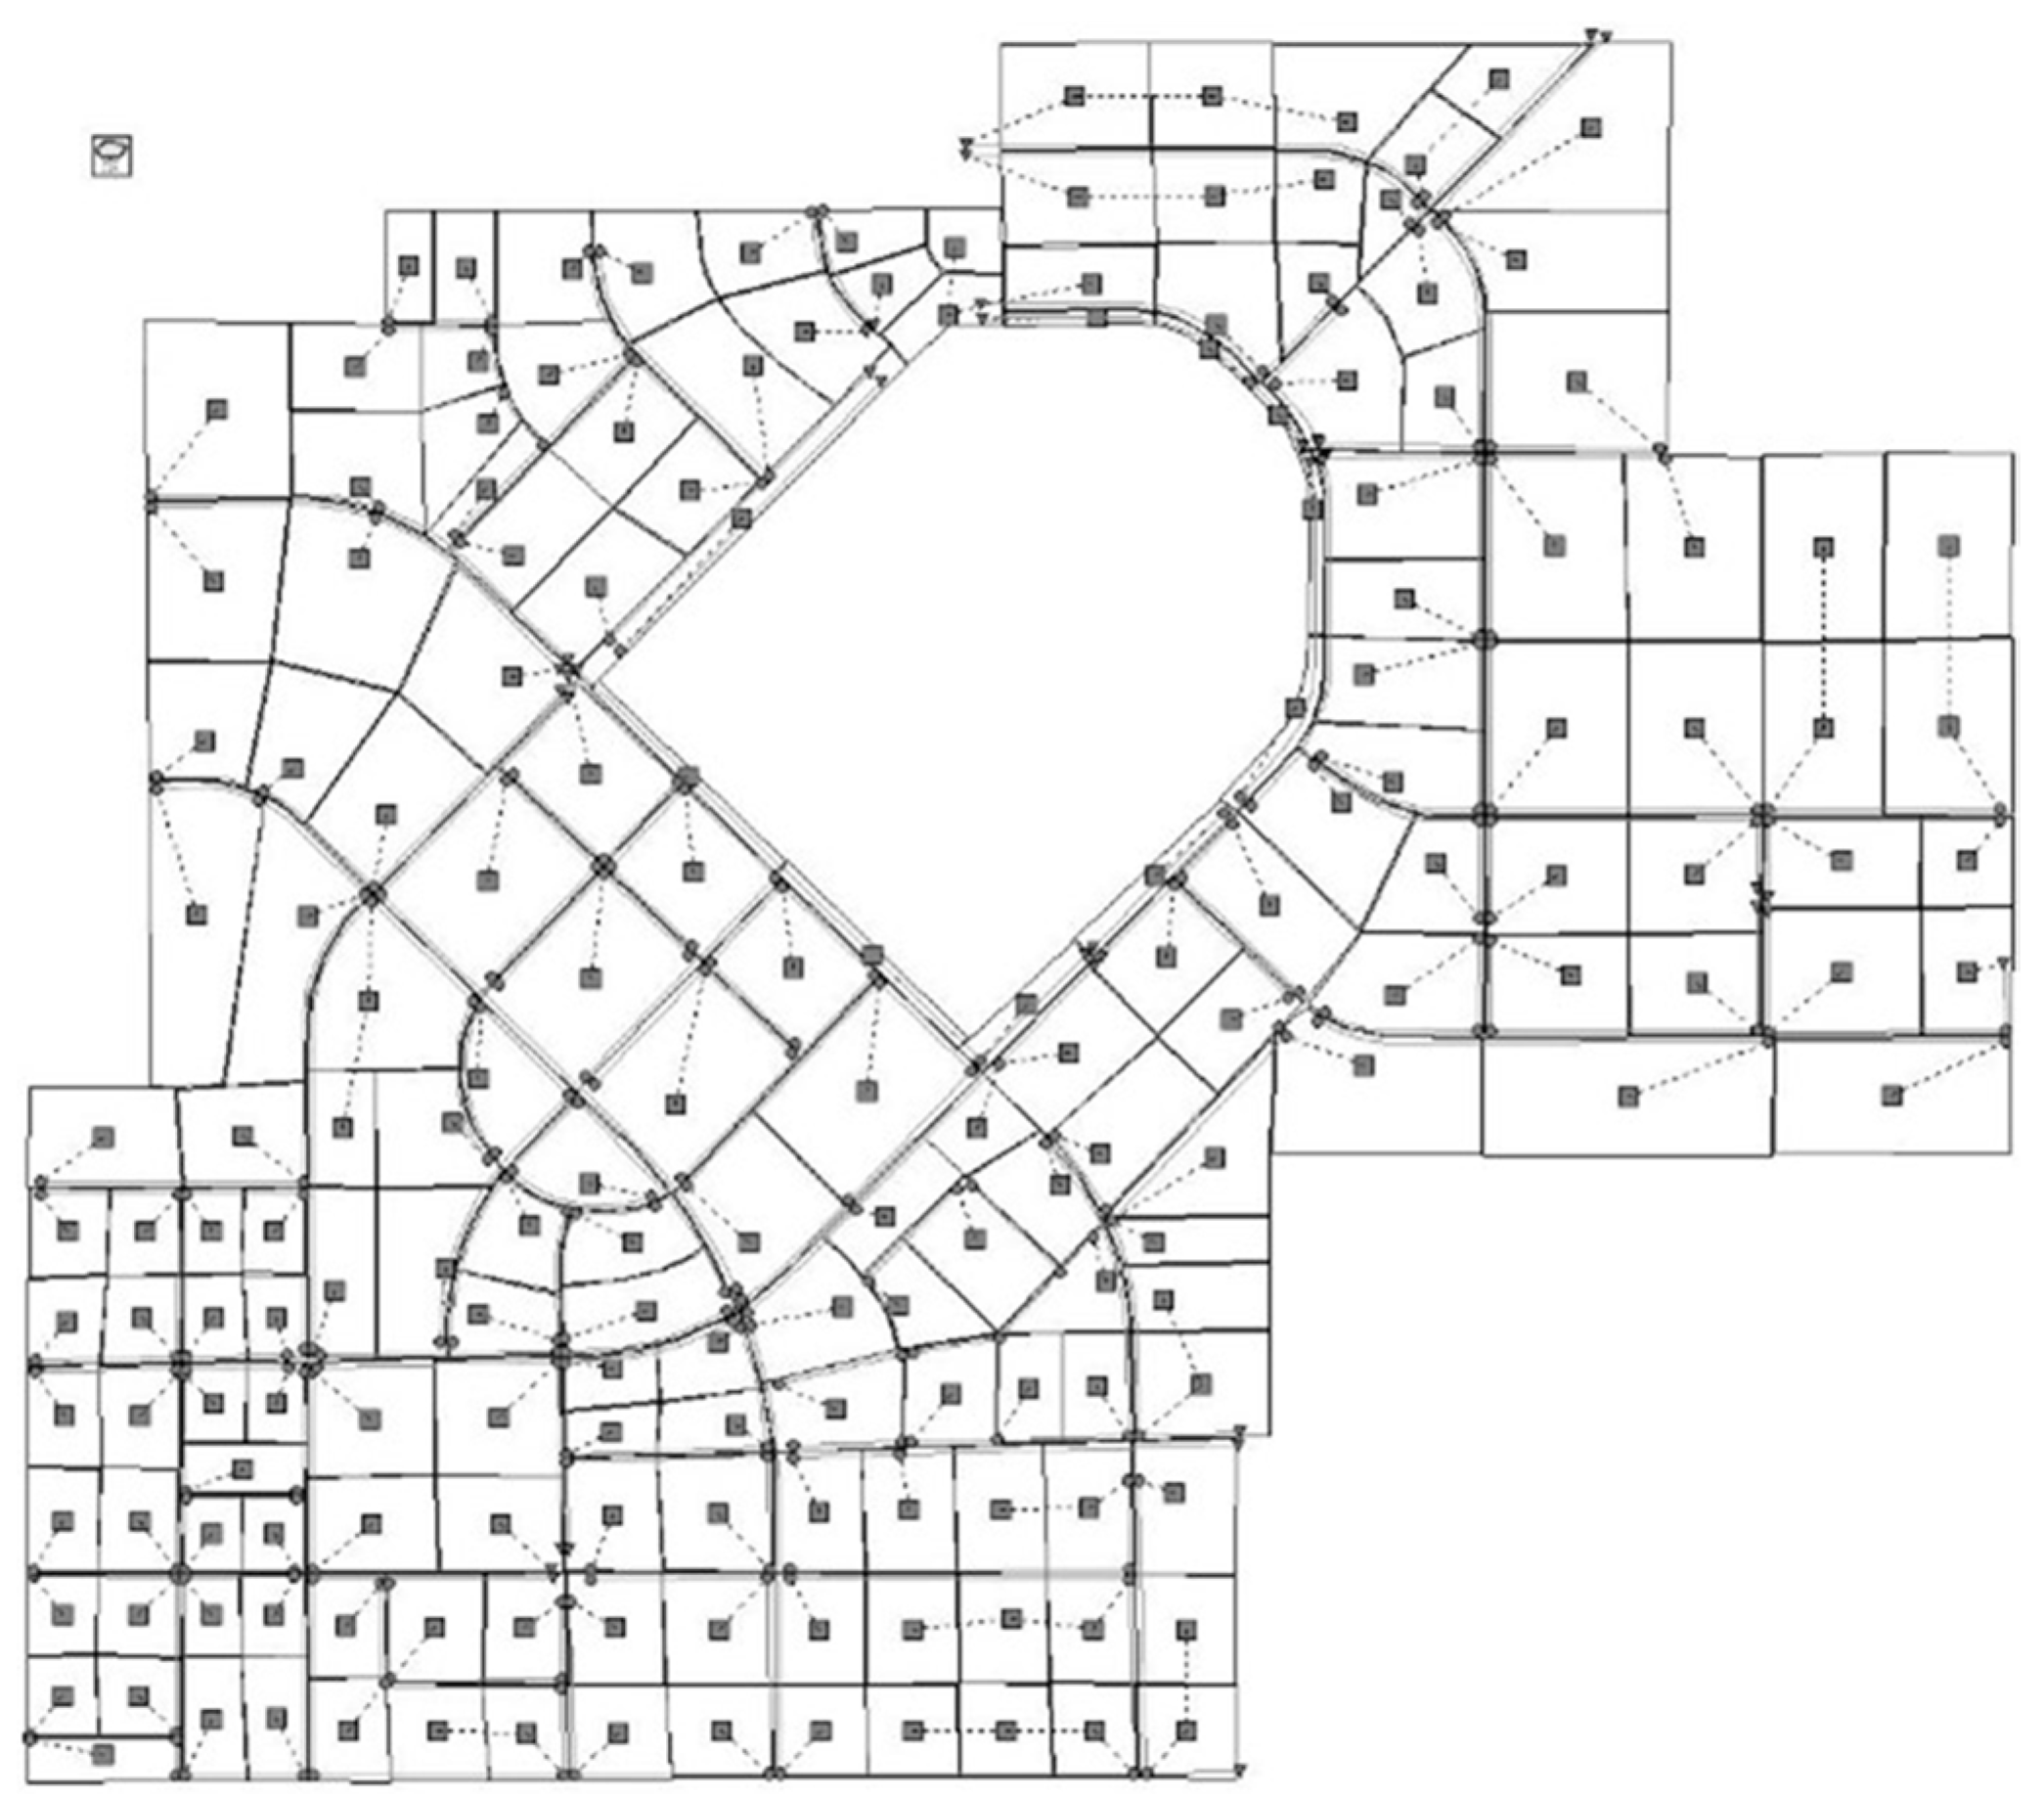
Due to the large area and relatively flat terrain of the study area, the corresponding SWMM model for the study area was established based on the planning recommendations and land use information. The study area is divided into 186 sub-catchments, and storm drains, outfalls, nodes, etc. are laid out according to the rainwater network plan, with a total of 244 storm drains, 38 outfalls, and 236 nodes, and the generalized map of the study area is shown in Figure 4.

2.3.3. Design Rainfall

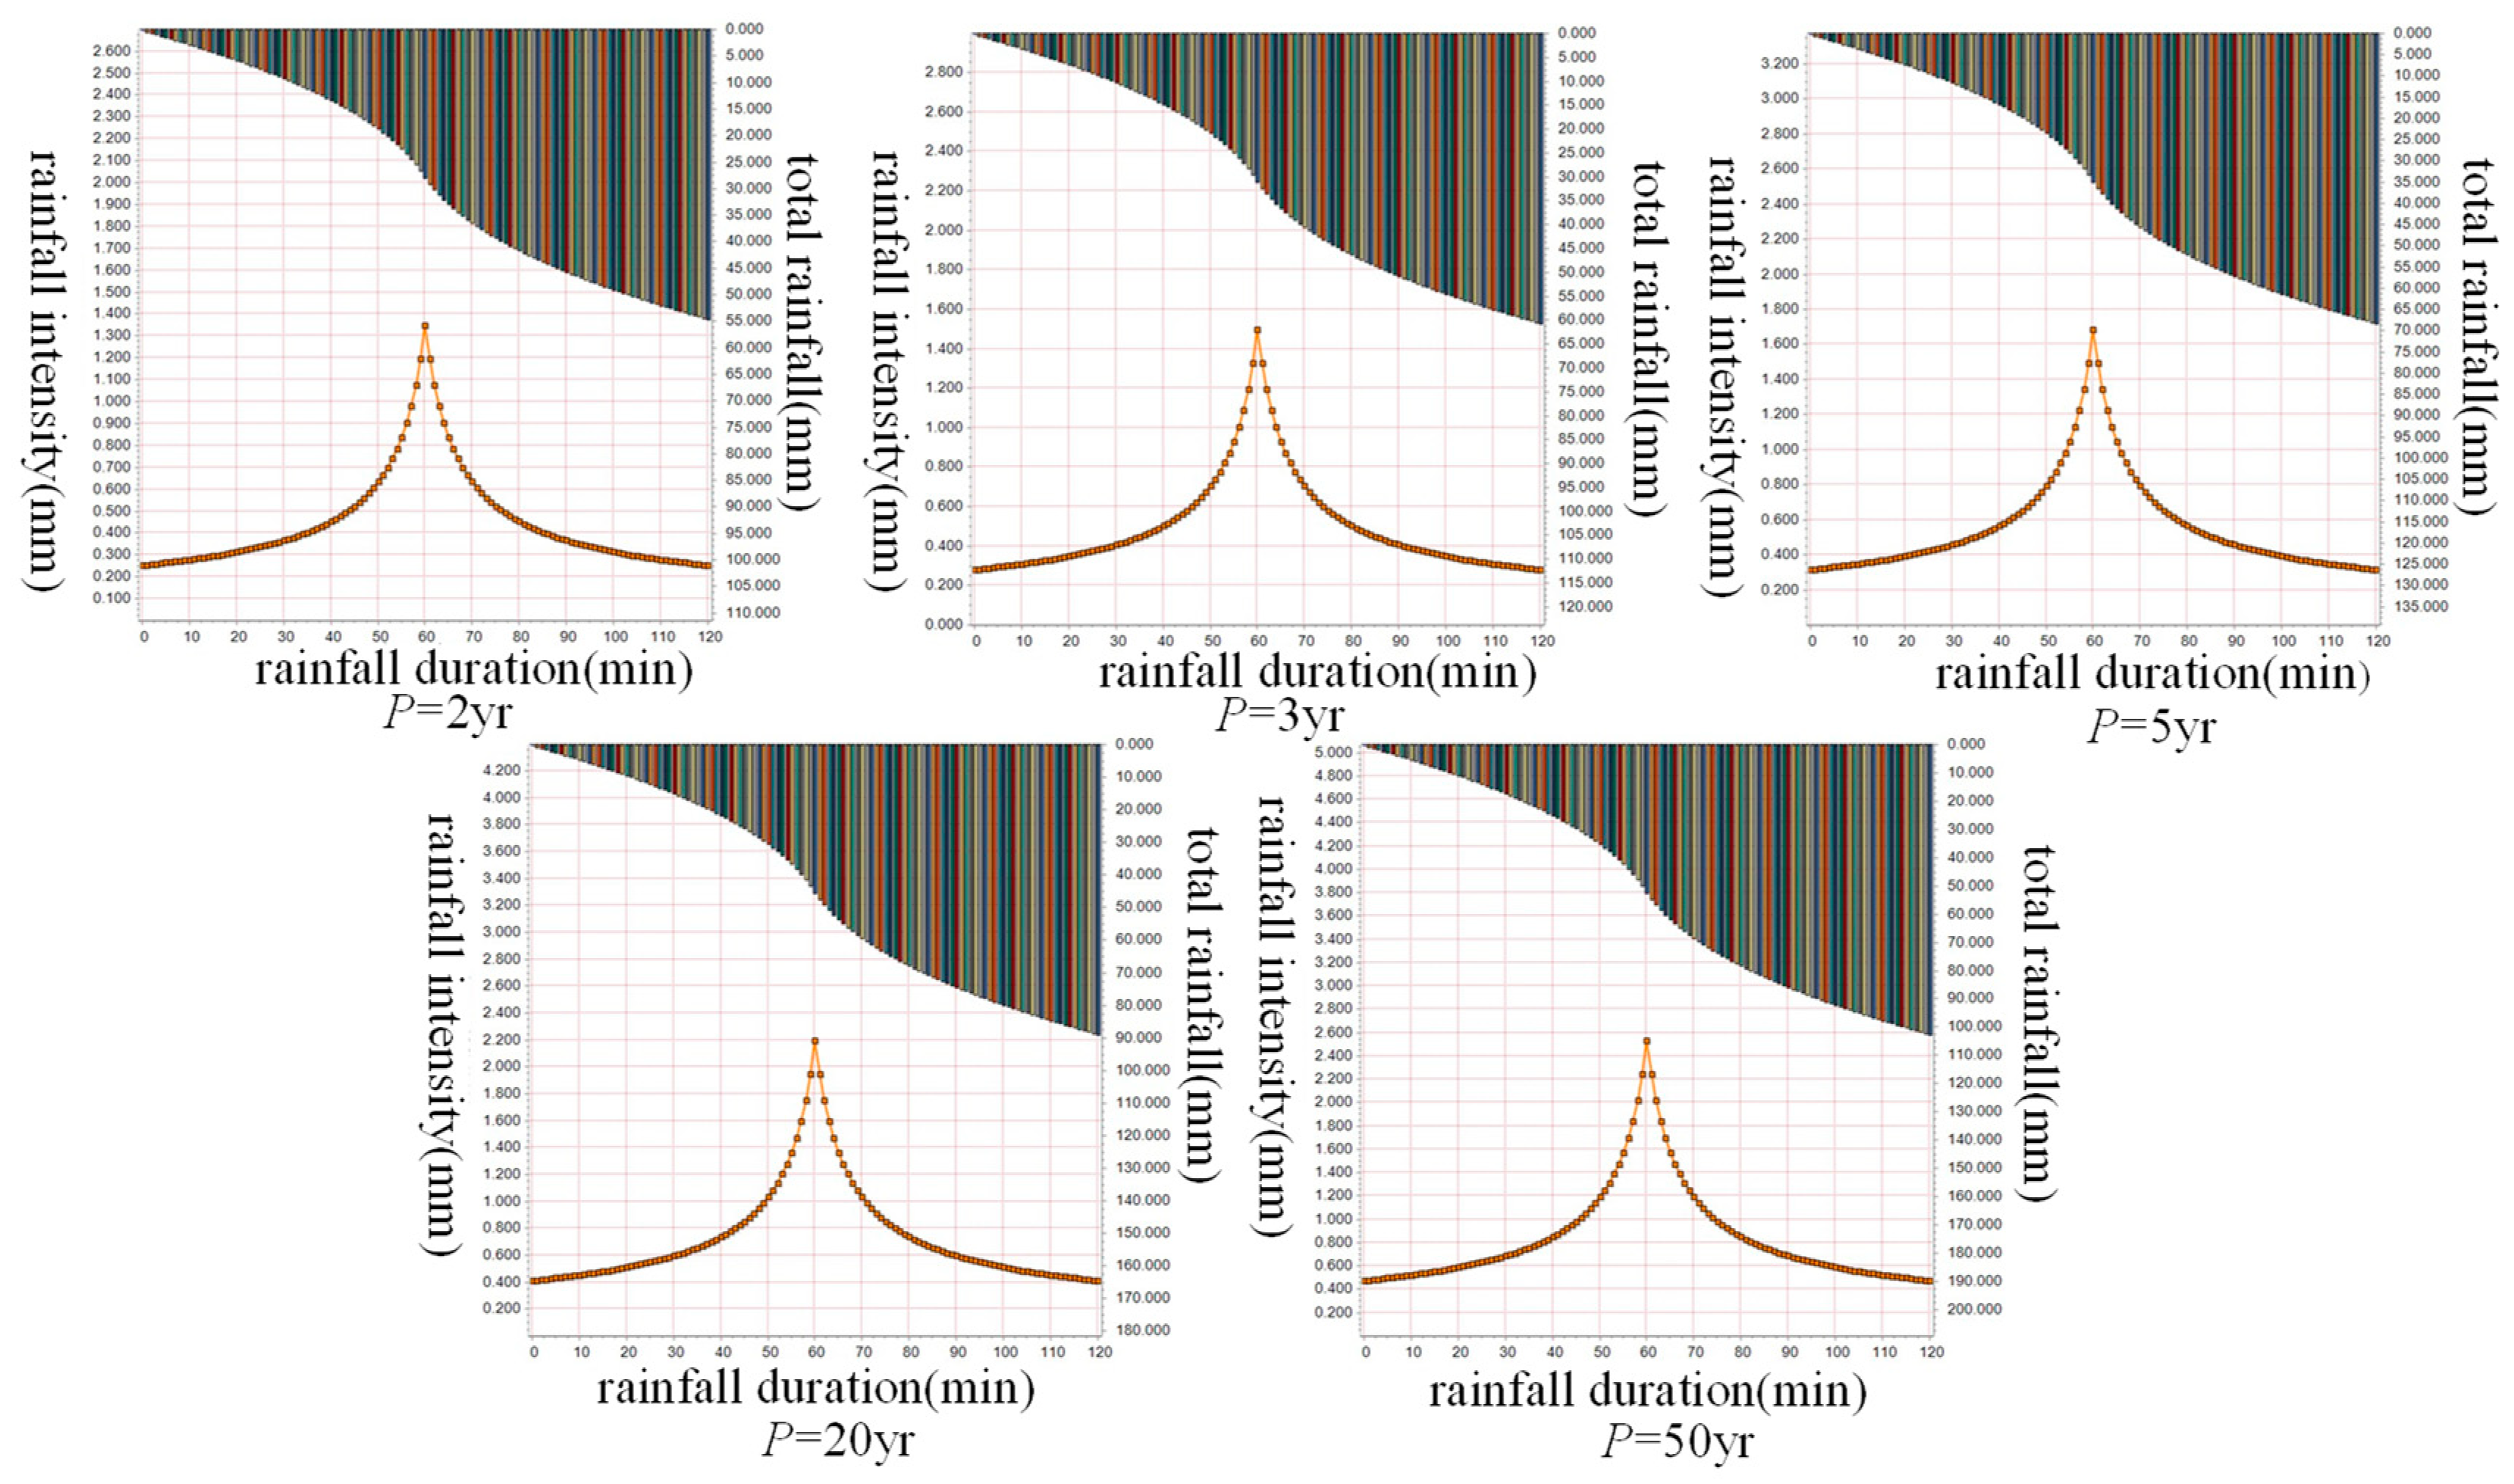
The design rainfall for different rainfall return periods (2 yr, 3 yr, 5 yr, 20 yr, and 50 yr) is calculated based on the local storm intensity formula for the study area. The main characteristics are a single-peak rainfall pattern with a peak coefficient of r = 0.5 and a short-duration (120 min) rainfall pattern. The local storm intensity formula for the study area is shown in Equation (1):
q = 700 × ( 1 + 0.775 lg P ) ( 15 + t ) 0.496
where q is the design rainstorm intensity L/(s·hm2); t is the rainfall duration (120 min); and P is the design rainfall return periods (2 yr, 3 yr, 5 yr, 20 yr, and 50 yr). Figure 5 below shows the design rainfall process under different return periods, and Table 1 shows the rainfall intensity.

2.3.4. SWMM Model Parameterization and Validation

Due to the fact that the study area is in the planning and construction stages and lacks measured data, the modeling rate was performed using the no-measured-information rate method proposed by Xingpo Liu [29]. The method is to calibrate the model parameters by comparing the integrated runoff coefficients used for stormwater network design with the runoff coefficients simulated by the computer. The method first establishes the initial parameter set of the model based on the sub-catchment subsurface information and commonly used empirical parameters, then determines the direction of parameter adjustment, determines the direction of parameter optimization through parameter sensitivity analysis, and manually adjusts the parameter and iterates it step by step to obtain the parameter set that meets the design requirements. The initial parameters of the model were determined by the recommended values from the SWMM manual [28], and then the parameter values were adjusted, calculated, and verified using the principle of composite curve coefficients (CNN) until the parameters were modified to meet the corresponding comprehensive runoff coefficient. According to the sub-catchment runoff coefficient, the weighted average value of each sub-catchment is obtained by using the sub-catchment area as the weight, which is the comprehensive runoff coefficient, and the comprehensive runoff coefficient calculation formula is shown in Equation (2).
ψ z =   F i ψ i F
where ψ z is the comprehensive runoff coefficient of the model; F i is the area of the i-th sub-catchment (hm2); ψ i is the runoff coefficient of the i-th sub-catchment; and F is the total area of all sub-catchments (hm2). The final parameters of the model and the comprehensive runoff coefficient under different rainfall return periods were obtained using this method. The study area is planned as an economic development zone with a high degree of development, and the average imperviousness established in the study area is 78.3%. According to the recommended values in the “Concise Drainage Design Manual” [30] compiled by the Beijing Municipal Design Research Institute (see Table 2 for the specific values), the corresponding integrated runoff coefficients of the study area range from 0.6 to 0.8. The integrated runoff coefficients of the model of the study area under different rainfall recurrence periods (2 yr, 3 yr, 5 yr, 20 yr, and 50 yr) and the comprehensive runoff coefficients of the model in the study area under different rainfall recurrence periods (2 yr, 3 yr, 5 yr, 20 yr, and 50 yr) were 0.649, 0.665, 0.685, 0.728, and 0.751, respectively, which were in a reasonable range and could be used as a follow-up study, and the specific parameters of the validated model are shown in Table 3.

2.4. Design of Manual Subjective Design Schemes

2.4.1. Comprehensive Pipe Corridor Rainwater Chamber Scheme

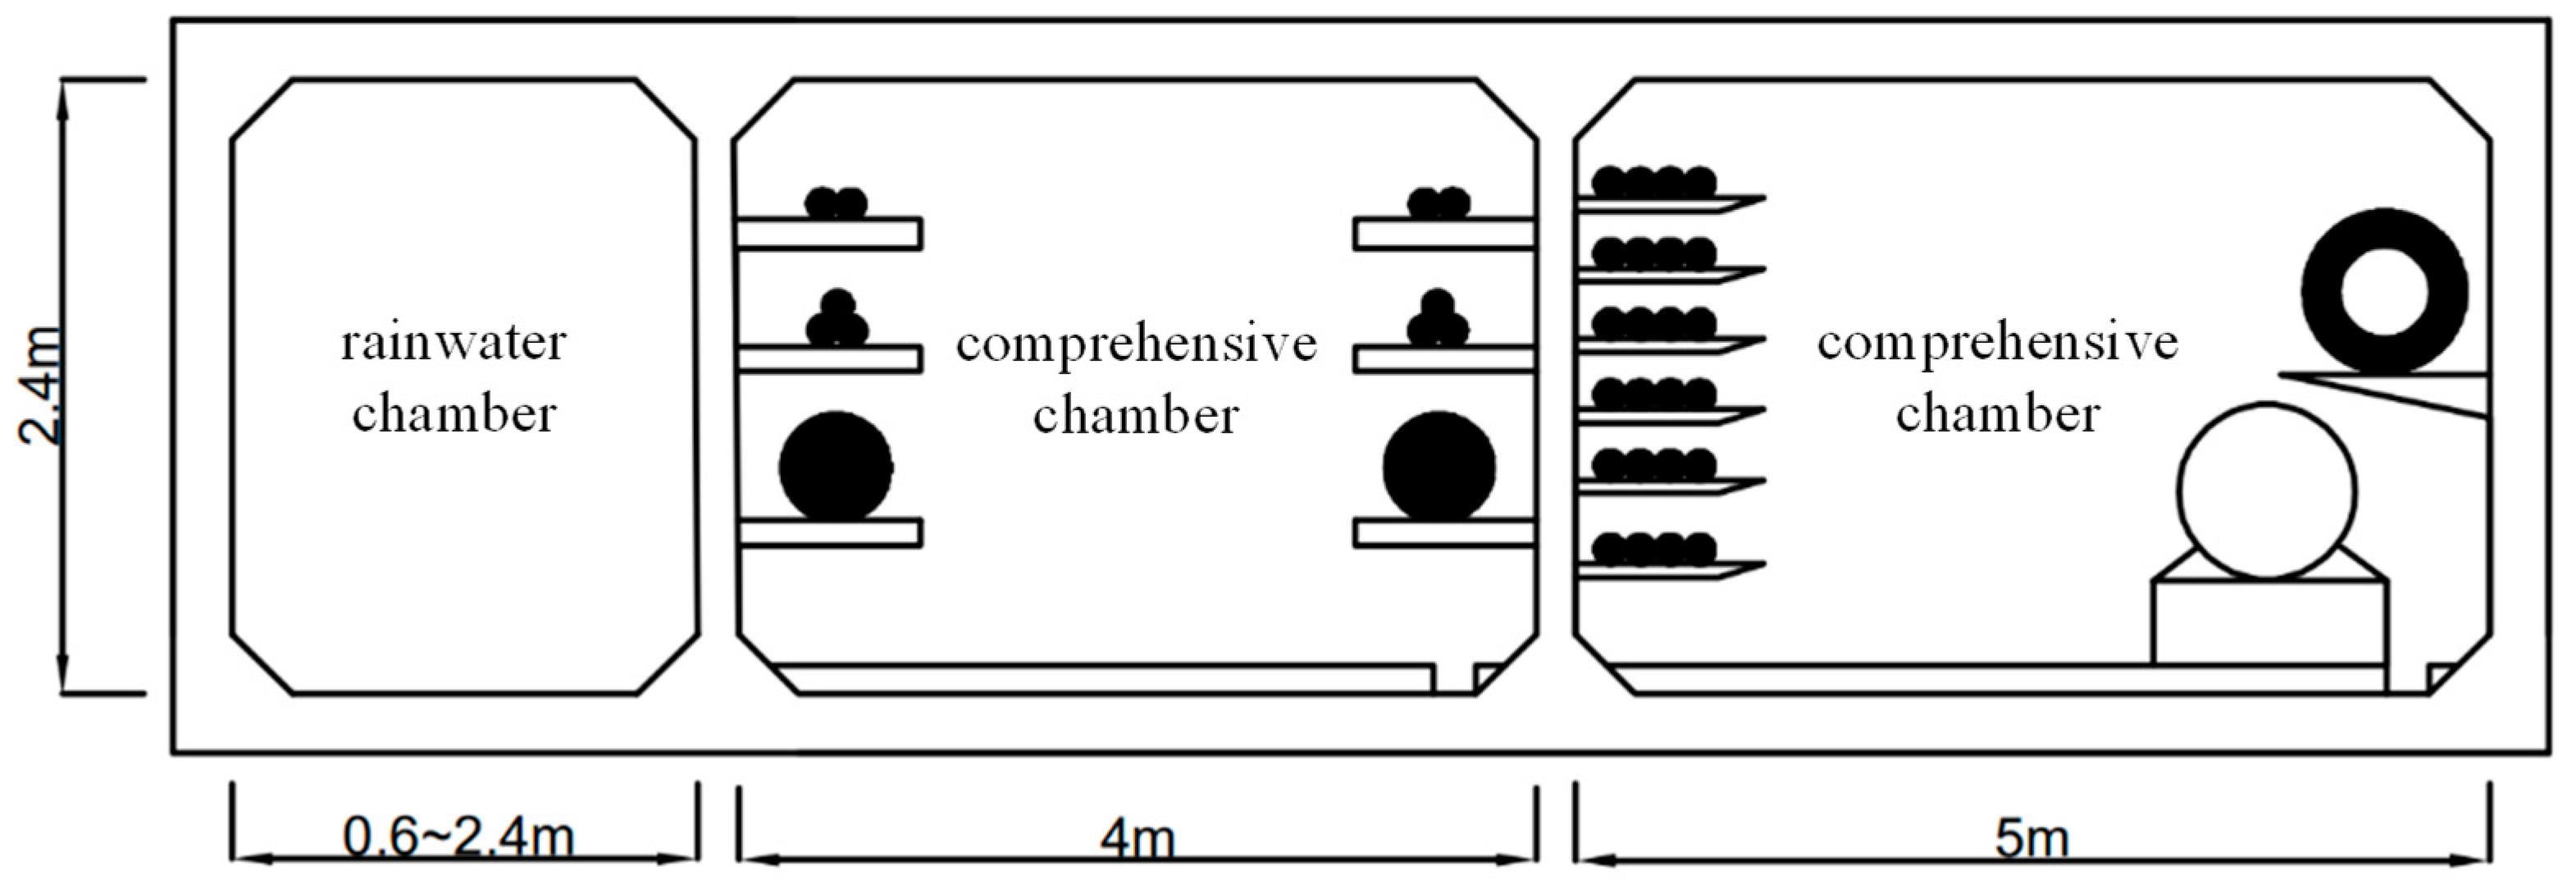
The comprehensive pipe corridor rainwater chamber design scheme is based on the initial design scheme, replacing all the rainwater pipe networks of different sizes with the same size of the comprehensive pipe corridor rainwater chamber and not adding any LID measures. Considering the investment cost of the whole project and local construction conditions, combined with the “Technical Specification for Urban Comprehensive Pipe Corridor Engineering” [31] and the research of Xiang Fan et al. [32], the height of the rainwater chamber is kept unchanged at 2.4 m, and the width is designed to be from 0.6 to 2.4 m. The section design is shown in Figure 6.

2.4.2. Combination LID Measure Scheme

The combination LID measures design scheme is based on the initial design scheme with the addition of combination LID measures without changing the original rainwater network. In this study, four types of LID measures were selected: green roofs, permeable paving, bioretention basins, and grassed swales. Considering that the effect of combination LID measures to alleviate flooding is better than that of single LID measures [33,34,35], and considering the large area of the study area, combination LID measures were chosen for this study. Table 4 shows the land use types in the study area. According to the development zone planning information, the combination of the four LID measures was based on the type of land use in the study area (Table 5), and when it was necessary to adjust the size of the area of LID measures in the sub-catchments, the combination of combined LID measures was kept unchanged, and only the percentage of combination LID measures in each sub-catchment had to be adjusted. Since there were no designed LID measures in the study area, the parameters of the four LID measures were determined by referring to other studies [36,37,38]. Specific parameters are shown in Table 6.
Both of these two design schemes have a certain mitigation effect on the urban flooding problem but also have certain shortcomings. The comprehensive pipe corridor rainwater chamber has a poor reduction effect on surface runoff. Combination LID measures need to be laid over a large area to get better results, and the mitigation effect on the rainwater network is weaker than the comprehensive pipe corridor rainwater chamber, so it is necessary to propose a new design scheme that can address such shortcomings.

2.4.3. Manual Optimization Scheme

In order to solve the disadvantages of the previous two design schemes, combining the comprehensive pipe corridor rainwater chamber and combination LID measures to form a sponge-type comprehensive pipe corridor rainwater chamber system, the advantages and disadvantages of the two could complement each other and constitute a more comprehensive and effective design scheme. This scheme replaces all of the rainwater network with a comprehensive pipe corridor rainwater chamber based on the combination LID design scheme.
This design scheme has a better result in mitigating urban flooding, but due to the subjectivity of manual optimization design, not much consideration is given to the priority of the four objectives, which may be prone to differing much from the actual situation and needs of the study area.

2.5. Optimization Model Scheme Based on NSGA-III Algorithm

In order to avoid a large difference between the manual optimization design scheme and the actual situation in the study area, the SWMM model and the NSGA-III optimization algorithm are combined to form an optimization model, which is a four-objective optimization model established for the purpose of optimizing the combination design and total investment cost of the sponge-type comprehensive pipe corridor rainwater chamber, which takes into account the rainwater control and the condition of the rainwater network system, as well as the total investment cost of the construction and management phases.

2.5.1. NSGA-III Optimization Algorithm

In this study, a multi-objective optimization algorithm is used to find the optimal design of a sponge-type comprehensive pipe corridor rainwater chamber. As a member of the evolutionary optimization algorithm family, NSGA-III is based on the “reference point” selection mechanism, which gives it a strong convergence ability when the number of objectives reaches more than three, and it can deal with high-dimensional objective space problems well. Therefore, NSGA-III has been widely used in engineering fields, but its application in LID is still limited.
NSGA-III was proposed by Deb and Jain [39,40] in 2013 on the basis of NSGA-II. NSGA-III shares a similar framework with NSGA-II, but NSGA-III radically adapts the “crowding degree”-based ordering method to a “reference point”-based ordering method. “Since the reference points are widely distributed in the hyperplane, they are closely connected with the individuals of the population, the individuals of the solutions can be widely distributed in the solution space, and the solution set obtained is globally optimal, the “reference point”-based selection strategy can ensure that the NSGA-III will be able to select the best solution set for the population. Therefore, the selection strategy based on “reference points” can ensure that NSGA-III can maintain the diversity of the population.
The procedure of NSGA-III starts with randomly generating the parent population Pt (N), after crossover and mutation to produce the offspring population Qt (N), combining the two populations to form Rt (2N), and dividing them into multiple non-dominated layers (F1, F2, ……Fi) by using non-dominated sorting, starting from the F1 layer, the non-dominated sorting into St, then F2…, until the size of St is N, which serves as the parent population Pt+1 for the next iteration. The above process is repeated until the set number of genetic generations is reached.

2.5.2. Objective Function

Considering the operational status of the traditional drainage system as part of the optimization objective, two traditional drainage system status indicators (pipe overload time, node overflow volume), surface runoff coefficient, and total investment cost were selected as the optimization objectives to be solved in this study.
The first objective function considers the surface runoff coefficient for the study area. The objective of this function is to minimize the ratio of total surface runoff to total rainfall in the study area as a means of obtaining the highest rate of surface runoff reduction. The total surface runoff V 1 and total rainfall V 2 can be obtained from the “rpt” file after SWMM simulation, and the objective function is shown in Equation (3).
min φ = V 1 V 2
where φ   is the integrated surface runoff coefficient, V 1 is the total surface runoff (mm), and V 2 is the total rainfall (mm).
The second objective function considers the overloaded state of the rainwater network system. The objective of this function is to minimize the sum of overload hours of all pipes. The total number of overloaded pipes and the total number of overload hours can be obtained from the “rpt” file after SWMM simulation, and the objective function is shown in Equation (4).
min t c = i = 1 N u m . C t i
where t c is the total pipe overload time (h), N u m . C is the total number of overloaded pipes, and t i is the pipe overload time (h).
The third objective function considers the overflow volume of the rainwater network system. The objective of this function is to minimize the total nodal overflow volume at the nodes where overflow occurs. The overflow volume of the nodes can be obtained from the “rpt” file after SWMM simulation, and the objective function is shown in Equation (5).
min V c = i = 1 N u m . C V i
where V c is the total overflow volume (Mltr), N u m . C is the number of nodes where overflow occurs, and V i is the node overflow volume (Mltr).
The fourth objective function considers the total investment cost in the construction and management phases. The objective of this function is to reduce the total investment cost of the sponge-type comprehensive pipe corridor rainwater chamber, which is used to control the budget of the design program and to achieve high cost-effectiveness to obtain better benefits at lower costs. The objective function is shown in Equation (6).
min C = i 4 ( S i × M i ) + S 2 × M 2
where S i is the percentage of the total area of the study area covered by the ‘i’ LID measure, M i is the cost per 1% of the total area of the study area covered by the ‘i’ LID measure, S 2 is the total area of the comprehensive pipe corridor cross-section, and M 2   is the cost per 1 m2 of the area of the comprehensive pipe corridor cross-section under the total length. Regarding the cost, the final cost can be determined by referring to the cost of the LID and comprehensive pipe corridor in the “Technical Guidelines for Sponge City Construction” [41] and the study of Hengyu Wang et al. [42], taking into account the local price of raw materials in the study area and other related costs, as shown in Table 7.
The calculated costs in the table are the costs for each LID measure paved at 1% of the total area of the sub-catchment. The cost per 1 m2 of the comprehensive pipe corridor cross-sectional area under the total length.

2.5.3. Constraints

The main task of the optimization model is to determine the percentage of the sub-catchment area occupied by the different combination LID measures and the section size of the comprehensive pipe corridor rainwater chamber in order to obtain a design scheme with the optimal integrated benefits. When establishing the constraints, the four LID measure combination methods in the sub-catchment were first determined, and the percentage of area occupied by the set combination LID measures in the whole sub-catchment was set as the first variable, with a lower limit of 0 and an upper limit of 100%. The section width of the rainwater compartment of the integrated pipe corridor was set as the second variable, with a lower limit of 0.6 m and an upper limit of 2.4 m.
The specific constraints are as follows:
Constraint 1: The LID accounts for the sub-catchment area constraint, which can be expressed as Equation (7).
0 < S 1 < 100 %
where S 1 is the percentage of the sub-catchment area occupied by the combination LID measure.
Constraint 2: The section width constraint of the comprehensive pipe corridor rainwater chamber can be expressed as Equation (8).
0.6   m < D < 2.4   m
where D is the width of the comprehensive pipe corridor rainwater chamber.

2.5.4. Optimization Model Construction

The optimization model is constructed as follows:
(1)
Model SWMM and identify the different combinations of LID measures used in each sub-catchment;
(2)
Dimensional information for combination LID measures with different percentages of paving and different rainwater chamber section widths was entered into the model to create SWMM models with different ratios, and 100 groups of data were obtained;
(3)
Multiple linear regression was used to establish linear relationships between the percentage of combined LID measures laid, the width of the rainwater chamber section, the surface runoff coefficient, pipe overload time, nodal overflow, and the total investment cost;
(4)
The best design scheme is obtained by optimally solving the linear relationship between several by the NSGA-III algorithm to obtain the Pareto front;
(5)
Substitute the individual optimal solutions in the obtained solution set into the model for checking and verifying the validity of the optimization model and the applicability of the NSGA-III algorithm.
The specific process is shown in Figure 7.

3. Results

The initial design scheme did not have the comprehensive pipe corridor rainwater chamber and LID measures, and the SWMM model simulation results of three urban flooding indicators (surface runoff coefficient, pipe overload time, node overflow volume) under different rainfall return periods are shown in Table 8.

3.1. Comprehensive Pipe Corridor Rainwater Chamber Scheme

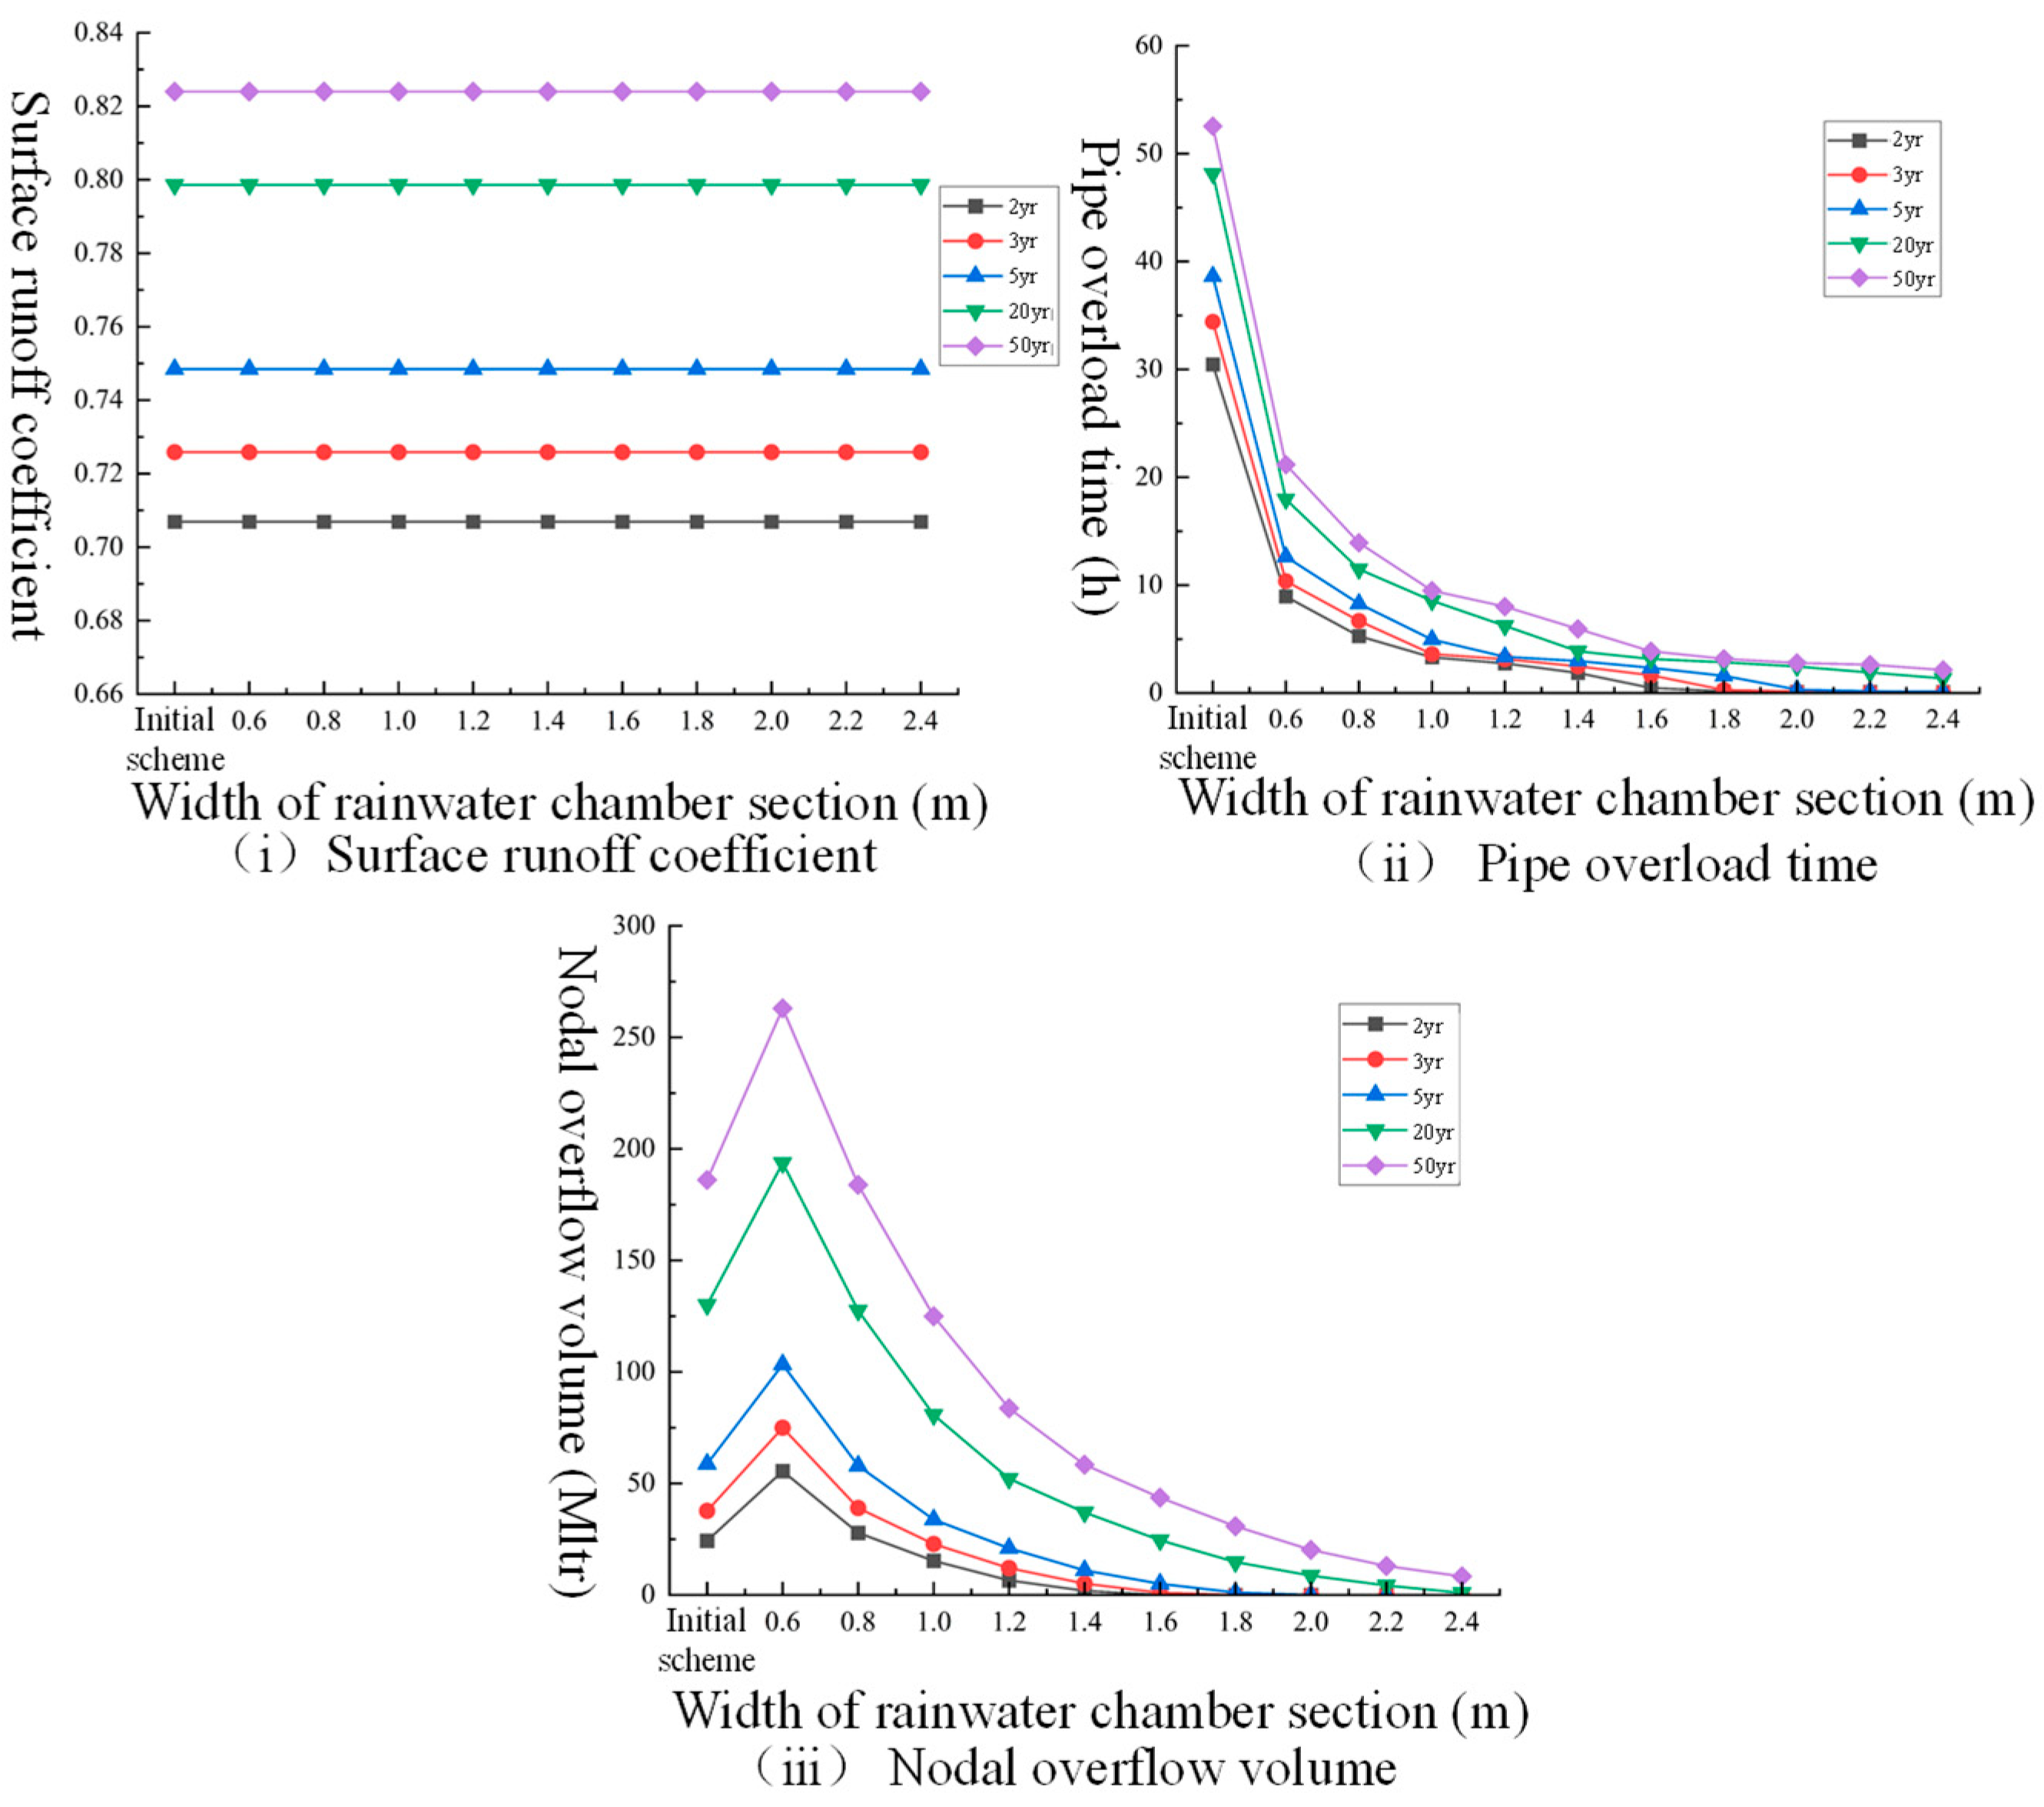
Figure 8 shows the relationship between different section widths of the rainwater chamber and surface runoff coefficients, pipe overload times, and nodal overflow volume in different rainfall return periods. As the section width of the rainwater chamber increases, the pipe overload time and nodal overflow volume decrease gradually. However, when the section width of the rainwater chamber is 0.6 m, the nodal overflow is larger than the initial design scheme, which is because the section area of the rainwater chamber is smaller than part of the initial rainwater pipe, and it is easy to cause overflow at nodes with insufficient drainage capacity. When the section width is increased from 0.6 m to 1.4 m under the condition of not adding any LID measures and different rainfall return periods of 2 yr, 3 yr, 5 yr, 20 yr, and 50 yr. The reduction of pipe overload time is 93.87%, 92.78%, 92.31%, 91.97%, and 88.69%, and the reduction of nodal overflow volume is 92.41%, 86.40%, 81.26%, and 71.56%. When the section width exceeds 1.4 m, the reduction effect is gradually weakened, and changing the section width of the rainwater chamber has basically no effect on the surface runoff coefficient.

3.2. Combination LID Measures

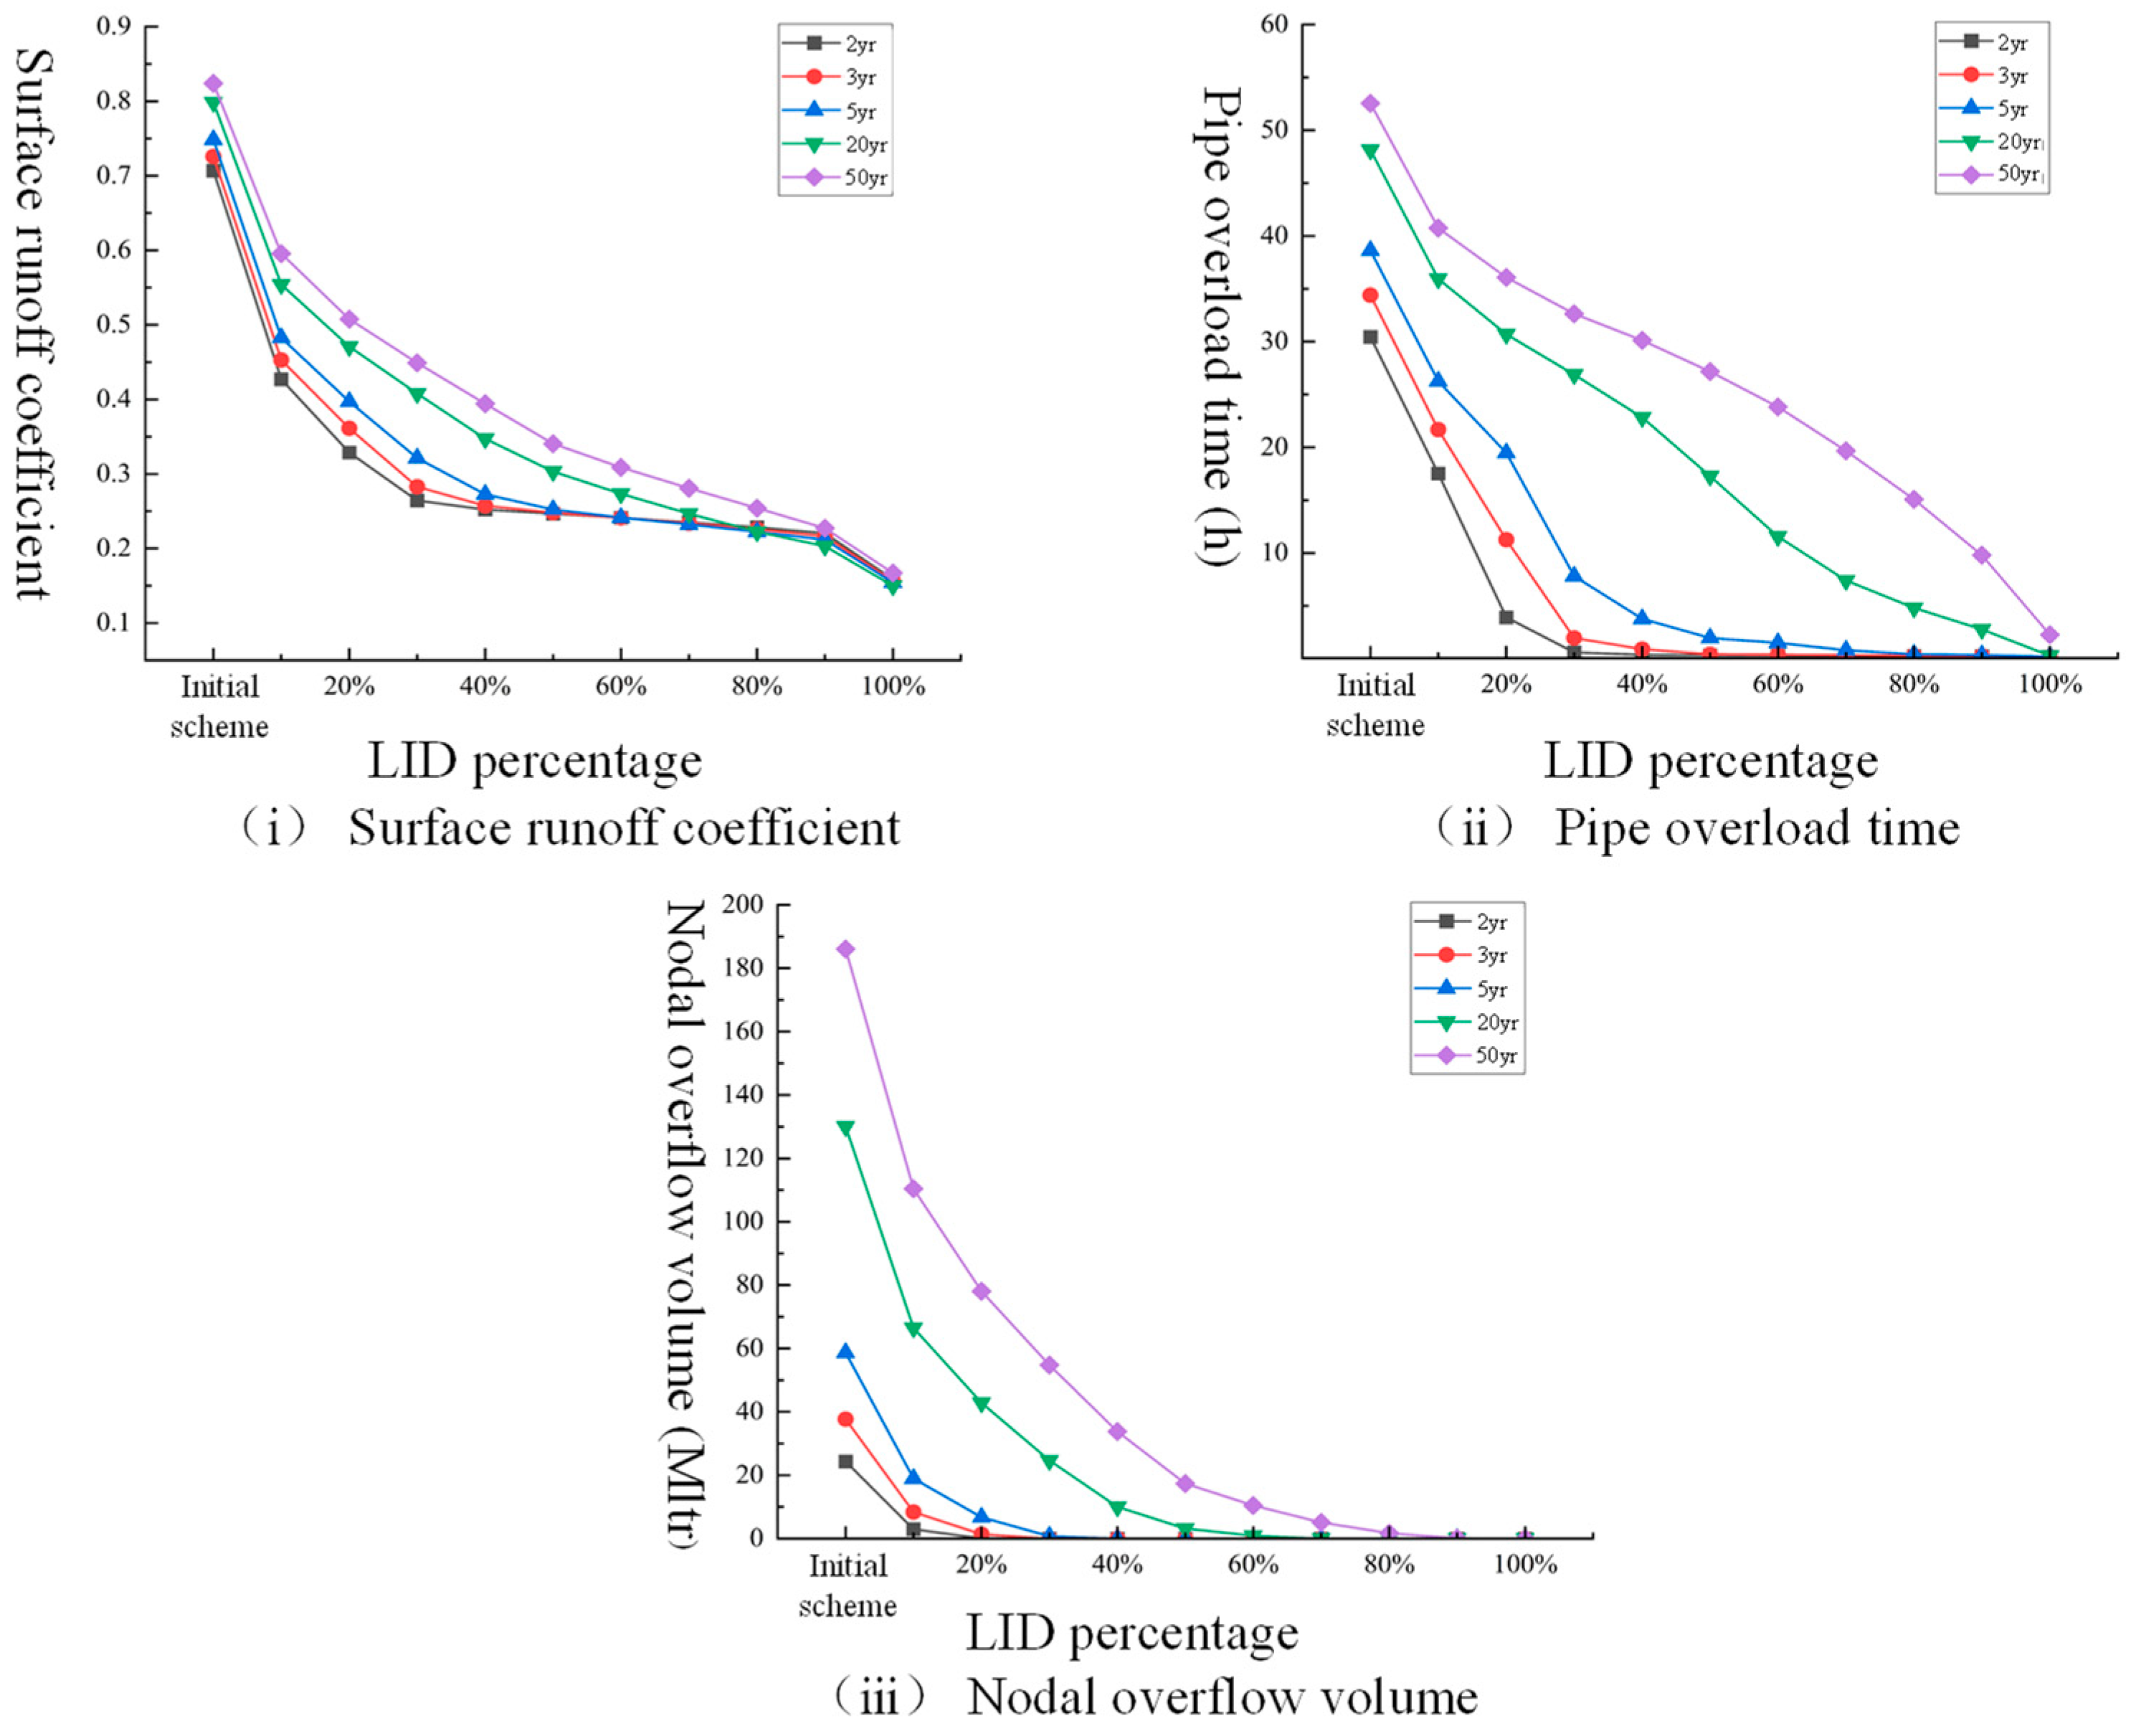
Figure 9 shows the relationship between different percentages of combination LID measures and surface runoff coefficients, pipe overload time, and nodal overflow volume in different rainfall return periods. The surface runoff coefficient, overload times, and nodal overflow volume all decrease gradually as the percentage of combination LID measures gradually increases. When the percentage of combination LID measures is increased from 0 to 30% under the different rainfall return periods of 2 yr, 3 yr, 5 yr, 20 yr, and 50 yr. The reduction rate of the surface runoff coefficient is 62.59%, 61.05%, 57.06%, 48.93%, and 45.50%. The reduction rate of pipe overload time is 98.02%, 94.26%, 79.77%, 79.77%, 44.17%, and 37.88%, and the reduction rate of nodal overflow volume is 100.00%, 100.00%, 98.72%, 81.05%, and 70.55%, respectively. When the percentage of combined LID measures reaches 30% or more, the debilitating effect gradually diminishes at smaller rainfall return periods. The combination LID measures can not only reduce the surface runoff coefficient but also alleviate the pressure on the rainwater network to a certain extent, and the effect of flood prevention is more significant when the rainfall return period is small.

3.3. Manual Optimization Scheme

Combined with the previous simulation results, the area occupied by the combination LID in the sub-catchment in the manual optimization scheme is set to 30%, and the width of the rainwater chamber is 1.4 m. The surface runoff coefficient, pipe overload time, and nodal overflow volume in this scheme are 0.449, 2.497 h, and 10.996 Mltr, respectively, which are compared with the initial scheme to cut down the surface runoff coefficient, pipe overload time, and nodal overflow volume by 45.51%, 95.25%, and 94.09%, which has a good mitigation effect.

3.4. NSGA-III Optimization Model

3.4.1. Optimal Variables

According to the design plan, the width of the rainwater chamber section in the study area and the percentage of combination LID measures were set as model variables. The upper and lower limits of the two variables are [0.6, 2.4 m] and [0, 100%], respectively, and are used as the constraints of the optimization model, which can produce different optimal variables.

3.4.2. Pareto Frontier of the Optimizing Model

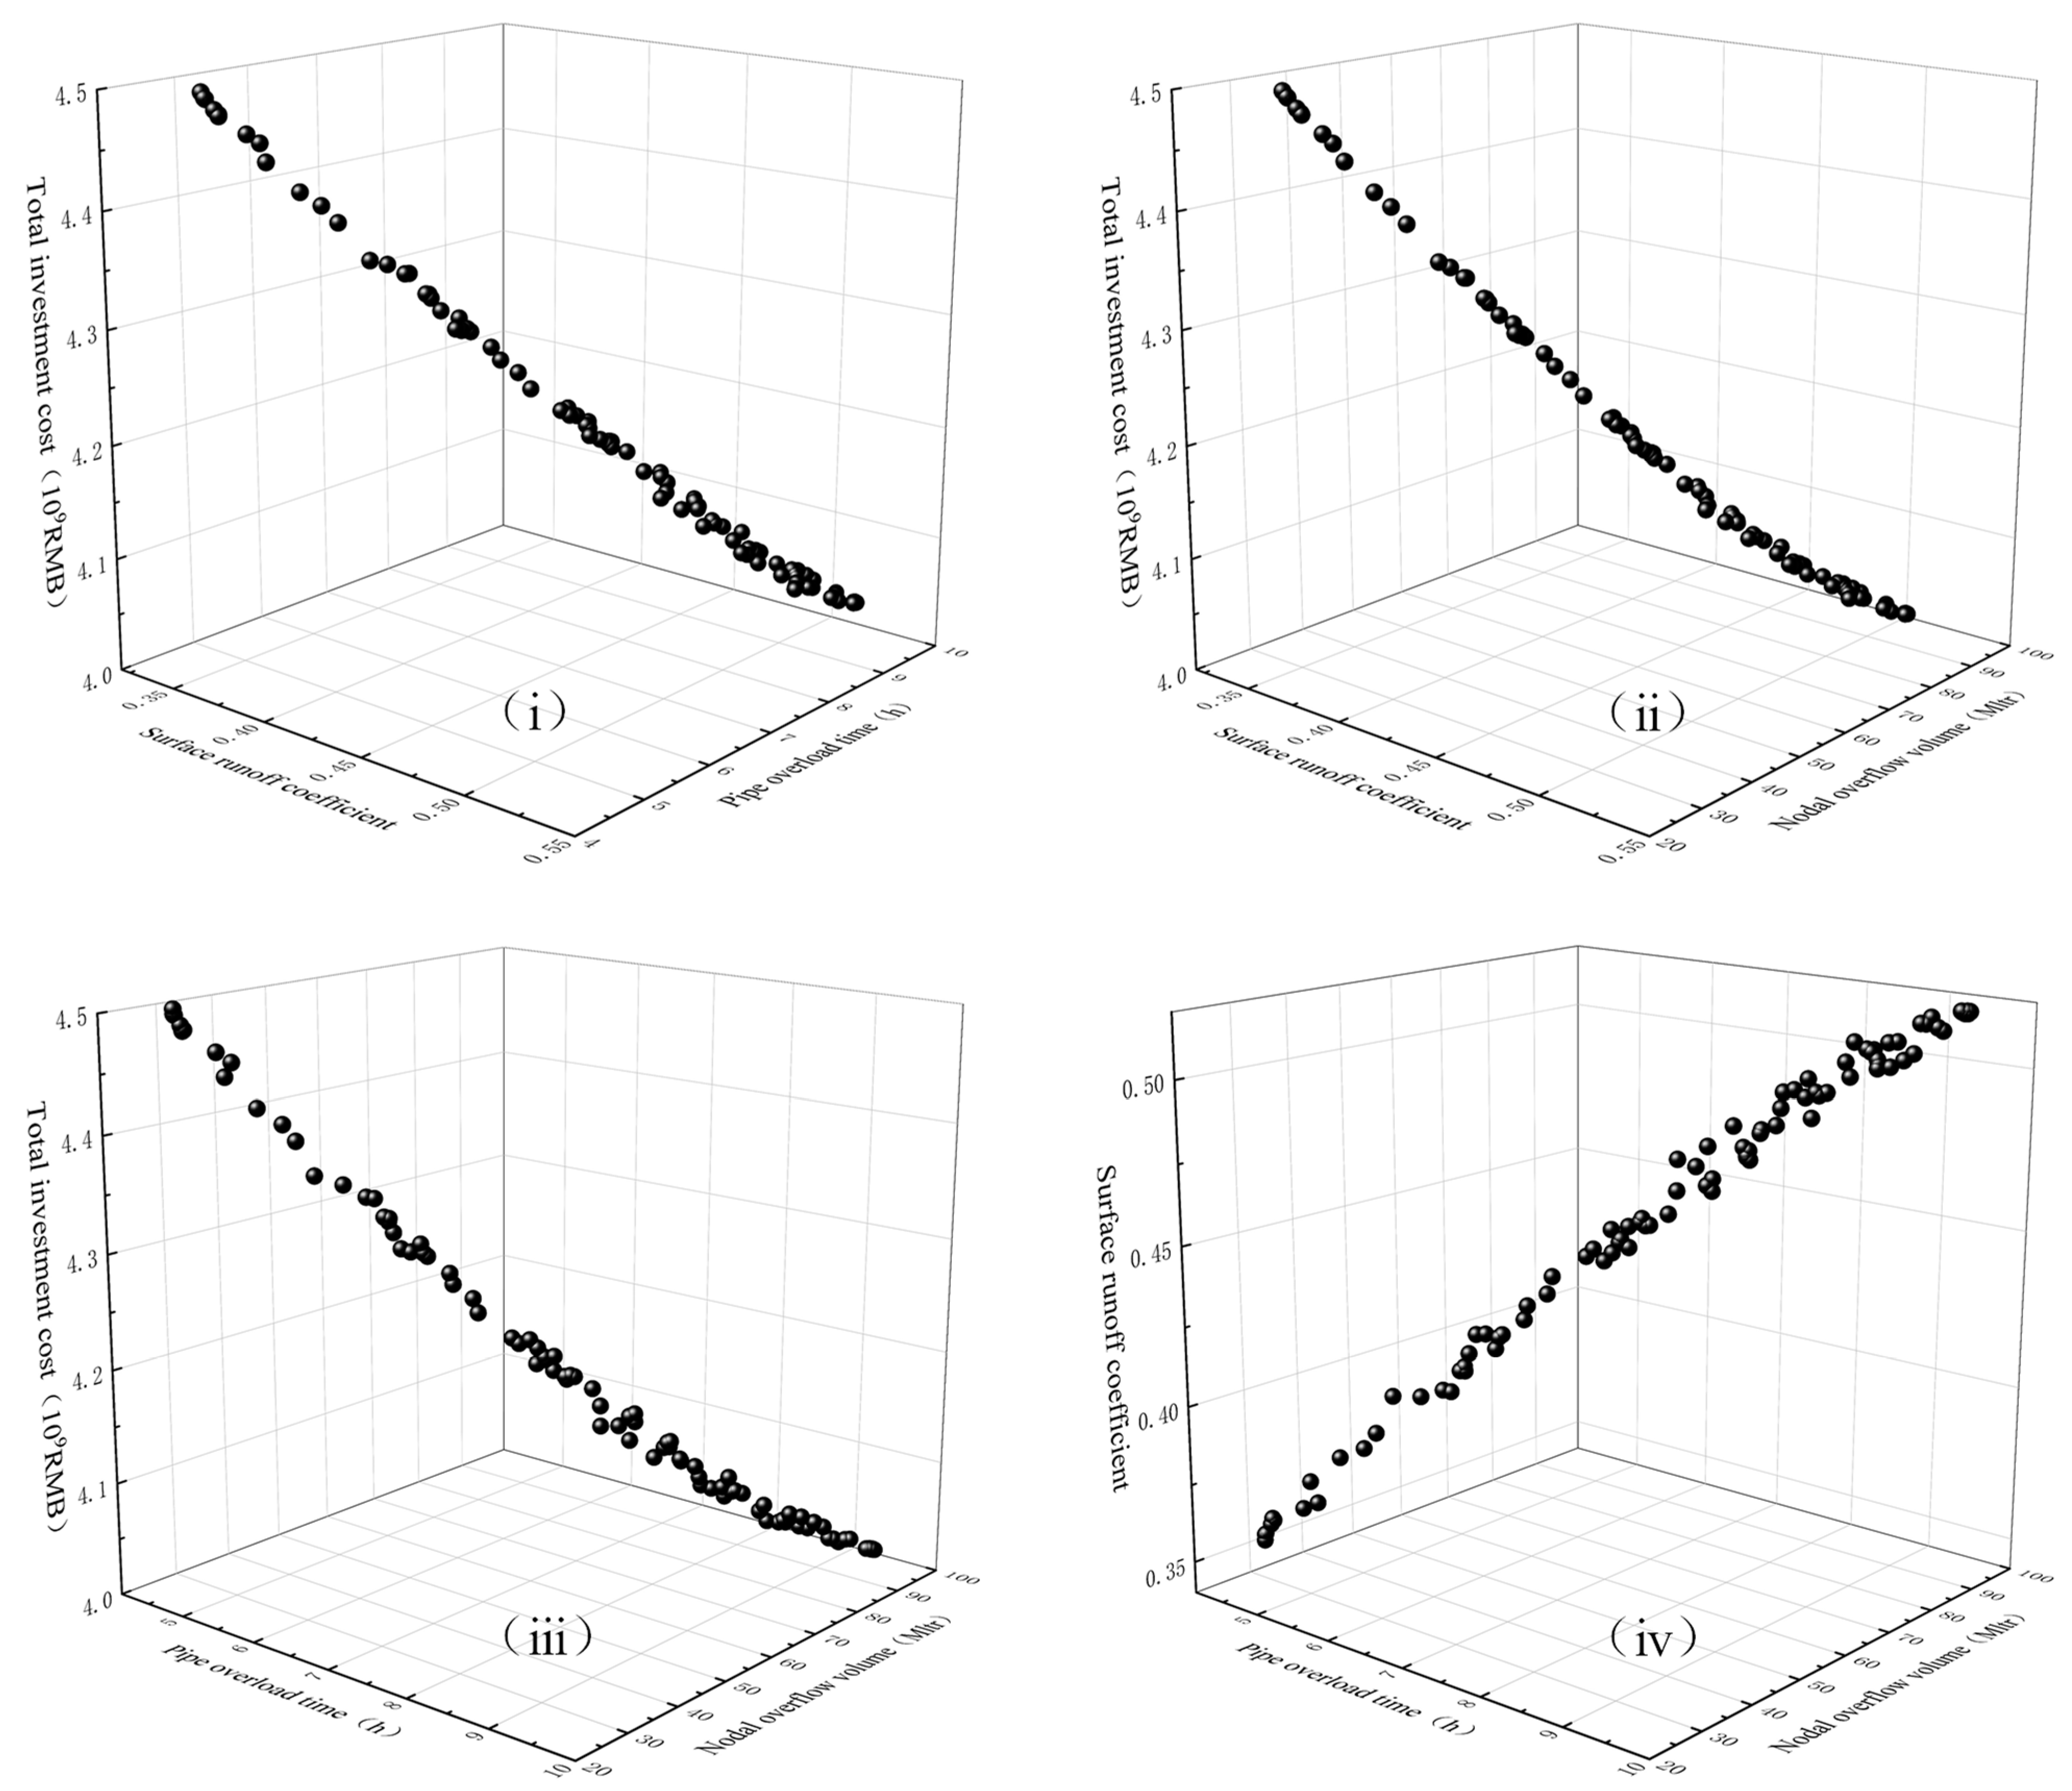
The results of each optimization algorithm will be different; record the set of optimized solutions obtained each time, and select a set of optimized solution sets with reasonable tradeoffs between the four objectives and good convergence to give examples in the article. The three-dimensional diagram of the Pareto front obtained by the optimization algorithm is shown in Figure 10i–ⅳ. Each point in the figure is a solution in the optimization scheme, and these points constitute the Pareto frontier. (i)–(iii) represents the relationship between the three indicators of urban flooding and the construction cost. The Pareto frontiers of these three plots are more convergent and have better continuity. All three indicators decrease with the increase in total investment costs for different design options. (iv) represents the relationship between the three indicators with a more dispersed Pareto frontier, indicating that the optimization algorithm weighs the three indicators differently.
To further analyze the optimization results, Figure 11ⅰ–ⅵ shows the projection of the Pareto frontier on different axes, respectively. The optimization model results show that the surface runoff coefficient of different optimized design schemes ranges from 0.355 to 0.519; the pipe overload time ranges from 4.501 to 9.702 h; the nodal overflow volume ranges from 27.980 to 90.100 Mltr; and the total investment cost is RMB 4.311–4.501 billion. In the optimization model, different optimization schemes will give different priorities to the three indicators, and the designer can choose a different scheme according to the planning requirements in the practical application.

3.4.3. Optimization Model Convergence Evaluation

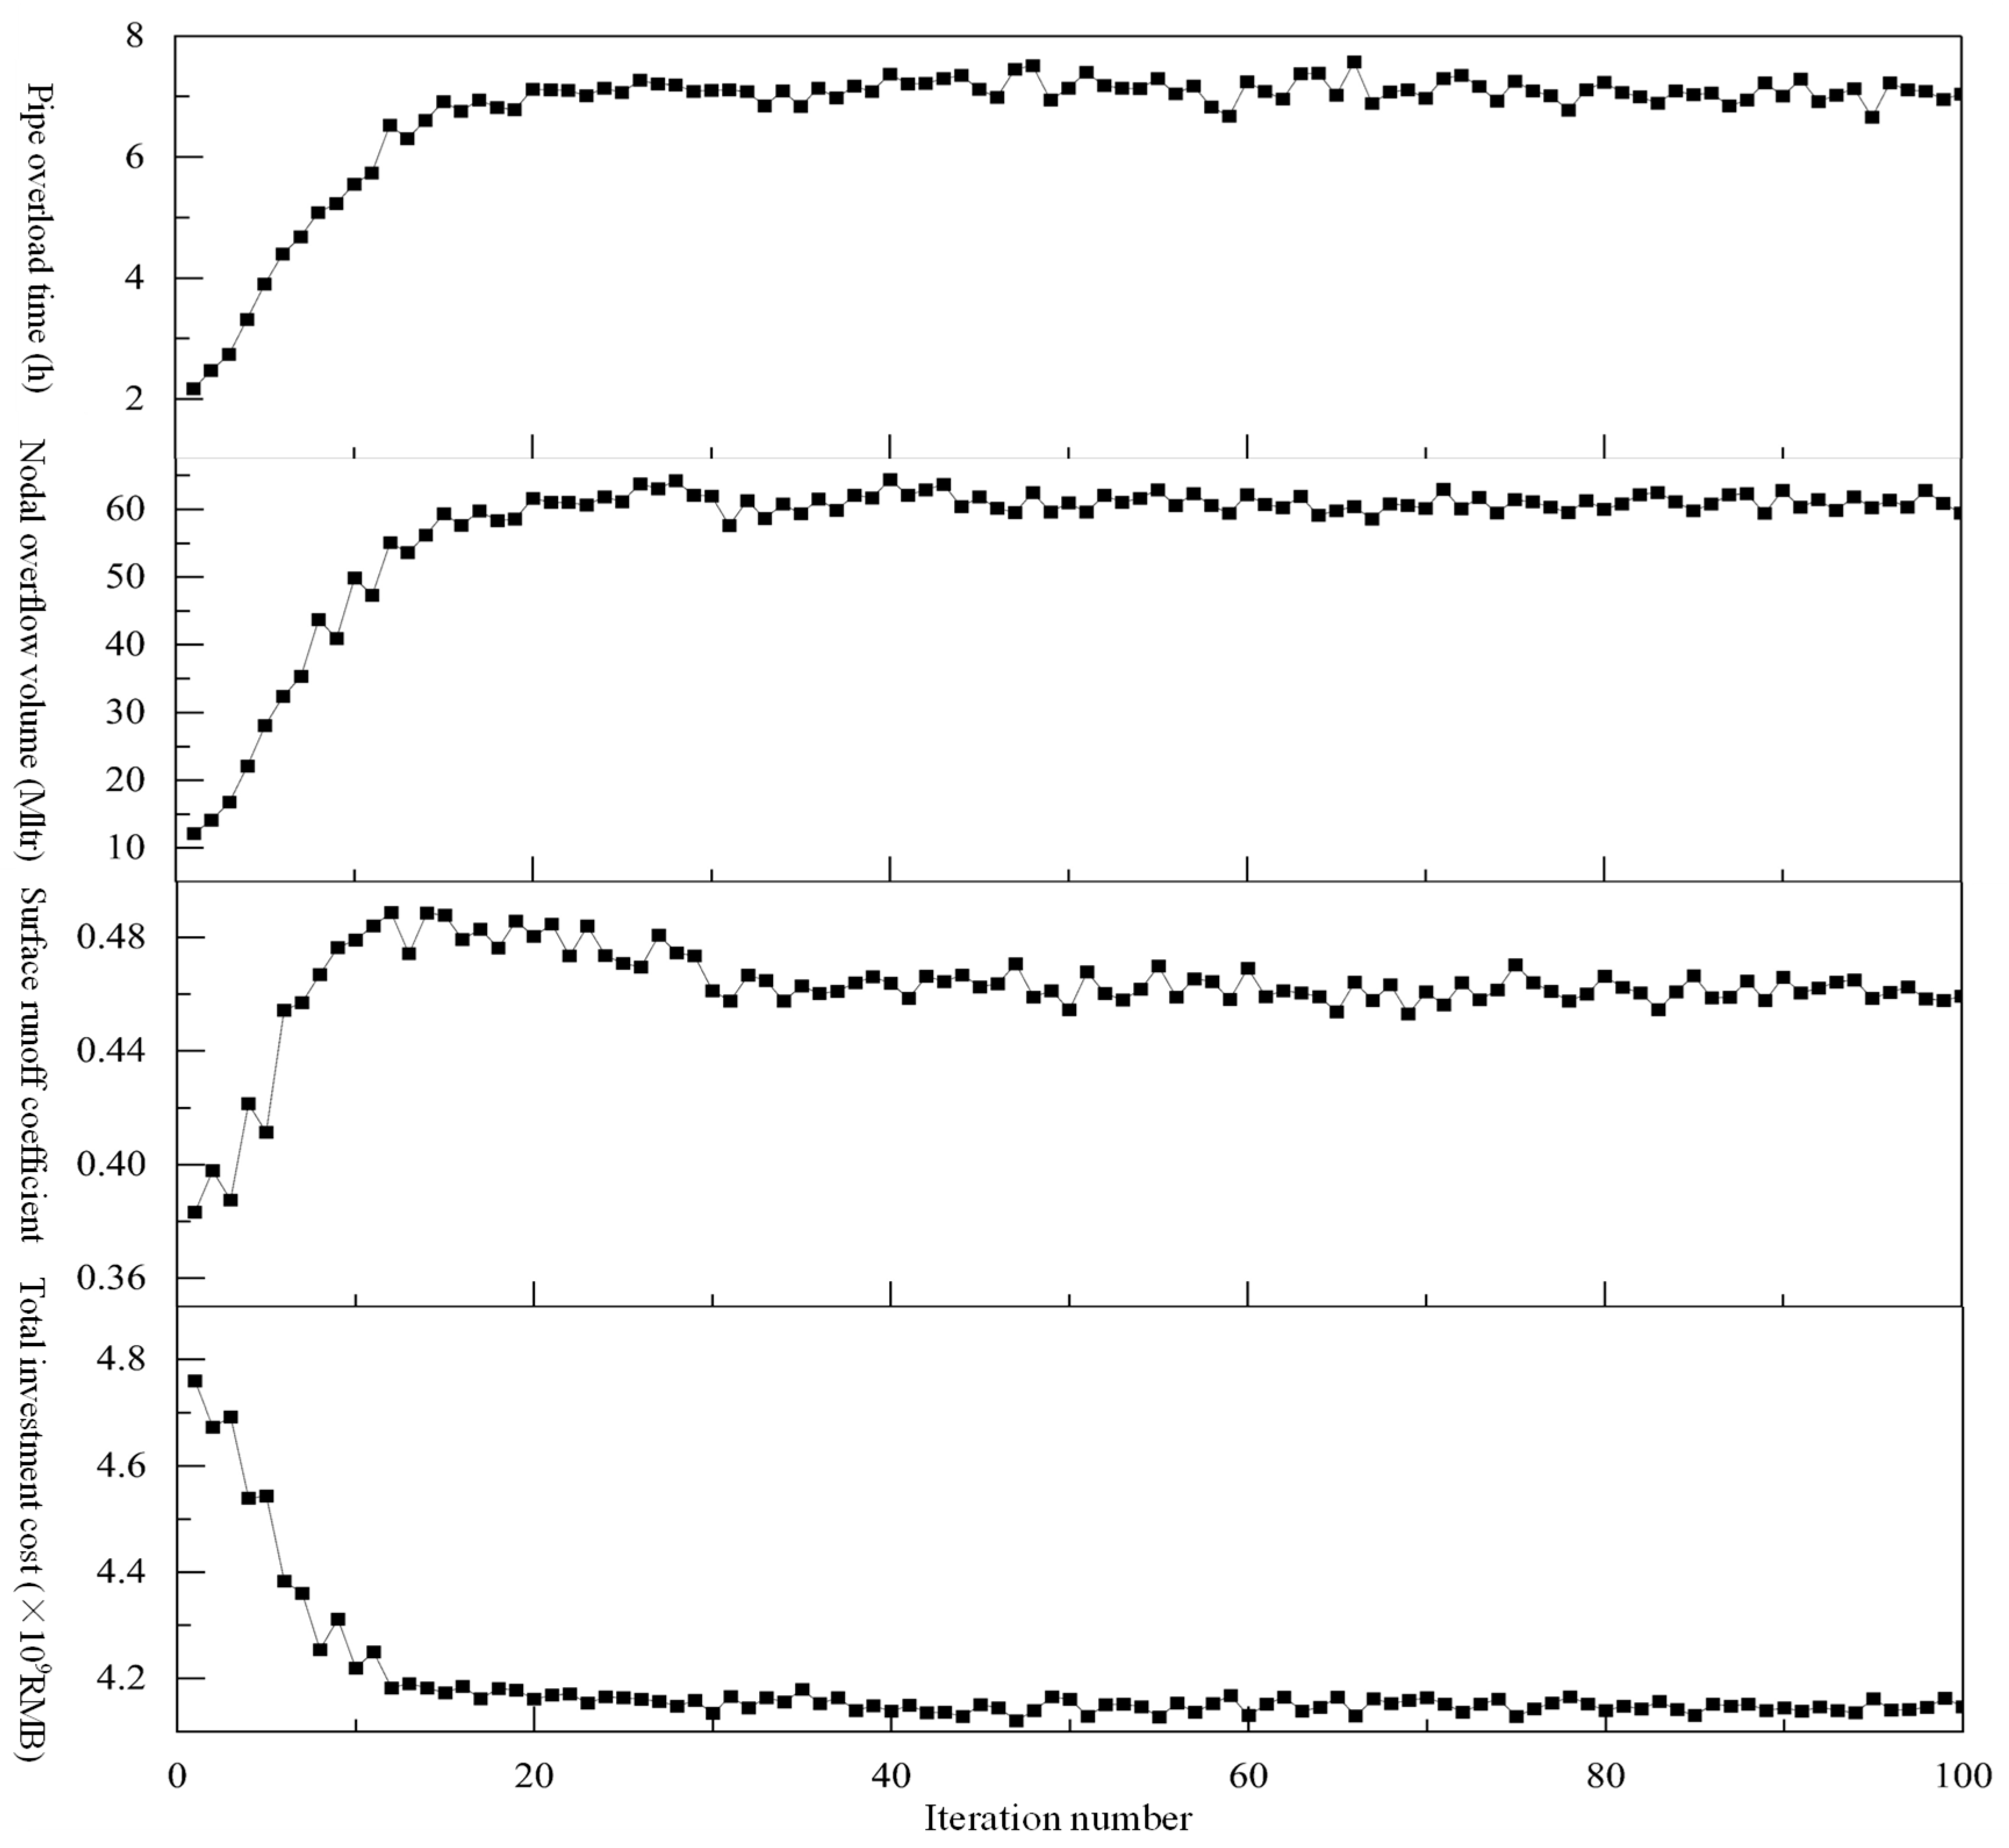
The convergence of the optimization model refers to the gradual stabilization of the model results as the number of iterations increases. The convergence of the model can be assessed by the average value of the objective function for different numbers of iterations, as shown in Figure 12.
The surface runoff coefficient starts to converge at about 40 generations, the pipe overload time starts to converge at about 20 generations, the nodal overflow volume starts to converge at about 30 generations, the total investment cost starts to converge at about 20 generations, and all the objective functions reach convergence after 45 generations. The optimization results after convergence can be obtained when the number of iterations is set to 100 generations. In the converged state, the average value of the objective functions is lower than the simulation results of the initial design scheme, which proves the effectiveness of the optimization model.

3.4.4. Optimization Model Validation

To verify the reasonableness of the optimization model, three sets of data from the Pareto frontier were selected and input into the SWMM model for simulation, and the simulation results were compared with the optimization calculation results to ensure the usability of the optimization model. The specific results are shown in Table 9. The difference between the optimization results and the simulation results is small enough to be used in this study, which also proves the reasonableness and effectiveness of the optimization model.

4. Discussion

4.1. Impact of Different Rainfall Return Periods on the Three Indicators

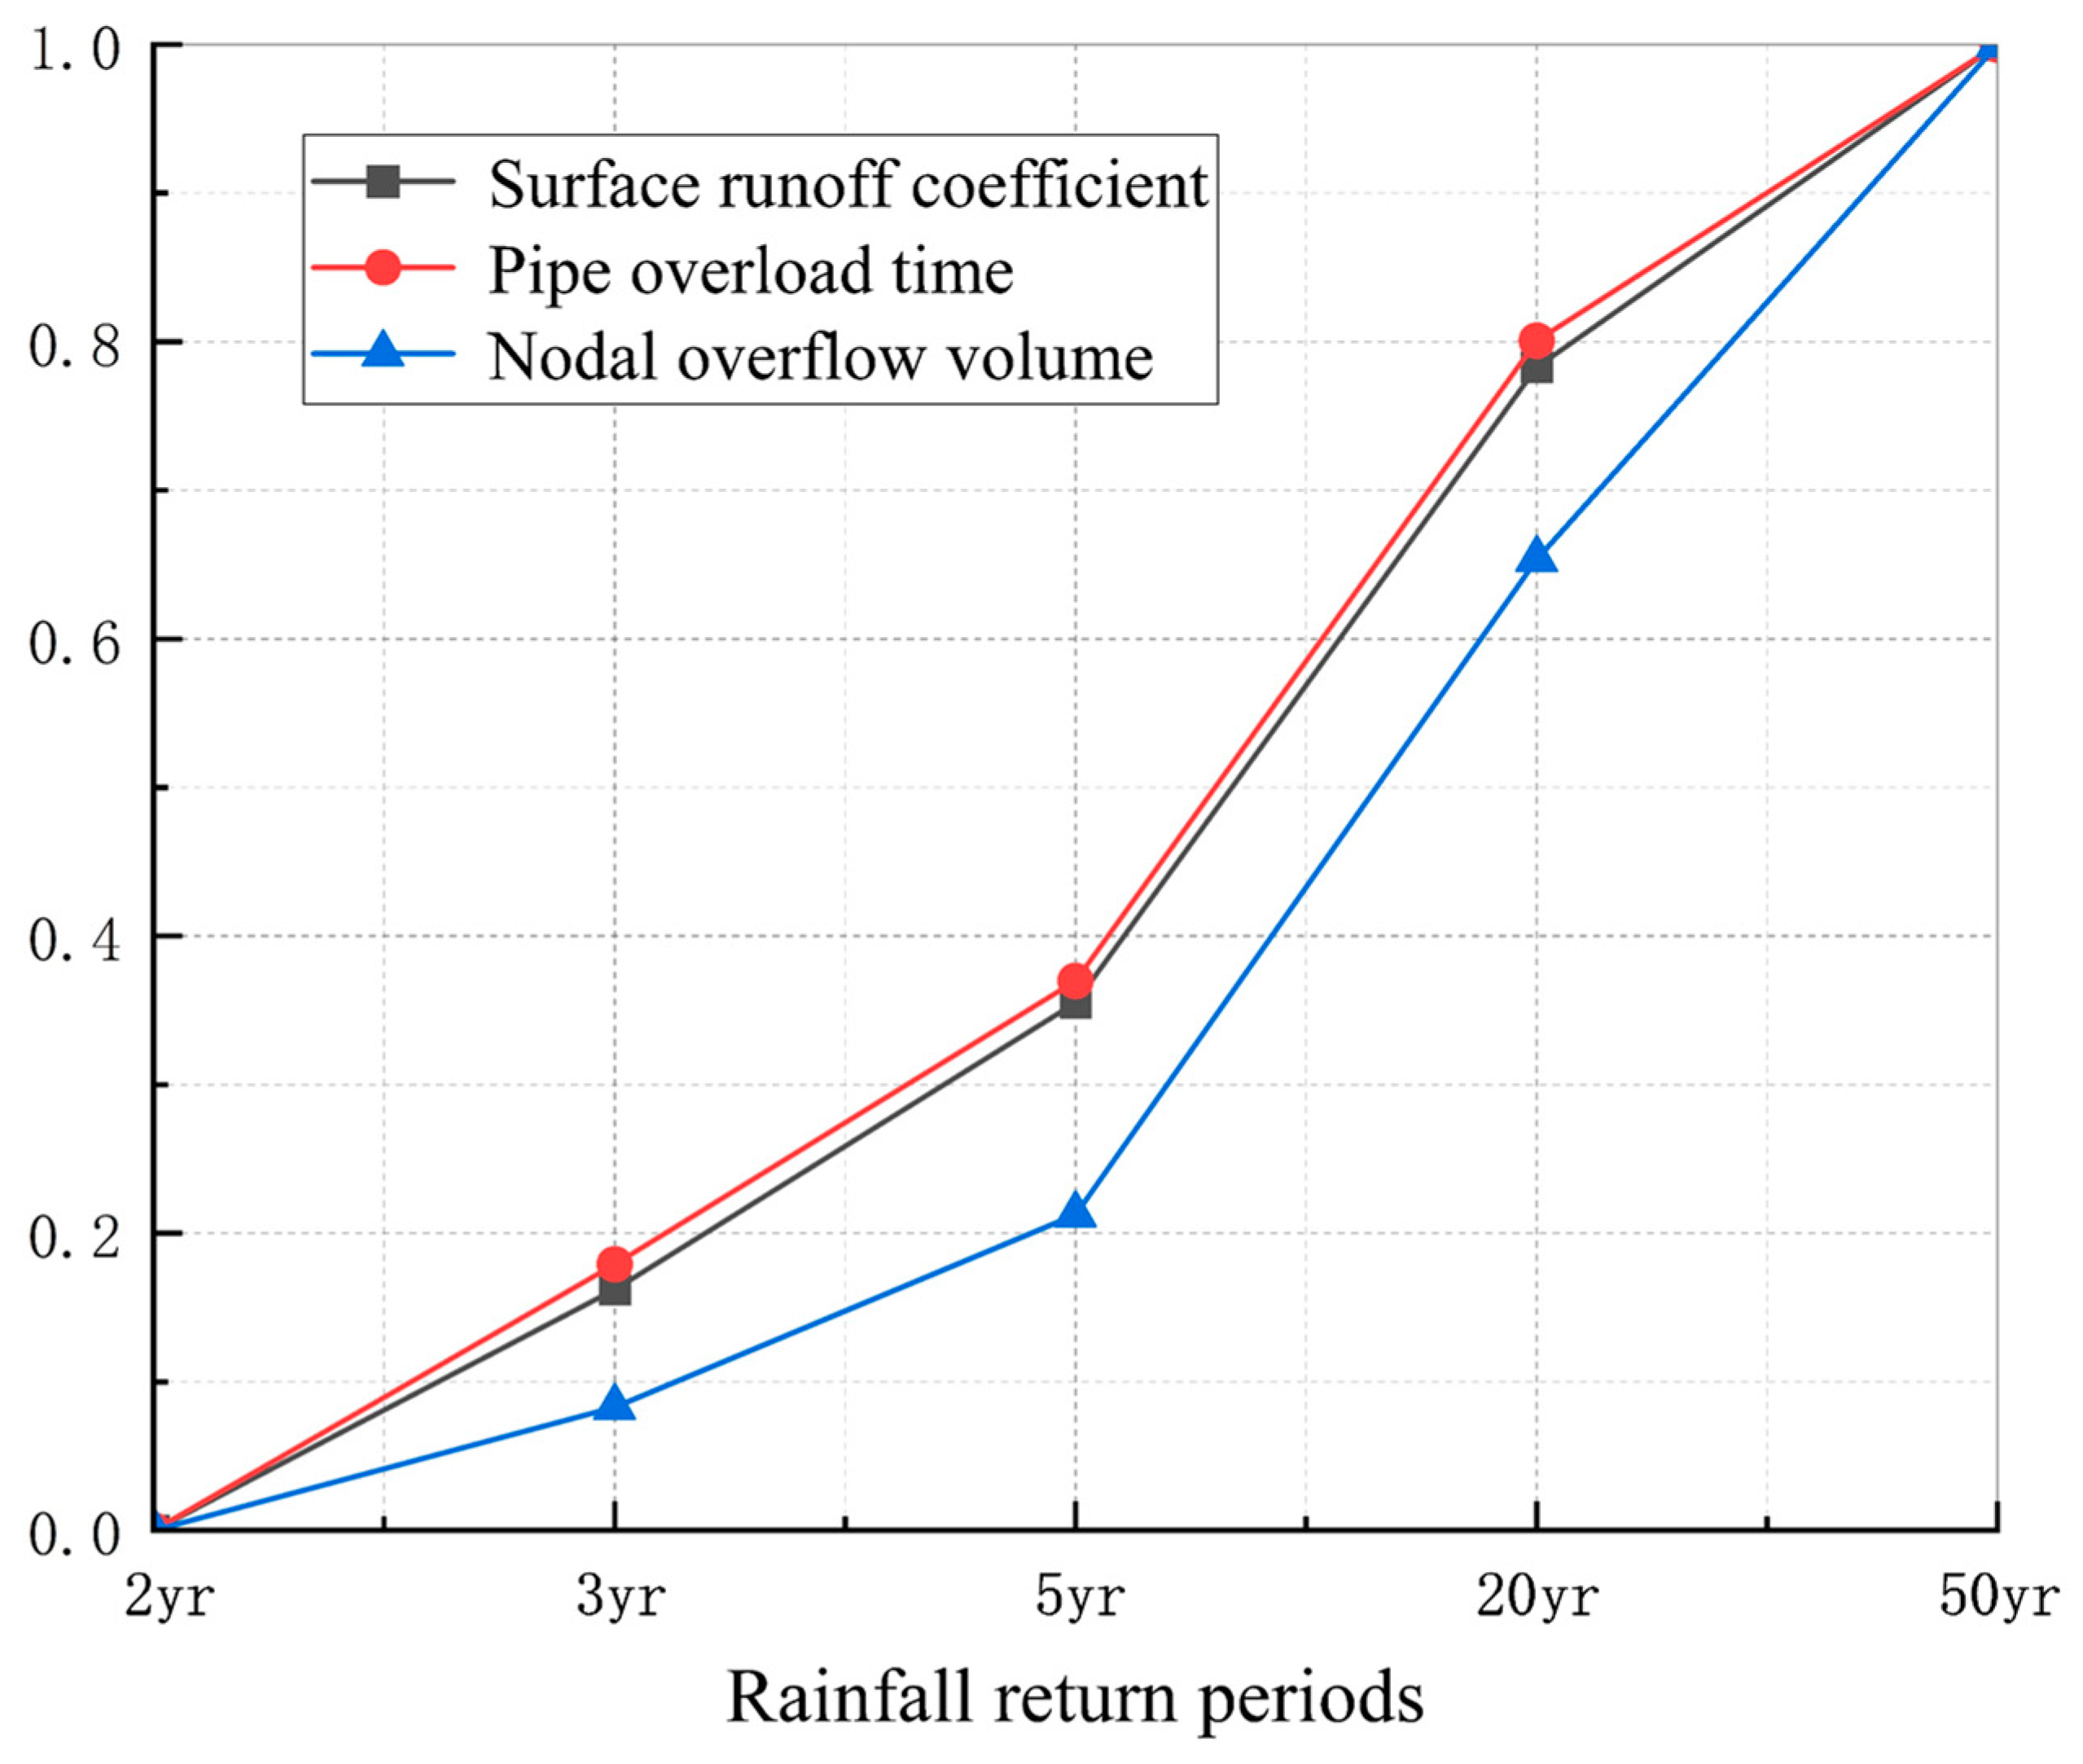
An increase in the rainfall return period increases the risk of urban flooding. Figure 13 shows the normalized SWMM model simulation results for the initial design scheme under five different rainfall return periods, and the increase in rainfall return period will cause the three indicators to increase to different degrees. When the rainfall return period is increased from 2 yr to 50 yr and the surface runoff coefficient, pipe overload time, and nodal overflow volume increase by 15.05%, 45.19%, and 86.93%, respectively, the increase in rainfall return period has a greater impact on the nodal overflow volume than the other two. The reason for the increase in all three evaluation indicators is the influence of rainfall intensity and surface storage. When the rainfall intensity is high, the surface storage is filled up in the initial stage of rainfall, and when the rainfall peak comes, the high-intensity rainfall is completely transformed into direct runoff. On the contrary, if the rainfall intensity is low, the surface storage is not filled before the rain peak, which will cut the intensity of surface runoff to some extent [43].

4.2. Multi-Objective Tradeoffs

After the optimization model has been iterated for 45 generations, a small fluctuation occurs around the average of the convergence curve objectives in the converged state due to the calibration trade-offs that the algorithm performs between the four objectives. Kollat et al. [44] point out in their study that meaningful multi-objective trade-offs are far less frequent when performing analyses of appropriate accuracy. From an optimization perspective, solutions within the defined range of multi-objective accuracies can be considered equal in the calibration objective space for the calibration period used, and thus there is no significant performance trade-off.
In this study, the objective tradeoffs are made more meaningful by assigning weight values to the objectives, with different priorities assigned to each of the four objectives, so the effect of objective accuracy on the optimization results is not considered in this study for the time being. The study area planning information indicates that the total investment cost has a higher priority, so the total investment cost is given a weight value of 0.4, and the surface runoff coefficient, pipeline overload time, and nodal overflow volume are given a weight value of 0.2, with a total weight value of 1.0. At this time, the optimization algorithm will be optimized with the reduction of the total investment cost as the primary objective, and each point in the Pareto front in Figure 9 is an optimization scheme after the trade-offs. Under the condition of higher priority of total investment cost, the surface runoff coefficient, pipe overload time, and node overflow are roughly proportional to each other, and when the surface runoff coefficient increases, the pipe overload time and node overflow also increase. The surface runoff coefficient, pipe overload time, and nodal overflow are approximately inversely proportional to the total investment cost; the higher the total investment cost, the lower the surface runoff coefficient, the shorter the pipe overload time, and the smaller the nodal overflow, and vice versa. If the priority of other objectives is higher, adjusting the corresponding weight values and recalculating can get the corresponding optimization results.

4.3. Scheme Assessment

In order to analyze the effect of the optimization model, the NSGA-III optimization model scheme is compared with the initial scheme and the other three schemes (the comprehensive pipe corridor rainwater chamber scheme, the combination LID measures scheme, and the manual optimization scheme), and the rainfall return period is unified as 50 a. The ranges of the objective function values obtained from the optimization model and the simulation results obtained from the other four design schemes are compared, and the results are summarized in Table 10.
The NSGA-III optimization model obtains values of the three evaluation indicators that are smaller than the initial design scheme, indicating that the NSGA-III optimization model produces the effective scheme. The comprehensive pipe corridor rainwater chamber scheme can well solve the two problems of pipe overload time and nodal overflow, but the reduction effect on surface runoff coefficient is very poor. The combination LID measures scheme has a good reduction effect on all three indicators, but the reduction effect of combination LID measures on pipe overload time and nodal overflow is lower than the comprehensive pipe corridor rainwater chamber scheme, and a large number of LID measures need to be laid in the study area if a better flood mitigation effect is to be achieved, which is obviously not quite realistic. A small number of combination LID measures combined with a comprehensive pipe corridor rainwater chamber also have a good reduction effect on urban flooding, and the manual optimization scheme has a good reduction effect on all three evaluation indicators. However, this scheme does not consider the priority of the three indicators, which may differ greatly from the actual planning requirements. And the optimization solution set obtained from the optimization model provides a choice space for the designer, who can choose the appropriate optimization scheme according to the investment budget of the project and the priority order of the flood control requirements.
Long Chen et al. [26] utilized the NSGA-II algorithm to build an optimization model to solve for the three objectives of lowest construction cost, highest rate of total runoff control, and highest pollutant removal rate for LID facilities, and the results showed that the combination of solutions provided by the optimization model can achieve higher benefits through lower costs compared to manual optimization solutions. Boyuan Yang et al. [27] also utilized the NSGA-II algorithm to build an optimization model for solving the optimization with the objective of optimizing the detailed size and location of the LID measures. The results showed that the results obtained from the optimization model exhibited suitable performance in all the objectives as compared to other optimized designs. The results obtained by the above two people in their studies are the same as the results obtained in this study. The NSGA-III optimization model considers four objective functions and achieves the effect of simultaneous optimization of multiple objectives, which avoids poor consideration and a large number of complex calculations when manually determining the solutions subjectively. Compared with the other four design schemes, the NSGA-III optimization model shows good optimization performance in terms of all objectives, and the optimization results are valid and reliable. It also verifies that the NSGA-III algorithm can effectively deal with such problems.

5. Conclusions

In this study, we propose a method of combining the comprehensive pipe corridor rainwater chamber and combination LID measures into a sponge-type comprehensive pipe corridor rainwater chamber to mitigate flooding. SWMM models for four situations were developed, and simulation results were obtained. Then a multi-objective optimization model for the study area is established by coupling the SWMM model with the NSGA-III algorithm, which is suitable for solving such problems, and the main conclusions are as follows:
(1)
A four-objective NSGA-III optimization model is established, and two traditional drainage system state indicators, surface runoff coefficient and total investment cost, are selected as the optimization objectives to be solved, and optimization schemes are obtained;
(2)
The NSGA-III optimization model can realize the simultaneous optimization of surface runoff coefficient, pipe overload time, node overflow, and total investment cost, which can effectively reduce the three flooding evaluation indexes and control the total investment cost. The NSGA-III optimization algorithm has high reliability and effectiveness in this field;
(3)
The NSGA-III optimization model has a better mitigation effect than the integrated pipe corridor rainwater tank scheme and the combined LID measure scheme and has more choice space compared with the manual optimization scheme;
(4)
According to the Pareto front, surface runoff coefficient, pipe overload time, and nodal overflow volume are proportional to each other, while they are inversely proportional to the total investment cost, and designers must consider the balance and priority between them.
Future sponge city design and planning will need to consider more factors. Urban flood control is an important factor; the current research based on LID measures to prevent flooding is mostly concentrated in a small area; when faced with a larger study area, it seems less applicable; and comprehensive pipe corridors are also a must for future urban construction. The combination of the two, together as a sponge factor, will play a role in achieving the method of alleviating urban flooding, which is in line with the future concept of green urban development. The optimization scheme proposed in this paper can provide a reference for the design scheme of the integrated pipe corridor and LID in future sponge city construction.

Author Contributions

Conceptualization, Y.R. and H.Z.; methodology, Y.R. and H.Z.; validation, H.Z., Y.R. and Y.C.; formal analysis, H.Z.; investigation, H.Z., Y.R., Y.C. and X.W.; resources, H.Z.; data curation, Y.R.; writing—original draft, Y.R. and H.Z.; writing—review and editing, H.Z. and Y.R.; visualization, H.Z. and L.F.; supervision, Z.G.; project administration, H.Z.; funding acquisition, H.Z. All authors have read and agreed to the published version of the manuscript.

Funding

This study was funded by the Scientific Research Fund Project of Yunnan Provincial Education Department (Grant No.2022 J0302) and the Key R&D and Promotion Projects in Henan Province (tackling key problems in science and technology) (Grant No. 232102321010). The help and support given were greatly appreciated.

Data Availability Statement

Not applicable.

Acknowledgments

The authors express thanks to all members of the laboratory team for their help with the technical support.

Conflicts of Interest

The authors declare no conflict of interest.

References

  1. Tian, J.; Zhang, Z.; Ahmed, Z.; Zhang, L.; Su, B.; Tao, H.; Jiang, T. Projections of precipitation over China based on CMIP6 models. Stoch. Environ. Res. Risk Assess. 2021, 35, 831–848. [Google Scholar]
  2. Liu, Y.; Liu, Y.; Zheng, J.; Chai, F.; Ren, H. Intelligent Prediction Method for Waterlogging Risk Based on AI and Numerical Model. Water 2022, 14, 2282. [Google Scholar]
  3. Shi, J.; Cui, L. Characteristics of high impact weather and meteorological disaster in Shanghai, China. Nat. Hazards 2012, 60, 951–969. [Google Scholar]
  4. Quan, R.S.; Liu, M.; Lu, M.; Zhang, L.J.; Wang, J.J.; Xu, S.Y. Waterlogging risk assessment based on land use/cover change: A case study in Pudong New Area, Shanghai. Environ. Earth Sci. 2010, 61, 1113–1121. [Google Scholar]
  5. Billot, R.; Faouzi, N.E.E.; Sau, J.; De Vuyst, F. Integrating the impact of rain into traffic management: Online traffic state estimation using sequential Monte Carlo techniques. Transp. Res. Rec. 2010, 2169, 141–149. [Google Scholar]
  6. Tran, D.; Xu, D.; Dang, V.; Alwah, A.A.Q. Predicting Urban Waterlogging Risks by Regression Models and Internet Open-Data Sources. Water 2020, 12, 879. [Google Scholar]
  7. Rui, W.; Zhi, L.; Yu, L.; Xuan, J. Optimization Study of Urban Drainage System Rehabilitation Based on SWMM. Water Resour. Hydropower Eng. 2018, 49, 60–69. (In Chinese) [Google Scholar]
  8. Lu, T.; Jin, H.; Zhang, L.; Zhi, Y.; Qing, L. SWMM-based Bottleneck Analysis and Rehabilitation Evaluation of Urban Drainage Networks. China Water Wastewater 2018, 34, 112–117. (In Chinese) [Google Scholar]
  9. Saldarriaga, J.; Zambrano, J.; Herrán, J.; Iglesias-Rey, P.L. Layout Selection for an Optimal Sewer Network Design Based on Land Topography, Streets Network Topology, and Inflows. Water 2021, 13, 2491. [Google Scholar]
  10. Kwon, S.H.; Jung, D.; Kim, J.H. Optimal layout and pipe sizing of urban drainage networks to improve robustness and rapidity. J. Water Resour. Plan. Manag. 2021, 147, 6021003. [Google Scholar]
  11. Bayas-Jiménez, L.; Martínez-Solano, F.J.; Iglesias-Rey, P.L.; Mora-Meliá, D. Search Space Reduction for Genetic Algorithms Applied to Drainage Network Optimization Problems. Water 2021, 13, 2008. [Google Scholar]
  12. Davis, A.P.; McCuen, R.H. Stormwater Management for Smart Growth; Springer Science & Business Media: Berlin/Heidelberg, Germany, 2005. [Google Scholar]
  13. Livesley, S.J.; Baudinette, B.; Glover, D. Rainfall interception and stem flow by eucalypt street trees—The impacts of canopy density and bark type. Urban For. Urban Green. 2014, 13, 192–197. [Google Scholar]
  14. Bliss, D.J.; Neufeld, R.D.; Ries, R.J. Storm water runoff mitigation using a green roof. Environ. Eng. Sci. 2009, 26, 407–418. [Google Scholar]
  15. Alfredo, K.; Montalto, F.; Goldstein, A. Observed and modeled performances of prototype green roof test plots subjected to simulated low-and high-intensity precipitations in a laboratory experiment. J. Hydrol. Eng. 2010, 15, 444–457. [Google Scholar]
  16. Hou, J.; Sun, S.; Wang, Y.; Wang, J.; Yang, C. Comparison of runoff from low-impact development measures in arid and humid cities. In Proceedings of the Institution of Civil Engineers-Water Management; Thomas Telford Ltd.: London, UK, 2022; Volume 175, pp. 135–148. [Google Scholar]
  17. Huang, C.L.; Hsu, N.S.; Liu, H.J.; Huang, Y.H. Optimization of low impact development layout designs for megacity flood mitigation. J. Hydrol. 2018, 564, 542–558. [Google Scholar]
  18. Liu, W.; Chen, W.; Peng, C. Assessing the effectiveness of green infrastructures on urban flooding reduction: A community scale study. Ecol. Model. 2014, 291, 6–14. [Google Scholar]
  19. Xia, L.; Yu, L.; Guo, L. Simulation Study of Stormwater Control in Old Urban Areas Based on SWMM and Low Impact Development Patterns. Water Wastewater Eng. 2015, 51, 152–156. (In Chinese) [Google Scholar]
  20. Xiong, L.; Tian, T.; Xiang, C.; Xiao, Y.; Zhuo, S. Analysis of the Effectiveness of Comprehensive Pipeline Corridor Rainwater Pods in Mitigating Urban Flooding. Water Resour. Prot. 2021, 37, 20–26. (In Chinese) [Google Scholar]
  21. Lopes, M.D.; da Silva, G.B.L. An efficient simulation-optimization approach based on genetic algorithms and hydrologic modeling to assist in identifying optimal low impact development designs. Landsc. Urban Plan. 2021, 216, 104251. [Google Scholar]
  22. Hou, J.; Yuan, H. Optimal spatial layout of low-impact development practices based on SUSTAIN and NSGA-II. Desalination Water Treat 2020, 177, 227–235. [Google Scholar]
  23. Fang, L.; Jin, Z.; Ming, L.; Wen, P.; Qi, W.; Jing, Z. Current status and trend of research on optimization of urban low-impact development schemes. Water Conserv. Sci. Technol. Econ. 2018, 24, 7–10+26. [Google Scholar]
  24. Duan, H.F.; Li, F.; Yan, H. Multi-objective optimal design of detention tanks in the urban stormwater drainage system: LID implementation and analysis. Water Resour. Manag. 2016, 30, 4635–4648. [Google Scholar]
  25. Kumar, S.; Guntu, R.K.; Agarwal, A.; Villuri, V.G.K.; Pasupuleti, S.; Kaushal, D.R.; Gosian, A.K.; Bronstert, A. Multi-objective optimization for stormwater management by green-roofs and infiltration trenches to reduce urban flooding in central Delhi. J. Hydrol. 2022, 606, 127455. [Google Scholar]
  26. Yang, B.; Zhang, T.; Li, J.; Feng, P.; Miao, Y. Optimal designs of LID based on LID experiments and SWMM for a small-scale community in Tianjin, north China. J. Environ. Manag. 2023, 334, 117442. [Google Scholar]
  27. Long, C.; Ying, L. Optimization of Spatial Layout of Low-Impact Development Facilities Based on Stormwater Management Model and NSGA-II Algorithm—A Residential Cluster in Tongzhou, Beijing. Urban Plan. Int. 2022, 37, 42–48. (In Chinese) [Google Scholar]
  28. U.S. Environmental Protection Agency. Storm Water Management Model User’s Manual Version 5.2; U.S. Environmental Protection Agency: Washington, DC, USA, 2022. [Google Scholar]
  29. Xing, L. Calibration of urban rainfall runoff model parameters based on runoff coefficients. Water Wastewater Eng. 2009, 45, 213–217. (In Chinese) [Google Scholar]
  30. Zhong, Z.; Jing, C. Concise Drainage Design Manual; China Construction Industry Press: Beijing, China, 1990. [Google Scholar]
  31. GB/50838-2015; Standard for Technical Specification for Urban Comprehensive Pipe Corridor Engineering. Standardization Administration of China: Beijing, China, 2019. (In Chinese)
  32. Fan, X.; Wen, J.; Xiao, Y.; Jun, L. Key points of pipeline design for rainwater and sewage pipes in comprehensive pipeline corridors. China Water Wastewater 2018, 34, 41–46. [Google Scholar]
  33. Man, Z.; Ke, Z.; Ting, Z.; Jian, Z.; Ping, F. Analysis of hydrological effects of typical urban LID measures and the effectiveness of rainfall and flood control. J. Hydroelectr. Eng. 2019, 38, 57–71. [Google Scholar]
  34. Han, Z.; Zeng, D.; Zhao, Q.; Xin, J.; Hong, J.; Rong, C. Simulation and Evaluation of Low-Impact Development Effects in Urban Industrial Parks Based on SWMM Modeling. Water Resour. Prot. 2019, 35, 32–36. [Google Scholar]
  35. Shuang, H.; Jun, L.; Jia, Q. Simulation and Evaluation of the Effectiveness of Stormwater Control and Utilization of Low-Impact Development Models Based on SWMM Models. Water Resour. Power 2019, 35, 32–36. [Google Scholar]
  36. Liao, X.; Zheng, J.; Huang, C.; Huang, G. Approach for Evaluating LID Measure Layout Scenarios Based on Random Forest: Case of Guangzhou—China. Water 2018, 10, 894. [Google Scholar]
  37. Wen, X.; Zhu, J.; Yi, Y.; Meng, Z.; Ning, L.; Jia, G.; Jia, L. Flooding Analysis and LID Rehabilitation Study in Nanchang City by MIKE & SWMM. Water Resour. Power 2023, 41, 77–81+171. [Google Scholar]
  38. Xiang, L.; Cheng, L.; Zhao, W.; Zhao, Z.; Guang, L.; Jun, Z. Impact of LID Retrofit on Urban Flooding and Surface Source Pollution. Water Resour. Prot. 2021, 37, 131–139. [Google Scholar]
  39. Deb, K.; Jain, H. An evolutionary many-objective optimization algorithm using reference-point-based nondominated sorting approach, part I: Solving problems with box constraints. IEEE Trans. Evol. Comput. 2013, 18, 577–601. [Google Scholar]
  40. Jain, H.; Deb, K. An evolutionary many-objective optimization algorithm using reference-point based nondominated sorting approach, part II: Handling constraints and extending to an adaptive approach. IEEE Trans. Evol. Comput. 2013, 18, 602–622. [Google Scholar]
  41. Ministry of Housing and Construction of China. Technical Guidelines for Sponge City Construction—Low Impact Development Stormwater System Construction (Trial); Ministry of Housing and Construction of China: Beijing, China, 2014. (In Chinese) [Google Scholar]
  42. Heng, W. Research on the whole process cost management of comprehensive pipeline corridor project based on BIM. Constr. Econ. 2021, 42, 53–58. [Google Scholar]
  43. Jemberie, M.A.; Melesse, A.M. Urban Flood Management through Urban Land Use Optimization Using LID Techniques, City of Addis Ababa, Ethiopia. Water 2021, 13, 1721. [Google Scholar]
  44. Kollat, J.B.; Reed, P.M.; Wagener, T. When are multiobjective calibration trade-offs in hydrologic models meaningful? Water Resour. Res. 2012, 48, W0352. [Google Scholar] [CrossRef]
Figure 1. Overall flow chart of the study.
Water 15 03319 g001
Figure 2. Scheme program relationship.
Water 15 03319 g002
Figure 3. Study area.
Water 15 03319 g003
Figure 4. Generalized map of the study area.
Water 15 03319 g004
Figure 5. Heavy rainfall process under 5 rainfall return periods.
Water 15 03319 g005
Figure 6. Cross-section design of the comprehensive pipe corridor.
Water 15 03319 g006
Figure 7. Diagram of the optimization model construction process.
Water 15 03319 g007
Figure 8. Effect of different rainwater chamber section sizes on the three indicators under different rainfall return periods.
Water 15 03319 g008
Figure 9. Effect of different LID percentages on the three indicators under different rainfall return periods.
Water 15 03319 g009
Figure 10. Pareto frontier in three dimensions.
Water 15 03319 g010
Figure 11. Projections of Pareto front on different axes.
Water 15 03319 g011
Figure 12. Convergence of the four objective functions.
Water 15 03319 g012
Figure 13. Effect of different rainfall return periods on the three indicators.
Water 15 03319 g013
Table 1. Design rainfall.
Rains Return Period (yr)2352050
Rainfall depth (mm)57.4860.5168.1088.71102.33
Table 2. Suggested values for comprehensive runoff coefficients.
Degree of Land DevelopmentValues
Most densely built-up central area (imperviousness rate > 70%)0.6~0.8
More densely built-up residential areas (50% < imperviousness rate < 70%)0.5~0.7
Sparsely built-up residential areas (30% < imperviousness rate < 50%)0.4~0.6
Sparsely populated areas (imperviousness rate < 30%)0.3~0.5
Table 3. Validation results of SWMM model parameters.
ItemMain ParametersValue RangeFinal Value
Sub-catchmentsManning coefficients in impervious areas0.011~0.0140.013
Manning coefficients in pervious areas0.150.15
Depression storage in impervious areas/mm1.27~2.542
Depression storage in pervious areas/mm3~108
PipePipeline Manning’s Coefficient0.012~0.0150.012
Infiltration Data
(HORTON)
Maximum infiltration rate (mm/h)75.4
Minimum infiltration rate (mm/h)3.66
Infiltration decay constant (1/h)2
Drainage time/d7
Table 4. Land use type.
Land Use TypeArea (hm2)Percentage (%)
residential land299.0026.0
Public administration and public service land113.859.9
Business services facilities land136.8511.9
Industrial land162.1514.1
Logistics and warehousing land148.3512.9
Roads and Transportation Facility Land164.4514.3
Serviced land21.851.9
Green space and plaza land103.509.0
Total1150.00100
Table 5. LID measure combination approach.
No.Land Use TypeCombination
1residential land,
Public administration and public service land
and Business services facilities land
50% green roof + 30% permeable pavement
+10% vegetative swale + 10% bioretention pond
2Industrial land40% green roof + 40% permeable pavement
+10% vegetative swale + 10% bioretention pond
3Logistics and warehousing land30% green roof + 50% permeable pavement
+10% vegetative swale + 10% bioretention pond
4Roads and Transportation Facility Land80% permeable pavement
+10% vegetative swale + 10% bioretention pond
5Green space and plaza land40% permeable pavement
+30% vegetative swale + 30% bioretention pond
Table 6. Parameter values for LID measures.
LID MeasuresStructural LayerDesign ParametersParameter Values (%)
Green roofsurfaceberm height/mm80
surface roughness0.25
surface slope/%1
vegetation volume fraction0.4
soilthicknesses/mm150
porosity0.18
hydraulic conductivity/mm·h−118
storagethicknesses/mm20
porosity0.5
permeable pavementsurfaceberm height/mm20
surface roughness0.11
surface slope/%1
pavementthicknesses/mm120
void ratio0.5
permeability/mm·h−1300
storagethicknesses/mm250
void ratio0.43
bioretention pondsurfaceberm height/mm300
surface roughness0.15
surface slope/%1
vegetation volume fraction0.4
soilthicknesses/mm500
porosity0.18
hydraulic conductivity/mm·h−118
storagethicknesses/mm200
void ratio0.75
vegetative swalesurface berm height/mm150
surface roughness0.2
surface slope/%0.2
swale side slope3
Table 7. Investment costs for comprehensive pipe corridor and LID construction.
ItemItemsUnit Cost (RMB/m2)Total Unit Cost after Calculation (RMB)
LID measuresGreen roof17916,723,411.52
permeable pavement1049,716,395.52
bioretention pond45842,789,511.04
vegetative swale878,128,138.56
Comprehensive pipe corridorComprehensive pipe corridor2183159,512,137.45
Table 8. Values of the three indicators in different rainfall return periods.
Indicators2 yr3 yr5 yr20 yr50 yr
Surface runoff coefficient0.7070.7260.7480.7990.824
Pipe overload time/h30.45034.40938.62548.14852.552
Nodal overflow/Mltr24.31237.71258.701130.042186.071
Table 9. Comparison of SWMM simulation results and optimization model results.
Combination20.0% + 0.756 m20.0% + 0.762 m30.0% + 0.775 m
SWMMOptimization ModelSWMMOptimization ModelSWMMOptimization Model
Surface runoff coefficient0.5080.5080.5080.5080.4490.449
Pipe overload time (h)8.7308.9978.6068.9687.2457.112
Nodal overflow volume (Mltr)82.15182.24280.89081.17355.93655.668
Average error1.03%1.46%0.78%
Table 10. Optimization results for different scenarios.
SituationSurface Runoff
Coefficient
Pipe Overload Time (h)Nodal Overflow Volume (Mltr)Total Investment Cost (108 RMB)
Initial scheme0.82452.552186.071
Comprehensive pipe corridor rainwater chamber scheme 0.8242.138~21.1728.311~263.02736.752~43.643
Combination LID measures scheme0.167~0.5962.271~40.7460~110.3851.602~16.020
Manual optimization scheme0.4492.49710.99644.620
NSGA-III optimization model scheme0.355~0.5194.501~9.70227.980~90.10040.311~45.009
Disclaimer/Publisher’s Note: The statements, opinions and data contained in all publications are solely those of the individual author(s) and contributor(s) and not of MDPI and/or the editor(s). MDPI and/or the editor(s) disclaim responsibility for any injury to people or property resulting from any ideas, methods, instructions or products referred to in the content.