Abstract
In recent years, China has been vigorously carrying out the construction and development of a sponge city. To prove that the material and energy consumption involved in the implementation of a sponge city is much less than that of the integrated urban drainage system (IUDS) in addition to saved energy and reduced carbon in the sponge city, it was important to calculate the corresponding carbon source and sink and analyze its key influence factors. The emission factor method was used to calculate carbon emissions. In view of this, based on the Intergovernmental Panel on Climate Change (IPCC) guidelines and life cycle assessment (LCA), this research established a systematic accounting method for carbon emissions from the IUDS and the sponge city, which focused on improving the calculation method of the carbon sink stage. A case study was conducted in Beijing, China, and the carbon emission reduction effect of the construction of the sponge city was discussed. The results showed that the carbon emission reduction potential (CRP) of sponge facilities in this project for 50 years was 612.45 tons of CO2 equivalent after the renovation. Compared with IUDS, sponge city construction had a positive effect on carbon emission reduction and reduced carbon emissions by 87.08% on average. For the IUDS and the sponge city, the stormwater pipe network had the largest contribution of carbon emission, and its material, transportation, pipeline laying, and maintenance of stormwater pipe networks had important influences. Morris global analysis method was used to analyze the sensitivity of LCA results and obtained that the influence degree of sensitivity factors on carbon emissions in the life cycle was in the order of annual rainfall > carbon sequestration rate of green space > high-density polyethylene (HDPE) > transport distance > fertilization and insecticide. This study can provide a positive contribution to the construction of a sponge city and planning the low-carbon development of the city in the future in China.
1. Introduction
Due to the high centralization of population and resources, the expansion of impervious underlying surface, reduction in natural infiltration ground, excessive discharge of pollutants, and other problems occurred [1]. Those problems resulted in surface runoff increase, deterioration of the water cycle, and frequent flood disasters, which had broken the original ecological balance [2]. Simultaneously, urban rainwater resources had not been rationally utilized. Those problems were exacerbated by the rapid urbanization process and a large number of people moving into cities. In order to solve the problems of the integrated urban drainage system (IUDS), the Ministry of Housing and Urban-Rural Development of the People’s Republic of China issued the Technical Guide for Sponge City Construction [3]. The construction of sponge cities has suitable “elasticity” in adapting to environmental changes and responding to rain natural disasters. It can absorb, store, purify, and seep water when it rains. The stored water can be used when needed. The construction of sponge cities can protect the original water ecology, and its core is to maintain the unchanged hydrological characteristics before and after site development, including total runoff, peak flow, and peak occurrence time [3]. Sponge cities adopt a comprehensive approach by combining green and gray infrastructure, making full use of the accumulation, infiltration, purification, and slow-release effects of vegetation, soil, river, and lake water systems on urban rainwater runoff. As a result, they achieve effective flood control and waterlogging mitigation, enabling cities to mitigate or reduce the impact of natural disasters and environmental changes [4]. Sponge cities can also effectively alleviate the problem of non-point source pollution during the urbanization process and promote rainwater utilization, which is a powerful means to build an ecological landscape with a drainage function.
Since the industrial revolution, human activities have increased the atmospheric carbon dioxide concentration by nearly 30% [5]. The cumulative carbon emissions have caused the global average temperature to rise by 2 °C [6], leading to frequent extreme weather, sea level rise, and other serious problems. Research has shown that over 90% of the causes of global warming may be caused by human activities, with greenhouse gas (GHG) emissions being the main cause and carbon emissions accounting for almost 82% of the total GHG emissions [7]. In order to solve the problems above, China proposed the goal that the peak of carbon dioxide emissions will reach in 2030 and carbon neutrality will occur in 2060. A total of 85% of direct carbon emissions in China came from activities of the city [8], which were the main source of energy consumption and anthropogenic greenhouse gas emissions. Moreover, carbon emissions from the IUDS reached 277 million tons per year [9]. Therefore, the carbon emissions generated by IUDS should be paid enough attention. At present, most carbon emissions accounting for IUDS focus on the process of dealing with sewage, while little attention is paid to the carbon emission of rainwater. The construction of a sponge city used low-carbon materials, increased the carbon sinks, and alleviated the heat island effect. Therefore, the construction of a sponge city not only solved the problems of IUDS but also played a positive role in carbon emission reduction. It is of great significance to study the carbon emission reduction in sponge cities.
A large number of studies have been carried out on the topic of carbon emission reduction in a sponge city. Most studies focused on carbon emissions of one kind of sponge facility, such as permeable pavement [10], green roofs [11], wetlands [12], etc. Flynn et al. [13] conducted carbon emission accounting and carbon sink benefit evaluation for green infrastructure. Lan et al. [14] showed that using pervious concrete pavement to replace traditional surface drainage systems could reduce about 50% of carbon emissions. Based on the life cycle assessment (LCA) model, O’Sullivan et al. [15] evaluated the environmental impact of material production, construction, transportation, operation, and maintenance of the rainwater garden and different rainwater treatment systems. A pre-fabricated concrete vortex unit, a sub-surface sand filter, and a rain garden were evaluated. The conclusions showed that the concrete unit had the highest environmental impact, of which 45% was attributed to its maintenance. Ma et al. [16] calculated the carbon emissions of four single typical sponge facilities, paying special attention to the management and maintenance of the plants at the operation and maintenance stage, and made some meaningful suggestions on plant selection from the perspective of carbon emission reduction. A few studies focused on carbon emissions at the regional scale. Lin et al. [17] developed a comprehensive accounting model combining the Intergovernmental Panel on Climate Change (IPCC) guidelines and LCA methods, using Shanghai as an example, to predict carbon emissions and sinks in sponge cities. Shao et al. [18] took Xiamen City as an example to quantitatively analyze the impacts of sponge city construction, urban greening, river, lake, and wetland construction, and rainwater harvesting on carbon emission reduction. Li et al. [19] constructed a quantitative carbon emission method to be applied in urban areas. Compared with traditional models, four different sponge city plans reduced the carbon emissions of the system by 3.5–51.7%. Zheng [20] constructed a carbon emission accounting method for residential communities, taking a community in Shanghai as an example. The carbon emissions before and after the reconstruction of sponge cities were calculated, and the results showed that it was expected to achieve carbon neutrality in about 6.5 years. Su et al. [9] adopted the carbon emission factor method to discuss the carbon emission of the IUDS and the carbon emission reduction effect of sponge city construction. The carbon emissions of IUDS and the sponge urban drainage systems account for approximately 3.4% and 1.7% of urban carbon emissions, respectively. Su et al. [21] explored the most cost-effective low-impact development (LID) configuration scheme using the analytic hierarchy process (AHP) to comprehensively evaluate the carbon reduction capacity and economic benefits of each scenario set up LID combination scenarios based on the MIKE FLOOD model.
All of the above studies proved that the sponge city was effective in reducing carbon emissions, but there were still some shortcomings in the current studies: Most studies had focused only on the construction of the sponge city and had given little consideration to carbon emissions in operation and maintenance. The accounting of carbon emissions in the initial stormwater treatment and daily maintenance of the facilities was sometimes ignored. Some possible carbon emissions and sinks were neglected during the operation and maintenance. Most of them only looked at the carbon emissions of the sponge city itself, and the comparative carbon emissions analysis of the IUDS before and after the renovation was inadequate. The key factors that have the greatest impact on carbon emissions at each stage of the case are ignored.
In view of this, based on the LCA, this study adopted the carbon emission factor method, focused on improving the calculation method of the carbon sink stage, comprehensively considered the carbon emissions during the operation and maintenance, and established a comprehensive carbon emission method suitable for the sponge city. Using a sponge city project in Beijing as a case study, the project reconstructed the IUDS and carried out carbon emission accounting for the five stages of material production, transport, construction, operation and maintenance, and disassembly and recycling over the entire life cycle. In addition, the carbon emission reduction rates before and after the renovation were compared, and sensitivity analysis was conducted on the two cases to identify key factors in carbon emissions and achieve the goal of controlling the entire project’s emission reduction. Finally, from the perspective of carbon emission reduction, the aim of this paper was to provide reference data and suggestions for the construction of a sponge city, accelerate the development of a sponge city, and further provide reference to carbon reduction policy with Chinese characteristics.
2. Methods and Processes
To verify the carbon reduction effect of sponge cities, a comprehensive research framework needs to be considered and established. The use of sponge facilities instead of IUDS will have a positive impact on energy consumption and carbon emissions throughout their life cycle through energy efficiency measures. In this context, a framework was designed based on the carbon emission perspective view to investigate the environmental impact of sponge cities throughout the life cycle from design to demolition.
2.1. Subsection Case Study Area and Overview
Beijing is a highly urbanized city. The urban area has an annual precipitation of 584.6 mm, with mainly precipitation concentrated from June to August. Due to the dense, impervious underlying surface, the city is often affected by floods. Beijing currently has a permanent population of about 220 million, and its per capita carbon emissions are at a high level among provinces. It is of great significance to reduce Beijing’s carbon emissions. This study took a sponge project in Beijing as an example to calculate its full life cycle carbon emissions from its completion to the next 50 years. As shown in Figure 1, the land type of the case is residential, which is located near the old Jingyu Line and the South Songzhuang Cultural District Road. The total area was 10,930 m2, of which 5877 m2 had been renovated, including 2767 m2 of hard pavement and 3111 m2 of green area. After the renovation, the area of the rain garden was 680 m2, the sunken green belt was 1349 m2, the grassed swale was 619 m2, the permeable pavement was 1566 m2, and the rain flower box was 25 m2. This met the design requirement of a total runoff coefficient of 0.72.
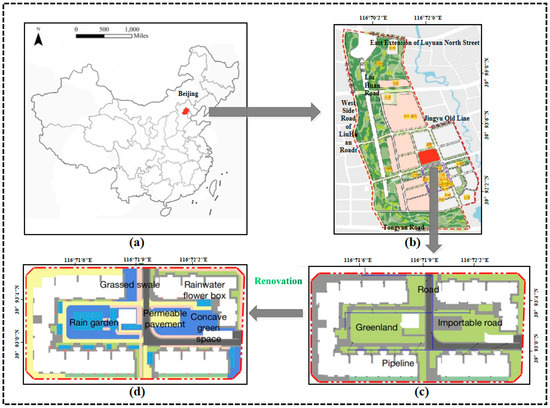
Figure 1.
Overview map of the study area. (a) Beijing, China; (b) the total map of a plot in Tongzhou district; (c) before renovation map of a plot in Tongzhou district; (d) renovation map of a plot in Tongzhou district.
2.2. Life Cycle Assessment
2.2.1. Goal
The purpose of this study was to establish a comprehensive carbon emission method suitable for the sponge city using a case study to compare the relevant analysis of carbon reduction in IUDS and the sponge city with each other. So, the major goal of this LCA was to quantify the carbon emissions of a sponge city project in Beijing, compare its carbon emissions before and after renovation, and identify key factors in carbon emission. In this work, all carbon emissions involved in the entire cycle of sponge cities were calculated.
2.2.2. System Boundary and Inventory
Determining a reasonable boundary for carbon emission accounting and identifying carbon sources and sinks is an essential step in constructing a carbon emission accounting model for rainwater systems. The research was based on LCA and adopted ISO14010 Environmental Audit Guidelines-General Principles and ISO14010 Principles and Framework of Life Cycle Assessment as the evaluation standard. The study calculated the whole process of IUDS and the sponge system from its completion to the next 50 years during the operation and maintenance as the evaluation cycle. As shown in Figure 2, these two processes were divided into five stages, which included material production, material transportation, construction, operation and maintenance, disassembly, and recycling.
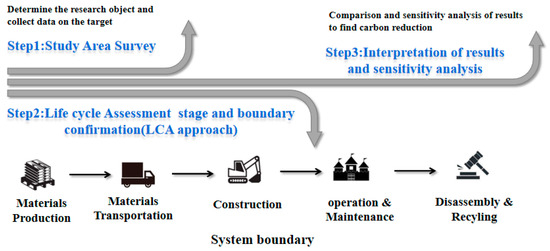
Figure 2.
The life cycle stages and boundaries of UIDS and the sponge city.
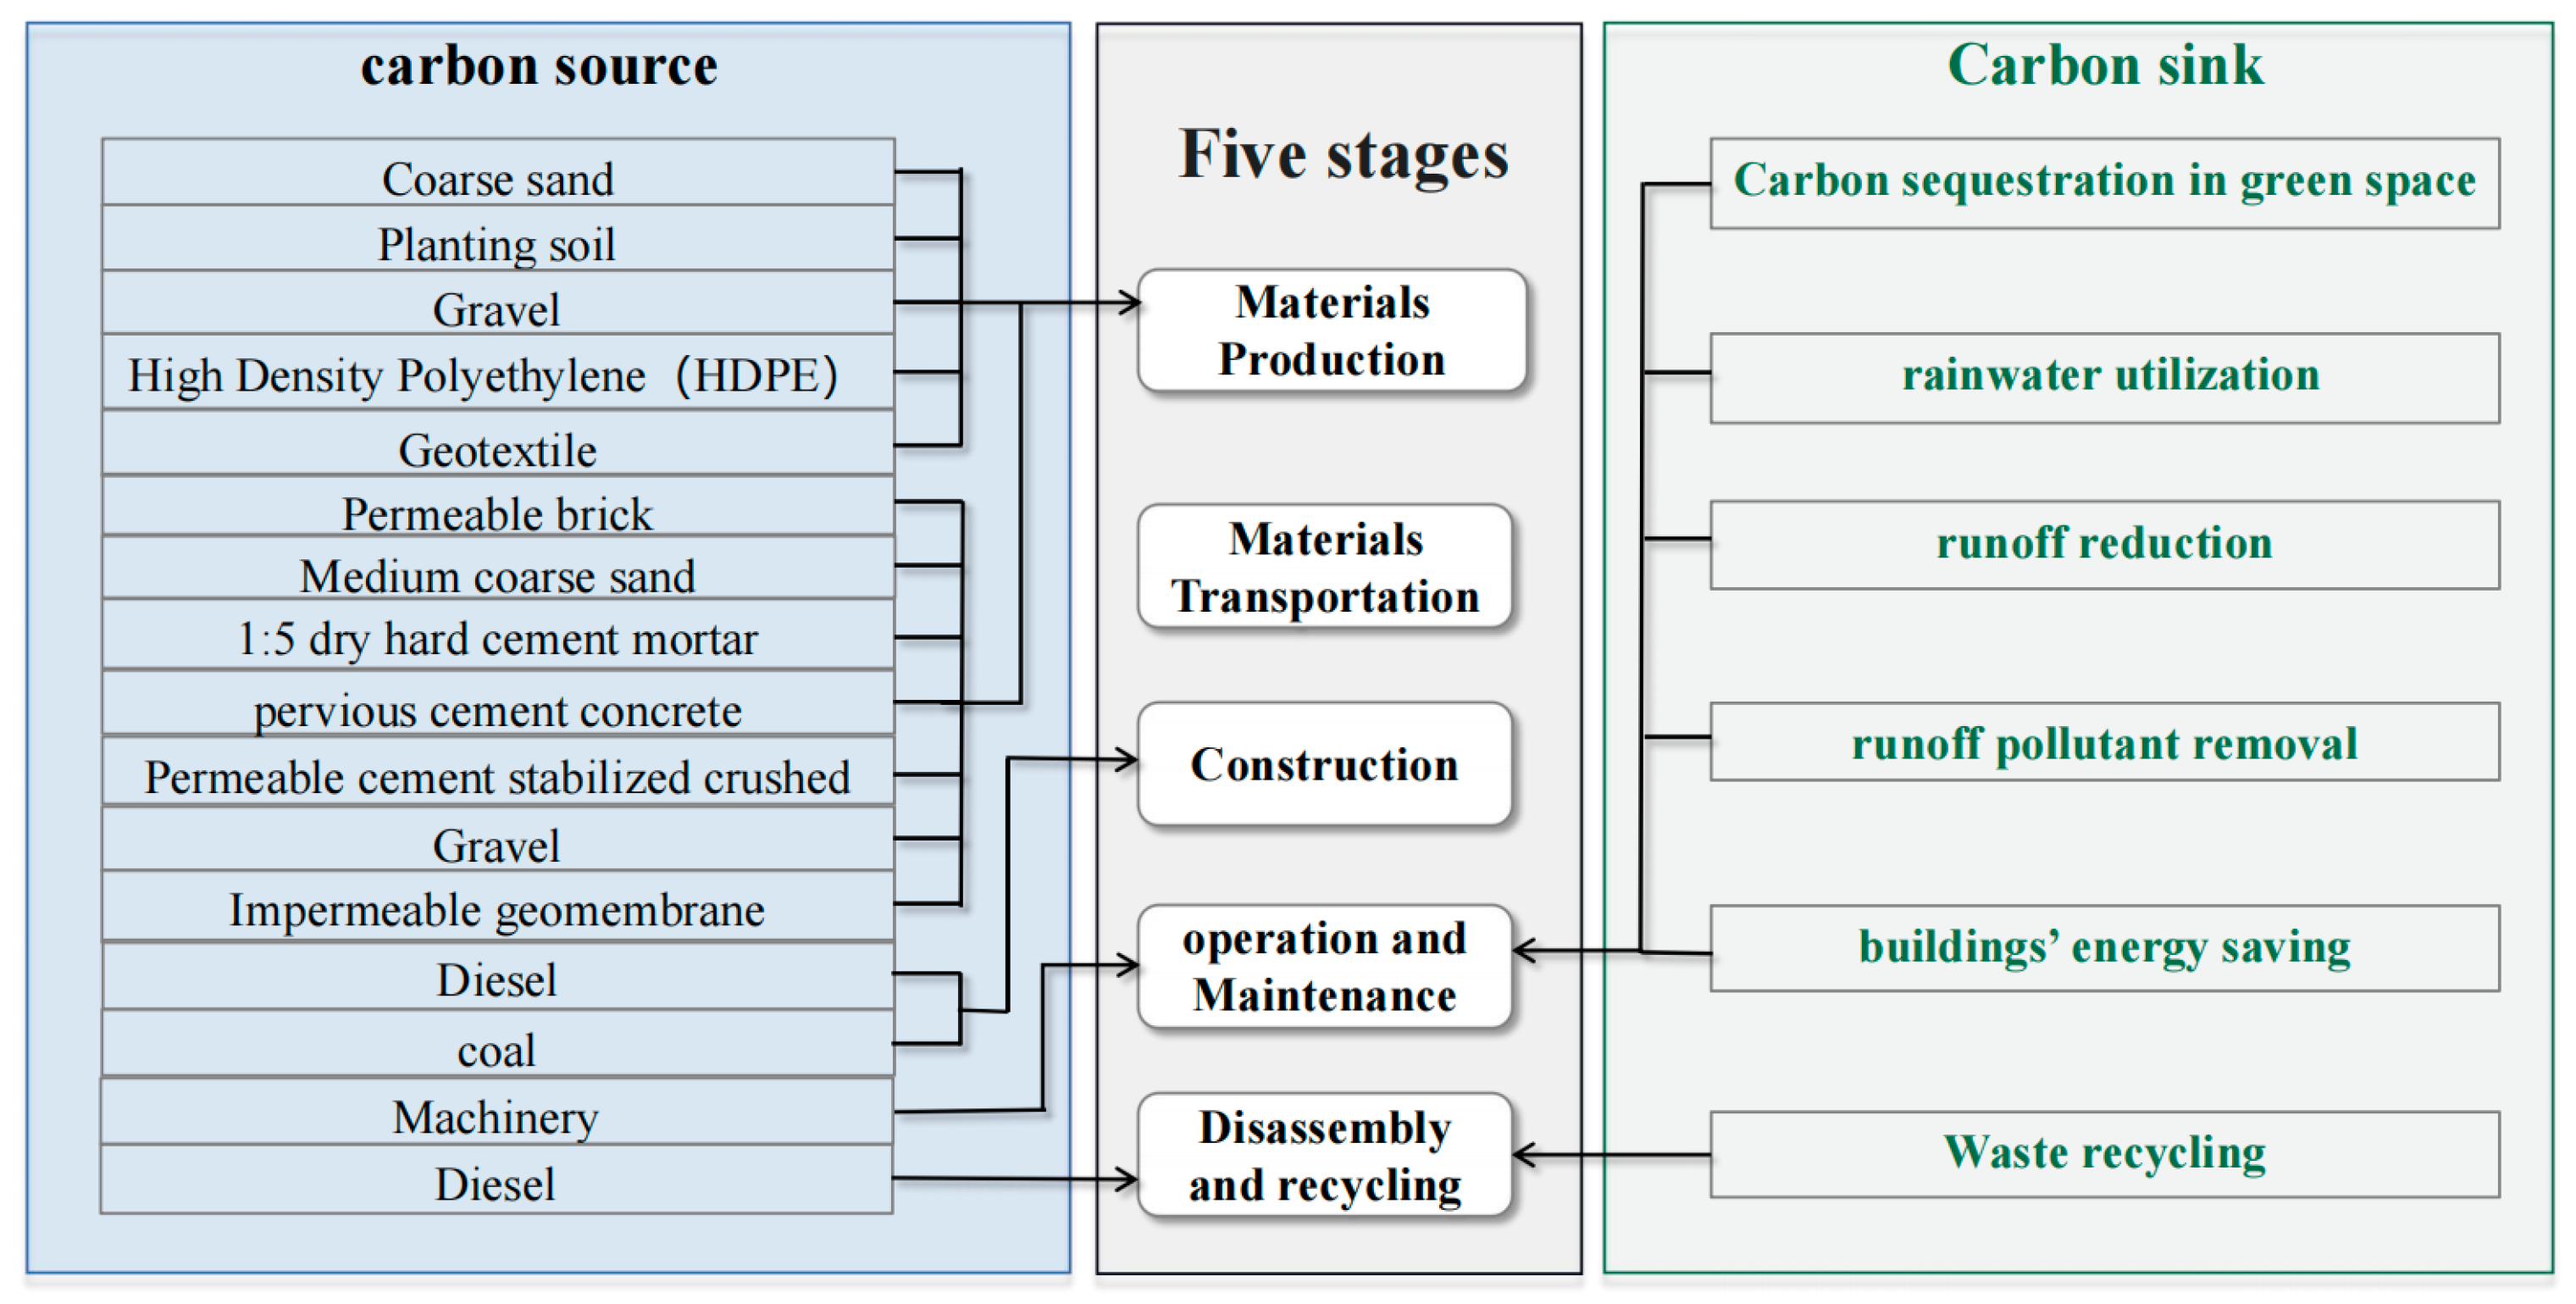
Carbon sources were the carbon emissions produced by the material production and energy consumption involved in the five stages. Carbon sink refers to green space carbon fixation, rainwater utilization, runoff reduction, rainwater purification, and building energy conservation during the operation of the sponge city. The details can be seen in Figure 3.
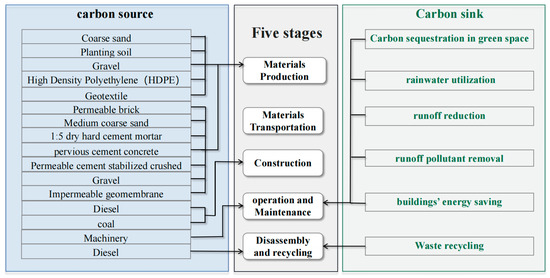
Figure 3.
Life cycle carbon emission inventory of the sponge city.
2.3. Method of Carbon Emission Accounting
The carbon emission accounting framework adopts the emission factor method released by the IPCC and proposed in the “IPCC Guidelines for National Greenhouse Gas Inventories” (Revised 2019) to estimate carbon emissions. The product of activity data and corresponding carbon emission factors were taken as the estimated carbon emissions in accordance with the carbon emission inventory.
3. Life Cycle Inventory Analysis
3.1. Carbon Emissions from Material Production
According to the above calculation framework, carbon emissions were calculated for the materials production of the IUDS and the sponge city. The IUDS included pipelines, rain wells, rain olivier, and reservoirs. Sponge cities included bioretention, overflow wells, and permeable pavement. The details can be seen in Table 1 and Table 2.

Table 1.
Carbon emissions from material production of IUDS.
Table 2.
Carbon emissions from material production of the sponge city.
3.2. Carbon Emissions from Material Transportation
Diesel trucks were selected in this study. The average freight distance of the country in 2020 (176 km) [27] was used to simplify the calculation and uncertainty of the locations of the material manufacturers. The details can be seen in Table 3.
Table 3.
Carbon emissions from material transportation of IUDS and the sponge city.
3.3. Carbon Emissions from Construction
Energy consumption of mechanical equipment, power supply, excavation, and backfilling during construction were included. The total energy consumption of the project was estimated based on the energy consumption statistics per unit area. The unit area energy consumption of the construction calculation items involved in the construction of sponge facilities was multiplied by the total area. Standard coal was Beijing’s main use of energy to provide various energy needs. The construction carbon emissions are calculated based on the conversion coefficient of standard coal. The details can be seen in Table 4.
Table 4.
Carbon emissions from the construction of IUDS and the sponge city.
3.4. Carbon Emissions from Plant Maintenance
3.4.1. Plant Maintenance Carbon Emissions
The plants in IUDS were originally ordinary grass, but after being transformed into rainwater gardens, they became macrophanerophytes and shrubs, which included Quercus mongolica Fisch, Yulania soulangeana, Prunus davidiana, Euonymus japonicus ‘Beihaidao’, and Malus spectabilis. A significant carbon footprint from energy consumption of mechanical equipment used for maintenance of the plants. The details can be seen in Table 5.
Table 5.
Carbon emissions from plant maintenance of IUDS and the sponge city.
3.4.2. Carbon Emissions from Mechanical Operation and Maintenance
For the IUDS, Items involved in the calculation of carbon emissions from the operation and maintenance included dredging pipes, repair of damaged facilities, and rainwater intensive drainage. According to the mechanical equipment used during the dredging pipe and rainwater drainage, the carbon emissions of IUDS calculated were 104,625.00 and 152,460.60, respectively. The permeable pavement of the sponge system required maintenance, such as pressure washing and vacuuming. The unit carbon emission of pressure washing and vacuuming flushing is 0.017 kgCO2/(y·m2) [19]. IUDS and the sponge city also had to calculate the carbon emissions for the repair of damaged facilities, estimated at 1% of the carbon emissions during the material production, transportation, and construction. The total carbon emissions from the mechanical operation and maintenance of the IUDS and the sponge city were 258,924.35 kgCO2eq and 31,983.90 kgCO2eq, respectively.
3.4.3. Carbon Sink
There was no green roof and new storage facilities for IUDS and the sponge cities in this case. The runoff was not reduced because the reconstruction was performed on IUDS, so only the green space carbon fixation and rainwater purification were considered. The control volume of rainwater purification runoff is 8–12 mm of the initial rainwater. Based on the corresponding relationship curve between the design rainfall and the total runoff control rate, the total annual runoff control rate was calculated, and the control rainfall was obtained (Control Rainfall = Annual Rainfall in Beijing × the total annual runoff control rate). The annual rainfall in Beijing was 584.66 mm, with an average initial rainfall of 10 mm. The total annual runoff control rate was 48%, with a runoff coefficient of 0.72 and a total catchment area of 4700 m2. The main pollutant reduction by the sponge system is COD, with a pavement pollutant concentration of 775 mg/L [29] and a processing efficiency of 70%. The carbon emission factor was 3.1 kg/kg [20], and the total carbon sink in this study was 101,022.96 kgCO2eq. The counting process can be seen in Table 6 and Table 7.
Table 6.
Carbon sink from green space carbon fixation of sponge city.
Table 7.
Carbon sink from rainwater purification of sponge city.
3.5. Carbon Emissions from Disassembly and Recycling
The carbon emissions from disassembly and recycling were estimated as 10% of the carbon emissions from the construction of the sponge city. This method was always used to estimate carbon emissions in the building industry [30].
4. Results and Discussion
4.1. Carbon Emissions from IUDS
The total carbon emission of the 50-year cycle IUDS was 703.31 t CO2eq, and the carbon emissions per meter square were 64.35 kg/m2. The carbon emissions from the operation and maintenance accounted for 53.1%, and those from material production for 25.8%. Due to the low carbon emissions in the disassembly and recycling, it was not analyzed in this study. This differed from the conclusion of Li [19] that carbon emissions were high in the process of construction of the IUDS. The carbon emissions from plant maintenance and routine pipeline maintenance, which were not considered in the research study by Li, were included in this study.
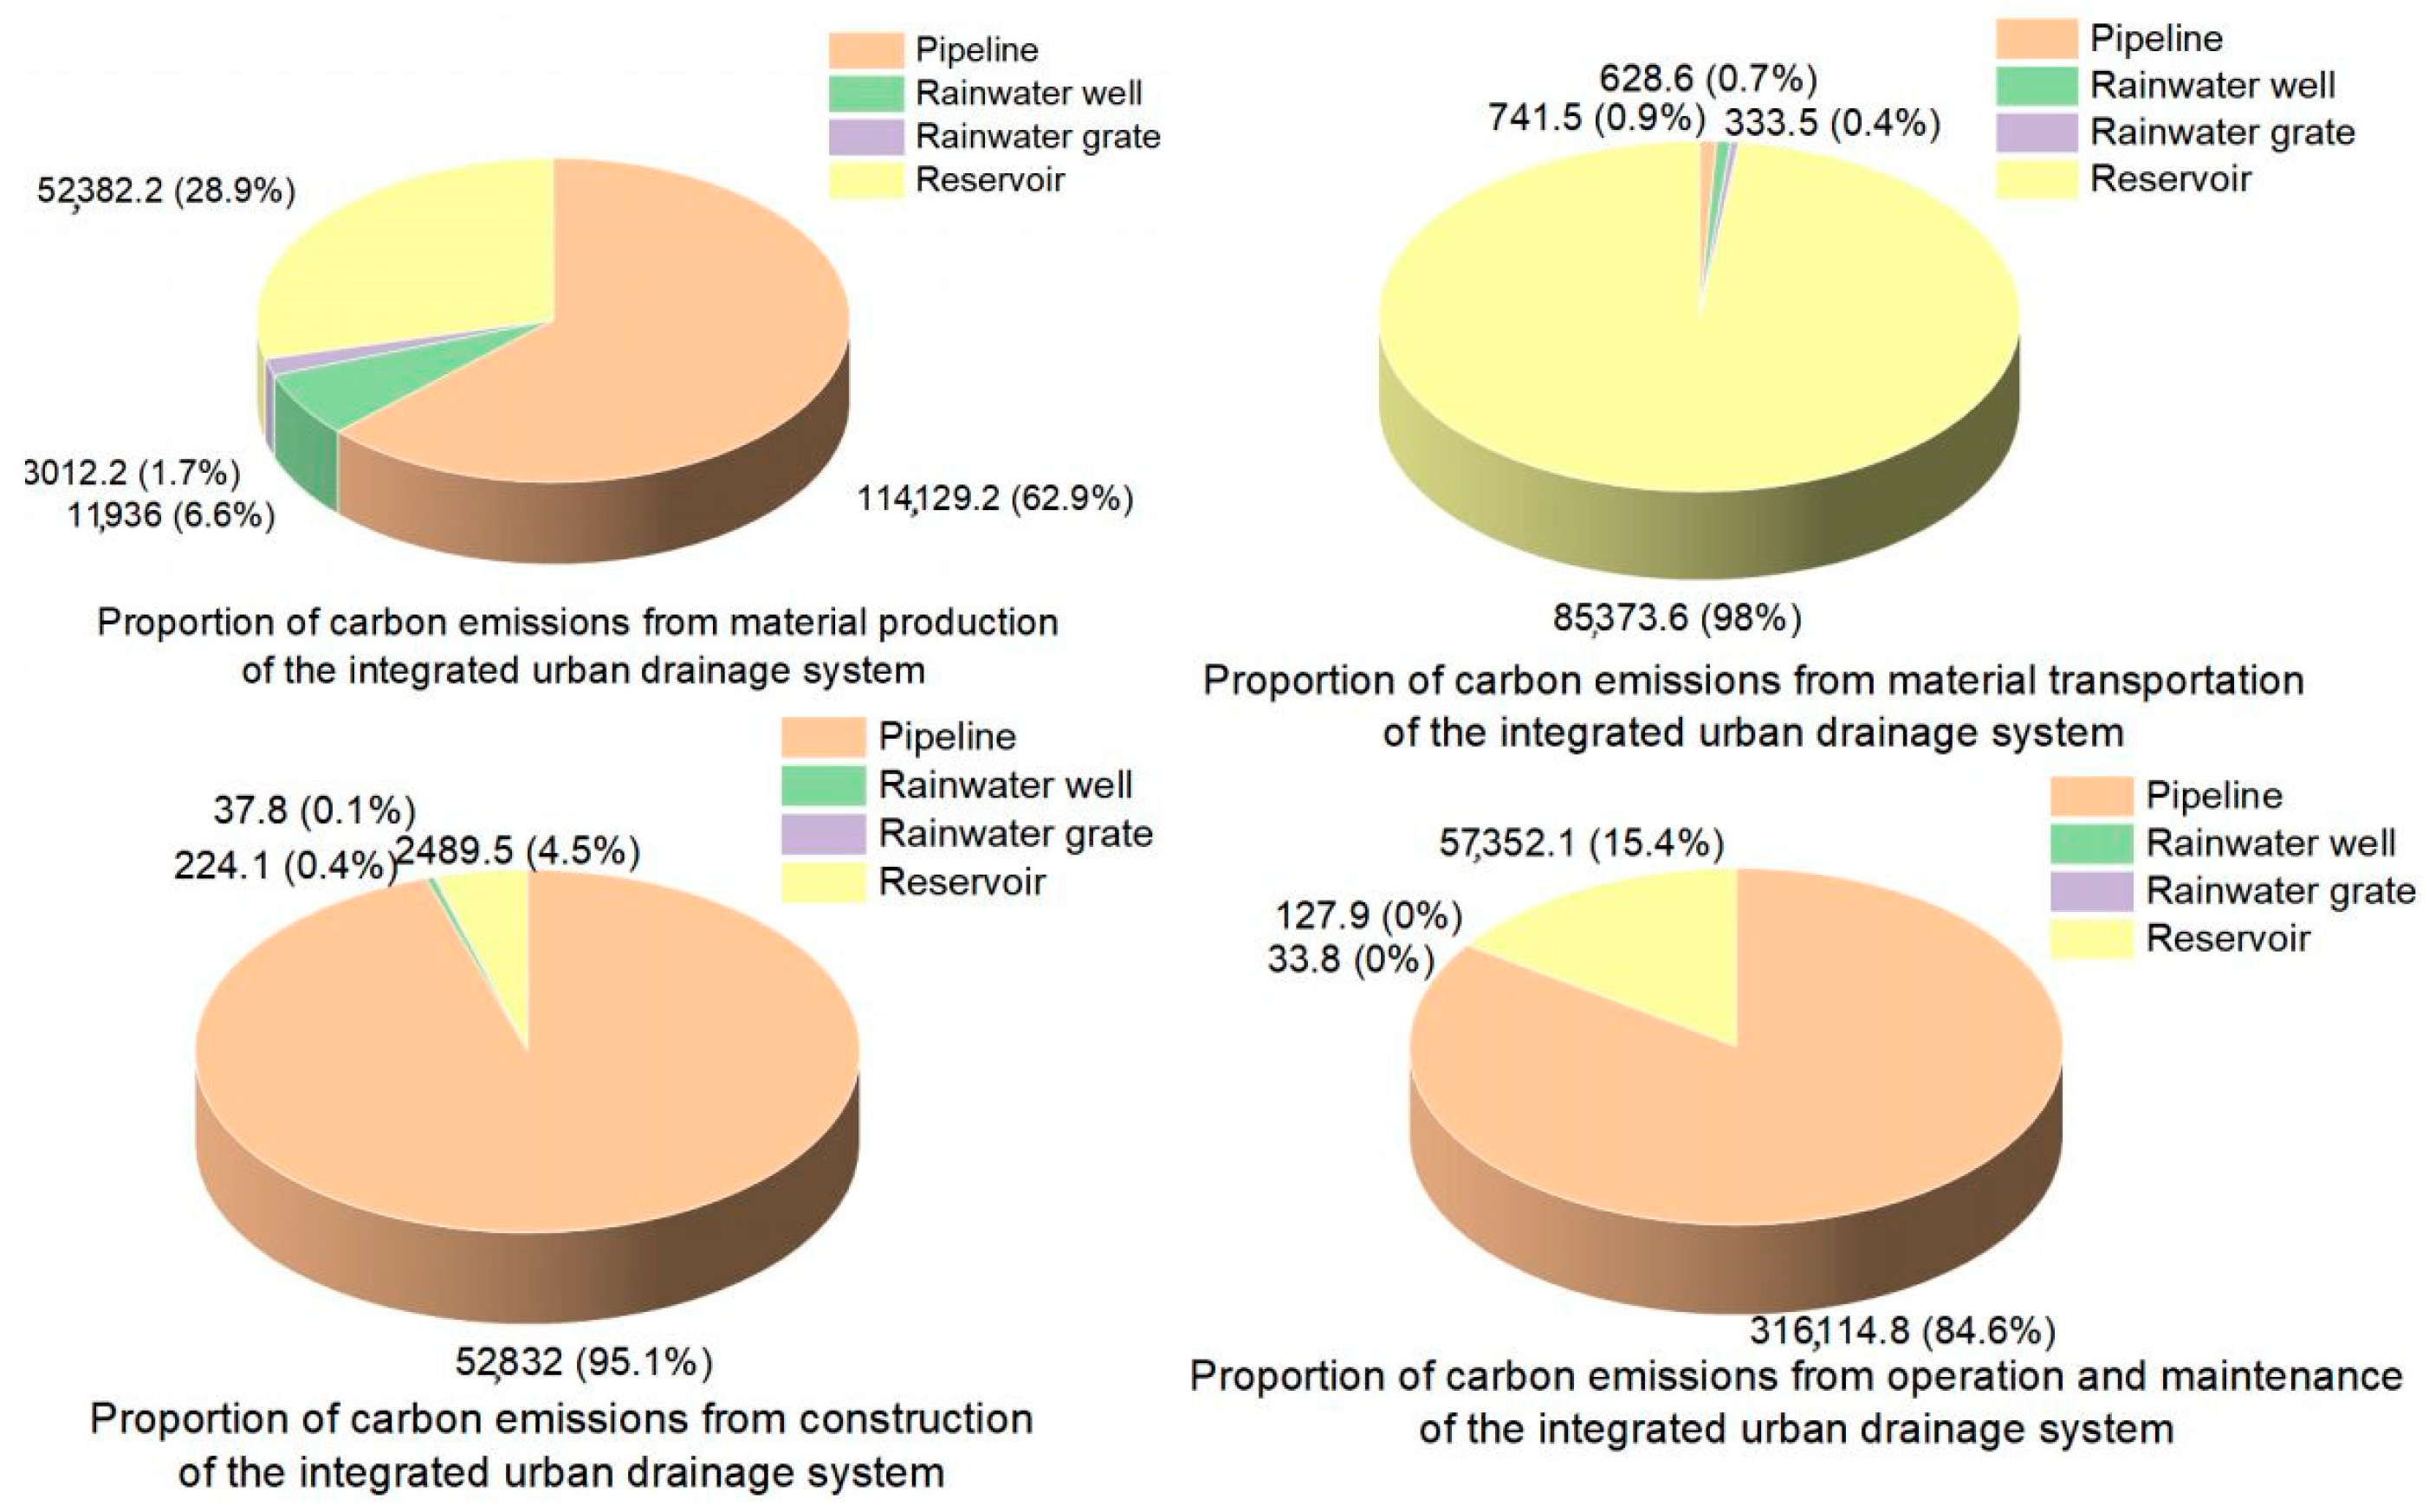
As shown in Figure 4, the carbon emissions of the pipeline production were the largest and accounted for 62.9% of the total carbon emissions from material production. The second largest contribution of carbon emissions during material production came from the production of the material used for the reservoir construction, and the production of the material used for the construction of the other two facilities had less impact on carbon emissions. UPVC and reinforced concrete pipes were selected to meet the drainage requirements of traditional pipe channels, and the carbon emission of the large-diameter pipe accounted for about 60%. Carbon emissions should be reduced at source by reducing the use of pipelines within drainage requirements and selecting small diameters of pipe and new pipelines with low carbon emission factors where possible. During the process of material transportation, the carbon emissions of the reservoir accounted for 98% due to the heavier concrete material. The principle of proximity for transportation was considered to reduce unnecessary carbon emissions. In the process of construction, the carbon emissions of the pipeline accounted for 95.1%. Many machineries were used for digging trenches, backfilling, laying pipelines, and other processes when pipelines were installed. Reducing the use of pipelines will reduce carbon emissions during the process of corresponding construction. A total of 84.6% of carbon emissions during the process of operation and maintenance came from pipeline maintenance. Due to the low permeability of the ground in this region, much electricity was used to run drainage pumps to drain the large amount of rainwater during rainfall to prevent flooding. In addition, large amounts of energy and materials were consumed when large-diameter pipelines in this region were regularly dredged and repaired. The carbon emissions of tap water irrigation accounted for 84.8% of the plant maintenance. To reduce carbon emissions and water scarcity, drought-tolerant native plants should be selected in Beijing to reduce the reliance on water for plant maintenance in the future, and recycling water in the reservoir can also be selected. The results showed that the order of carbon emissions per unit area from large to small among the four facilities was as follows: reservoir > pipeline > rainwater well > rainwater grate.
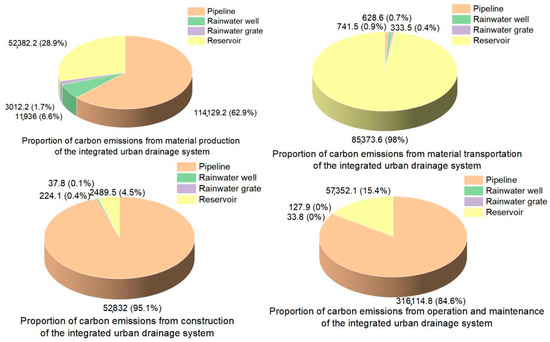
Figure 4.
Proportion of carbon emissions from the four process subdivisional facilities of UIDS.
4.2. Carbon Emissions from Sponge City
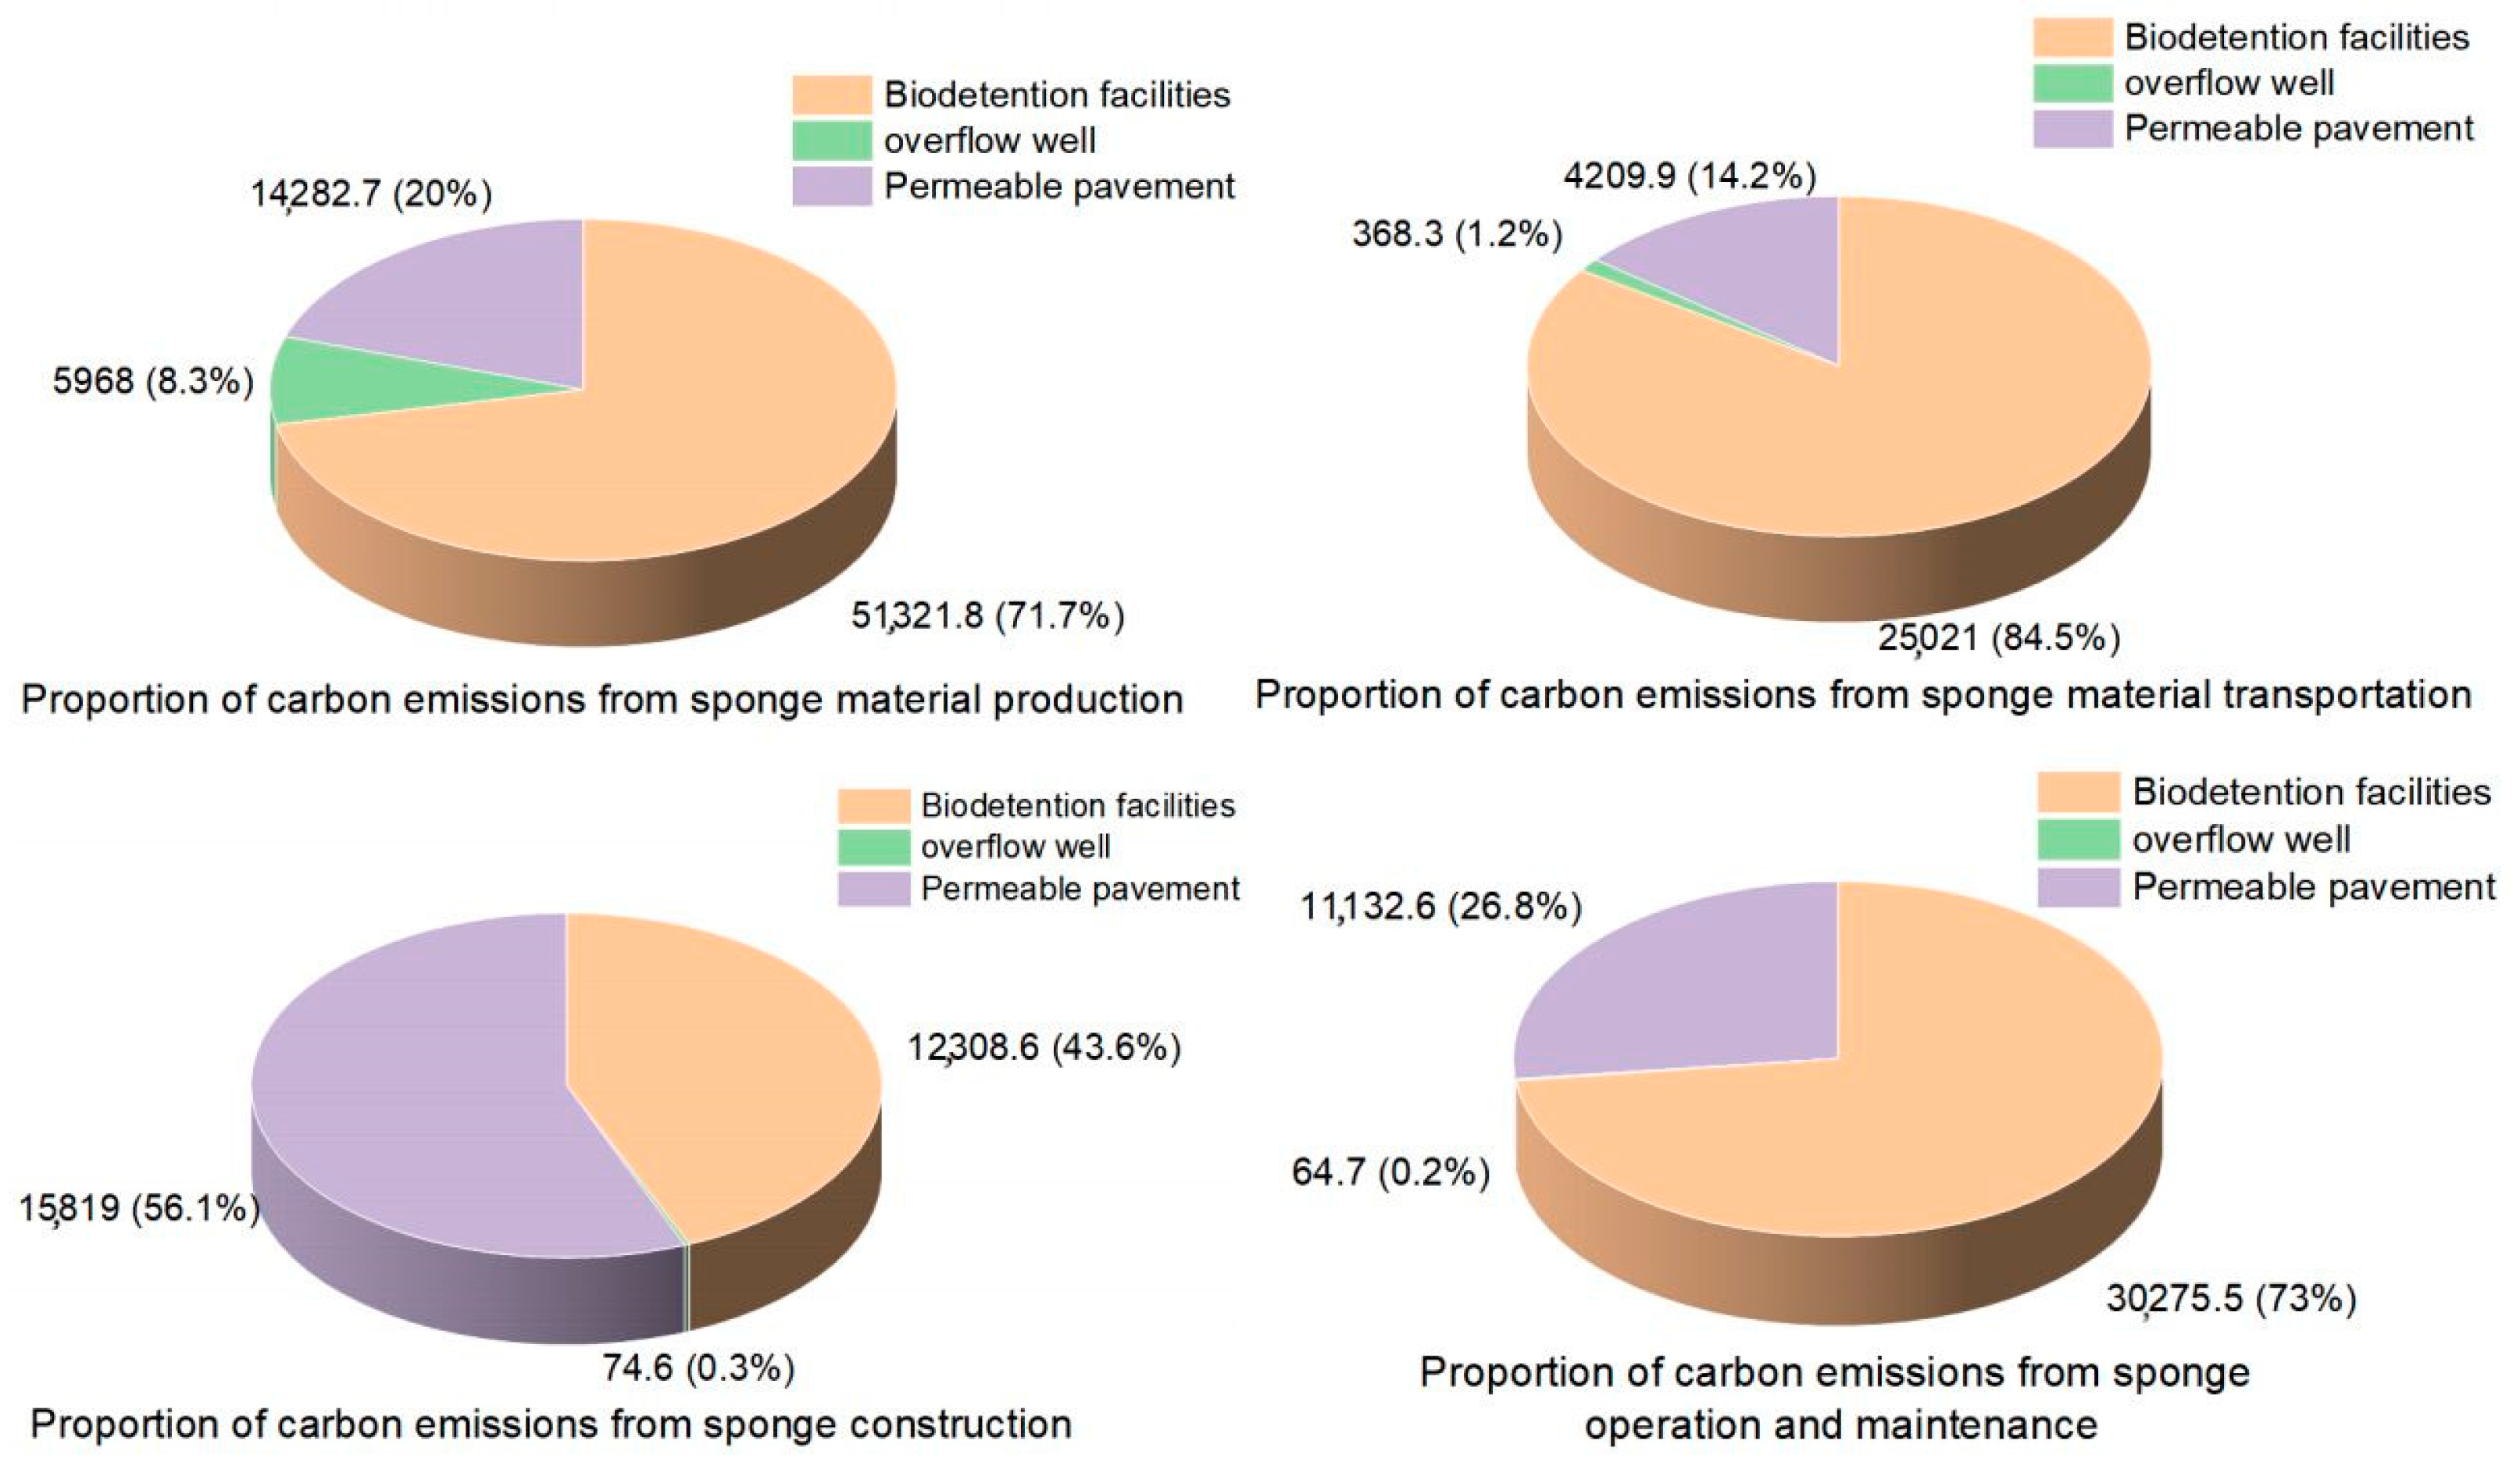
The case analysis of the reconstructed sponge city showed that the carbon emission of the life cycle system was 90.85 tCO2eq, the carbon sink was 101.02 tCO2eq, the carbon emissions per meter square was 8.33 kg/m2, and the carbon emission of material production was 71.57 tCO2eq at most. This was consistent with Li’s [31] conclusion that carbon emissions in sponge city construction were mainly concentrated in the material production stage, with material embodied carbon accounting for more than 80%. As shown in Figure 5, in the process of material production, transport, and operation, the bioretention facility accounted for the largest proportion of carbon emissions, and the second largest carbon emissions contribution was the permeable pavement. The proportion of carbon emissions of each stage of bioretention accounted for 70–80%, the proportion of carbon emissions reservoirs was in the range of 10–30%, and the proportion of carbon emissions overflow wells was negligible except for 8.3% in the material production stage.

Figure 5.
Proportion of carbon emissions from the four process subdivisional facilities of the sponge city.
In the process of material production, the HDPE contributed 58% of the carbon emissions, with the remaining material being almost green and non-polluting filler, which helped reduce the overall environmental impact. Gravel accounted for 63.2% of carbon emissions in the process of transportation, which is in line with the results of Ma [16]. Due to the high density and thickness of the planting soil and gravel, the carbon emissions per unit of transport for the rainwater garden were higher than for other facilities. Therefore, when purchasing materials, local manufacturers close to the construction site should be selected. In the process of construction, the carbon emission of the permeable pavement was greater than that of the bioretention facility, which is consistent with Liu’s [10] conclusion that the construction of permeable pavement produced more carbon dioxide. The carbon sink contributed 62.9% of the carbon reduction during the process of operation and maintenance. The rainwater purification in this case was about 3.7 times higher than the carbon fixation in the green area, which is consistent with the study by Lin [17]. The carbon emissions of fertilization and insecticides accounted for 87.4% of sponge plant maintenance. The reason for this was that the wide variety of plants led to increased insecticide use and sterilization times. To reduce carbon, lower-maintenance, drought-tolerant, and insect-resistant shrubs or biological measures could be used for control. Due to the low proportion of carbon emissions during disassembly and recycling, no further analysis was conducted. The results showed that the order of carbon emissions per unit area from large to small among the three facilities was as follows: overflow well > biodetention facilities > permeable pavement.
4.3. Comparative Analysis of IUDS and Sponge City
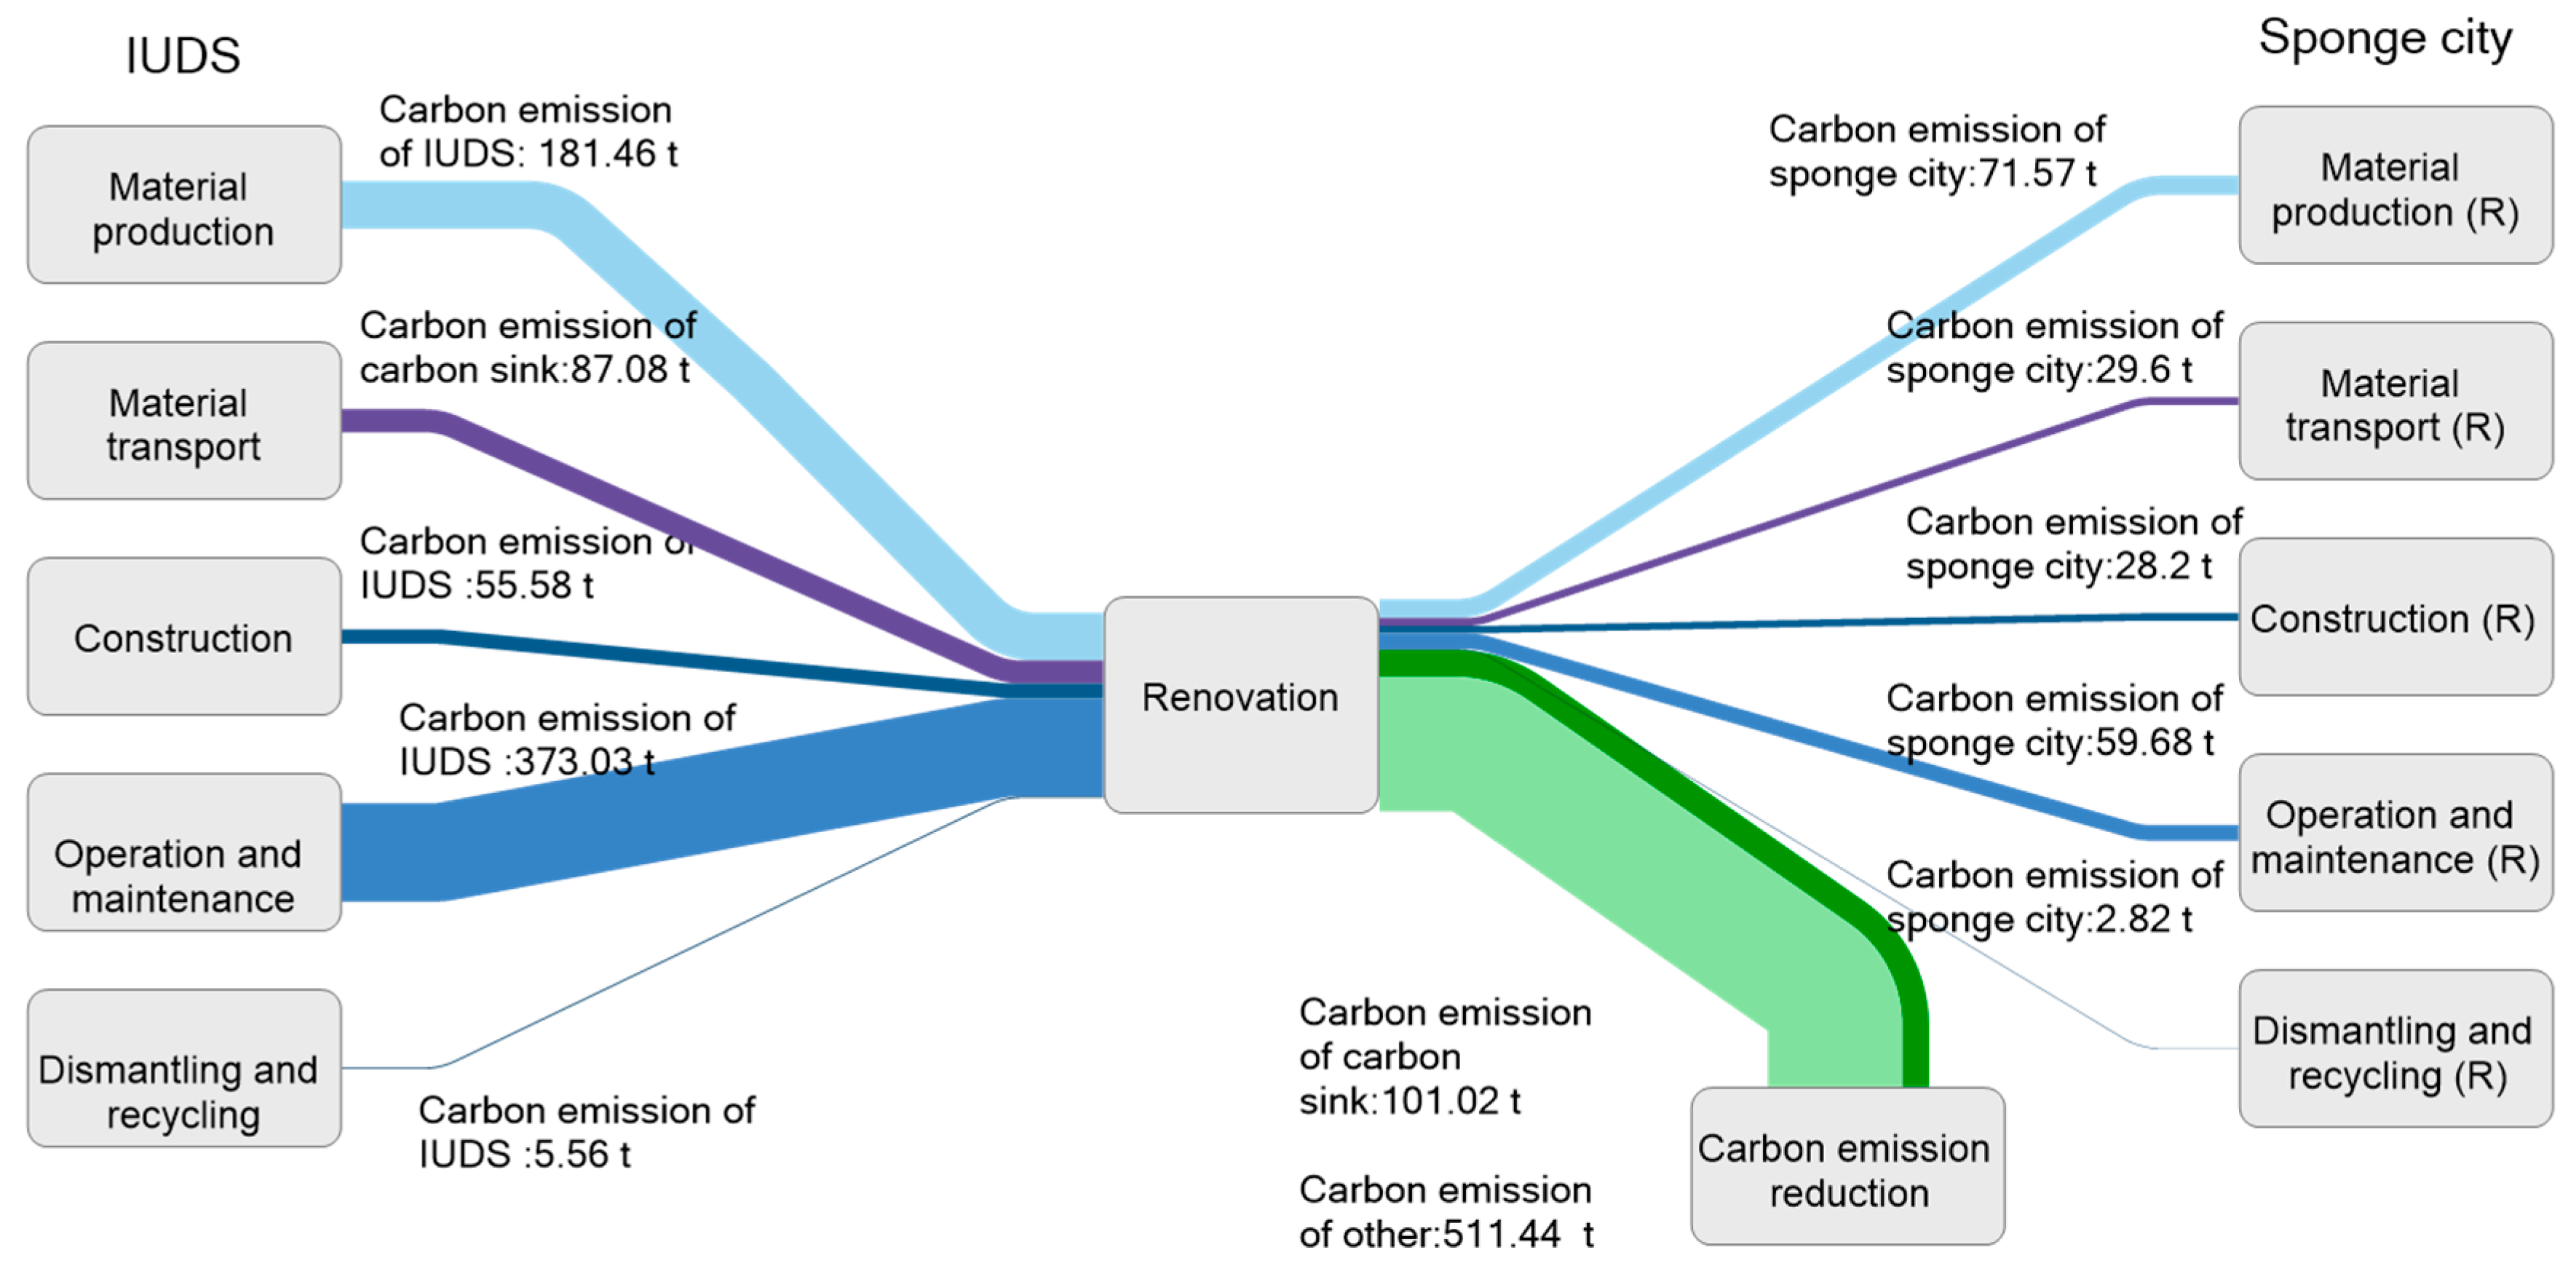
As shown obviously in Figure 6, the carbon emissions of the sponge city at each stage were less than those of IUDS. The rank of the carbon emissions of the IUDS is (descending order) operation and maintenance > material production > material transportation > construction > disassembly and recycling. In the sponge city, the rank of the carbon emissions is (descending order) material production > material transportation > construction > disassembly and recycling > operation and maintenance. Due to the role of the carbon sink, which was 101.02 tCO2eq, the carbon emissions of the renovation case were greatly reduced. The carbon emission reduction potential (CRP) of this case was 612.45 tCO2eq for 50 years. The contribution rate of carbon emissions (CRCE) of IUDS was rainwater drainage in the process of operation and maintenance at about 21.68%, and the CRCE was HDPE in the process of material production at about 45.71% of sponge city. The construction of the sponge city had a positive effect on the carbon emission reduction in IUDS, which reduced carbon emissions by 87.08% on average. Rainwater purification had the largest contribution rate of carbon emission reduction (CRCR), which was 46.77% in the sponge city.

Figure 6.
Comparative diagram of total carbon emissions from the IUDS and the sponge city.
4.4. Sensitivity Analysis
In order to investigate the influences of the amount of material use, transport distance, regional differences, and plant selection on the total carbon emission of IUDS and the sponge city, sensitivity analysis was performed in this study. Based on the results of Section 4.1 and Section 4.2, carbon emissions of IUDS and the sponge city mainly came from the process of material production, transportation, and operation and maintenance. The study adopted the Morris method to analyze the cases. UPVC, transport distance, rainwater forced drainage were selected as the influence factors for IUDS and HDPE, transport distance, annual rainfall, carbon sequestration rates of green space, fertilization, and deworming were selected as influence factors for sponge city. All factors that may affect the carbon emissions were varied by ±20% and ±10%, and the calculation results were as follows in Table 8 and Table 9.
Table 8.
Impact of changes of influence factors on carbon emissions in each process of IUDS and the sponge city.
Table 9.
Impact of changes of influence factors on carbon emissions in the whole process of IUDS and the sponge city.
The impact of changes of influence factors on carbon emissions in each process of IUDS and the sponge city can be seen in Table 7. The use of UPVC material in IUDS varied by ±20%, resulting in ±6.32% variation in carbon emissions in the process of material production. HDPE was the greatest influential factor in the sponge city; it led to ±11.61% variation in carbon emissions in the process of material production. When the transport distance was varied by ±20%, the influence of C20 ready-mixed concrete on carbon emissions in material transportation was ±19.42% in IUDS, while gravel was the most influential factor in the sponge city during the process of material transportation. In the process of operation and maintenance, the change in energy consumption made the carbon emissions of IUDS change by ±8.16%. In the sponge city, the changes in annual rainfall and carbon sequestration rates of green space made the carbon emissions in the stage of operation and maintenance change ±38.62% and ±36.58%, respectively.
The impact of changes of influence factors on carbon emissions in the whole process of IUDS and the sponge city are shown in Table 8. For the IUDS, the rank of influence of influence factor changing on carbon emission was rainwater forced drainage > transport distance > UPVC. The most significant influence of the carbon emissions was rainwater intensive drainage, which changed by ±4.34%. Much electricity was used to run drainage pumps to drain the large amount of rainwater during rainfall to prevent flooding. Therefore, it is necessary to implement a sponge city to reduce electricity consumption. For the sponge city, the rank of influence of influence factor changing on carbon emission was annual rainfall > carbon sequestration rates of green space > HDPE > transport distance > fertilization and deworming. The greatest impact of the carbon emissions was annual rainfall, which made a change in carbon emissions of ±17.57%. More annual rain led to more rainwater needed for purification; therefore, rainwater purification was the greatest influential factor of the sponge city, which reduced carbon emissions. The useful suggestions were put forward in the next section based on the results and discussions above.
4.5. Suggestion
- (1)
- The energy-saving and low-carbon sponge city construction materials were used in the process of material production. During the construction of a sponge city, a large amount of carbon emissions are generated in the material production process. Therefore, it is suggested to use more environmentally friendly materials with low carbon emission coefficients, renewable materials, and materials produced from industrial or urban solid waste to reduce carbon emissions. For example, Biochar (BC) [32] was used in the green roof, which reduced the daily heat gain of the green roof by at least 0.06 MJ/m2. Biological carbon not only plays a significant role in stormwater runoff but also achieves better hydrothermal properties compared with BC-free ones.
- (2)
- Local manufacturers close to the construction site and energy-saving construction process should be selected. Due to the high density and thickness of the material, convenient transportation and nearby selection of material origin can reduce transportation carbon emissions. During the construction phase, trenchless top pipe construction is chosen to lay pipelines, energy-saving and environmental protection technologies to reduce energy consumption for transportation and machinery within the site. For example, LED lawn lights are used for night construction,
- (3)
- The vegetation selection and maintenance of the sponge city were chosen and designed scientifically and rationally. The carbon sequestration rate of the plants in the green area has an important impact on the sponge city. It is necessary to choose plant species with strong carbon sequestration ability and drought resistance, such as white Yulania soulangeana, Prunus davidiana, etc. At the same time, it is necessary to reduce dependence on fertilizers, pesticides, and other chemicals. Reduce the use of chemical fertilizers and combinate with inorganic fertilizers, or mix and compost the mowed lawn grass and fallen leaves from autumn collection sites with sewage from septic tanks to reduce carbon emissions. Biological control methods can be used, and natural enemies of pests can be used to reduce insect pests, such as lace flies, to control aphids.
5. Conclusions
Based on the IPCC guidelines and LCA, this research established a systematic accounting method for carbon emissions from the IUDS and the sponge city, which was divided into five stages: material production, material transportation, construction, operation and maintenance, disassembly, and recycling. The results of a case conducted in Beijing quantify the carbon emissions, and the CRP of sponge facilities in this project for 50 years was 612.45 tCO2eq after the renovation. Compared with IUDS, sponge city construction had a positive effect on carbon emission reduction and reduced carbon emissions by 87.08% on average. For the IUDS and the sponge system, the stormwater pipe network had the CRCE, and its material, transportation, pipeline laying, and maintenance all had important influences. Morris global analysis method was used to analyze the sensitivity of LCA results and obtained that the influence factors on carbon emissions in the life cycle were in the order of annual rainfall > carbon sequestration rate of green space > HDPE > transport distance > fertilization and insecticide. Based on the case study in Beijing, the measures can be proposed to reduce the carbon emissions of the sponge city: using energy-saving and low-carbon sponge city construction materials in the process of material production and scientifically and rationally choosing the vegetation selection and maintenance of the sponge city. The principle of proximity for material transportation should be considered, trenchless technology should be adopted as far as possible in pipeline laying, and mechanical energy consumption should be reduced. In addition, there was no complete and open database of carbon emission factors in China, the construction process of the sponge city was not clearly defined, and the consumption and frequency during operation and maintenance were not standardized. The results of this study can provide a reference for setting up the database of carbon emission factors and establishing national standards for items during the operation and maintenance of sponge cities.
Author Contributions
Conceptualization, H.X.; methodology and validation, Y.L.; formal analysis and writing—original draft preparation, Z.Z.; investigation, C.Z.; data curation, M.L.; writing—review and editing and supervision, C.L. All authors have read and agreed to the published version of the manuscript.
Funding
This research was funded by the Natural Science Research of Jiangsu Higher Education Institutions of China (22KJB480006) and the University and Business Partnership program (S11330B42113).
Data Availability Statement
Not applicable.
Acknowledgments
This work was supported by the Natural Science Research of Jiangsu Higher Education Institutions of China (22KJB480006) and the University and Business Partnership program (S11330B42113).
Conflicts of Interest
The authors declare no conflict of interest.
References
- Yu, K.; Li, D.; Yuan, H.; Fu, W.; Qiao, Q.; Wang, S. “Sponge City”: Theory and Practice. City Plan. Rev. 2015, 39, 26–36. [Google Scholar]
- Xia, J.; Zhang, Y.Y.; Xiong, L.H.; Shan, H.E.; Wang, L.F.; Zhongbo, Y.U. Opportunities and challenges of the Sponge City construction related to urban water issues in China. Sci. China Earth Sci. 2017, 60, 652–658. [Google Scholar] [CrossRef]
- Technical Guidelines for Sponge City Construction: Construction of Rainwater Systems for Low Impact Development (Trial); Ministry of Housing and Urban Rural Development: Beijing, China, 2014.
- Zhang, J.; Wang, Y.; Hu, Q.; He, R. Discussion and views on some issues of the sponage city construction in China. Adv. Water Sci. 2016, 27, 793–799. [Google Scholar]
- Vitousek, P.M.; Mooney, H.A.; Lubchenco, J.; Melillo, J.M. Human Domination of Earth’s Ecosystems. Science 1997, 277, 494–499. [Google Scholar] [CrossRef]
- Mahlman, J.D. Uncertainties in Projections of Human-Caused Climate Warming. Science 1997, 278, 1416–1417. [Google Scholar] [CrossRef]
- Churkina, G. Modeling the carbon cycle of urban systems. Ecol. Model. 2008, 216, 107–113. [Google Scholar] [CrossRef]
- Chen, J.; Gao, M.; Cheng, S.; Hou, W.; Song, M.; Liu, X.; Liu, Y.; Shan, Y. County-level CO2 emissions and sequestration in China during 1997–2017. Sci. Data 2020, 7, 391. [Google Scholar] [CrossRef]
- Su, X.; Shao, W.; Liu, J.; Jiang, Y.; Wang, J.; Yang, Z.; Wang, N. How does sponge city construction affect carbon emission from integrated urban drainage system? J. Clean. Prod. 2022, 363, 132595. [Google Scholar] [CrossRef]
- Wang, Y.; Li, H.; Abdelhady, A.; Harvey, J. Initial evaluation methodology and case studies for life cycle impact of permeability of permeable pavements. Int. J. Transp. Sci. Technol. 2018, 7, 169–178. [Google Scholar] [CrossRef]
- Getter, K.L.; Rowe, D.B.; Robertson, G.P.; Cregg, B.M.; Andresen, J.A. Carbon sequestration potential of extensive green roofs. Environ. Sci. Technol. 2009, 43, 7564–7570. [Google Scholar] [CrossRef]
- Yao, X.; Song, C. Effect of different factors dominated by water level environment on wetland carbon emissions. Environ. Sci. Pollut. Res. 2022, 29, 74150–74162. [Google Scholar] [CrossRef] [PubMed]
- Flynn, K.M.; Traver, R.G. Green infrastructure life cycle assessment: A bio-infiltration case study. Ecol. Eng. 2013, 55, 9–22. [Google Scholar] [CrossRef]
- Ian, C.; John, K.; Cui, Y. Evaluation of hidden carbon content of traditional Pavement and pervious concrete Pavement Brick Pavement. Struct. Units Units Archit. 2012, 32–35+25. (In Chinese) [Google Scholar]
- O’Sullivan, A.D.; Wicke, D.; Hengen, T.J.; Sieverding, H.L.; Stone, J.J. Life Cycle Assessment modelling of stormwater treatment systems. J. Environ. Manag. 2015, 149, 236–244. [Google Scholar] [CrossRef] [PubMed]
- Jie, M. A Study of Carbon Emissions of Typical Measures Adopted in Sponge City. For. Coll. 2018, 16, 27–32. [Google Scholar]
- Lin, X.; Ren, J.; Xu, J.; Zheng, T.; Cheng, W.; Qiao, J.; Huang, J.; Li, G. Prediction of Life Cycle Carbon Emissions of Sponge City Projects: A Case Study in Shanghai, China. Sustainability 2018, 10, 3978. [Google Scholar] [CrossRef]
- Shao, W.; Liu, J.; Yang, Z.; Yang, Z.; Yu, Y.; Li, W. Carbon Reduction Effects of Sponge City Construction: A Case Study of the City of Xiamen. Energy Procedia 2018, 152, 1145–1151. [Google Scholar] [CrossRef]
- Li, C. Study on carbon emission of sponge city stormwater system based on life cycle assessment. Environ. Sustain. Dev. 2019, 44, 132–137. [Google Scholar]
- Zheng, T. Estimation of Carbon Emission during Sponge City Reconstruction of esidential Community. China Water Wastewater 2021, 37, 112–119. [Google Scholar]
- Su, J.; Li, J.; Gao, X.; Yao, Y.; Jiang, C. Comprehensive analysis of waterlogging control and carbon emission reduction for optimal LID layout: A case study in campus. Environ. Sci. Pollut. Res. 2022, 29, 87802–87816. [Google Scholar] [CrossRef]
- Chunjing, S.; Chenglong, C.; Zhihui, Z. Quantitative Assessment on Carbon Emission of Different Structures in Building Life Cycle. Build. Sci. 2011, 27, 66–70+95. [Google Scholar]
- GJBT-975 06MS201; Municipal Drainage Pipeline Engineering and Auxiliary Facilities. China, 2006. Available online: http://www.jianhuw.com/Geipai/guifan/376337.html (accessed on 4 October 2023).
- Zhang, X. Carbon Emussions Measurement Methods and Comparative Studies on Green Building Structural System. Master’s Thesis, Harbin Institute of Technology, Harbin, China, 2014. [Google Scholar]
- Cui, P. The Establishment of a Life-Cycle Carbon Emission Factor Database for Buildings and Research. Master’s Thesis, Southeast University, Nanjing, China, 2015. [Google Scholar]
- Xiong, B. Study on the Estimation of Carbon Emissions of Residential Buildings during Their Whole Life Cycle. Master’s Thesis, Shenzhen University, Shenzhen, China, 2015. (In Chinese). [Google Scholar]
- National Bureau of Statistics. China Statistical Yearbook-2021; China Statistics Press: Beijing, China, 2021. [Google Scholar]
- Lu, L. Life Cycle Assessment of Two Typical Low Impact Development Technology. Master’s Thesis, Beijing University of Civil Engineering and Architecture, Beijing, China, 2013. [Google Scholar]
- Kun, H. Research on the Water Quality Evaluation and Use or Rain on City Area. Master’s Thesis, Harbin Institute of Technology, Harbin, China, 2009. [Google Scholar]
- Chen, L. Research on Carbon Emission Calculation and Emission Reduction Strategy of Residential Buildings in the Whole Life Cycle—A Case Study of Lishui New Town Project in Shenyang. Master’s Thesis, Shenyang Jianzhu University, Shenyang, China, 2020. [Google Scholar]
- Li, J.; Zhang, X.; Li, H. A case study of Carbon Emissions in the Construction and Operation of the Sponge City in a Certain Area of Beijing. Water Resour. Prot. 2023, 39, 86–93. [Google Scholar]
- Tan, K.; Wang, J. Substrate modified with biochar improves the hydrothermal properties of green roofs. Environ. Res. 2023, 216, 114405. [Google Scholar] [CrossRef] [PubMed]


Disclaimer/Publisher’s Note: The statements, opinions and data contained in all publications are solely those of the individual author(s) and contributor(s) and not of MDPI and/or the editor(s). MDPI and/or the editor(s) disclaim responsibility for any injury to people or property resulting from any ideas, methods, instructions or products referred to in the content. |
© 2023 by the authors. Licensee MDPI, Basel, Switzerland. This article is an open access article distributed under the terms and conditions of the Creative Commons Attribution (CC BY) license (https://creativecommons.org/licenses/by/4.0/).