Abstract
The susceptibility to precipitation extreme events (PEEs) and aridity in the Iberian Peninsula (IP) were assessed over a long historical period (1950–2022). Eight extreme precipitation and two aridity indices were calculated. Furthermore, two newly developed composite and principal component-based susceptibility indices were applied. For this purpose, we applied a quantile mapping bias correction of the ERA5-Land reanalysis using the Iberia01 observational dataset in their overlapping period (1971–2015). A trend analysis for 1950–2022 revealed an annual and seasonal drying over the southwestern, central, and northeastern regions, accompanied by annual wetting over the southeast. The PEE contribution to the total precipitation, which was higher over the eastern IP (24 to 28%), increased in several coastal regions during winter, and in the north-central regions during summer and annually. High to very high susceptibility areas, corresponding to ~50% of the IP, were located on the mountains’ Atlantic/Mediterranean-facing side, whereas the inner plateaus revealed a low to moderate susceptibility. Apart from agreeing with previous studies, our results showed with high detail the susceptibility to PEEs and the recent past trends for all the IP regions, which is a novelty among similar studies and allows for improvements in e.g., crop management, urban planning, or risk mitigation.
1. Introduction
In recent years, the term “extreme weather events” has increasingly been mentioned around the world. According to the Intergovernmental Panel on Climate Change [1], an extreme weather occurrence is “an event that is rare at a particular place and time of year”. For an event to be extreme, the values of a variable must surpass a threshold. If such an event persists for some time (e.g., a season), it can be classified as an extreme climate event. Examples of extreme weather and climate events, hereafter referred to as atmosphere-driven extreme events (AEEs), are extreme temperatures, which can lead to heat waves and wildfires; extreme precipitation, which can lead to floods; and a persistent lack of precipitation, which can lead to droughts.
The impact of AEEs on peoples’ lives can be quite significant. In public health terms, heat waves can cause heat exhaustion, while floods can affect water quality, lead to respiratory infections and disease spreading, and destroy supplies and equipment in medical facilities [2,3]. Concerning infrastructures, floods can damage houses and public infrastructures, such as health facilities, roads, and railways. Electricity blackouts can also occur as a consequence of heat waves, wildfires, or floods [3]. As for the economic sectors, agriculture is perhaps the most affected by AEEs. In effect, Vogel et al. [4] found that AEEs are responsible for 18% to 43% of the explained variance in crop yield anomalies, depending on the crop type. Furthermore, the United Nations Food and Agriculture Organization (FAO) states that droughts and floods are the greatest causes of agricultural production loss, responsible for 34% and 19% of crop and livestock production loss in developing countries, respectively [5]. Droughts and floods also contribute indirectly to production loss through crop and livestock pest and disease outbreaks, by catalyzing spreading conditions and intensifying their transmission [5].
In Europe, increasing temperatures are leading to more frequent and severe summer drought events [6], whereas extreme heat and cold events are increasing cardiovascular and respiratory mortality and morbidity [7]. The July 2021 floods in Germany, Belgium, and the Netherlands have shown that heavy rainfall episodes, with an approximate 400-year return period, are expected to become more frequent in central-western Europe [8]. It has also been found that floods can be associated with a deterioration of the European population’s mental health [7].
Within Europe, the Iberian Peninsula (IP) (Figure 1) is one of the regions most affected by AEEs [9,10]. By being exposed to a hot to semi-arid climate, the south and central-eastern IP regions have a significant vulnerability to droughts and heat waves. Some studies have shown that a positive trend in the northwestern IP precipitation and a negative trend in the southern IP precipitation have been observed from the beginning of the 20th century until the last decade, which translates into a drying trend for a large area of the southern and central IP at annual scale, but mostly during spring and summer [11,12]. Furthermore, the frequency of severe and extreme drought conditions in the last 60 years has been the highest of any recorded period [13]. As a consequence, heat waves and severe drought conditions have led to extreme wildfires and decreases in soil water availability in the last 40 years, which in turn have led to agricultural drought and crop yield losses [14,15,16,17].
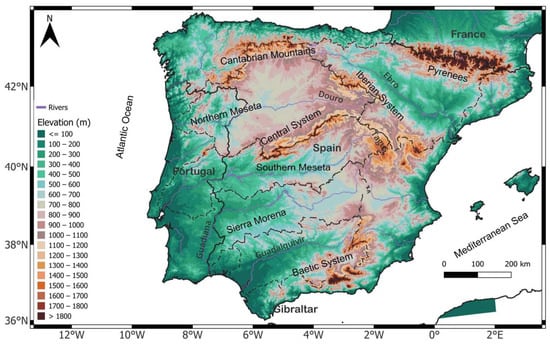
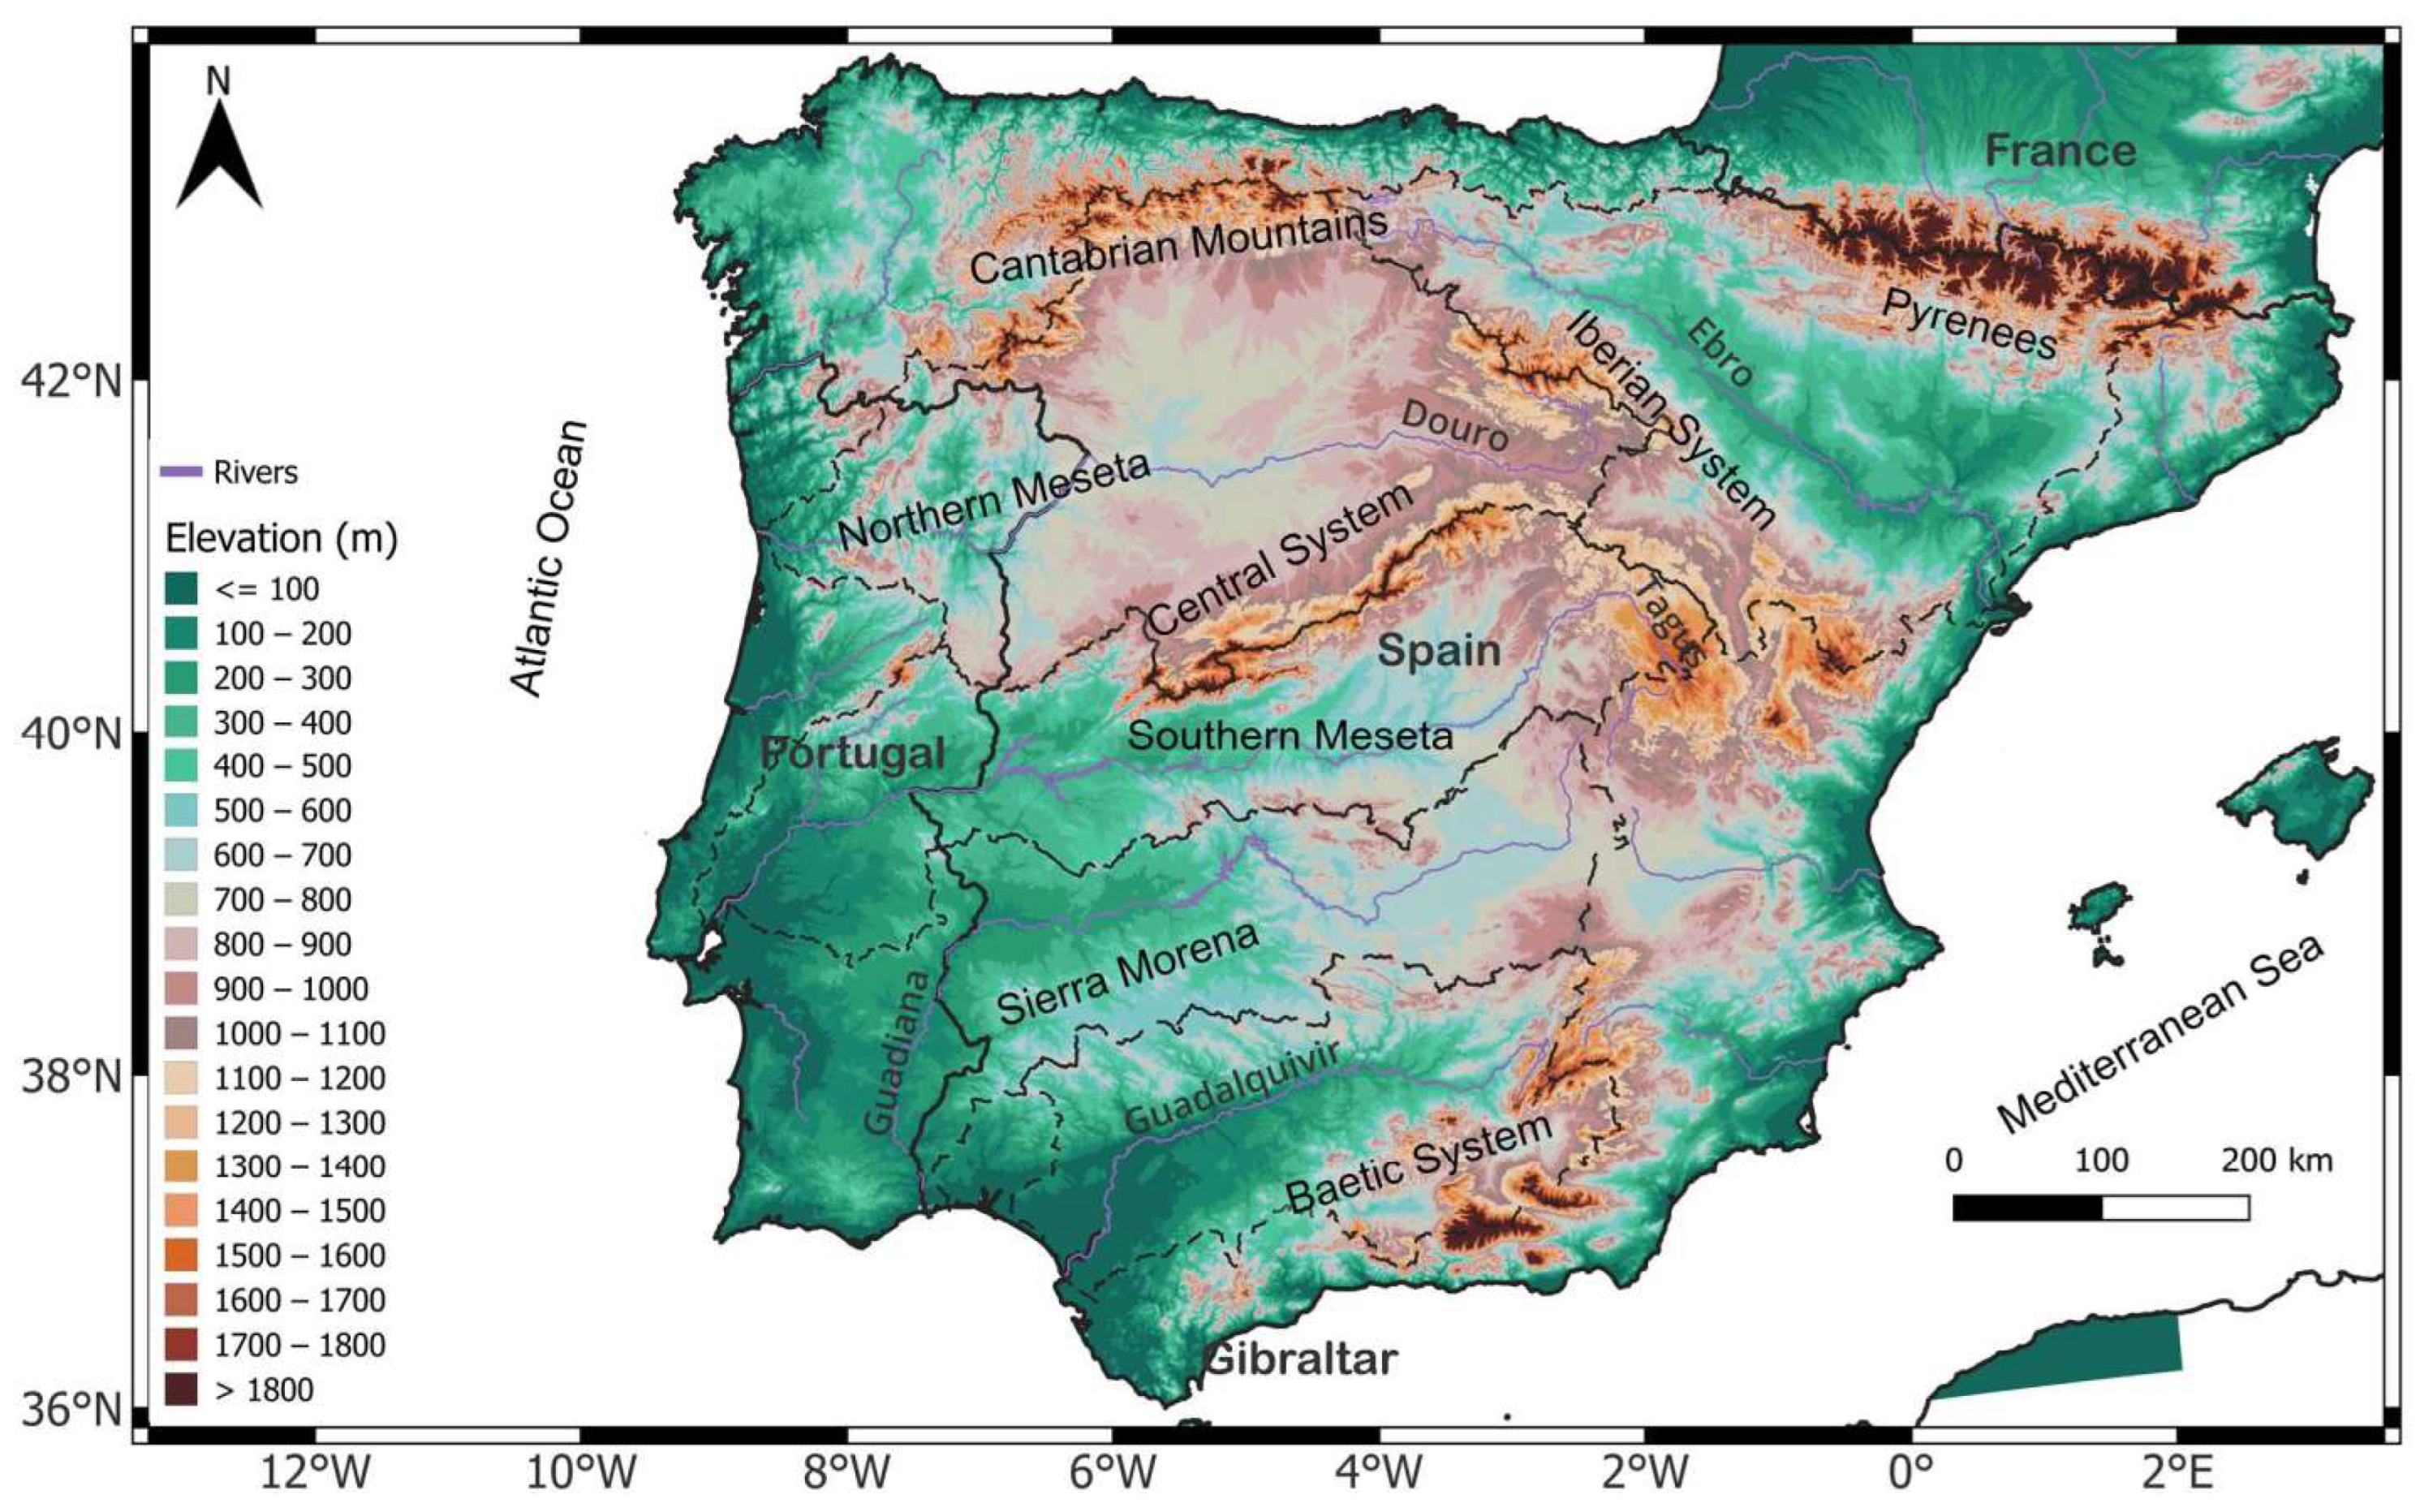
Figure 1.
Iberian Peninsula hypsometric map. Black dashed lines represent the hydrographic basin borders, and the purple lines are the main rivers.
However, besides the major AEE threat of drought and heat waves, the IP also faces the threat of precipitation extreme events (PEEs), which can cause flash floods, such as the ones that occurred in Lisbon (central-west Portugal) in December 2022, or Murcia, Catalonia, and Valencia (eastern Spain) during September 2022 [18,19,20,21]. PEEs in the western IP mainly occur due to strong Atlantic zonal flows, such as “atmospheric rivers” [22,23,24] associated with recurrent cyclones and frontal systems, that generate high moisture advection over the mainland. In the eastern IP, the major drivers of PEEs tend to be deep cut-off lows combined with easterly moisture flows from the Mediterranean Sea [25].
The most recent studies on precipitation in the IP demonstrate that, in Spain, precipitation events overall have become less intense but longer, with the frequency becoming higher for low-precipitation events and lower for high-precipitation events [26]. On the contrary, in the Mediterranean coastal regions, the frequency has decreased for low-precipitation events and increased for high-precipitation events, which can be associated with a positive trend of convective precipitation events in this region [26,27]. Furthermore, in these regions, the duration of precipitation events has increased. In northern Spain, along the Cantabrian coast, the precipitation regime during the last century has been quite stable, with the only significant trend detected being an increase in the maximum winter precipitation [28]. Seasonally, the trends for PEE occurrences have shown a decrease during winter for most of the IP, but an increase over an area within southeastern Spain, which narrows as the duration of PEEs increase. Spring presented negative trends in the frequencies of occurrence of PEEs for most of the IP, yet in the entire northeast region the trend was positive. During autumn this situation reverted, since the entire east-northeast IP presented a negative trend, while the northwest, central-west, and southern IP revealed a positive trend in the PEEs’ frequencies of occurrence [29]. More specifically, in Portugal, the daily precipitation observational data for the same period revealed a significant drying trend during spring, mainly in north and central Portugal, and a weak wetting trend in autumn [30,31,32]. Moreover, PEEs seem to have become less frequent in spring and more frequent in autumn. Santos et al. [30] also observed a decrease in the number of occurrences of PEEs during spring in the central region and an increase during autumn in the northern region and Lisbon. An increase in the frequency and intensity of PEEs in Lisbon was also stated by Espinosa et al. [13].
Since most of the aforementioned studies were based on observational data and together covered almost all the regions of the IP, it was possible to obtain a general perception of the precipitation trends in this part of Europe during the last century. Moreover, the previous studies also highlighted the high complexity of the historical trends in the PEEs over the IP, depicting a low spatial and temporal coherency, and did not support the idea of a generalised increase in PEEs throughout the IP. Nevertheless, few published studies made a precipitation trend analysis for the IP altogether, as the use of observational data depends on a relatively small number of weather stations scattered across it. Further, the periods covered by most of the above-mentioned studies were relatively short or did not include the most recent precipitation data available for the IP. There was also a lack of agreement on which precipitation indices should be considered, though there were common indices between all the referred studies. As an approach to these disparities, Santos et al. [33] established a unified extreme precipitation susceptibility index (EPSI) that was subsequently used to identify the regions of extreme precipitation in Portugal [30].
Therefore, the present study aims to update and improve the preceding studies on PEEs in the IP by using a daily time series of the total precipitation and 2-metre air temperature from 1950 to 2022 (73 years, covering a longer and more recent time series than any of the previous studies) and combining data from the ECMWF reanalysis project version 5-Land (ERA5-Land) with data from Iberia01, a 0.1° latitude × 0.1° longitude observational dataset [34]. Using this approach, the data were available with a spatial resolution of ~9 km over the IP and for the full period (1950–2022), thus allowing for more accurate conclusions about PEEs in the IP. As such, the present study assesses the most widely used precipitation indices, at inter- and intra-annual timescales, including their trends, as well as the susceptibility of each IP region to PEEs through the calculation of compound indices, namely the EPSI and an additional index obtained from a principal component analysis (PCA). Section 2 will describe the datasets and methods. Section 3 presents the main results. Lastly, a discussion of the results and the main conclusions are presented in Section 4.
2. Data and Methodology
2.1. Study Area Characterization
Located in the southwest of Europe, the Iberian Peninsula (IP) is characterised by a very mountainous topography in the northern/northeastern, central (Central and Iberian Systems) and southeastern regions (Baetic System), and a flatter topography in the southwestern region (Tagus, Guadiana, and Guadalquivir River basins). Figure 1 represents the topography of the IP and its main rivers, as well as the hydrographic basins’ borders. The 25-m resolution European Digital Elevation Model version 1.1 (EU-DEM) and river data from the European Environmental Agency (EEA) were used for this purpose [35,36]. The northern and southern landscapes are separated by the Central System mountain range that crosses central Spain and Portugal; the Iberian System mountain range that runs from north to central-eastern Spain; and the northern Portugal mountain ranges. Other important mountain ranges are the Cantabrian mountains, which separate the northern IP from the Atlantic Ocean; the Baetic System, located along the southern Spanish coast; the Pyrenees, on the northeast, along the Spain–France border; and the Sierra Morena range, which crosses southern inland Spain from east to west. Important Meseta (i.e., plateau) areas are also found in the north-central and south-central regions. The northern Meseta area forms the Douro River basin, whereas the southern Meseta encompasses the Tagus and Guadiana River basins. The other major IP plateaus are the Guadalquivir River basin, between the Sierra Morena and the Baetic System; and the Ebro River basin, between the Pyrenees and the Iberian System. According to the Köppen-Geiger climate classification system [37], the IP territory is mostly covered by four distinct climates. The southwestern IP is characterised by a hot summer Mediterranean climate (Csa) with hot dry summers and mild wet winters; the central-eastern IP is characterised by a cold semi-arid climate (BSk) with warm to hot dry summers and relatively cold winters; the northwestern IP features a warm summer Mediterranean climate (Csb) with warm summers and rainy winters; and the northern IP is mostly characterised by an oceanic climate (Cfb) that is moist throughout the year with cool summers and mild winters.
Located roughly between the latitudes 36° N and 44° N, the IP acts as a transition zone between the sub-tropical high-pressure and the sub-polar low-pressure belts, thus presenting significant weather and climate variability through space and time [15,38]. This variability is influenced by the position of the Azores High (AH) pressure system and the orography [14]. During winter, when the AH is displaced southwards, the northwestern and central mountain ranges are important condensation barriers against the prevailing westerly-southwesterly humid Atlantic winds, with significant precipitation amounts on the Atlantic-facing slopes. During summer, when the AH is displaced northwards, precipitation in the IP mostly occurs along the northern coast due to the blocking of the northern-northeastern Atlantic winds by the Cantabrian and Pyrenees mountain ranges. In the northeastern IP, mostly during summer and autumn, the eastern Pyrenees block the easterly Mediterranean winds, frequently triggering heavy convective precipitation [27].
2.2. Datasets
To study historical PEEs in the IP, daily accumulated precipitation and hourly 2-metre temperature data were obtained from the ECMWF reanalysis project, version 5-Land (ERA5-Land) from 1950 to 2022. The ERA5-Land is a reanalysis dataset (i.e., a combination of model and observational atmospheric data) of land surface variables that has an improved resolution compared to the ERA5 reanalysis on which it is based [39]. ERA5-Land uses ERA5 atmospheric variables as atmospheric forcing to control the simulated land fields but corrects those variables to account for the elevation difference between the grid of the forcing and the native higher resolution grid of the ERA5-Land [39]. The ERA5-Land dataset extends from the year 1950 until 2022 and has a spatial resolution of ~9 km (0.1° latitude × 0.1° longitude). However, to better resolve/capture the spatial heterogeneities in these atmospheric fields over the IP, as well as to correct the bias in the ERA5-Land, the gridded daily accumulated precipitation and 2-metre air temperature from the Iberia01 observation-based dataset were also used to bias correct the reanalysis data. The Iberia01 is an observational gridded dataset of daily precipitation and temperatures produced by researchers from the University of Cantabria (Spain), the University of Lisbon (Portugal), and the Portuguese Atmosphere and Sea Institute (IPMA) [34]. It is currently the best observational dataset available from the IP since it uses a large network of weather stations scattered across the territory (3486 stations for precipitation and 275 stations for temperature), covers a relatively long record period (1971–2015), and has a spatial resolution of 0.1° latitude × 0.1° longitude. It has also been shown that the Iberia01 precipitation patterns are more realistic than those of the E-OBS version 27.0e dataset (a gridded daily observational dataset for several meteorological variables over Europe [40]), which relies on a much sparser network of around 270 weather stations over the IP [34,41,42].
2.3. Bias Correction and the Indices of Extremes
Once the ERA5-Land reanalysis dataset was downloaded (https://cds.climate.copernicus.eu/cdsapp#!/dataset/reanalysis-era5-land?tab=form (accessed on 15 February 2023)), the data were carefully adjusted with the appropriate scale factors and offsets, ensuring the same geographical area as the Iberia01 dataset, and the daily mean values of the hourly temperature data were calculated. No common grid box adjustment was made since the spatial resolutions of both datasets were equal. Then, aiming at minimizing the differences relative to the observations, the ERA5-Land data was bias corrected using the Iberia01 dataset. Hence, an improved total precipitation and 2-metre air temperature database was obtained, also covering an extended 73-year period (1950–2022). The bias correction followed a quantile mapping approach (QM), which consisted of finding the quantiles of the observed and simulated (or reanalysed) data corresponding to common cumulative distribution function (CDF) values, and then calculating the bias between the observed and simulated quantiles through their difference or scaling factor. Since it is a widely used bias correction technique, there were several ways of applying QM to the data. This research applied QM following the method described by Miao et al. [43], known as nonstationary CDF matching (CNCDFm). This method resulted from the combination of the equidistant and equiratio CDF matching techniques developed by Li et al. [44] and Wang et al. [45], respectively, and was applied as follows.
where , , , and represent, respectively, the 1950–2022 extended reanalysis data quantiles, 1971–2015 reanalysis data quantiles, 1971–2015 observed data quantiles, and 1950–2022 bias-corrected quantiles. For the temperature bias correction, only Equation (1) was considered. Equations (2) and (3) were applied to the precipitation data to avoid negative corrected values, as explained by Miao et al. [43]. Another advantage of the CNCDFm is the avoidance of unreasonably high values in the corrected data. Furthermore, this method was trend preserving, as can be seen in Figure S2 through a comparison of the bias-corrected and non-bias-corrected ERA5-Land precipitation data. The corrected quantiles were then converted back to the original time-dependent variables. This methodology has been widely applied in recent studies, such as Refs. [46,47], and will not be further detailed. After the preliminary bias correction of the reanalysis data, several extreme precipitation indices for the 1950–2022 and 1981–2022 periods were calculated at annual, winter (December, January and February—DJF), spring (March, April and May—MAM), summer (June, July and August—JJA), and autumn (September, October and November—SON) timescales. The latter (shorter) period was also selected to determine recent past climatic conditions, which is particularly important under ongoing climate change that can be manifested by significant modifications in the patterns between both periods. The chosen indices resulted from the joint effort of the World Meteorological Organization’s Commission for Climatology (CCI), the World Climate Research Programme Project on Climate Variability and Predictability (CLIVAR), and the JCOMM Expert Team on Climate Change Detection and Indices (ETCCDI) [48] and have already been largely applied in several studies worldwide [30,49,50,51,52]. Eight well-established extreme precipitation indices were considered: the total precipitation in wet days (i.e., the days with a total precipitation of at least 1 mm); the maximum number of consecutive wet days (CWD); the maximum 1-day (Rx1Day) and 5-day (Rx5Day) precipitation amounts; the number of days with a total precipitation above 20 mm (R20mm); the fraction of the total precipitation exceeding the 95th percentile (R95PTOT); the simple daily intensity index (SDII, i.e., the mean daily precipitation amount at wet days); and the mean seasonal contribution to the total annual precipitation. The aridity of the study area was also evaluated through the calculation of the maximum number of consecutive dry days (CDD) and the De Martonne index (DMI), a climate classification index that is widely used to identify dry and humid regions [53,54,55,56]. The DMI is based on a precipitation–temperature ratio and is described by Equation (4).
where d is the duration of the study period in months, p is the period’s total precipitation (in mm), and T is the period’s mean temperature (in °C). Following the aridity classification defined by Araghi et al. [57] to characterise the climate of the IP regions, we established the categories mentioned hereafter: hyper-arid (DMI ≤ 5 mm/°C), arid (5 < DMI ≤ 10 mm/°C); semi-arid (10 < DMI ≤ 20 mm/°C); Mediterranean (20 < DMI ≤ 24 mm/°C); semi-humid (24 < DMI ≤ 28 mm/°C); humid (28 < DMI ≤ 35 mm/°C); very humid (35 < DMI ≤ 55 mm/°C); and extremely humid (DMI > 55 mm/°C).
2.4. Trend Detection, Principal Component Analysis (PCA), and Extreme Precipitation Susceptibility Index (EPSI)
The next step of our research was to isolate significant historical per year trends in the indices throughout the study period. Owing to the different statistical nature of the indices, the Mann-Kendall and Sen’s Slope non-parametric trend tests were applied at a 5% significance level [58,59,60]. The Mann-Kendall test is a non-parametric test that is widely used to detect monotonic trends in hydrometeorological variables and quantify their significance, while Sen’s slope is a non-parametric test used to estimate the magnitude of a given trend [61,62,63,64,65,66]. Given that the results of both tests were very similar and that our goal was to detect statistically significant trends and identify their corresponding signal, only the Mann-Kendall test results are shown herein. Then, to identify the IP regions with the highest susceptibility to PEEs throughout the last 73 years, the compound extreme precipitation susceptibility index (EPSI) was calculated following Equation (5).
where i and j represent, respectively, the latitude and longitude of each grid box. Thus, the EPSI is the sum at each grid box of the most suitable ETCCDI indices for the characterization of PEE locations, which in the case of Santos et al. [33] were the maximum annual Rx1Day, Rx5Day, and CWD indices, and the mean annual SDII, R20mm, and R95PTOT indices. Before summing them, each index was normalised to the minimum and the maximum of all the annual periods (in the annual EPSI calculations) or seasonal periods (in the seasonal EPSI calculations). After the EPSI calculation, the susceptibility classes were defined. Since the EPSI index was only applied to mainland Portugal [30,33], there was no global EPSI data available, thus making it difficult to attribute the susceptibility classes. Santos et al. [33] defined four susceptibility classes (low, moderate, high, and very high) relative to the EPSI values it obtained for Portugal, and therefore, the highest and lowest susceptibility classes were attributed to the highest and lowest EPSI values of that territory, respectively. This research followed the same approach, by calculating the quartiles of all the annual and seasonal EPSI values to identify the border values of each of the four PEE susceptibility classes. Since several extreme precipitation indices were considered, a PCA of the same indices used in the EPSI was also applied to reduce dimensionality and regionalise the PEEs in the IP during the 1950–2022 and 1981–2022 periods on both annual and seasonal timescales [67,68]. Some statistically significant positive correlations existed among these indices, as shown in Table S1. The PCA-based compound index combined the leading two principal components (PC1 and PC2), weighted by the corresponding eigenvalues. This allowed for a comparison with the EPSI results, and therefore, an evaluation of the EPSI’s ability to determine a region’s susceptibility to extreme precipitation. This is a crucial step, given that the EPSI index is relatively recent, and has been scarcely used in similar studies. Using two compound indices can also enhance the robustness of the study outcomes.
3. Results
From the eight extreme precipitation indices that were calculated, we have chosen to only present the results of the total precipitation, mean seasonal contribution to the total annual precipitation, and R95PTOT, since these were the indices that more directly answered the fundamental questions of this research: In each IP region, what is the mean amount of precipitation reaching the surface annually and seasonally? Which is the season with the highest precipitation? How much precipitation is due to PEEs? Then, the CDD and DMI indices are also presented to assess the IP regions’ aridity. In the second part of this section, the results of the former indices’ trend analyses are presented to answer a fourth question: How are the aridity and PEEs’ influence on precipitation evolving in the IP? The third part approaches the most innovative results of this research, namely the compound EPSI and PCA-based susceptibility indices, and thus answers the fifth and most important question of our research: Which IP areas are more susceptible to PEEs? The results of the CWD, R20mm, Rx1Day, Rx5Day and SDII indices are presented, respectively, in Figures S3–S7 (Supplementary Materials).
3.1. Extreme Precipitation and Aridity Indices
Although the mean precipitation pattern in the IP was already well known [69], given that the dataset used in our study arose from an innovative Iberia01 bias correction of the ERA5-Land data, its annual and seasonal description for the 1950–2022 and 1981–2022 periods was succinctly carried out. Regarding the quality of the Iberia01 observational dataset, as shown in Figure S1a,b (Supplementary Materials), major differences were seen between the E-OBS and Iberia01 datasets. Relative to E-OBS, Iberia01 presented much more precipitation spatial variance throughout the IP, as well as higher precipitation gradients between the mountainous and plateau regions, something also observed by Herrera et al. [34]. A possible explanation for this was that the Iberia01 data were gathered by a much higher number of IP weather stations than the E-OBS data (3486 stations versus 270 stations, for precipitation), which allowed it to have a spatial resolution of 10 km; higher than the 25-km resolution of E-OBS. Consequently, interpolating the data from a denser network of weather stations provided more realistic precipitation data. For all these reasons, we think that Iberia01 is a better observational dataset than E-OBS for this kind of research in the IP. A comparison between the non-bias-corrected (Figure S1c) and bias-corrected (Figure S1d) datasets showed that bias correcting the data with Iberia01 allowed for a broader precipitation information range and higher precipitation spatial gradients in the areas where the original precipitation data had little to no variations. This validated the quality of Iberia01, its use in the improvement of precipitation hindcast or reanalysis data from the IP, and the effectiveness of the bias correction technique.
Moving towards the analysis of the mean total precipitation results from 1950–2022 and 1981–2022 (Figure 2), the annual precipitation distribution patterns shown in Figure 2a,b were very similar to each other (no remarkable modifications), with the higher values occurring along the southern Pyrenees, northern IP, and northwestern IP coasts, and the lower values occurring mainly in southeastern IP, but also in the northeast and central IP. As explained in Section 2.1, this precipitation distribution pattern mainly occurs due to the barrier effect imposed by the mountain ranges on the Atlantic blowing winds. Throughout the territory, the mean total annual precipitation approximately ranged from 200 mm to 2000 mm. At the seasonal timescale, similar patterns to the annual precipitation were also displayed, but with the expected changes due to the precipitation intra-annual variability in each part of the territory. During winter, the maximum precipitation occurred along the northern and northwestern IP coasts, particularly in the latter (more exposed to the prevailing westerlies), with values between 350 and 750 mm, while in most of the eastern IP, precipitation did not exceed 100 mm. In spring and autumn, the precipitation gradient between the northwestern and eastern IP was lower, since precipitation on the northwest coast decreased to maximum values of around 500 mm, whereas the minimum values in the eastern IP increased to around 100 mm. Similar to the annual patterns, during winter, spring, and autumn the central IP regions also presented lower values of precipitation (sheltered from the maritime air masses by several mountain ranges), while along the southwest coast, the values were slightly higher. Lastly, during summer, the northern IP was, by far, the rainiest region, with maximum values around 350 mm, while the entire southern half of the IP had precipitation values below 50 mm and virtually zero in the southernmost areas.
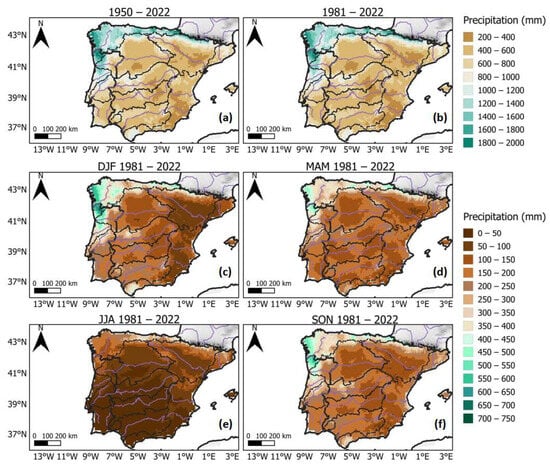
Figure 2.
(a) 1950–2022 annual, (b) 1981–2022 annual, and 1981–2022 (c) winter, (d) spring, (e) summer, and (f) autumn total precipitation (mm) over the Iberian Peninsula.
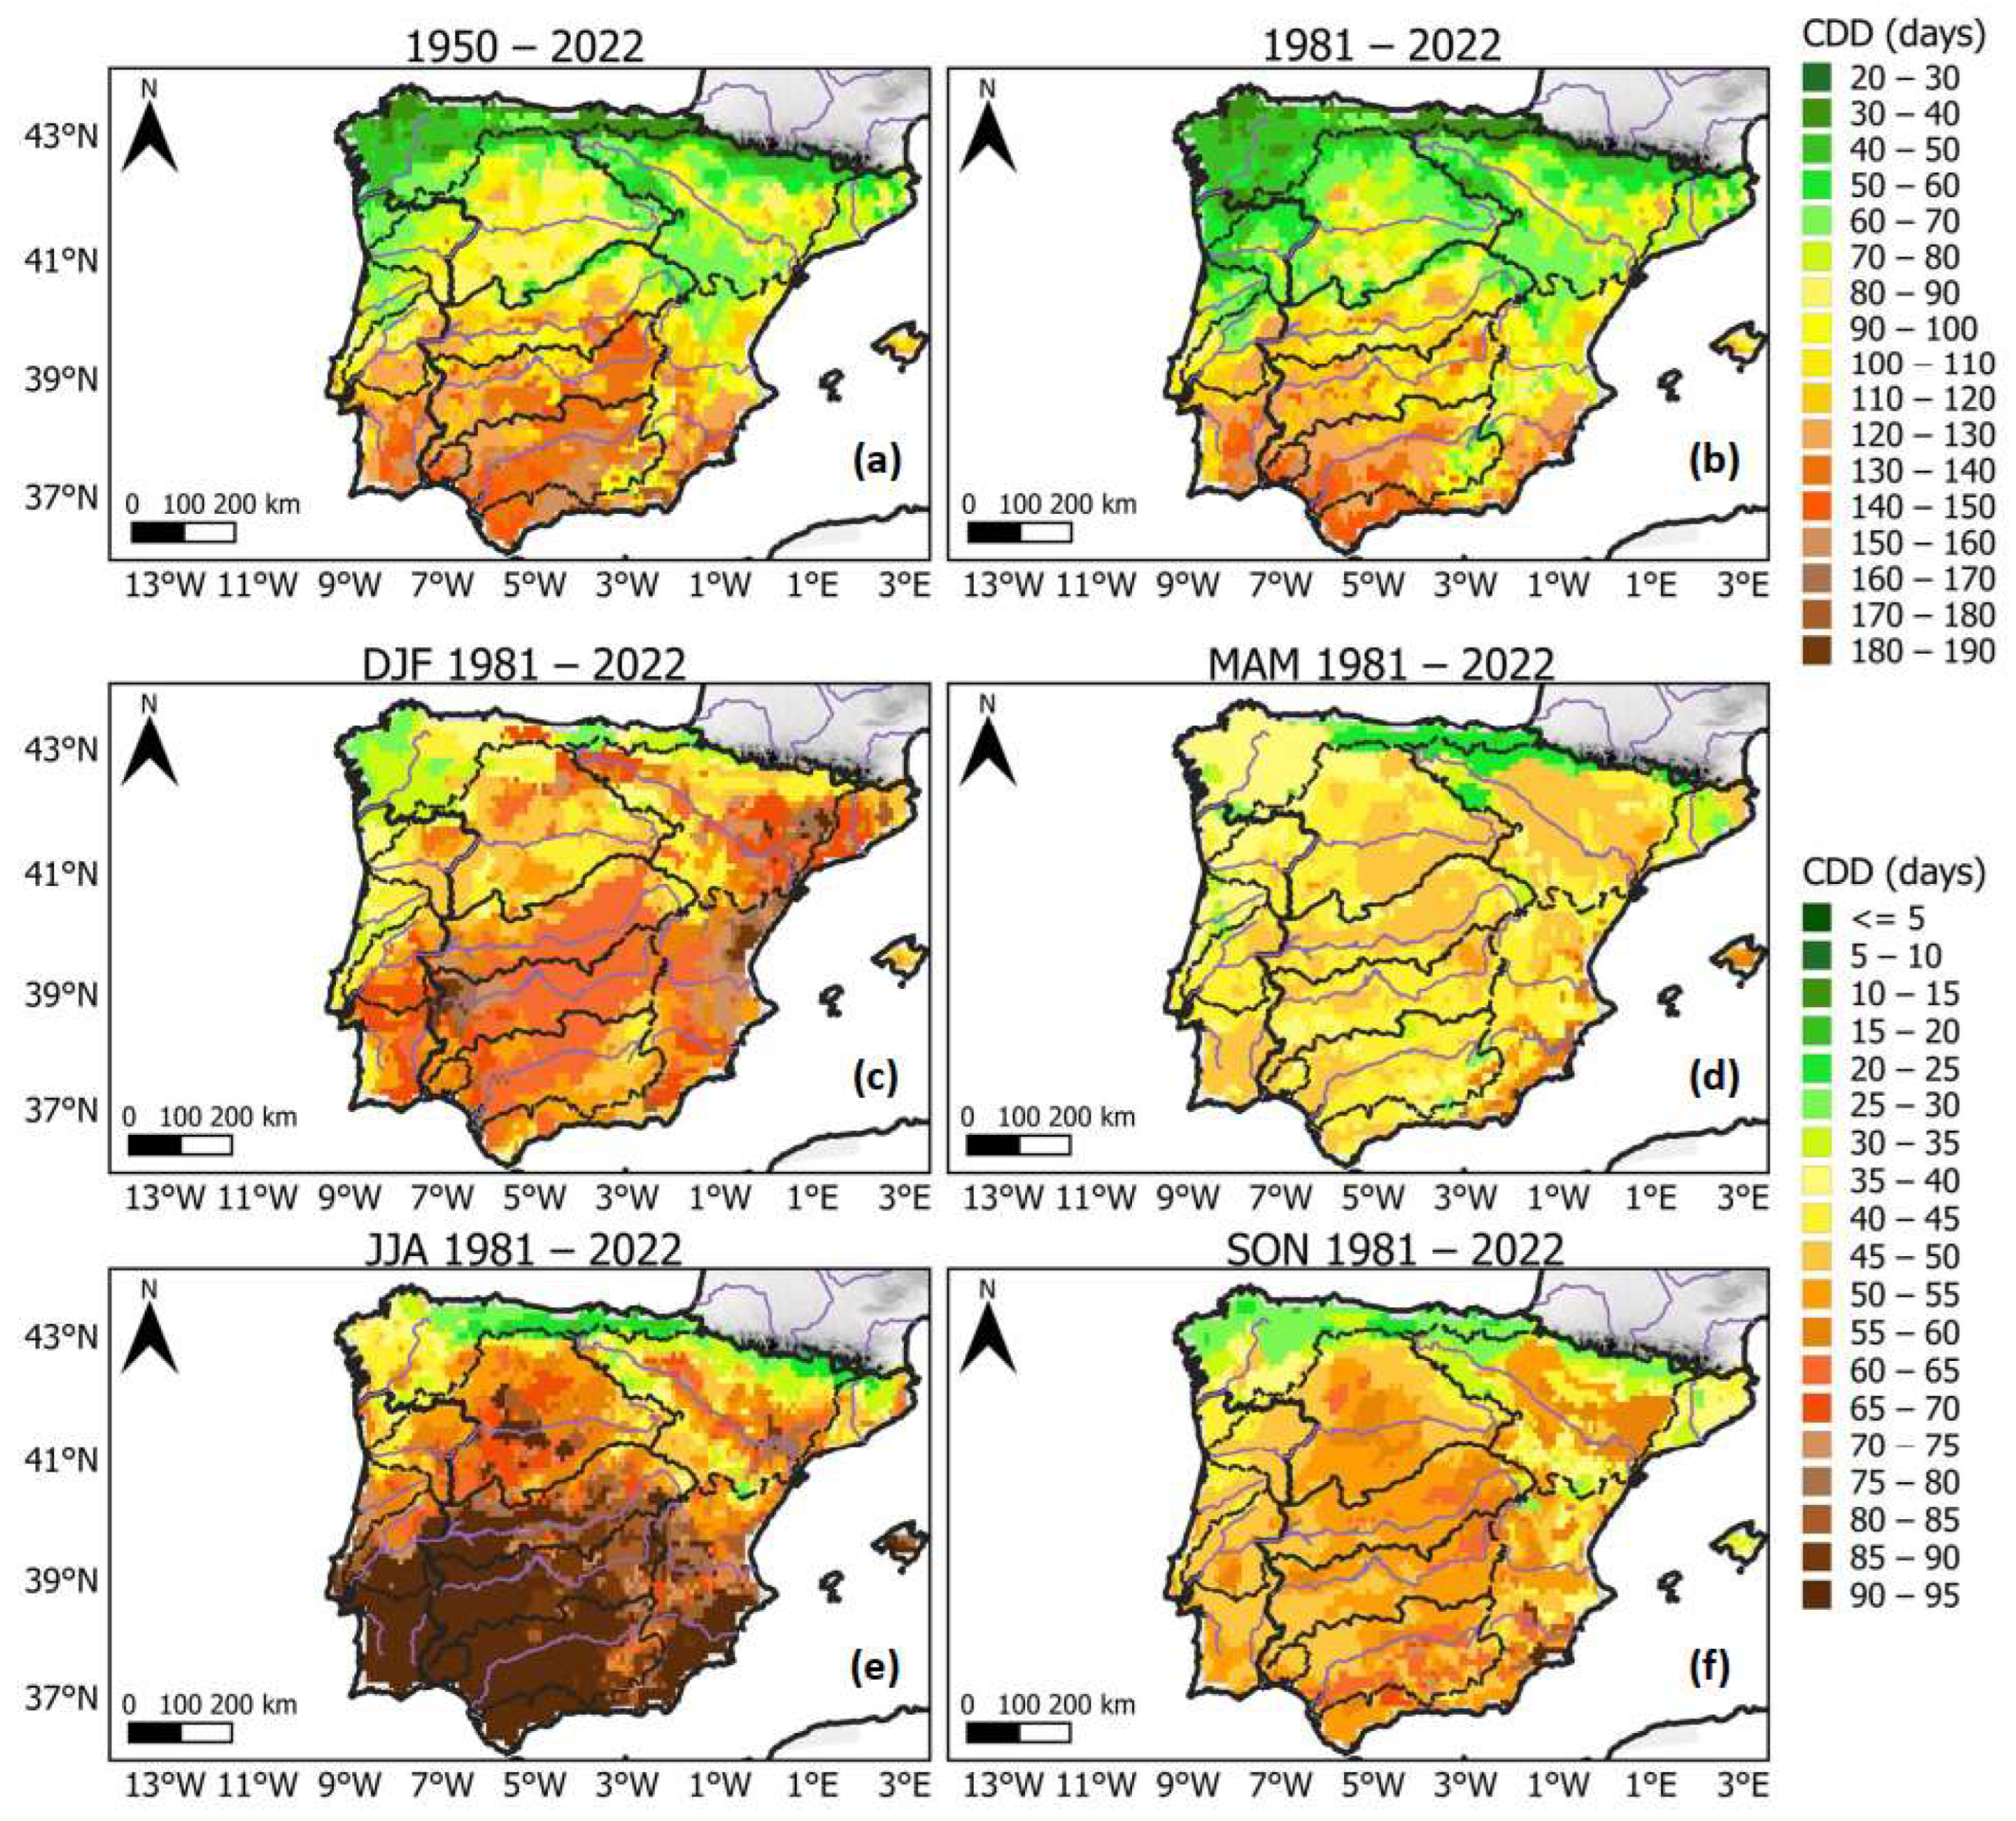
In 1950–2022, the shortest CDD periods lasted between 20 to 80 days and were observed in the north, northwest, and inner northeast regions (Figure 3). The longest CDD periods, lasting up to 150 days, occurred in the southern IP. The 1981–2022 period presented similar results, with the main difference being shorter CDD periods in the inner regions. An inspection of the seasonal representations showed that the CDD periods were longer in the southern half of the IP during summer, and shorter along the northern IP coast and Pyrenees during spring and summer. Another interesting result was that the CDD periods during winter were longer than those in spring and autumn over the southern and eastern IP.

Figure 3.
(a) 1950–2022 annual, (b) 1981–2022 annual, and 1981–2022 (c) winter, (d) spring, (e) summer, and (f) autumn maximum number of consecutive dry days (CDD) over the Iberian Peninsula.
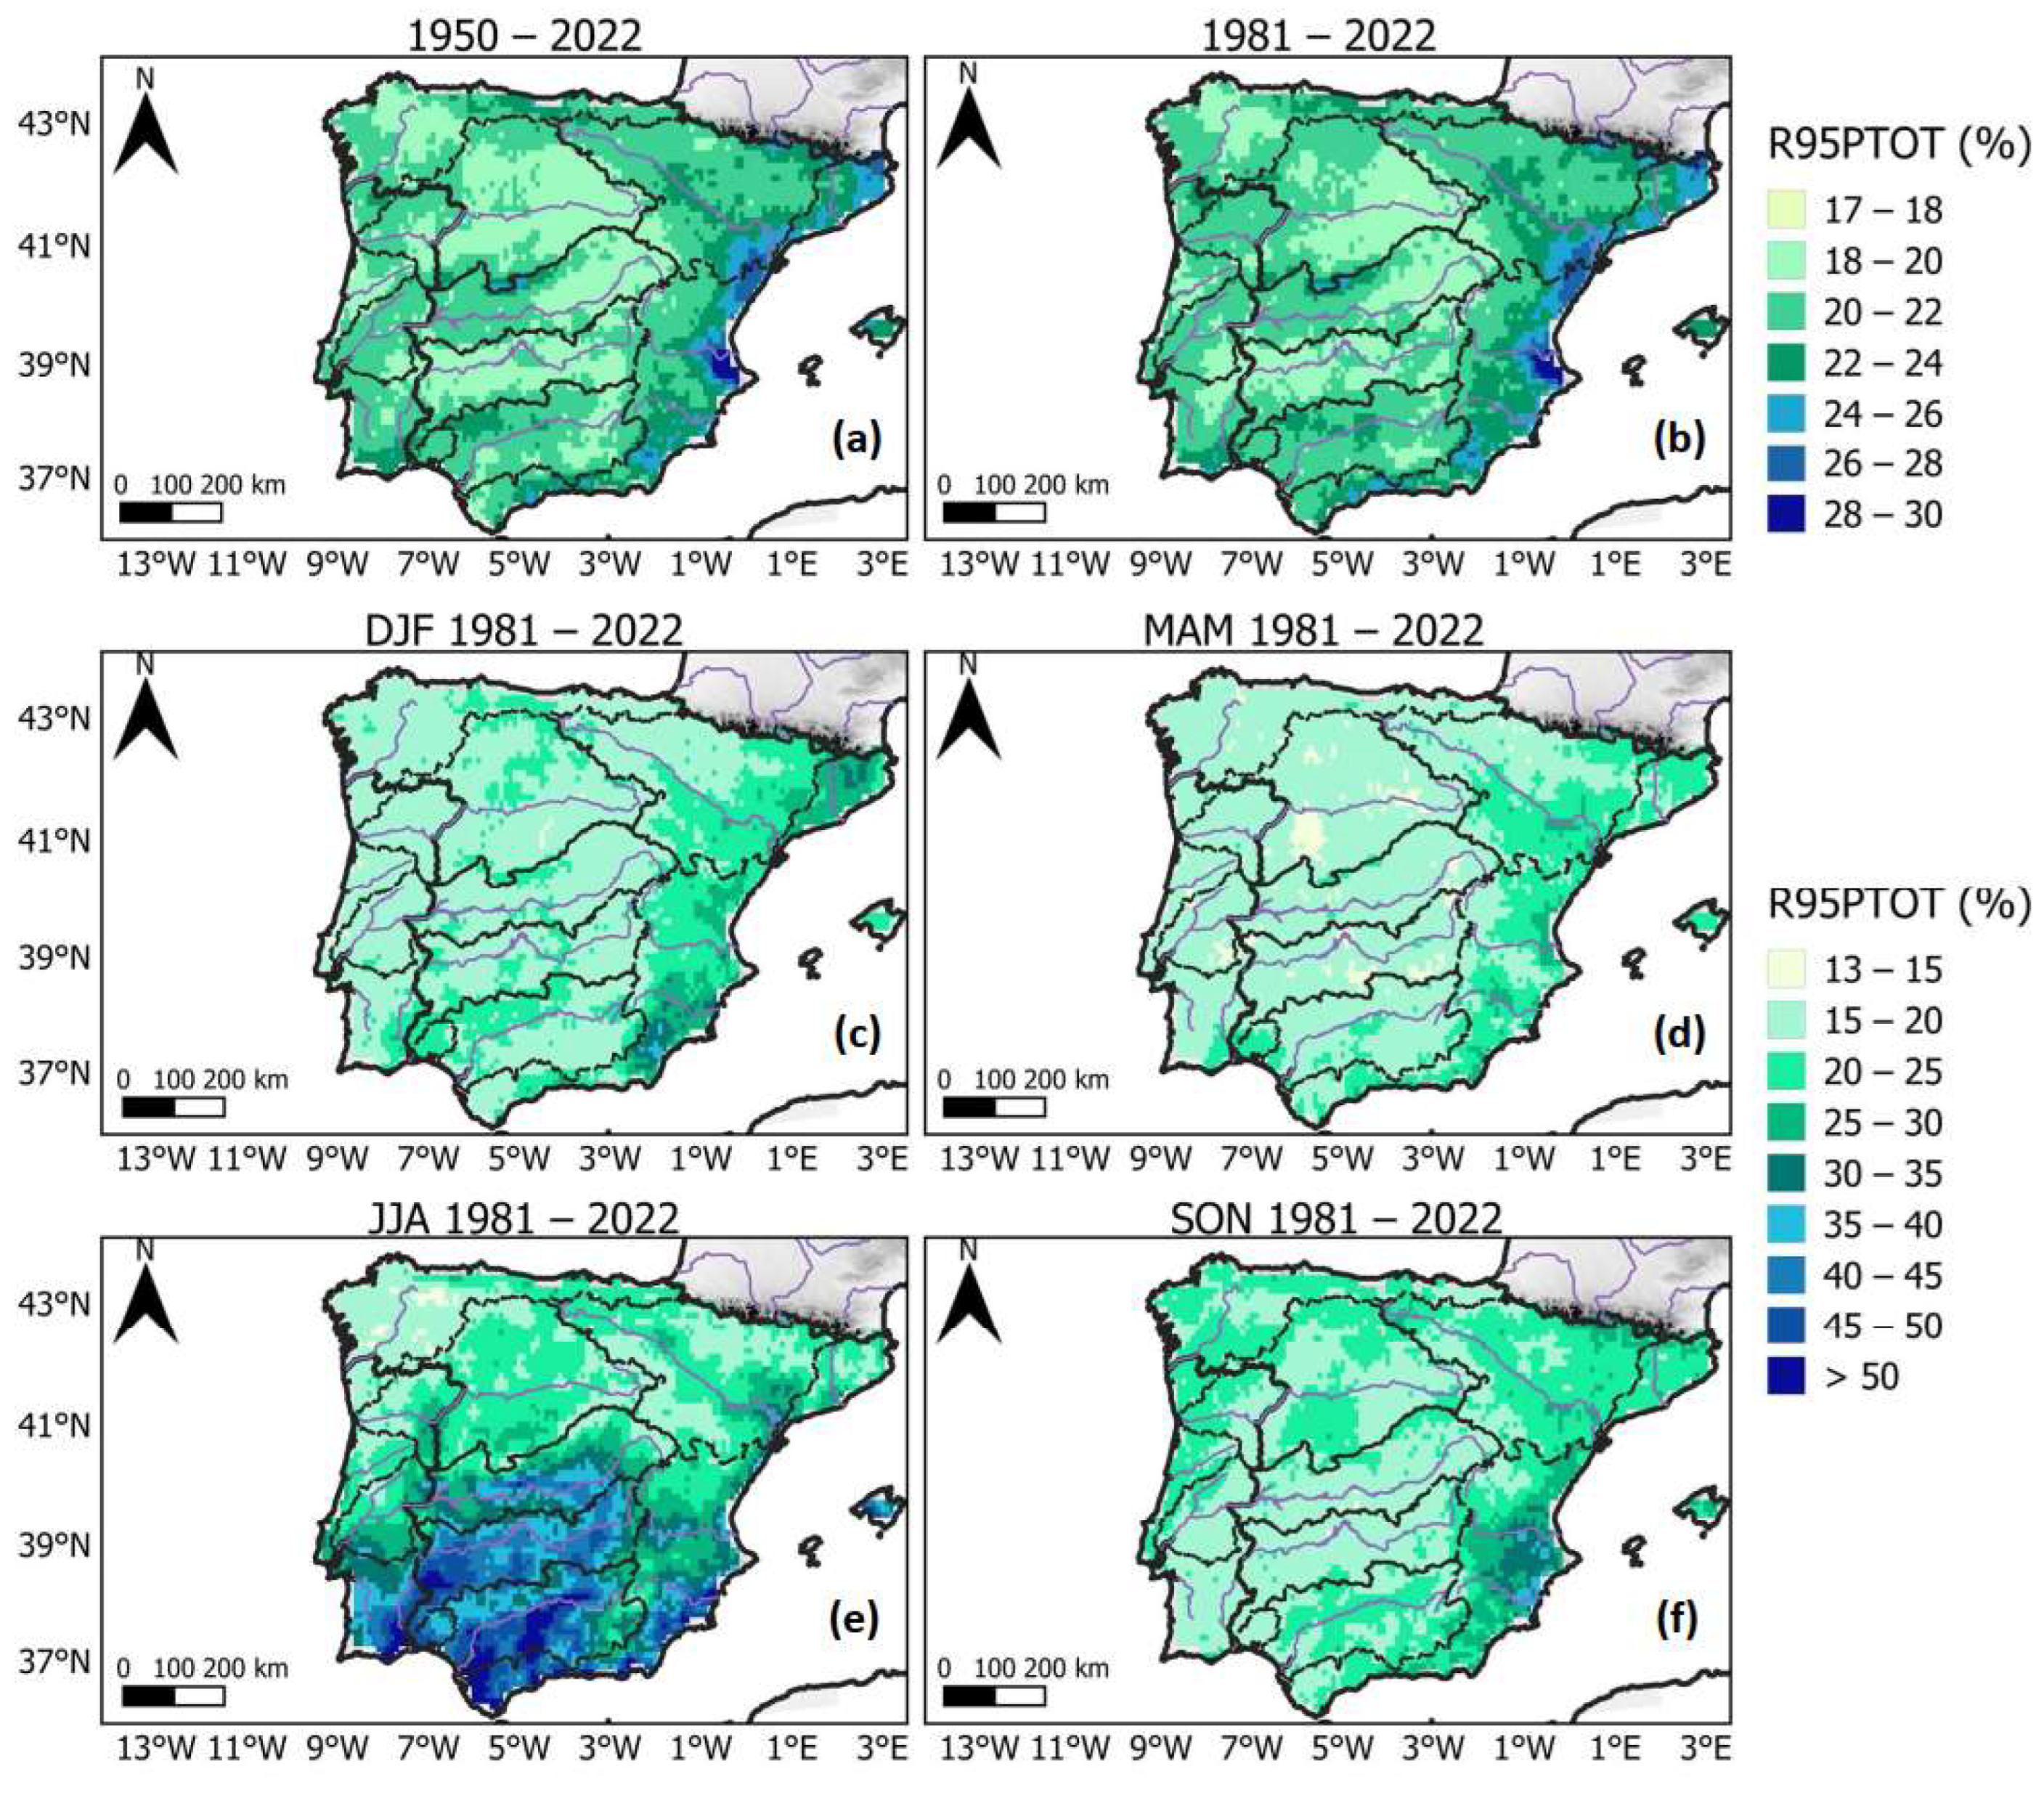
Regarding R95PTOT, Figure 4a shows that the highest R95PTOT percentages, with values between 24% and 28%, were found along the entire Mediterranean coast of the IP, but mainly in the central area. This means that over the last 73 years, approx. a quarter of the total annual precipitation in the IP’s Mediterranean coastal regions was associated with PEEs. For the remaining IP regions, the R95PTOT percentages were higher along the coastal and mountainous regions, and lower in the plateaus. The 1981–2022 period (Figure 4b) depicted similar results to the 1950–2022 period, but in some areas within northeast Portugal and northeast and southeast Spain, the R95PTOT percentages were up to 4% higher than in the 1950–2022 period. This could suggest an increase in the contribution of PEEs to the total annual precipitation over those regions throughout the study period. Seasonally, the winter and spring results also presented higher percentages in the eastern IP, with values mostly varying between 20% and 30%, but reaching 35 to 40% on the southeast coast between latitudes 37° N and 39° N. During autumn, the highest percentages were found approximately in the same eastern IP location of the winter peak values and reached up to 40%, thus being higher than in winter or spring. These high R95PTOT percentages in this region could be linked to strong cut-off lows, which according to Ferreira et al. [70], were the main producers of PEEs in this region, especially during autumn. Values of 20 to 25% were also found in almost all of northern, eastern, and southern Spain, and also along the northwest coast of Portugal. The highest R95PTOT percentages were found in summer, specifically in all the southern and south-central IP regions. Here, the values could reach 50% or more. Summer precipitation events in southern IP were rare, but when they occurred they tended to be associated with heavy rainfall episodes.
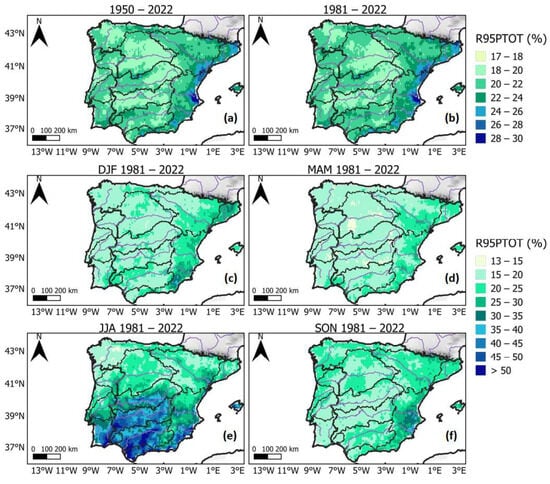
Figure 4.
(a,b) Fraction of the total annual, (c) winter, (d) spring, (e) summer, and (f) autumn precipitation above the 95th percentile (R95PTOT, %) during the 1950–2022 (a) and 1981–2022 (b–f) periods over the Iberian Peninsula.
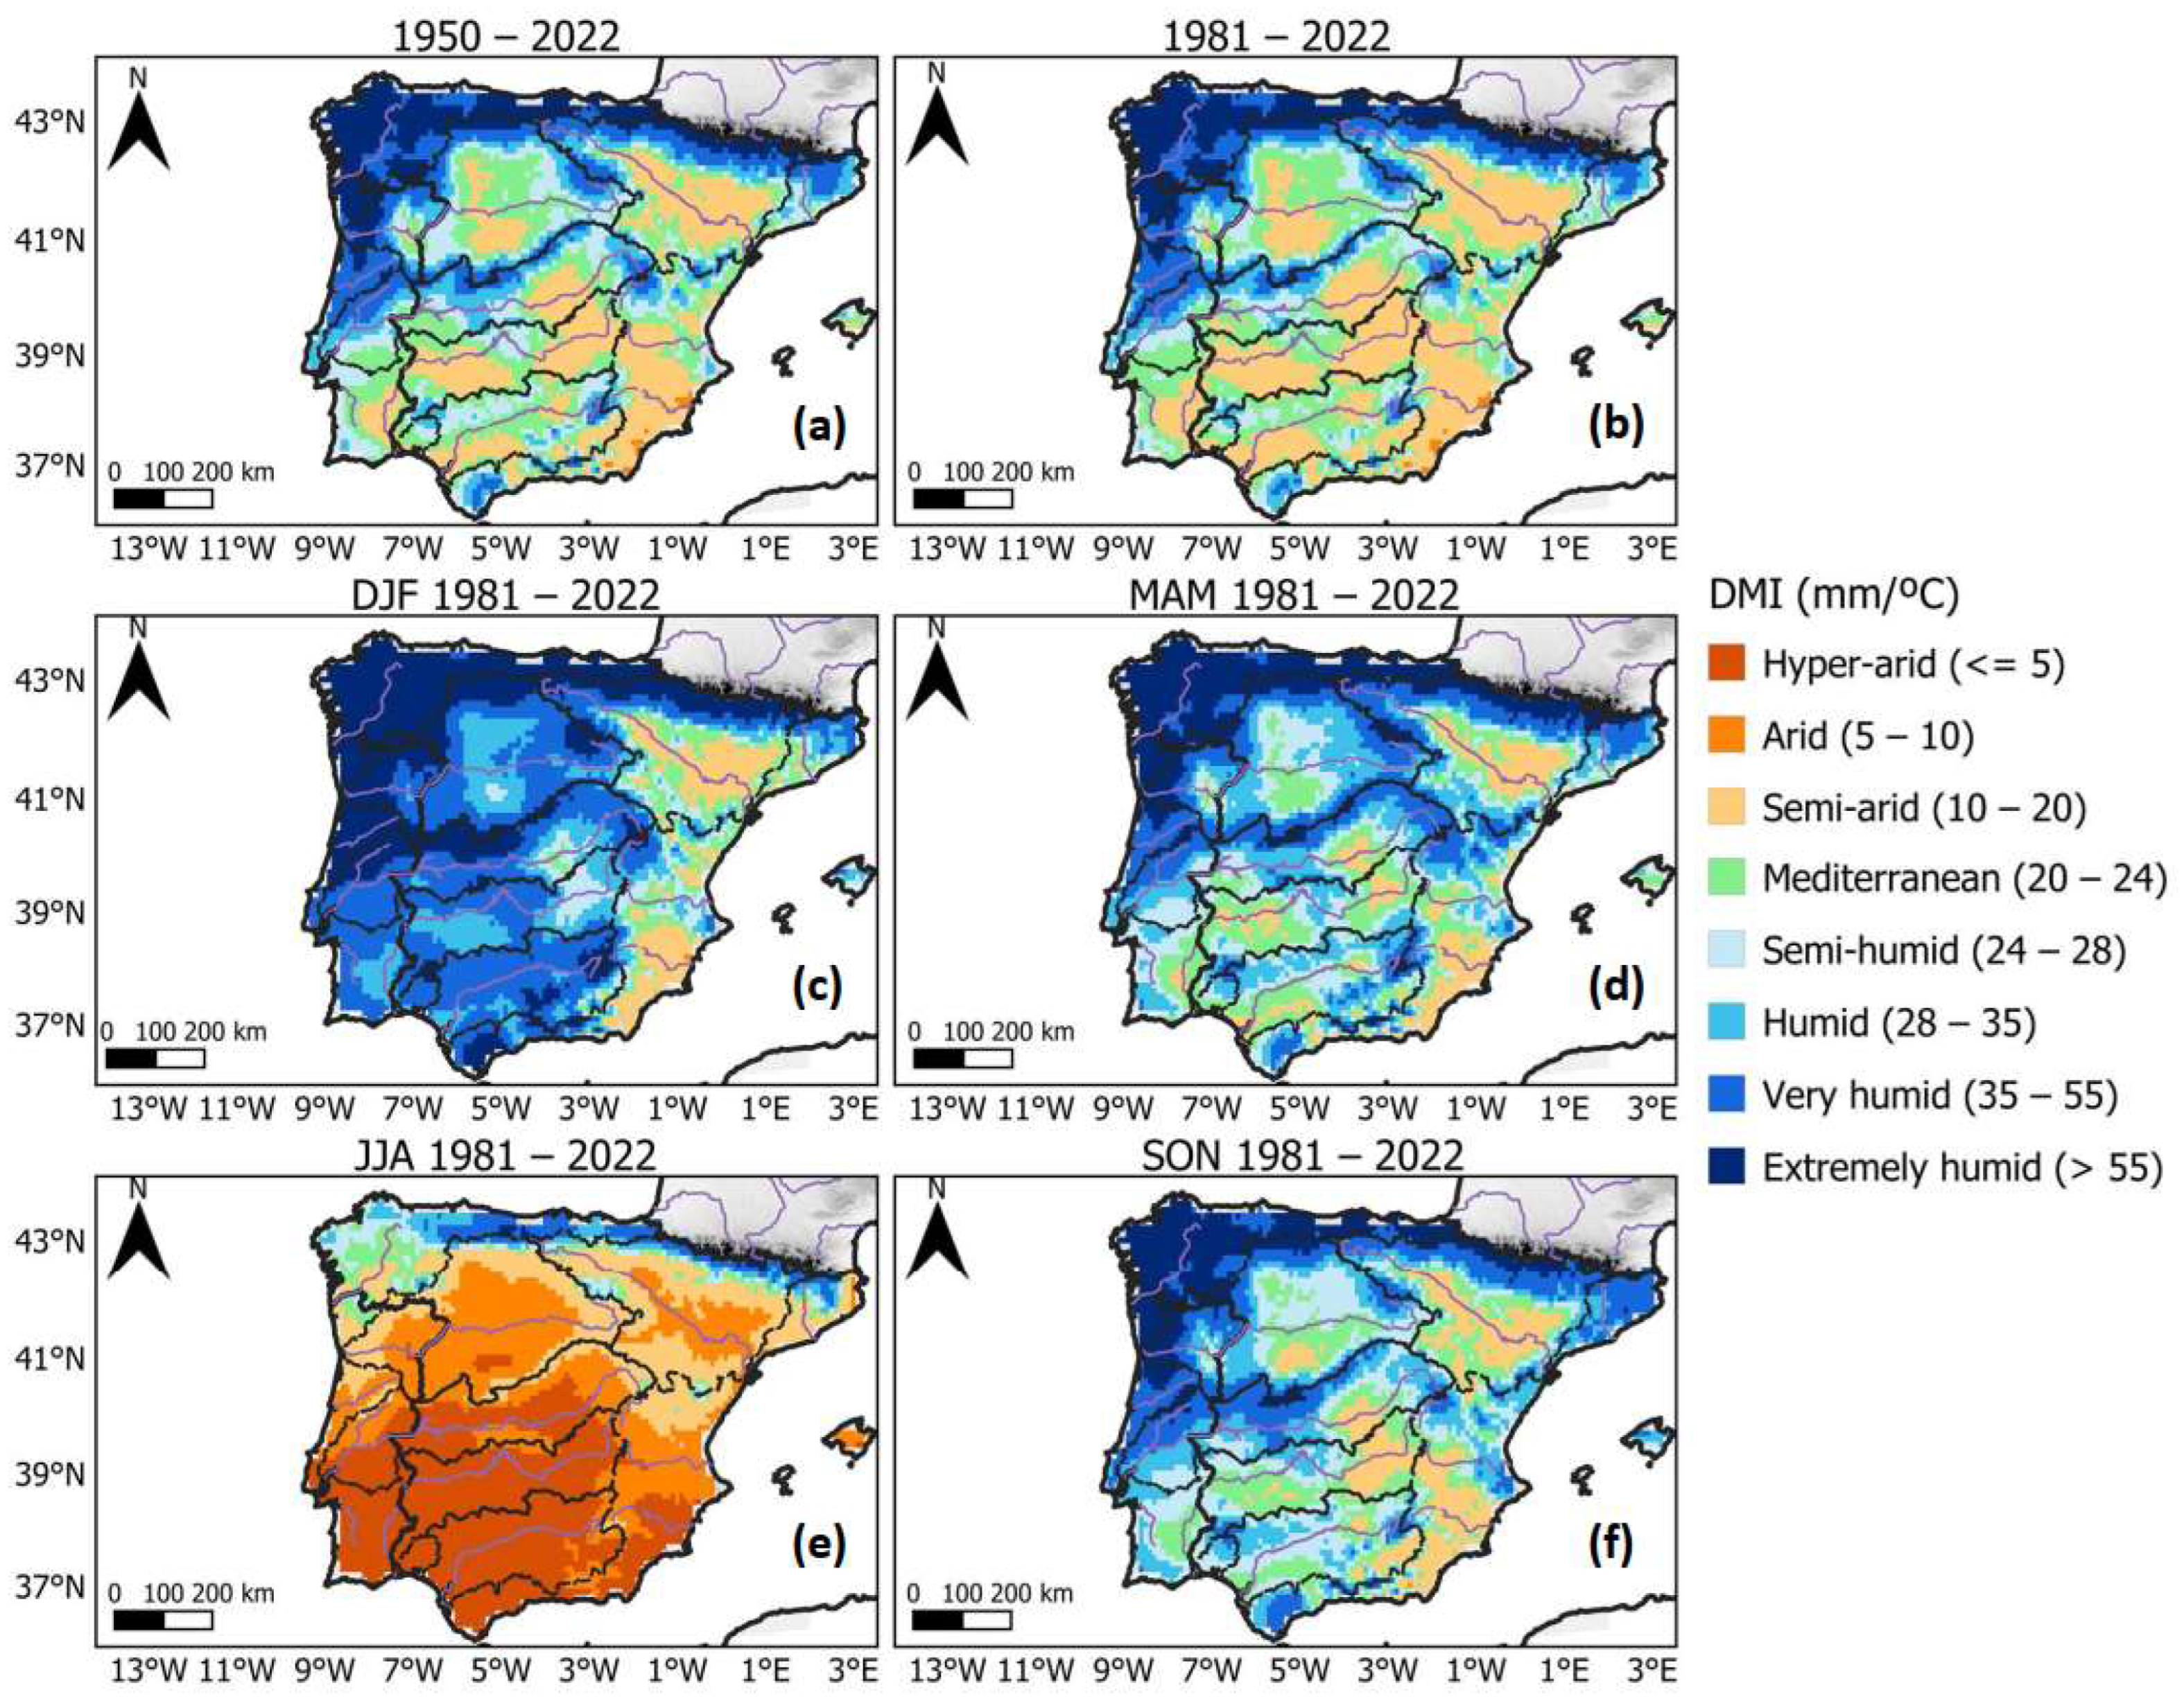
According to the climate classification categories mentioned in Section 2.3, the mean DMI values of 1950–2022 and 1981–2022 revealed that the higher altitude mountains and northern and northwestern IP regions were classified as “extremely humid” (Figure 5). In the mountains’ intermediate elevations, the climate was “semi-humid”, while it was predominantly “Mediterranean” or “semi-arid” in the plateaus. The driest areas, where the climate was classified as “arid”, were found on the southeastern coast between latitudes 37° N and 39° N. Seasonally, winter was the most humid season. The northern IP, northwestern IP, and the higher elevation locations within the Central, Iberian, and Baetic mountain systems were classified as “extremely humid”, while the northern and southern Mesetas (i.e., plateaus) were classified as “humid” to “very humid”. During the transitional seasons of spring and autumn, the aforementioned northern and mountainous regions also presented a “very humid” to “extremely humid” climate. However, the Meseta regions’ climate turned from “Mediterranean” to “humid”. Regarding the eastern plateau regions, during autumn, winter, and spring they always presented a “semi-arid” to “Mediterranean” climate. Summer was when the climate was more distinct, since the entire southern IP presented a “hyper-arid” to “arid” climate, while the inner northern IP climate was “arid” to “Mediterranean”. The most humid region during this season was the northern IP coast, which had a “semi-humid” to “very humid” climate.
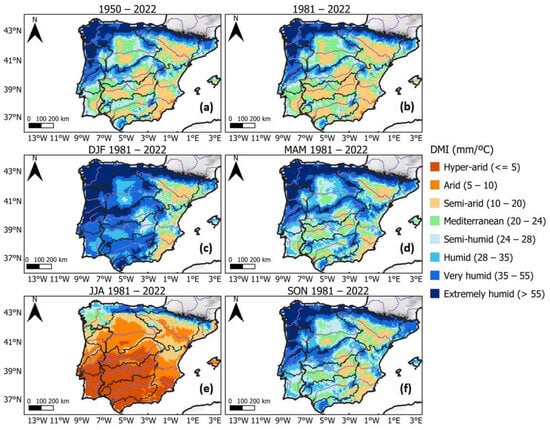
Figure 5.
(a) 1950–2022 annual, (b) 1981–2022 annual, and 1981–2022 (c) winter, (d) spring, (e) summer, and (f) autumn De Martonne index (DMI, mm/°C) over the Iberian Peninsula.
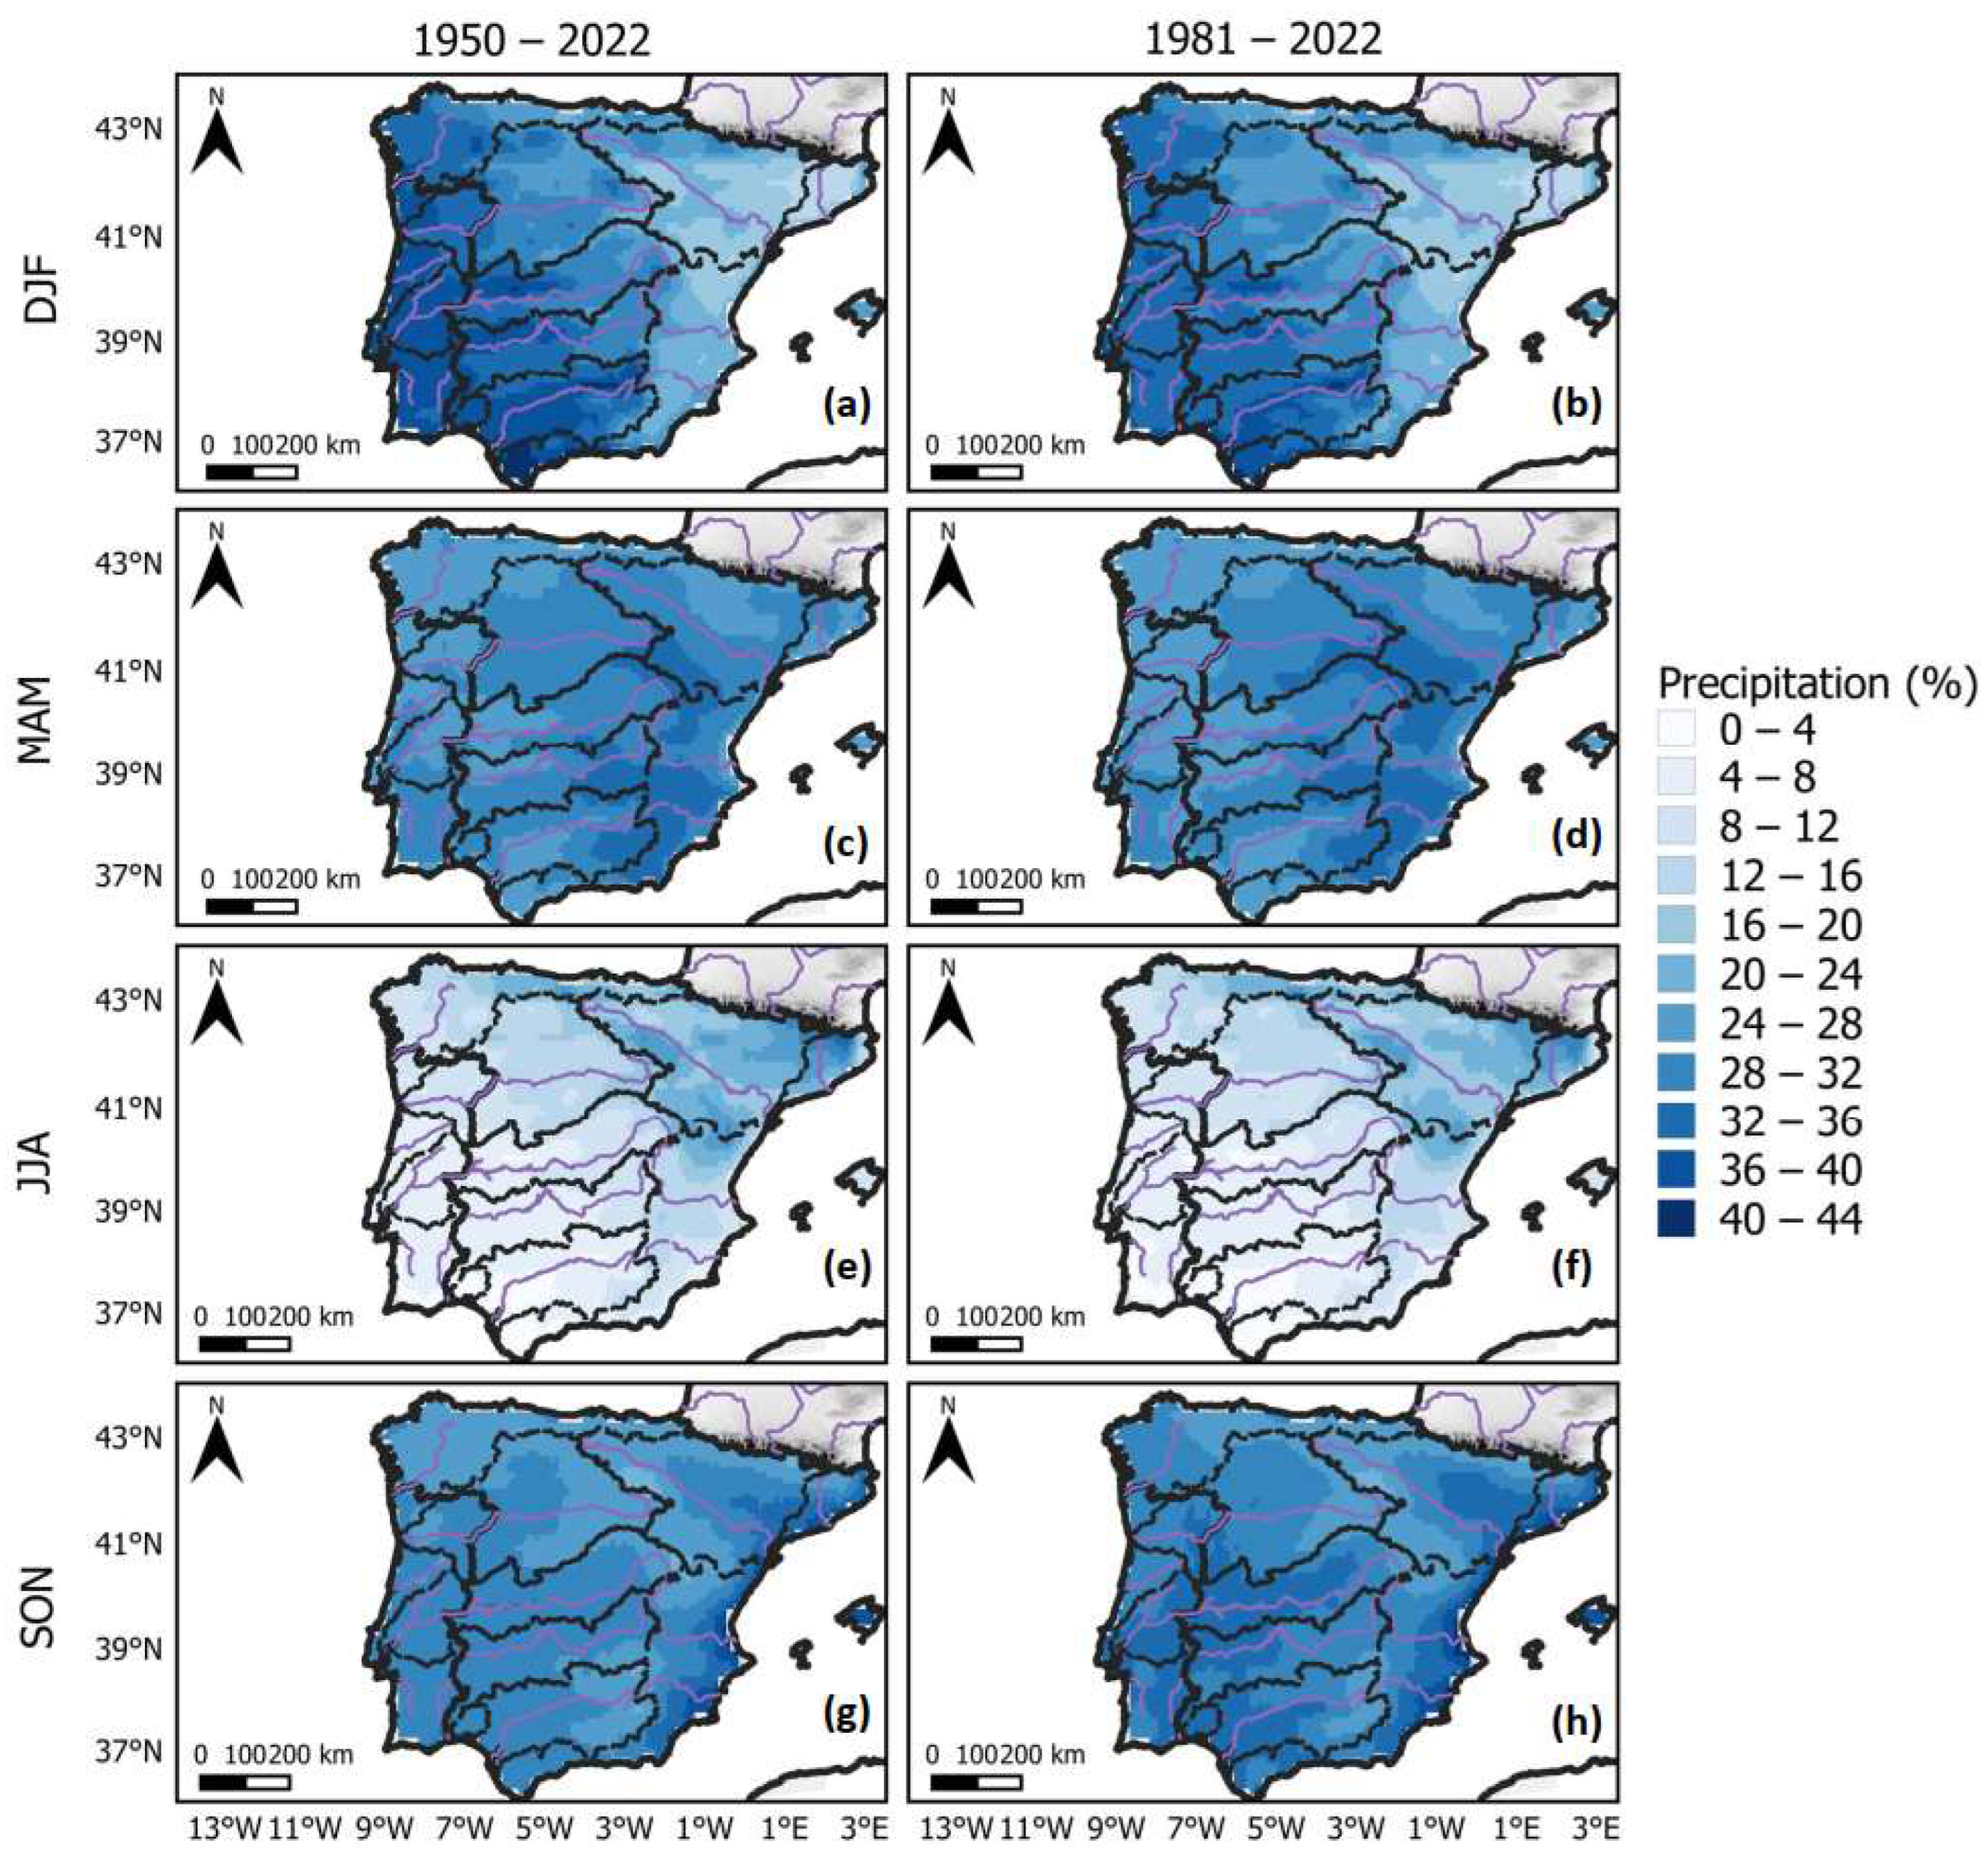
As for the seasonal contributions to the total annual precipitation (Figure 6), during 1950–2022 the major contributions were from winter precipitation over the southern and western IP and reached up to 44%. In this season, the precipitation contribution decreased from southwest to northeast, where the lowest values were 12 to 16%. This gradient was inverted in the summer, with the highest contributions being found in the northeast. In addition, since it was a season with few precipitation episodes, the ratios were much lower than in winter, varying from 0 to 12% in the IP’s southwestern half and from 12 to 32% in the IP’s northeastern half. This contrast between winter and summer can be justified by the climatological location of the Azores High (AH) throughout the year, as explained in Section 2.1. The southwestward displacement of the AH during winter made the western IP more exposed to the Atlantic low-pressure systems. Thus, the number of precipitation events was larger in this part of the IP. Then, in summer, as the AH was northwardly displaced, the northeastern IP was the most exposed region to sub-polar low-pressure systems, hence becoming the rainiest region at this time of the year. During spring and autumn, a west–east positive gradient was also found, with the highest contributions being in the east and southeast through spring, and along the eastern coast through autumn. Overall, the springtime ratios varied from 24 to 36%, while the autumntime ratios varied from 20 to 40%. In 1981–2022, the contribution patterns in each season were very similar to those in 1950–2022. The most noteworthy difference was the higher autumnal ratios in the majority of the IP, as compared to the same season in 1950–2022. This difference was more prominent over the central-west and southern IP, where the contribution to the annual precipitation varied between 32% and 36%.
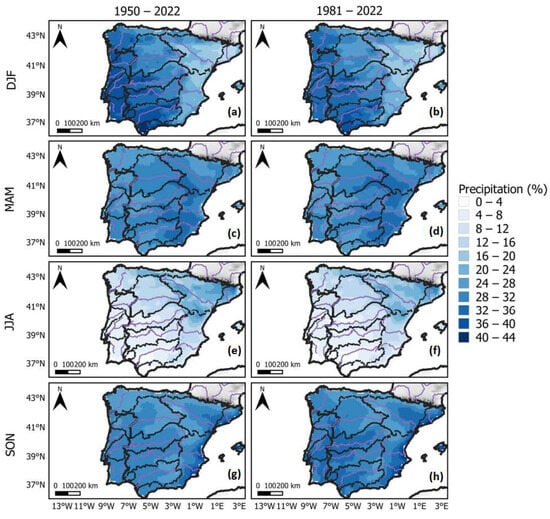
Figure 6.
Winter (a,b), spring (c,d), summer (e,f), and autumn (g,h) mean contributions to the total annual precipitation (%) over the Iberian Peninsula during the 1950–2022 (a,c,e,g) and 1981–2022 (b,d,f,h) periods.
3.2. Trend Detection and Analysis
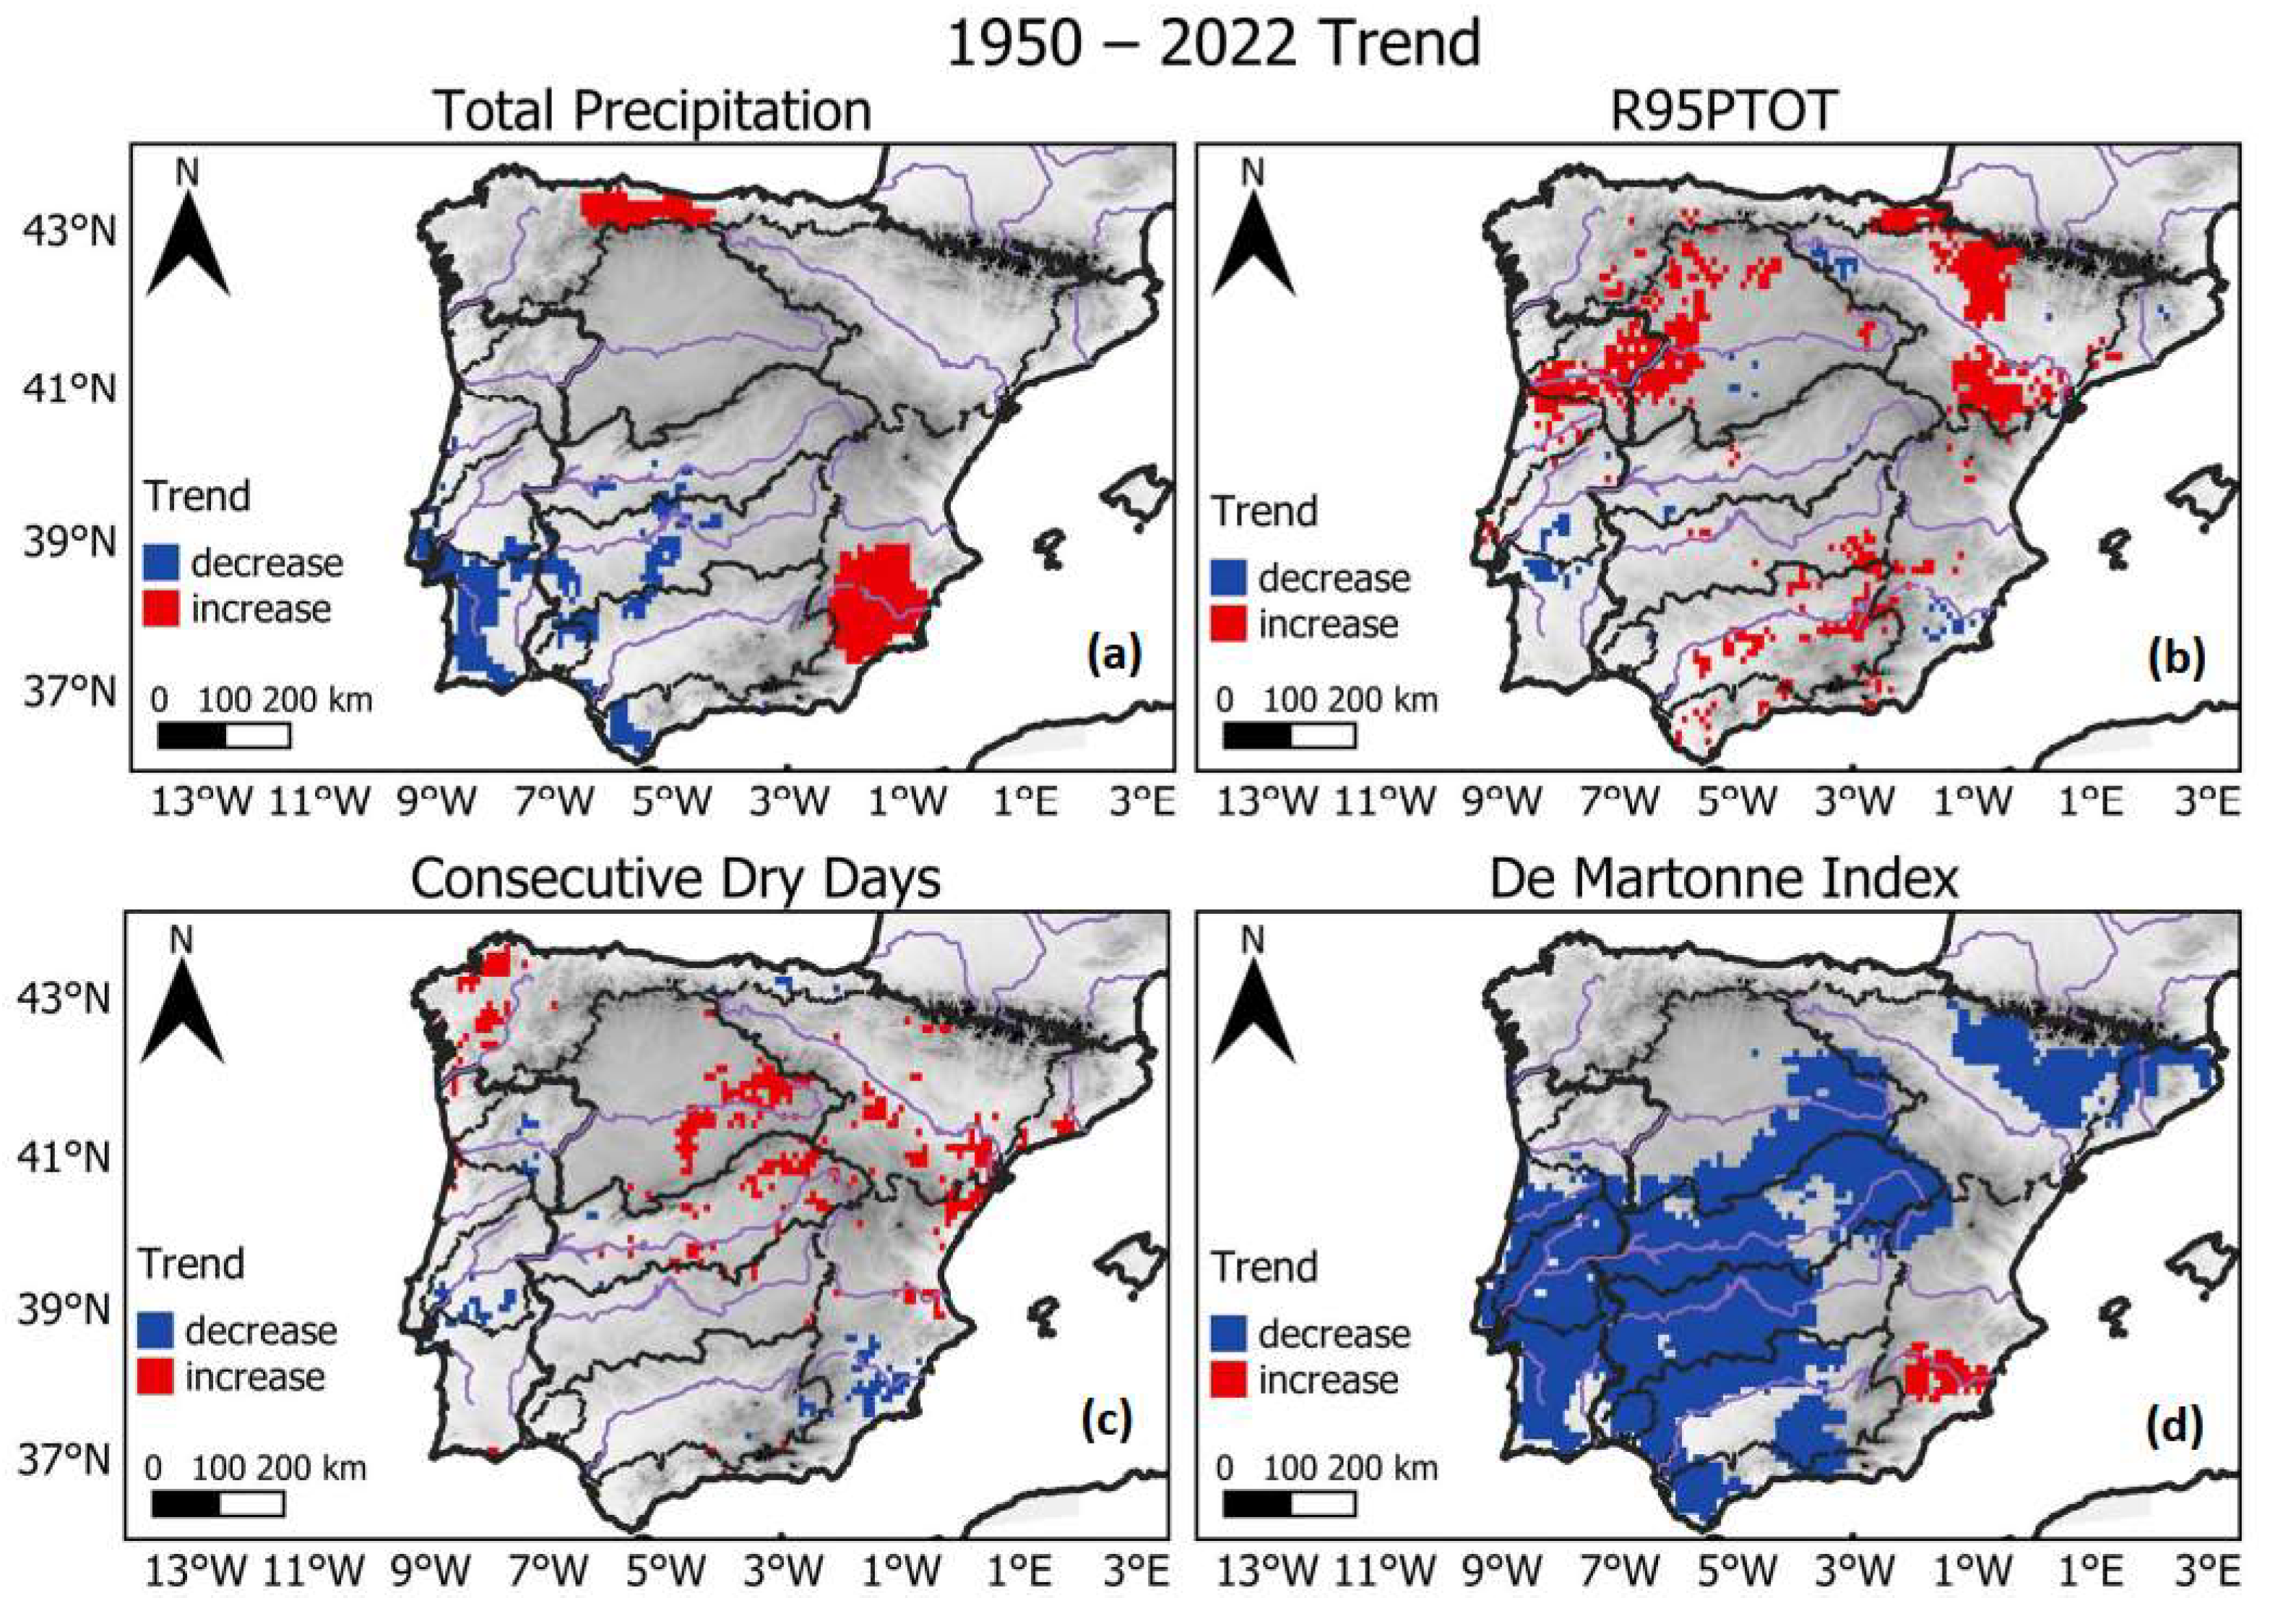
Concerning the 1950–2022 trends of the main precipitation and aridity indices used in this research (Figure 7), the total annual precipitation increased in the northern IP (between longitudes 6° W and 4° W) and southeastern IP (between latitudes 37° N and 39° N), and decreased along the south and southwest coasts, as well as in some southern inner locations. The R95PTOT index revealed an increase in various locations, as evidenced by the comparison between Figure 4a,b. The largest areas with this trend were located in the northeastern and northwestern IP, revealing that the total annual precipitation in these locations was increasingly due to PEEs. The CDD revealed an increase in the northwestern IP and several east and central regions, thus showing that the periods without precipitation were becoming longer in these locations. The DMI predominantly decreased over the entire southwest IP, as well as over the central and northeast IP, but also increased over a southeast area between 38° N and 39° N. Therefore, the southwestern and northeastern IP are becoming drier, whereas part of southeastern IP is becoming wetter.

Figure 7.
1950–2022 annual (a) total precipitation, (b) R95PTOT, (c) CDD, and (d) DMI indices’ trend at a 5% significance level over the Iberian Peninsula.
Figure 8 and Figure 9 represent the trends of the same indices as those shown in Figure 7 during the same period, but for winter and summer, respectively. Although the trend calculation of the extreme precipitation and aridity indices was undertaken for all the seasons, only the results of the winter and summer are presented henceforth, since the spring and autumn trends were significantly weaker (Supplementary Materials; Figures S8 and S9). Succinctly, the 1950–2022 spring trends mainly showed a decrease in the total precipitation over northern Portugal and a decrease in the DMI (therefore, a drier climate) over most of the western IP. The 1950–2022 autumn trends showed an increase in the total precipitation in the Douro River Valley (northeastern Portugal–Spain border) and an increase in the total precipitation and R95PTOT along the northern coast. Comparative to the annual trends, the extreme precipitation and aridity indices for winter and summer revealed larger areas with trends. For winter, the total precipitation and DMI decreases occurred over most of the southern and central IP, and also in the extreme northeast for the DMI. On the contrary, for R95PTOT and CDD, there was an increasing trend along the south and southeast, and also in several north and northwest regions for R95PTOT. Overall, these trends showed that during winter the IP became drier in the southern, central, and northeastern regions, with increasingly long dry periods along the south and southeast, which was accompanied by higher shares of PEEs to the total precipitation around most of the coastal IP regions. For summer, there was also a decrease in the total precipitation and DMI over the southwest and northeast IP, and an increase in R95PTOT mostly over the northeast and central regions. For CDD, narrower areas showed significant trends. The number of areas with decreasing trends, which were mostly over Portugal and the southeast IP, was approximately the same as the number of areas with increasing trends, which were mostly over the northeast and central IP, thus hinting at a high spatial heterogeneity.
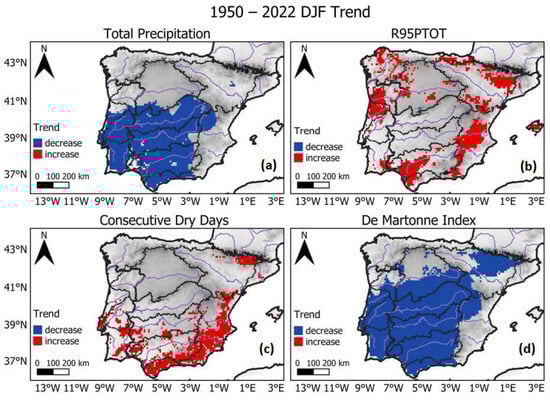
Figure 8.
1950–2022 winter (a) total precipitation, (b) R95PTOT, (c) CDD, and (d) DMI indices’ trend at a 5% significance level over the Iberian Peninsula.
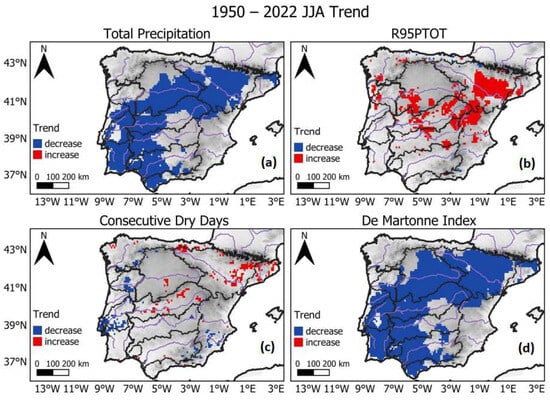
Figure 9.
1950–2022 summer (a) total precipitation, (b) R95PTOT, (c) CDD and (d) DMI indices’ trend at a 5% significance level over the Iberian Peninsula.
3.3. Extreme Precipitation Susceptibility Index (EPSI) and Principal Component Analysis (PCA)
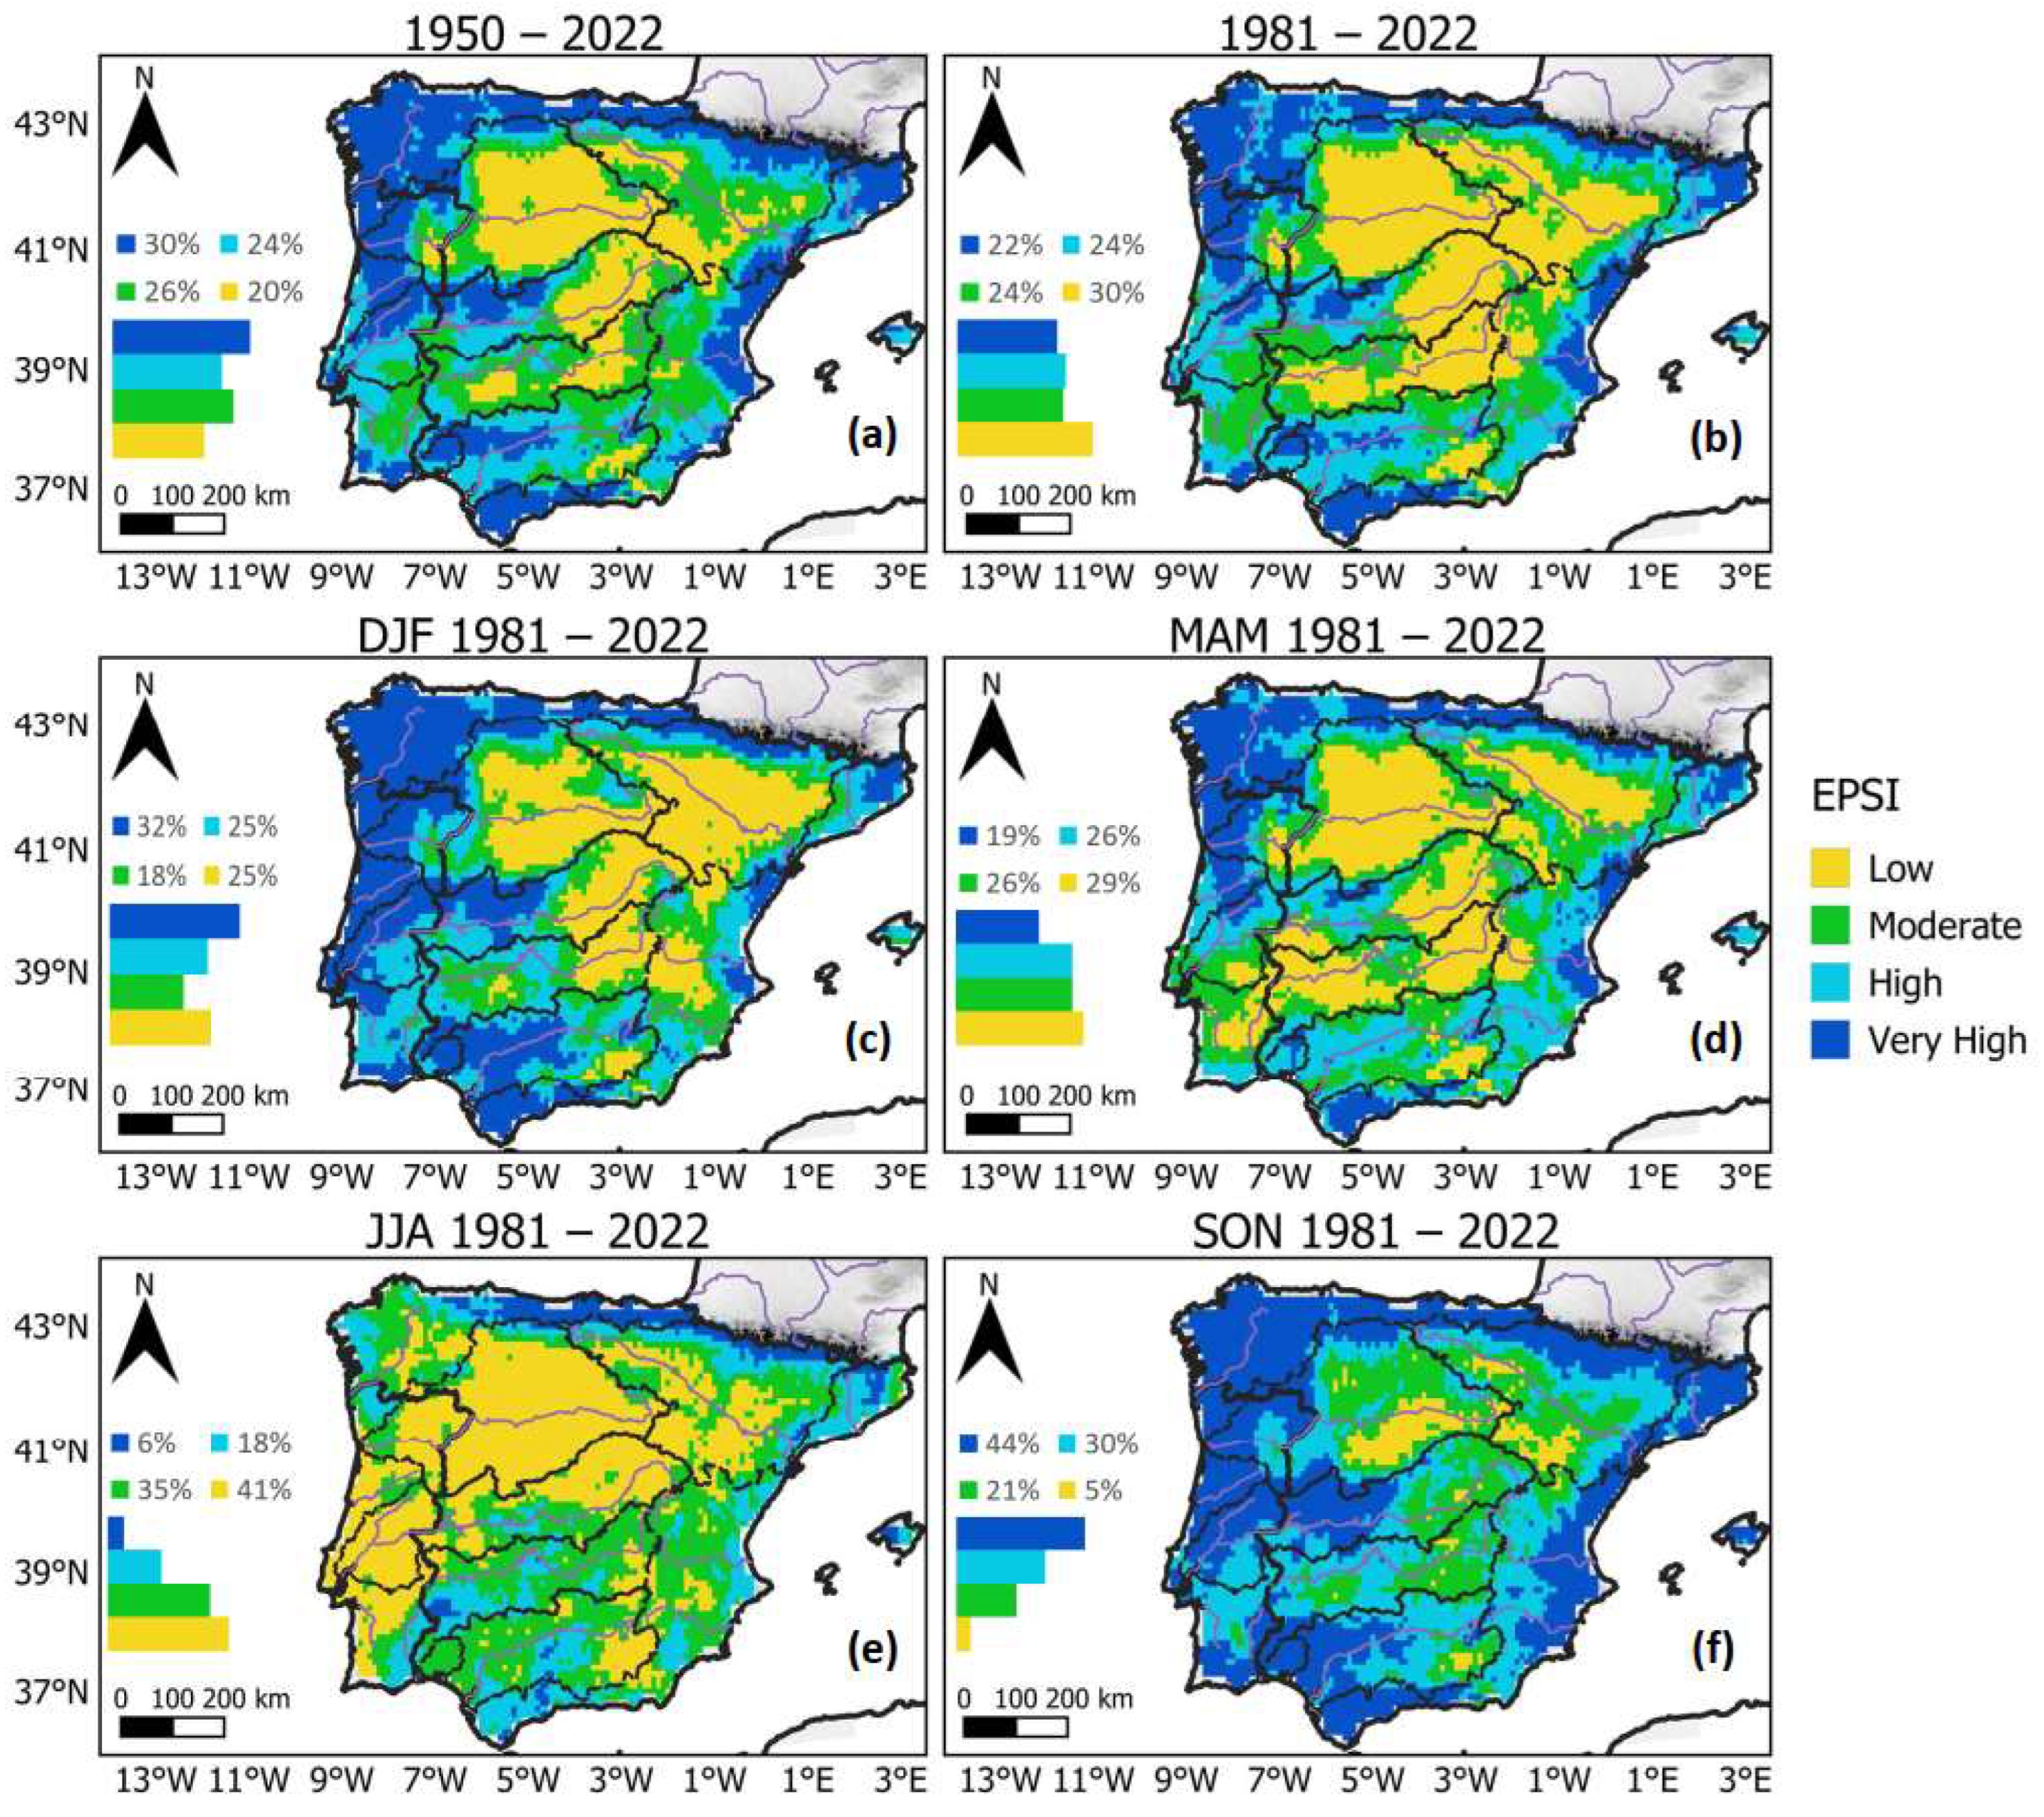
As shown in Figure 10, the 1950–2022 EPSI results revealed a very high susceptibility to PEEs in the northern and northwestern IP, Central and Baetic Systems, and eastern IP coast. The remaining IP presented a low susceptibility in the plateaus and a moderate to high susceptibility in between the mountains and the plateaus, as well as in the southeastern and southwestern coastal regions. The high and very high susceptibility areas corresponded, respectively, to 24% and 30% of the territory, meaning that most of the IP (54%) was highly susceptible to PEEs. During 1981–2022, the susceptibility appeared to decrease relative to 1950–2022, since 54% of the IP presented a low to moderate susceptibility.

Figure 10.
(a) 1950–2022 annual, (b) 1981–2022 annual, and 1981–2022 (c) winter, (d) spring, (e) summer, and (f) autumn extreme precipitation susceptibility index (EPSI) over the Iberian Peninsula (IP). The bar charts represent the IP area within each class.
On a seasonal scale, the autumn and winter results revealed a susceptibility pattern similar to the annual results. Autumn was the season where the susceptibility was higher, with 30% and 44% of the territory having a high and very high susceptibility, respectively. The very high susceptibility areas encompassed almost all the IP coastal regions and the Central System, while most of the low to moderate susceptibility areas were located within the plateaus. These lower susceptibility areas became larger during winter. Progressing from winter to spring, susceptibility decreased in the north, south, southwest, and Central System, but increased in the eastern regions. Nevertheless, the IP PEE susceptibility was mostly low to moderate during spring. This was also true during summer, when 76% of the territory had a low to moderate susceptibility and the only regions with a very high susceptibility were the northern IP coast and two small areas in the southern IP.
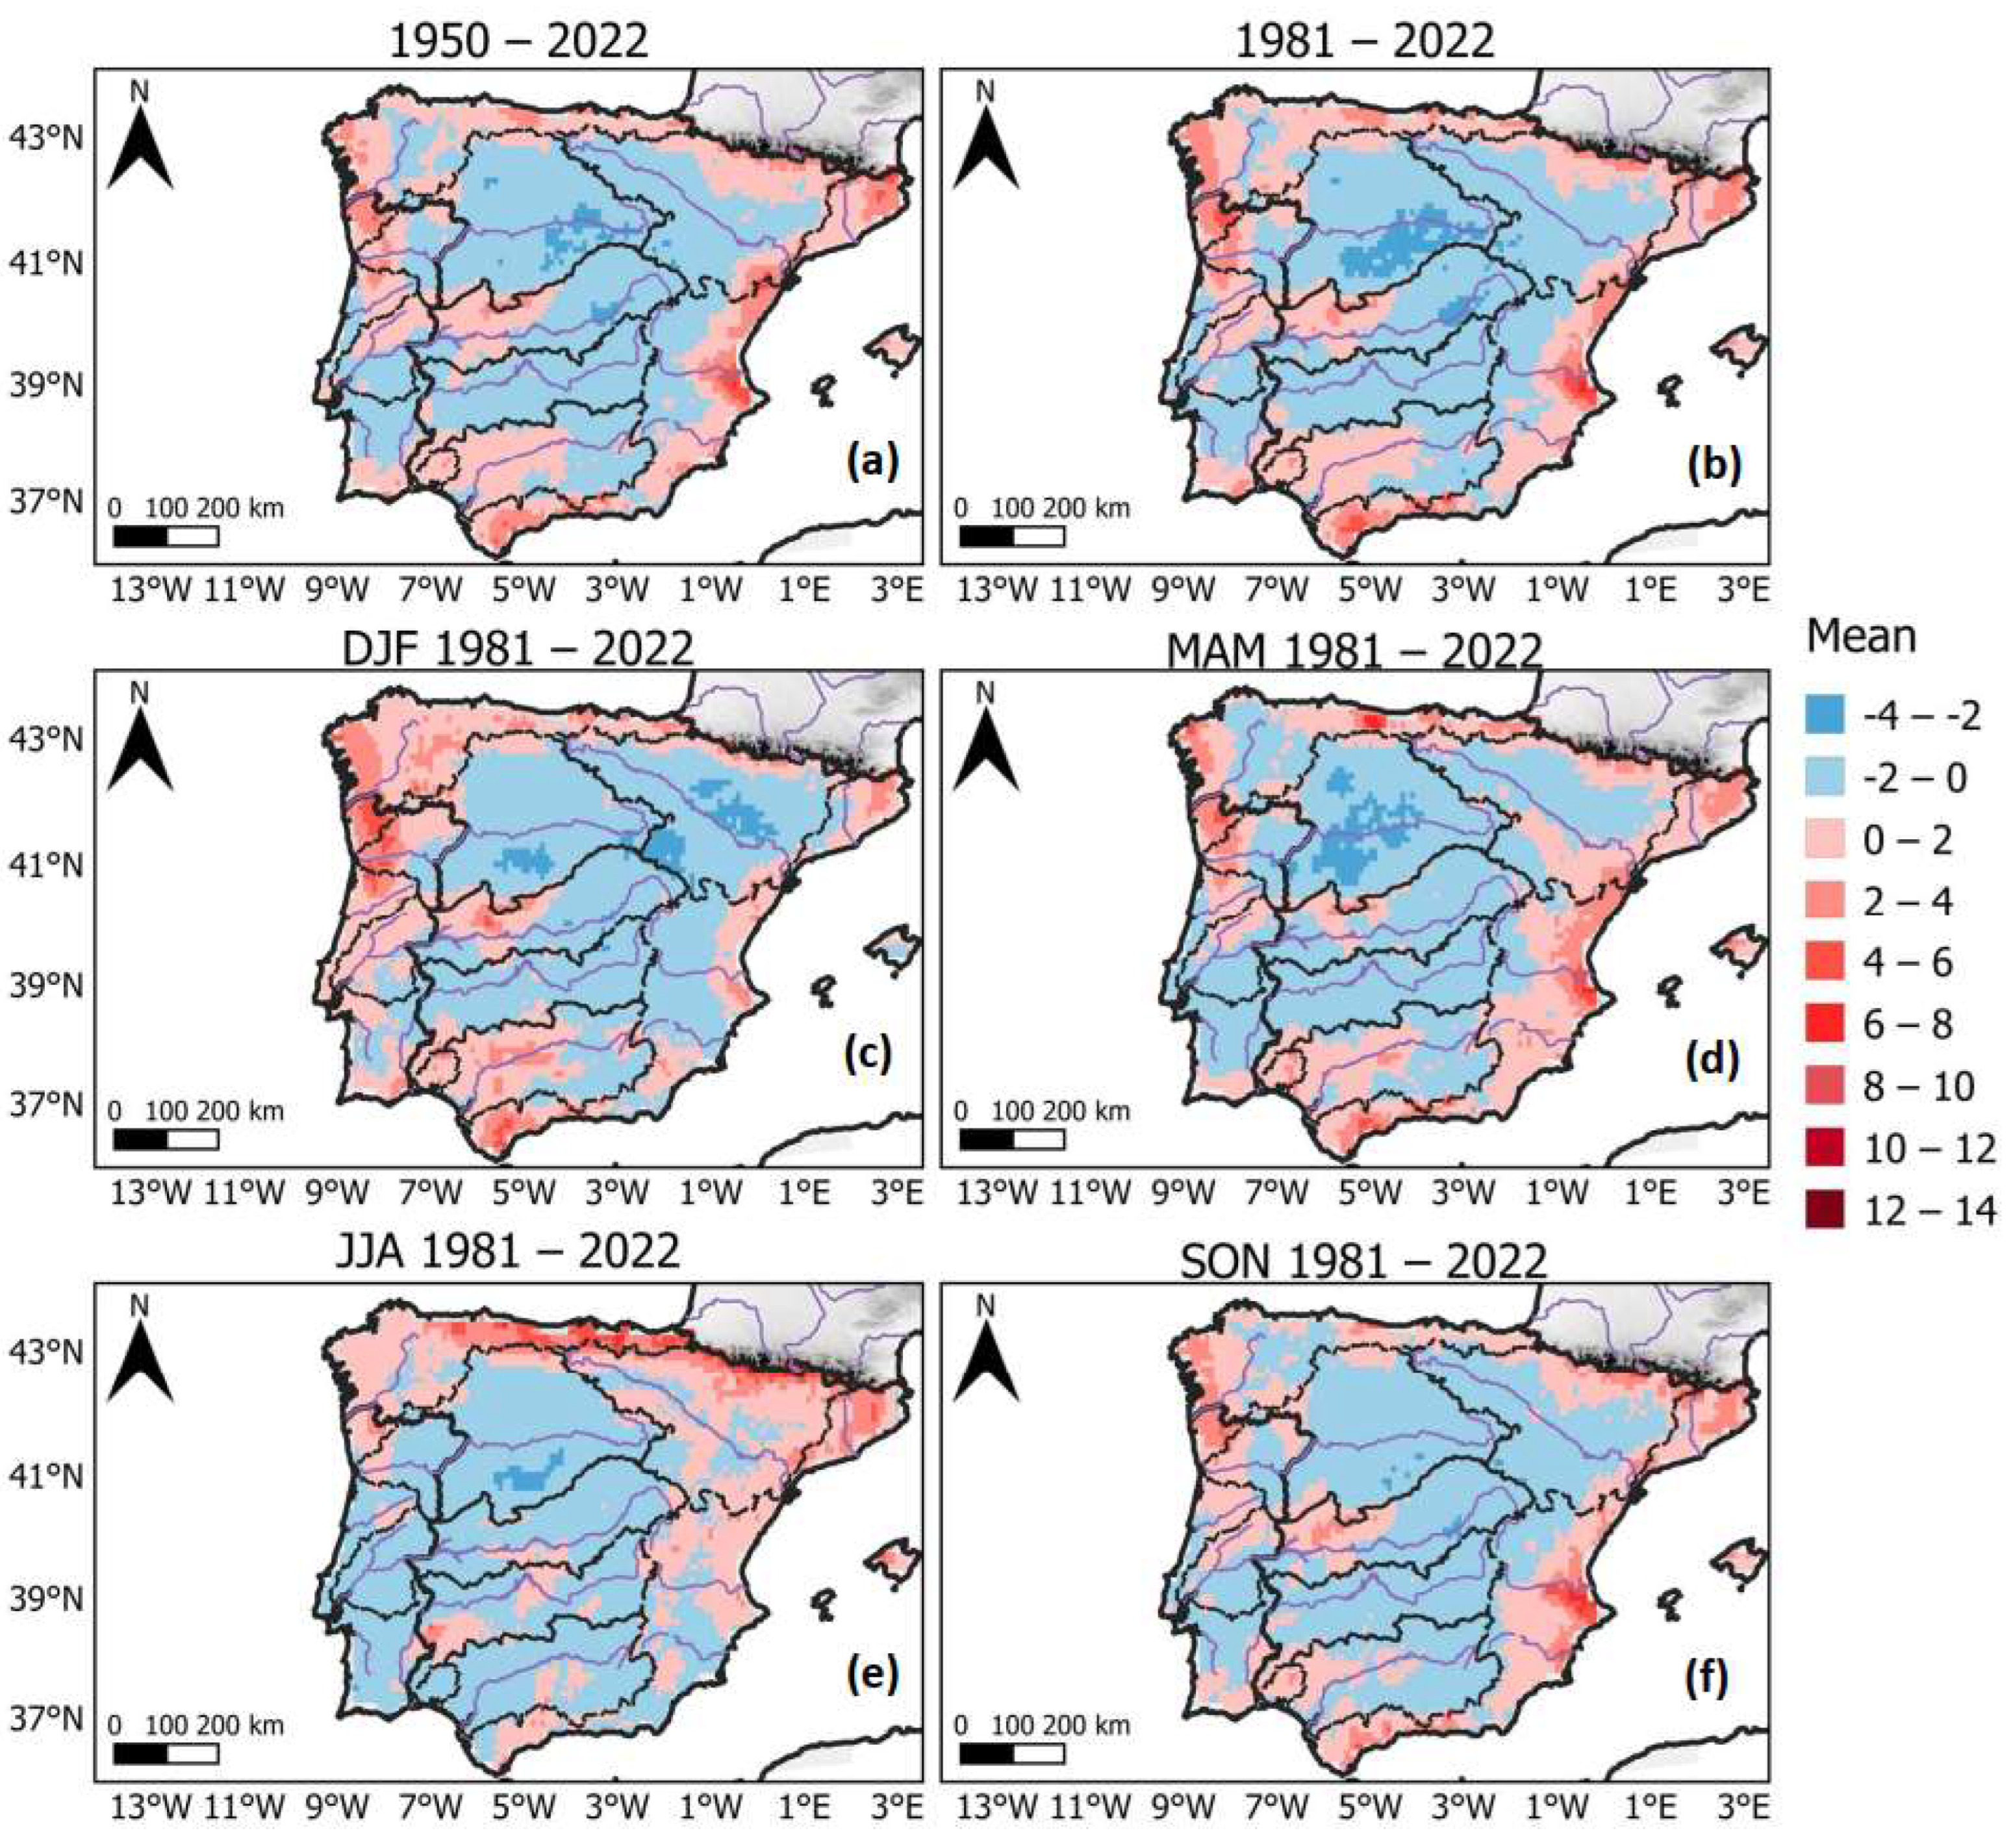
The results of the compound index based on the PCA’s two leading principal components are presented in Figure 11. The Supplementary Materials show the additional results of each principal component (Figures S10 and S11). The values in red (blue) were associated with higher (lower) values of the first (PC1) and second (PC2) principal components’ weighted mean, and thus with generally higher (lower) values of the extreme precipitation indices included in the PCA. Hence, a region with heavier red colours was where higher values of the indices were detected, i.e., with a higher susceptibility to PEEs. The opposite occurred for blue colours. Overall, the results showed that PEEs mostly occurred near the coast and around the IP mountain regions, and less often in the inner plateaus, which was already highlighted in each extreme precipitation index analysis, though these outcomes were more comprehensively reflected in the compound indices (EPSI and PCA-based index). The general shape of the annual pattern could also be seen at the seasonal level, along with the seasonal variation, such as a more pronounced impact of the PEEs in the northern IP during summer, in the southeastern IP during autumn, or in the northwestern IP during winter; and a reduced impact of PEEs in the southwestern IP during summer when compared with the remaining seasons. Another important finding was that most locations with a higher susceptibility in the EPSI analysis overlapped with the PCA analysis, thus showing that the EPSI could successfully identify the IP’s susceptibility to extreme precipitation. The high agreement between the EPSI and the compound index based on the PCA (itself based on the spatial correlation coefficients of the major extreme precipitation indices used in this research) hinted at the robustness of our approach for identifying the most susceptible regions in the IP to PEEs.

Figure 11.
(a) 1950–2022 annual, (b) 1981–2022 annual, and 1981–2022 (c) winter, (d) spring, (e) summer, and (f) autumn weighted mean of the major precipitation indices’ first (PC1) and second (PC2) principal components over the Iberian Peninsula.
4. Discussion and Conclusions
The goal of this study was to conduct a thorough analysis of the historical extreme precipitation and aridity conditions in the IP region using state-of-the-art daily precipitation and 2-metre air temperature historical data. For this purpose, the new ERA5-Land reanalysis dataset, with its spatial resolution of ~9 km and a period from 1950 until 2022, was used. To have the best possible precipitation and 2-metre temperature datasets from the IP, the ERA5-Land data were improved by bias correcting it with the Iberia01 observation dataset, which had a spatial resolution of 0.1° latitude × 0.1° longitude and spanned a period from 1971 until 2015. The spatial details of the results shown in Figure 2 highlighted that the bias correction of the ERA5-Land data rendered realistic high-resolution precipitation and 2-metre temperature patterns over the selected period (1950–2022), and thus was a good basis for our assessment of the IP aridity and PEEs contribution to the total precipitation, as well as their evolution through the last decades and the susceptibility of the different IP regions to PEEs.
The results showed that, annually, the plateau regions of the IP had mostly a Mediterranean to semi-arid climate, while the climate became more humid as it moved towards the mountain regions, eventually being classified as very humid at the top of the central and southern IP mountain systems, or extremely humid in almost all the northern and northwestern regions. Seasonally, the climate was quite similar to the annual climate during winter and the transitional seasons. However, during summer it was quite different since it became hyper-arid to arid in most of the IP, with the exception of the northern coast. This seems to be related to the long CDD periods shown in Figure 3. Furthermore, the trend analysis with the Mann-Kendall non-parametric test through 1950–2022 revealed an annual and seasonal drying of the climate in most of the southwest, central, and northeast IP, or an annual wetting of the southeast climate, respectively, associated with a decrease or an increase in the total precipitation in these regions. These results were in line with the south and central IP drying trends stated by Refs. [11,12]. Considering the geographical locations, the western–northeastern decrease and southeastern increase in the total precipitation from which the drying and wetting trends arose could be associated, respectively, with the decrease in the PEEs’ intensity, frequency, and duration above most of Spain, and with the increase in the PEEs’ frequency and duration above eastern Spain revealed by Serrano-Notivoli et al. [26]. Another result of the IP’s aridity evaluation was the increase in the winter CDD period duration over the eastern and southeastern coasts. This could be related to the decrease in the frequency of low-precipitation events reported by Eiras-Barca et al. [24] over eastern Spain and the increase in winter PEE occurrences reported by Llasat et al. [27] over southeastern Spain, which seemed to indicate that winter precipitation was increasingly due to PEEs, while light to moderate precipitation events were scarcer.
As for the PEEs’ contribution to the total annual precipitation, the R95PTOT index revealed it was higher in the coastal and mountain regions, particularly on the IP’s eastern coast, where circa a quarter of the total annual precipitation was due to PEEs. The PEEs’ contribution was also higher along the eastern coast during autumn, winter, and spring, but during summer it was the southern half of the IP that was most affected by PEEs since their contribution reached 50% or more of the total seasonal precipitation in this area. Throughout the study period, trend analysis tests showed that the PEEs’ contribution to the total precipitation increased annually over northeast Portugal, and northeast and southeast Spain. Again, these results showed an agreement with the conclusions of Serrano-Notivoli et al. [26] and Llasat et al. [27]. Seasonally, there were also increases over almost all the IP coastal regions during winter; over several northeastern, central, and northwestern IP regions during summer; and along the northern Portuguese coast during autumn. This autumnal increase in R95PTOT could be related to an increase in the total precipitation and the PEE frequency stated by Refs. [30,31,32].
The comparison between the EPSI and PCA-based compound indices has proved that the EPSI can successfully identify a region’s susceptibility to extreme precipitation in the IP, thus showing the robustness of this approach. Regarding the susceptibility of the IP to PEEs, most of the high susceptibility locations, which amounted to circa 50% of the IP, had in common the fact that they were on the Atlantic/Mediterranean-facing side of mountain ranges. These locations are the most exposed to moist airflows coming from the Atlantic Ocean or the Mediterranean Sea, mainly driven by synoptic-scale or mesoscale low-pressure systems that interact with the mountain ranges through orographic lift, thus leading to precipitation on the mountain’s windward side. This not only explains their high susceptibility to PEEs but also the low susceptibility in the plateau and flat terrain regions, since the surrounding mountains act as barriers to the moist air (condensation barrier effect). In the main high susceptibility locations, moist airflows interacting with mountains are generally owed to: extratropical systems travelling near the coast during autumn and winter in the northwest IP; strong northerly wind components over the Cantabrian mountain range in the northern IP; Mediterranean mesoscale systems nearby the coast in the eastern IP, mainly during autumn; and westerly winds originated by low-pressure systems during autumn, winter, and spring near the Gibraltar Strait, or easterly winds originated by the positioning and intensity of the Azores High over southern Spain during summer [71]. Another interesting result was the decrease in susceptibility over several inner regions that appeared to occur in the 1981–2022 results relative to the 1950–2022 results, which will need a detailed analysis in further studies. A comparison of the EPSI results over Portugal with those obtained by Santos et al. [33] revealed similarities, as, in both studies, the northwest region was the most susceptible Portuguese region to PEEs, both annually and seasonally. However, it should be noted that the present study was based on the Iberia01 and ERA5-Land datasets, which covered the entire IP and had a spatial resolution of 0.1° latitude × 0.1° longitude, while Santos et al. [33] used PT02, a 20-km resolution daily precipitation dataset developed by the Portuguese weather service (Instituto do Mar e da Atmosfera, IPMA) that only covered Portugal over the period 1950–2003 [72]. Additionally, the selected period was longer (1950–2022 versus 1950–2003).
In summary, we can conclude that assessing historical PEEs and aridity in the entire IP through a new state-of-the-art high-resolution precipitation and temperature dataset, with a longer time series compared to previous studies, has opened the doors to better understanding the exposure to PEEs of different regions in the IP. The high spatial resolution and quality of our data also allowed us to obtain a more detailed PEE susceptibility map of Iberia, something that is fundamental, e.g., to local authorities for improving urban planning and management; to farmers for better selecting and managing crops; or to insurance companies for better assessing the risks and developing improved insurance products.
Supplementary Materials
The following supporting information can be downloaded at: https://www.mdpi.com/article/10.3390/w15213840/s1, Table S1: Pearson correlation coefficients between the different variables used in the PCA analysis and for the period 1950–2022. Figure S1: 1971–2015 (a) E-OBS, (b) Iberia01, (c) non-bias-corrected ERA5-Land and (d) bias-corrected ERA5-Land annual total precipitation (mm) over the Iberian Peninsula; Figure S2: 1950–2022 (a) non-bias-corrected ERA5-Land and (b) bias-corrected ERA5-Land total annual precipitation trend over the Iberian Peninsula; Figure S3: (a) 1950–2022 annual, (b) 1981–2022 annual, and 1981–2022 (c) winter, (d) spring, (e) summer, and (f) autumn maximum number of consecutive wet days (CWD) over the Iberian Peninsula; Figure S4: (a) 1950–2022 annual, (b) 1981–2022 annual, and 1981–2022 (c) winter, (d) spring, (e) summer, and (f) autumn number of days with a total precipitation above 20 mm (R20mm) over the Iberian Peninsula; Figure S5: (a) 1950–2022 annual, (b) 1981–2022 annual, and 1981–2022 (c) winter, (d) spring, (e) summer, and (f) autumn maximum 1-day precipitation amount (Rx1Day, mm) over the Iberian Peninsula; Figure S6: (a) 1950–2022 annual, (b) 1981–2022 annual, and 1981–2022 (c) winter, (d) spring, (e) summer, and (f) autumn maximum 5-day precipitation amount (Rx5Day, mm) over the Iberian Peninsula; Figure S7: (a) 1950–2022 annual, (b) 1981–2022 annual, and 1981–2022 (c) winter, (d) spring, (e) summer, and (f) autumn simple daily intensity index (SDII, mm day−1) over the Iberian Peninsula; Figure S8: 1950–2022 spring (a) total precipitation, (b) R95PTOT, (c) CDD, and (d) DMI indices’ trend at a 5% significance level over the Iberian Peninsula; Figure S9: 1950–2022 autumn (a) total precipitation, (b) R95PTOT, (c) CDD, and (d) DMI indices’ trend at a 5% significance level over the Iberian Peninsula; Figure S10: (a) 1950–2022 annual, (b) 1981–2022 annual, and 1981–2022 (c) winter, (d) spring, (e) summer, and (f) autumn first principal component (PC1) of the major precipitation indices over the Iberian Peninsula. The percentage of variance explained by PC1 is presented on the left; Figure S11: (a) 1950–2022 annual, (b) 1981–2022 annual, and 1981–2022 (c) winter, (d) spring, (e) summer, and (f) autumn second principal component (PC2) of the major precipitation indices over the Iberian Peninsula. The percentage of variance explained by PC2 is presented on the left.
Author Contributions
Conceptualization, J.A.S., H.F. and A.F.; methodology, J.A.S. and A.F.; software, A.M.C. and A.F.; validation, A.M.C. and A.F.; formal analysis, A.M.C.; resources, J.A.S.; data curation, A.M.C. and A.F.; writing—original draft preparation, A.M.C.; writing—review and editing, J.A.S., H.F. and A.F.; visualization, A.M.C.; supervision, J.A.S., H.F. and A.F.; project administration, J.A.S.; funding acquisition, J.A.S. All authors have read and agreed to the published version of the manuscript.
Funding
This work was funded by the CoaClimateRisk project (COA/CAC/0030/2019) “O impacto das alterações climáticas e medidas de adaptação para as principais culturas agrícolas na região do Vale do Côa”, financed by national funds by the Portuguese Foundation for Science and Technology (FCT).
Data Availability Statement
The data presented in this study are available upon request from the corresponding authors.
Acknowledgments
This research was supported by the Portuguese Foundation for Science and Technology (FCT) under the projects UID/AGR/04033/2020 and LA/P/0126/2020. H.F. thanks the FCT for 2022.02317.CEECIND. A.F. is thankful for the support of Vine and Wine Portugal—Driving Sustainable Growth Through Smart Innovation, PRR and NextGeneration EU, Agendas Mobilizadoras para a Reindustrialização, Contract Nb. C644866286-011.
Conflicts of Interest
The authors declare no conflict of interest. The funders had no role in the design of the study; in the collection, analyses, or interpretation of the data; in the writing of the manuscript; or in the decision to publish the results.
References
- Seneviratne, S.I.; Zhang, X.; Adnan, M.; Badi, W.; Dereczynski, C.; Di Luca, A.; Ghosh, S.; Iskandar, I.; Kossin, J.; Lewis, S.; et al. IPCC Weather and Climate Extreme Events in a Changing Climate. In Climate Change 2021—The Physical Science Basis; Cambridge University Press: Cambridge, UK, 2021; pp. 1513–1766. [Google Scholar]
- Ebi, K.L.; Vanos, J.; Baldwin, J.W.; Bell, J.E.; Hondula, D.M.; Errett, N.A.; Hayes, K.; Reid, C.E.; Saha, S.; Spector, J.; et al. Extreme Weather and Climate Change: Population Health and Health System Implications. Annu. Rev. Public Health 2021, 42, 293–315. [Google Scholar] [CrossRef]
- Bell, J.E.; Brown, C.L.; Conlon, K.; Herring, S.; Kunkel, K.E.; Lawrimore, J.; Luber, G.; Schreck, C.; Smith, A.; Uejio, C. Changes in Extreme Events and the Potential Impacts on Human Health. J. Air Waste Manag. Assoc. 2018, 68, 265–287. [Google Scholar] [CrossRef] [PubMed]
- Vogel, E.; Donat, M.G.; Alexander, L.V.; Meinshausen, M.; Ray, D.K.; Karoly, D.; Meinshausen, N.; Frieler, K. The Effects of Climate Extremes on Global Agricultural Yields. Environ. Res. Lett. 2019, 14, 054010. [Google Scholar] [CrossRef]
- FAO. The Impact of Disasters and Crises on Agriculture and Food Security: 2021; FAO: Rome, Italy, 2021; ISBN 978-92-5-134071-4. [Google Scholar]
- Manning, C.; Widmann, M.; Bevacqua, E.; Van Loon, A.F.; Maraun, D.; Vrac, M. Increased Probability of Compound Long-Duration Dry and Hot Events in Europe during Summer (1950–2013). Environ. Res. Lett. 2019, 14, 094006. [Google Scholar] [CrossRef]
- Weilnhammer, V.; Schmid, J.; Mittermeier, I.; Schreiber, F.; Jiang, L.; Pastuhovic, V.; Herr, C.; Heinze, S. Extreme Weather Events in Europe and Their Health Consequences—A Systematic Review. Int. J. Hyg. Environ. Health 2021, 233, 113688. [Google Scholar] [CrossRef]
- Tradowsky, J.S.; Philip, S.Y.; Kreienkamp, F.; Kew, S.F.; Lorenz, P.; Arrighi, J.; Bettmann, T.; Caluwaerts, S.; Chan, S.C.; De Cruz, L.; et al. Attribution of the Heavy Rainfall Events Leading to Severe Flooding in Western Europe during July 2021. Clim. Chang. 2023, 176, 90. [Google Scholar] [CrossRef]
- Ramos, A.; Trigo, R.; Santo, F. Evolution of Extreme Temperatures over Portugal: Recent Changes and Future Scenarios. Clim. Res. 2011, 48, 177–192. [Google Scholar] [CrossRef]
- Schleussner, C.-F.; Menke, I.; Theokritoff, E.; van Maanen, N.; Lanson, A. Climate Impacts in Portugal; Climate Analytics: Berlin, Germany, 2019. [Google Scholar]
- Coll, J.R.; Aguilar, E.; Ashcroft, L. Drought Variability and Change across the Iberian Peninsula. Theor. Appl. Climatol. 2017, 130, 901–916. [Google Scholar] [CrossRef]
- Páscoa, P.; Gouveia, C.M.; Russo, A.; Trigo, R.M. Drought Trends in the Iberian Peninsula over the Last 112 Years. Adv. Meteorol. 2017, 2017, 4653126. [Google Scholar] [CrossRef]
- Espinosa, L.A.; Portela, M.M.; Matos, J.P.; Gharbia, S. Climate Change Trends in a European Coastal Metropolitan Area: Rainfall, Temperature, and Extreme Events (1864–2021). Atmosphere 2022, 13, 1995. [Google Scholar] [CrossRef]
- Parente, J.; Pereira, M.G.; Amraoui, M.; Fischer, E.M. Heat Waves in Portugal: Current Regime, Changes in Future Climate and Impacts on Extreme Wildfires. Sci. Total Environ. 2018, 631–632, 534–549. [Google Scholar] [CrossRef] [PubMed]
- Parente, J.; Amraoui, M.; Menezes, I.; Pereira, M.G. Drought in Portugal: Current Regime, Comparison of Indices and Impacts on Extreme Wildfires. Sci. Total Environ. 2019, 685, 150–173. [Google Scholar] [CrossRef] [PubMed]
- Ribeiro, A.F.S.; Russo, A.; Gouveia, C.M.; Páscoa, P. Copula-Based Agricultural Drought Risk of Rainfed Cropping Systems. Agric. Water Manag. 2019, 223, 105689. [Google Scholar] [CrossRef]
- Almendra-Martín, L.; Martínez-Fernández, J.; González-Zamora, Á.; Benito-Verdugo, P.; Herrero-Jiménez, C.M. Agricultural Drought Trends on the Iberian Peninsula: An Analysis Using Modeled and Reanalysis Soil Moisture Products. Atmosphere 2021, 12, 236. [Google Scholar] [CrossRef]
- Davies, R. Spain–Floods in Catalonia and Valencia, Policeman Dies in Flood Rescue in Benissa. Available online: https://floodlist.com/europe/spain-floods-catalonia-valencia-september-2022 (accessed on 24 July 2023).
- Davies, R. Spain–1 Killed in Murcia Flash Floods after 29 mm of Rain in 10 Minutes. Available online: https://floodlist.com/europe/spain-murcia-floods-september-2022 (accessed on 24 July 2023).
- Davies, R. Portugal–Deadly Floods in Lisbon. Available online: https://floodlist.com/europe/portugal-deadly-floods-in-lisbon (accessed on 24 July 2023).
- Davies, R. Portugal–More Flooding Hits Lisbon after 65 mm of Rain in 3 Hours. Available online: https://floodlist.com/europe/portugal-flood-lisbon-setubal-december-2022 (accessed on 24 July 2023).
- Ramos, A.M.; Trigo, R.M.; Liberato, M.L.R.; Tomé, R. Daily Precipitation Extreme Events in the Iberian Peninsula and Its Association with Atmospheric Rivers. J. Hydrometeorol. 2015, 16, 579–597. [Google Scholar] [CrossRef]
- Ramos, A.M.; Martins, M.J.; Tomé, R.; Trigo, R.M. Extreme Precipitation Events in Summer in the Iberian Peninsula and Its Relationship With Atmospheric Rivers. Front. Earth Sci. 2018, 6, 110. [Google Scholar] [CrossRef]
- Eiras-Barca, J.; Lorenzo, N.; Taboada, J.; Robles, A.; Miguez-Macho, G. On the Relationship between Atmospheric Rivers, Weather Types and Floods in Galicia (NW Spain). Nat. Hazards Earth Syst. Sci. 2018, 18, 1633–1645. [Google Scholar] [CrossRef]
- Merino, A.; Fernández-Vaquero, M.; López, L.; Fernández-González, S.; Hermida, L.; Sánchez, J.L.; García-Ortega, E.; Gascón, E. Large-Scale Patterns of Daily Precipitation Extremes on the Iberian Peninsula. Int. J. Climatol. 2016, 36, 3873–3891. [Google Scholar] [CrossRef]
- Serrano-Notivoli, R.; Beguería, S.; Saz, M.Á.; de Luis, M. Recent Trends Reveal Decreasing Intensity of Daily Precipitation in Spain. Int. J. Climatol. 2018, 38, 4211–4224. [Google Scholar] [CrossRef]
- Llasat, M.C.; del Moral, A.; Cortès, M.; Rigo, T. Convective Precipitation Trends in the Spanish Mediterranean Region. Atmos. Res. 2021, 257, 105581. [Google Scholar] [CrossRef]
- López, J.J.; Ayuso-Muñoz, J.L.; Goñi, M.; Gimena, F.N. Analysis of the Effect of Climate Change on the Characteristics of Rainfall in Igeldo-Gipuzkoa (Spain). Water 2023, 15, 1529. [Google Scholar] [CrossRef]
- Acero, F.J.; Gallego, M.C.; García, J.A. Multi-Day Rainfall Trends over the Iberian Peninsula. Theor. Appl. Clim. 2012, 108, 411–423. [Google Scholar] [CrossRef]
- Santos, M.; Fonseca, A.; Fragoso, M.; Santos, J.A. Recent and Future Changes of Precipitation Extremes in Mainland Portugal. Theor. Appl. Clim. 2019, 137, 1305–1319. [Google Scholar] [CrossRef]
- Espírito Santo, F.; Ramos, A.M.; de Lima, M.I.P.; Trigo, R.M. Seasonal Changes in Daily Precipitation Extremes in Mainland Portugal from 1941 to 2007. Reg. Environ. Chang. 2014, 14, 1765–1788. [Google Scholar] [CrossRef]
- De Lima, M.I.P.; Santo, F.E.; Ramos, A.M.; de Lima, J.L.M.P. Recent Changes in Daily Precipitation and Surface Air Temperature Extremes in Mainland Portugal, in the Period 1941–2007. Atmos. Res. 2013, 127, 195–209. [Google Scholar] [CrossRef]
- Santos, M.; Fragoso, M.; Santos, J.A. Regionalization and Susceptibility Assessment to Daily Precipitation Extremes in Mainland Portugal. Appl. Geogr. 2017, 86, 128–138. [Google Scholar] [CrossRef]
- Herrera, S.; Cardoso, R.M.; Soares, P.M.; Espírito-Santo, F.; Viterbo, P.; Gutiérrez, J.M. Iberia01: A New Gridded Dataset of Daily Precipitation and Temperatures over Iberia. Earth Syst. Sci. Data 2019, 11, 1947–1956. [Google Scholar] [CrossRef]
- European Environmental Agency. EU-DEM (Raster)-Version 1.1; European Environmental Agency: Copenhagen, Denmark, 2016. [Google Scholar]
- European Environmental Agency. European Catchments and Rivers Network System (Ecrins), Gazetteer-Version 1; European Environmental Agency: Copenhagen, Denmark, 2012. [Google Scholar]
- Beck, H.E.; Zimmermann, N.E.; McVicar, T.R.; Vergopolan, N.; Berg, A.; Wood, E.F. Present and Future Köppen-Geiger Climate Classification Maps at 1-Km Resolution. Sci. Data 2018, 5, 180214. [Google Scholar] [CrossRef]
- de Lima, M.I.P.; Santo, F.E.; Ramos, A.M.; Trigo, R.M. Trends and Correlations in Annual Extreme Precipitation Indices for Mainland Portugal, 1941–2007. Theor. Appl. Clim. 2015, 119, 55–75. [Google Scholar] [CrossRef]
- Muñoz Sabater, J. ERA5-Land Hourly Data from 1950 to Present. Available online: https://cds.climate.copernicus.eu/cdsapp#!/dataset/reanalysis-era5-land (accessed on 15 February 2023).
- Cornes, R.C.; van der Schrier, G.; van den Besselaar, E.J.M.; Jones, P.D. An Ensemble Version of the E-OBS Temperature and Precipitation Data Sets. J. Geophys. Res. Atmos. 2018, 123, 9391–9409. [Google Scholar] [CrossRef]
- Klok, E.J.; Klein Tank, A.M.G. Updated and Extended European Dataset of Daily Climate Observations. Int. J. Climatol. 2009, 29, 1182–1191. [Google Scholar] [CrossRef]
- Copernicus Climate Change Service E-OBS Data Access. Available online: https://surfobs.climate.copernicus.eu/dataaccess/access_eobs.php (accessed on 23 October 2023).
- Miao, C.; Su, L.; Sun, Q.; Duan, Q. A Nonstationary Bias-Correction Technique to Remove Bias in GCM Simulations. J. Geophys. Res. Atmos. 2016, 121, 5718–5735. [Google Scholar] [CrossRef]
- Li, H.; Sheffield, J.; Wood, E.F. Bias Correction of Monthly Precipitation and Temperature Fields from Intergovernmental Panel on Climate Change AR4 Models Using Equidistant Quantile Matching. J. Geophys. Res. 2010, 115, D10101. [Google Scholar] [CrossRef]
- Wang, L.; Chen, W. A CMIP5 Multimodel Projection of Future Temperature, Precipitation, and Climatological Drought in China. Int. J. Climatol. 2014, 34, 2059–2078. [Google Scholar] [CrossRef]
- Carvalho, D.; Cardoso Pereira, S.; Rocha, A. Future Surface Temperatures over Europe According to CMIP6 Climate Projections: An Analysis with Original and Bias-Corrected Data. Clim. Chang. 2021, 167, 10. [Google Scholar] [CrossRef]
- Martins, J.; Fraga, H.; Fonseca, A.; Santos, J.A. Climate Projections for Precipitation and Temperature Indicators in the Douro Wine Region: The Importance of Bias Correction. Agronomy 2021, 11, 990. [Google Scholar] [CrossRef]
- Karl, T.R.; Nicholls, N.; Ghazi, A. CLIVAR/GCOS/WMO Workshop on Indices and Indicators for Climate Extremes—Workshop Summary. Clim Chang. 1999, 42, 3–7. [Google Scholar] [CrossRef]
- Chervenkov, H.; Slavov, K. ETCCDI Climate Indices for Assessment of the Recent Climate over Southeast Europe. In Advances in High Performance Computing; Dimov, I., Fidanova, S., Eds.; Springer: Berlin/Heidelberg, Germany, 2021; Volume 902, pp. 398–412. [Google Scholar]
- Panda, D.K.; Panigrahi, P.; Mohanty, S.; Mohanty, R.K.; Sethi, R.R. The 20th Century Transitions in Basic and Extreme Monsoon Rainfall Indices in India: Comparison of the ETCCDI Indices. Atmos. Res. 2016, 181, 220–235. [Google Scholar] [CrossRef]
- Yin, H.; Sun, Y. Characteristics of Extreme Temperature and Precipitation in China in 2017 Based on ETCCDI Indices. Adv. Clim. Chang. Res. 2018, 9, 218–226. [Google Scholar] [CrossRef]
- Faye, A.; Akinsanola, A.A. Evaluation of Extreme Precipitation Indices over West Africa in CMIP6 Models. Clim. Dyn. 2022, 58, 925–939. [Google Scholar] [CrossRef]
- Andrade, C.; Contente, J.; Santos, J.A. Climate Change Projections of Aridity Conditions in the Iberian Peninsula. Water 2021, 13, 2035. [Google Scholar] [CrossRef]
- El Kenawy, A.; McCabe, M.; Vicente-Serrano, S.; Robaa, S.; Lopez-Moreno, J. Recent Changes in Continentality and Aridity Conditions over the Middle East and North Africa Region, and Their Association with Circulation Patterns. Clim. Res. 2016, 69, 25–43. [Google Scholar] [CrossRef]
- Tabari, H.; Hosseinzadeh Talaee, P.; Mousavi Nadoushani, S.S.; Willems, P.; Marchetto, A. A Survey of Temperature and Precipitation Based Aridity Indices in Iran. Quat. Int. 2014, 345, 158–166. [Google Scholar] [CrossRef]
- Baltas, E. Spatial Distribution of Climatic Indices in Northern Greece. Meteorol. Appl. 2007, 14, 69–78. [Google Scholar] [CrossRef]
- Araghi, A.; Martinez, C.J.; Adamowski, J.; Olesen, J.E. Spatiotemporal Variations of Aridity in Iran Using High-resolution Gridded Data. Int. J. Climatol. 2018, 38, 2701–2717. [Google Scholar] [CrossRef]
- Mann, H.B. Nonparametric Tests Against Trend. Econometrica 1945, 13, 245. [Google Scholar] [CrossRef]
- Kendall, M.G. Further Contributions to the Theory of Paired Comparisons. Biometrics 1955, 11, 43. [Google Scholar] [CrossRef]
- Sen, P.K. Estimates of the Regression Coefficient Based on Kendall’s Tau. J. Am. Stat. Assoc. 1968, 63, 1379–1389. [Google Scholar] [CrossRef]
- da Silva, R.M.; Santos, C.A.G.; Moreira, M.; Corte-Real, J.; Silva, V.C.L.; Medeiros, I.C. Rainfall and River Flow Trends Using Mann–Kendall and Sen’s Slope Estimator Statistical Tests in the Cobres River Basin. Nat. Hazards 2015, 77, 1205–1221. [Google Scholar] [CrossRef]
- Valdes-Abellan, J.; Pardo, M.A.; Tenza-Abril, A.J. Observed Precipitation Trend Changes in the Western Mediterranean Region. Int. J. Climatol. 2017, 37, 1285–1296. [Google Scholar] [CrossRef]
- Paulo, A.A.; Rosa, R.D.; Pereira, L.S. Climate Trends and Behaviour of Drought Indices Based on Precipitation and Evapotranspiration in Portugal. Nat. Hazards Earth Syst. Sci. 2012, 12, 1481–1491. [Google Scholar] [CrossRef]
- Yue, S.; Pilon, P.; Phinney, B.; Cavadias, G. The Influence of Autocorrelation on the Ability to Detect Trend in Hydrological Series. Hydrol. Process 2002, 16, 1807–1829. [Google Scholar] [CrossRef]
- Supari; Tangang, F.; Juneng, L.; Aldrian, E. Observed Changes in Extreme Temperature and Precipitation over Indonesia. Int. J. Climatol. 2017, 37, 1979–1997. [Google Scholar] [CrossRef]
- Duhan, D.; Pandey, A. Statistical Analysis of Long Term Spatial and Temporal Trends of Precipitation during 1901–2002 at Madhya Pradesh, India. Atmos. Res. 2013, 122, 136–149. [Google Scholar] [CrossRef]
- Jolliffe, I. Principal Component Analysis for Special Types of Data. In Principal Component Analysis; Springer: New York, NY, USA, 2002; pp. 338–372. [Google Scholar]
- Preisendorfer, R.W. Principal Component Analysis in Meteorology and Oceanography; Mobley, C.D., Ed.; Elsevier: Amsterdam, The Netherlands, 1988; Volume 17, ISBN 0-444-43014-8. [Google Scholar]
- Chazarra, A.; Cunha, S.; Silva, Á.; Herráez, C.F.; Pires, V.; Marques, J.; Mendes, L.; Barceló, A.M.; Mendes, M.; Neto, J.; et al. Atlas Climático Ibérico: Temperatura Do Ar e Precipitação (1971–2000); Instituto de Meteorologia de Portugal, Agencia Estatal de Meteorología, Ministerio de Medio Ambiente y Medio Rural y Marino, Eds.; Closas-Orcoyen, S.L.: Madrid, Spain, 2011; ISBN 978-84-7837-079-5. [Google Scholar]
- Ferreira, R.N. Cut-Off Lows and Extreme Precipitation in Eastern Spain: Current and Future Climate. Atmosphere 2021, 12, 835. [Google Scholar] [CrossRef]
- Hidalgo, P.; Gallego, D. A Historical Climatology of the Easterly Winds in the Strait of Gibraltar. Atmosfera 2019, 32, 181–195. [Google Scholar] [CrossRef]
- Belo-Pereira, M.; Dutra, E.; Viterbo, P. Evaluation of Global Precipitation Data Sets over the Iberian Peninsula. J. Geophys. Res. 2011, 116, D20101. [Google Scholar] [CrossRef]


Disclaimer/Publisher’s Note: The statements, opinions and data contained in all publications are solely those of the individual author(s) and contributor(s) and not of MDPI and/or the editor(s). MDPI and/or the editor(s) disclaim responsibility for any injury to people or property resulting from any ideas, methods, instructions or products referred to in the content. |
© 2023 by the authors. Licensee MDPI, Basel, Switzerland. This article is an open access article distributed under the terms and conditions of the Creative Commons Attribution (CC BY) license (https://creativecommons.org/licenses/by/4.0/).