Abstract
With the rapid development of cities in northwest China, there has been an increasing focus on groundwater pollution in plateau cities, specifically the common occurrence of nitrate pollution. The special climatic, geological, and geomorphological characteristics of plateau and river valley cities contribute to distinct groundwater chemical characteristics. Therefore, the formation and evolution process of groundwater nitrate contamination differs from that of plain cities. To explore these issues, we conducted an analysis of eight major ions in various groups of water samples obtained from rivers, springs, and groundwater in Haidong. By utilizing factor analysis and correlation analysis, we were able to identify the characteristics and formation of groundwater chemistry and nitrate pollution in Haidong. Our findings reveal that the chemical characteristics of groundwater in Haidong are primarily controlled by rock weathering, mineral dissolution, and evaporation, leading to the formation of highly mineralized groundwater. Additionally, the excessive nitrate content in certain areas is a result of domestic sewage discharge and agricultural fertilizer use, exceeding Chinese drinking water health standards. Furthermore, for cities located in valleys, the geological structure significantly impacts the nitrate content of groundwater in different regions. Areas with obstructed groundwater flow tend to have higher nitrate levels, whereas regions with unobstructed groundwater experience lower nitrate concentrations. Notably, shallow groundwater is more vulnerable to nitrate pollution compared to deep groundwater. This study holds great significance in understanding the chemical characteristics of groundwater and the formation and evolution of nitrate pollution in highland river valley cities.
1. Introduction
The scarcity of water resources is currently a pressing issue faced by many countries. Groundwater, as a vital component of freshwater resources, is directly linked to the safety of our drinking water. However, with the progression of the economy and society, groundwater pollution, particularly from nitrate, has become increasingly severe [1]. Nitrate pollution has led to a decline in water quality in numerous countries, significantly impacting the health of residents who rely on drinking water. Elevated levels of nitrate in drinking water pose various health risks, such as methemoglobinemia, gastrointestinal diseases, and blue baby syndrome, thereby increasing susceptibility to cancer [2,3,4,5]. Groundwater, characterized by its substantial volume and slow flow rate, serves as a long-term reservoir for nitrate. Over time, the concentration of nitrate in groundwater gradually accumulates [6]. Multiple natural and human-induced factors contribute to nitrate pollution. Research has indicated that in rural areas, the leakage of agricultural fertilizers and the discharge of livestock manure are the primary contributors to nitrate pollution [7,8,9]. However, in urban areas, with the growth of urban populations, the main sources of nitrate pollution have shifted to domestic sewage discharge and landfill leakage [10,11,12,13]. Compared to deep groundwater, nitrate pollution in shallow groundwater is more common and has been studied more [14,15,16,17,18].
China is one of the countries worldwide facing severe surface and groundwater pollution issues, despite the notable progress made in water pollution control over the past two decades [19,20,21]. Multiple samples have shown nitrate levels surpassing the World Health Organization’s drinking water standards (50 mg/L), highlighting the urgency of addressing nitrate pollution [22,23,24]. The prevention and control of nitrate pollution in groundwater is urgent as it directly affects the safety of drinking water [25]. Currently, the standard limit for nitrate in drinking water in China stands at 44.3 mg/L, considering the existing conditions of nitrate pollution in groundwater. Scholars from around the world have extensively studied the characteristics, sources, migration, transformation, and risk assessment of nitrate pollution [7,16,26,27]. Isotopic methods are frequently employed for identifying the sources and transport of nitrate contamination in groundwater. However, these methods face challenges in accurately reflecting the complex biochemical processes and lagging nature of groundwater [28,29,30]. Kazakis and Voudouris [16] utilized an improved version of the DRASTIC method, integrating quantitative parameters and modifying the category range and final index of parameters to assess the vulnerability and pollution risk of porous aquifers to nitrate. Among the numerous studies on nitrate pollution in groundwater, hydrochemical, isotopic, and multivariate statistical methods are the most commonly used methods [7,26,27,31,32]. However, these studies mostly focus on cities located in plains, and there is a lack of research on cities located in river valleys [12,14,19].
Haidong, located in northwest China along the banks of the Huangshui River, holds significant importance. As a typical valley city, there is a close connection between the groundwater and rivers in Haidong City. Unlike most cities, the groundwater flow system in river valley cities primarily centers around the main river within the basin. This unique characteristic facilitates frequent water exchange between groundwater and river water. However, being situated in a plateau area, Haidong exhibits distinct lithological and structural characteristics that differ significantly from those of plain cities. These differences give rise to the special recharge and discharge properties of groundwater, further influencing the distribution patterns of pollutants. Over the past few years, the rapid urban development of Haidong has adversely affected its groundwater quality [33,34]. In certain areas, the nitrate content in groundwater exceeds the drinking water standards set by the World Health Organization (50 mg/L). This study selects the Ping’an–Ledu Basin in Haidong as the study area, considering its unique geological and geomorphic conditions. By employing hydrogeochemical and multivariate statistical analysis methods, this research endeavors to investigate the chemical characteristics of groundwater, as well as the sources and distribution patterns of nitrate pollution.
2. Study Area
2.1. Physical Geography
The investigated region lies at the junction of the Qinghai–Tibet Plateau and the Loess Plateau, and it is characterized by the Huangshui River passing through the entire study area from west to east (Figure 1), making it a typical valley city. The study area is located at longitudes 101.95 and 102.64 E, and latitudes 36.4 and 36.71 N. The altitude ranges from 1862 m to 4051 m, and it experiences a semi-arid continental climate. The average annual temperature ranges from 0.3 °C to 6.8 °C, with an average annual precipitation of 327.7 mm. Precipitation shows significant spatiotemporal differences, with higher rainfall observed in the mountainous areas to the north and south compared to the central basin. Additionally, more than 70% of annual precipitation occurs from June to September. The study area experiences relatively strong evaporation, with an average annual evaporation of 1580.84 mm. The basin is supplied by multiple tributaries on both the north and south sides, with the Yinsheng River being the largest tributary in terms of water volume and an important water source for Haidong.
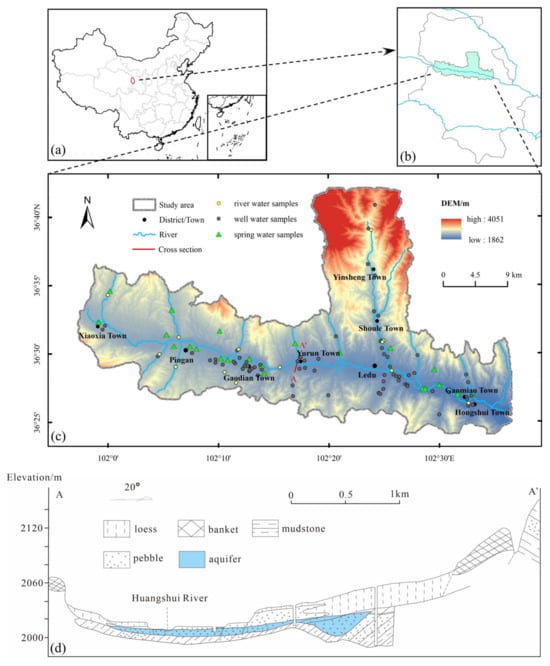
Figure 1.
Figure showing (a–c) geographical location, sampling points, and (d) cross section of the study area.
2.2. Geological Conditions
The sedimentary rock layers in the study region consist primarily of three formations, listed from youngest to oldest: (1) The surface is covered with Quaternary loess, with varying thicknesses that gradually increase from the Huangshui River towards the north and south sides, ranging from 2 to 30 m. (2) Beneath the loess, there is a Quaternary gravel layer that gradually decreases in thickness from the Huangshui River towards the north and south sides, ranging from 3 to 8 m. This gravel layer serves as the main aquifer in the study area. (3) Underlying the gravel layer are mudstones and sandstones deposited during the Paleogene and Cretaceous periods. Additionally, large deposits of glauberite and gypsum rocks are present. Tectonic activities have had a significant impact on the study area, resulting in the formation of synclinal folds and the Huangshuihe Depression as the main geological structures. Furthermore, local areas exhibit small-scale synclinal water storage structures (Figure 1) due to these tectonic influences.
2.3. Human Activities and Land Use
The study area is situated in the Huangshui River Valley, serving as a significant focal point for both urban and rural communities. In recent years, there has been a considerable increase in the urban population, leading to rapid advancements in agriculture and animal husbandry. The land in the area is categorized into seven land use types: grassland, forest land, shrub land, cultivated land, barren land, construction land, and water bodies. Barren land and construction land are primarily found in the Ping’an District and Ledu District, the two urban areas. Grassland, forest land, and shrub land are predominantly located in mountainous and hilly regions. Cultivated land is predominantly distributed in the river valley areas on both sides of the Huangshui River and its tributaries, and is mainly used for growing crops, such as wheat, potatoes, and rapeseed. To enhance agricultural production, fertilizers and commercial organic fertilizers are used on the arable land.
3. Materials and Methods
3.1. Sample Collection and Measurements
The water chemistry parameters examined in this study included pH, Na+, K+, Ca2+, Mg2+, Cl−, SO42−, HCO3−, OH−, NO3−, total dissolved solids (TDSs), total hardness (TH), and temperature (T). The groundwater samples included 70 domestic well water samples with a sampling depth of 5–10 m, 25 spring water samples, and 13 surface water samples from the Huangshui River and its tributaries. Well water samples were obtained from wells at a depth of 5–10 m, whereas spring water samples were directly collected from exposed springs. These sampling points were strategically distributed near the Huangshui River and its tributaries, as shown in Figure 1. Upon collection, the samples were analyzed by Qinghai Jiuliu Engineering Exploration and Design Institute in Xining, China. The water chemistry parameters examined in this study included pH, Na+, K+, Ca2+, Mg2+, Cl−, SO42−, HCO3−, OH−, NO3−, total dissolved solids (TDSs), total hardness (TH), and temperature (T).
To ensure the accuracy and effectiveness of water sample analysis, the ion balance error (E) was calculated using the following formula (Equation (1)):
In Equation (1), the content of anions and cations is expressed in meq/L, and an E result within ±5% indicates the reliability of the water sample analysis [35]. The values of E in this test were all within the range of ±5%, and the water sample testing accuracy was very good.
The digital elevation model dataset and land cover dataset used in this study were obtained from the Geospatial Data Cloud site, Computer Network Information Center of the Chinese Academy of Sciences (https://www.gscloud.cn, accessed on 14 August 2020).
3.2. Correlation Analysis
Correlation analysis is a statistical method utilized to examine the relationship between two or more variables, where correlation coefficients are used to quantify the correlation between these variables. Considering the presence of potential outliers in the chemical parameters of water samples, the Pearson correlation coefficient was deemed unsuitable for this study. Instead, the Spearman correlation coefficient was employed to ascertain the correlation between the following water sample parameters: pH, K+, Na+, Ca2+, Mg2+, Cl−, SO42−, HCO3−, OH−, NO3−, TDSs, TH, and T. When the correlation coefficient ranges from 0 to 1, it indicates a positive correlation between the variables. Conversely, a correlation coefficient ranging from −1 to 0 signifies a negative correlation. A correlation coefficient of 0 denotes no correlation between the variables. The Spearman correlation coefficient was computed using the formula presented below (Equation (2)).
In Equation (2), and represent the positions of and , respectively, and represent the average positions of and , n represents the total number of samples, and ρ represents the Spearman correlation coefficient.
3.3. Factor Analysis
Hidden interconnections frequently exist among the different chemical parameters of groundwater. Factor analysis can be employed to categorize these potentially related variables into several independent primary factors, which can effectively demonstrate associations among the initial variables [20,36]. This method is usually used for hydrogeochemical research, which can examine the relationships between various indicators and help us determine the driving factors of hydrogeochemical evolution. The modeling process of factor analysis is outlined below.
Assuming that the water sample has a total of variables (parameter to be analyzed), there is a set of common factors (,,…()) and special factors (). The variables , , and satisfy the following model (Equation (3)):
In Equation (3), is the special factor of and is the load of the variable on the factor. The model satisfies the following three assumptions: (1) common factors are not correlated with each other; (2) special factors are not correlated with each other; and (3) there is no correlation between the common factors and special factors.
In this study, hydrochemical parameters were used as raw variables to establish an orthogonal factor model. The common factors and factor loading matrix were obtained through principal component analysis, and factor rotation was performed to determine the significance of each common factor. The factor analysis model was implemented using R 4.3.0.
4. Results and Discussion
4.1. Hydrochemical Characteristics
The statistical results for the hydrochemical parameters of collected groundwater and river water samples are shown in Table 1. The concentration of various chemical components in groundwater was generally higher than that in river water. This is largely attributable to the poorer fluidity of groundwater and frequent exchange between river water and other water bodies, which creates higher levels of ions in groundwater. The levels of Na+ (2.54–2008.59 mg/L), K+ (0–168.92 mg/L), SO42− (9.61–2713.7 mg/L), Cl− (10.64–3772.25 mg/L), and NO3− (0–301.6 mg/L) varied greatly among different groundwater samples, with CV values of 122.07%, 143.96, 90.36%, 146.31%, and 147.77%, respectively. However, changes in the concentration of HCO3− (203.57–689.53 mg/L) and pH (7.01–8.3) were small in both groundwater and river water, and the water samples in the study area were alkaline. The concentrations of SO42−, TDSs (235.29–9235.48 mg/L), and TH (230.18–3522.82 mg/L) in groundwater were typically elevated, with more than 50% of the samples surpassing the Chinese drinking water standards. Furthermore, certain groundwater samples exhibited NO3− concentrations that significantly exceed the Chinese standard for drinking water. The pH of groundwater ranges from 7.01 to 8.26, which falls within the 6.5–8.5 range stipulated by Chinese drinking water standards. The abundance of cations in groundwater was ranked as follows: Na+ > Ca2+ > Mg2+ > K+. The abundance of anions in groundwater was ranked as follows: SO42− > HCO3− > Cl− > NO3−.

Table 1.
Hydrochemical analysis results.
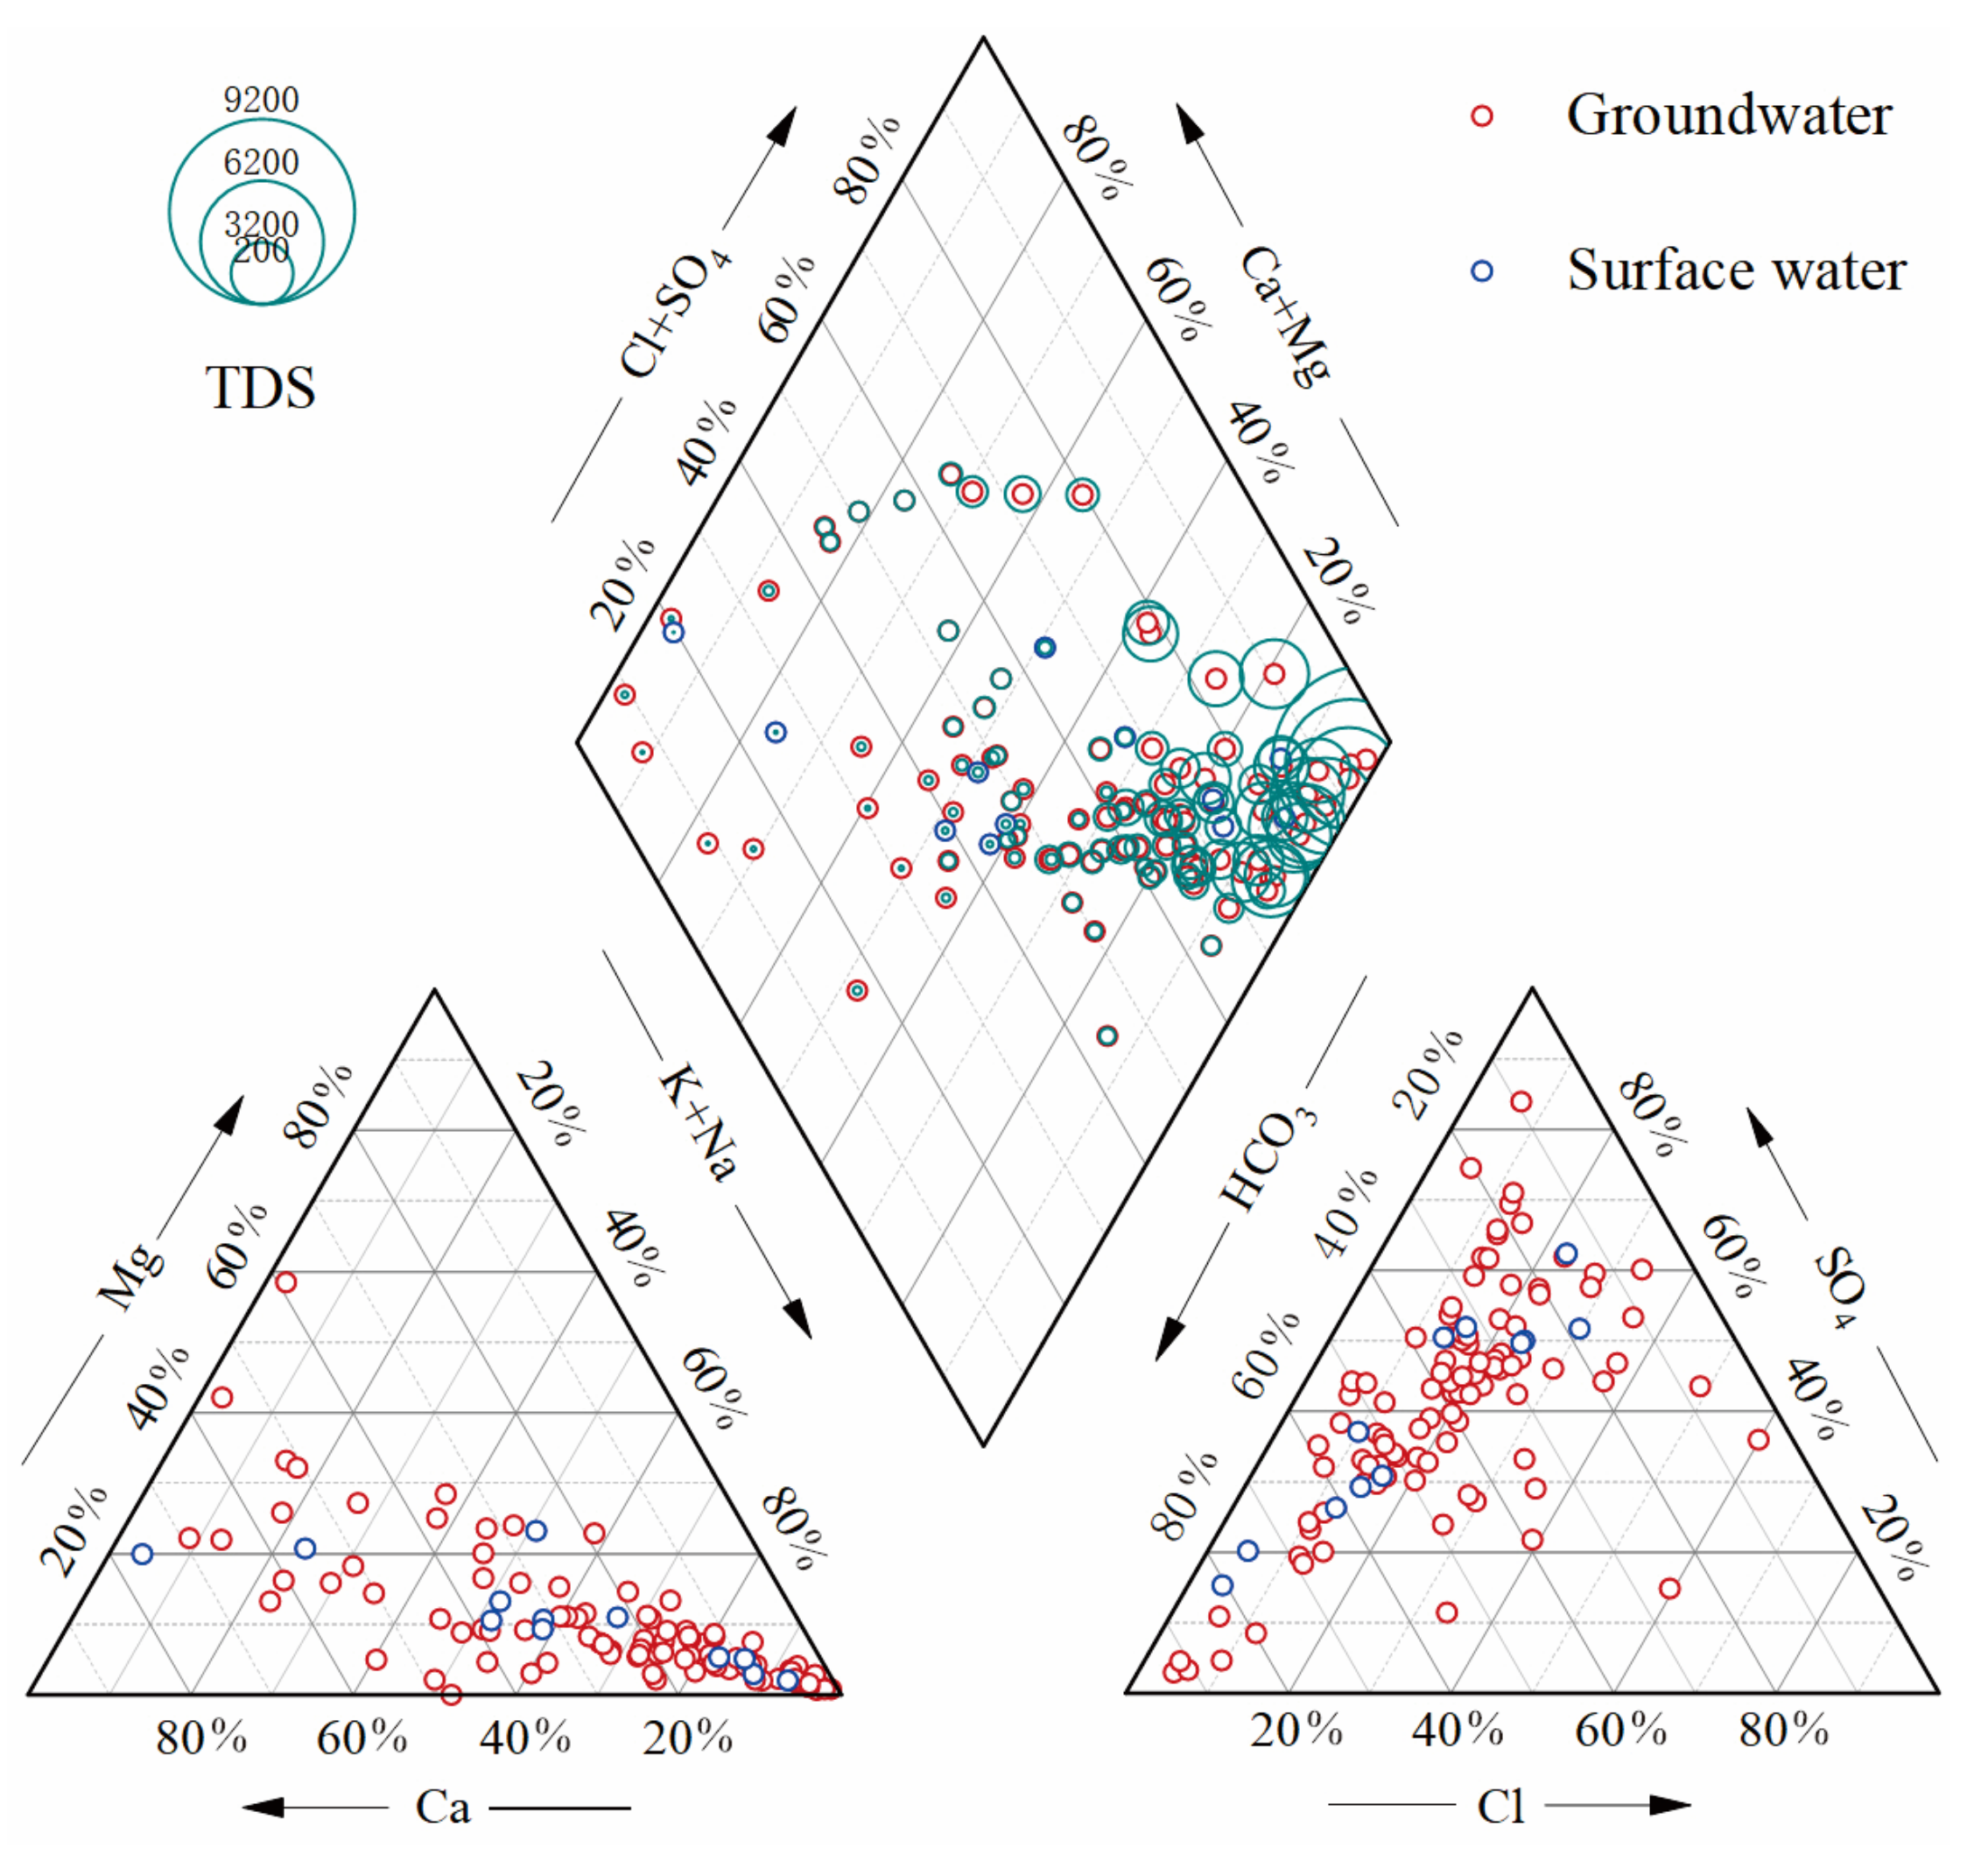
Based on the diagram of The Piper (1944) (Figure 2), the chemical composition of the groundwater samples can be categorized into three types: HCO3-SO4-Cl-Ca-Na, HCO3-SO4-Ca-Mg, and SO4-Na. Similarly, the chemical composition of the river water samples can be classified into two types: HCO3-SO4-Cl-Ca-Na and HCO3-SO4-Ca-Na. It is worth noting that the chemical composition of the river closely resembled that of groundwater. This can be attributed to the close connection between rivers and groundwater in the study area, with the exception of specific storage areas. Moreover, the rivers receive additional recharge from surface runoff, which chemically resembles precipitation and has relatively low ion levels. Consequently, the chemical composition of river water is comparatively lower than groundwater. Interestingly, more than half of the groundwater samples exhibited high total dissolved solids (TDSs) due to significantly elevated levels of SO42−, Cl−, and Na+. As a result, there was high mineralization of groundwater in certain areas in the study area.
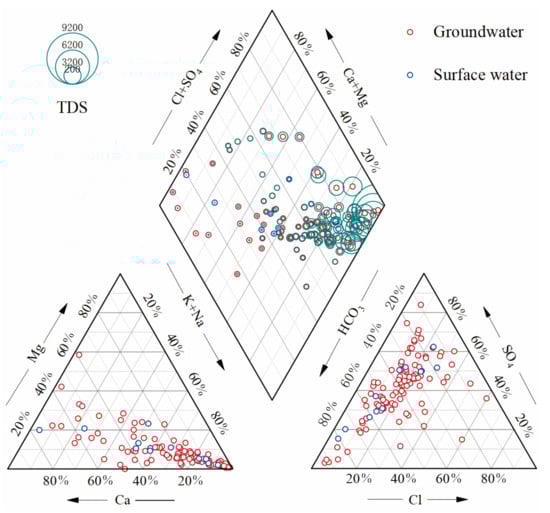
Figure 2.
Piper diagram of groundwater samples and surface water samples with varying TDS concentrations.
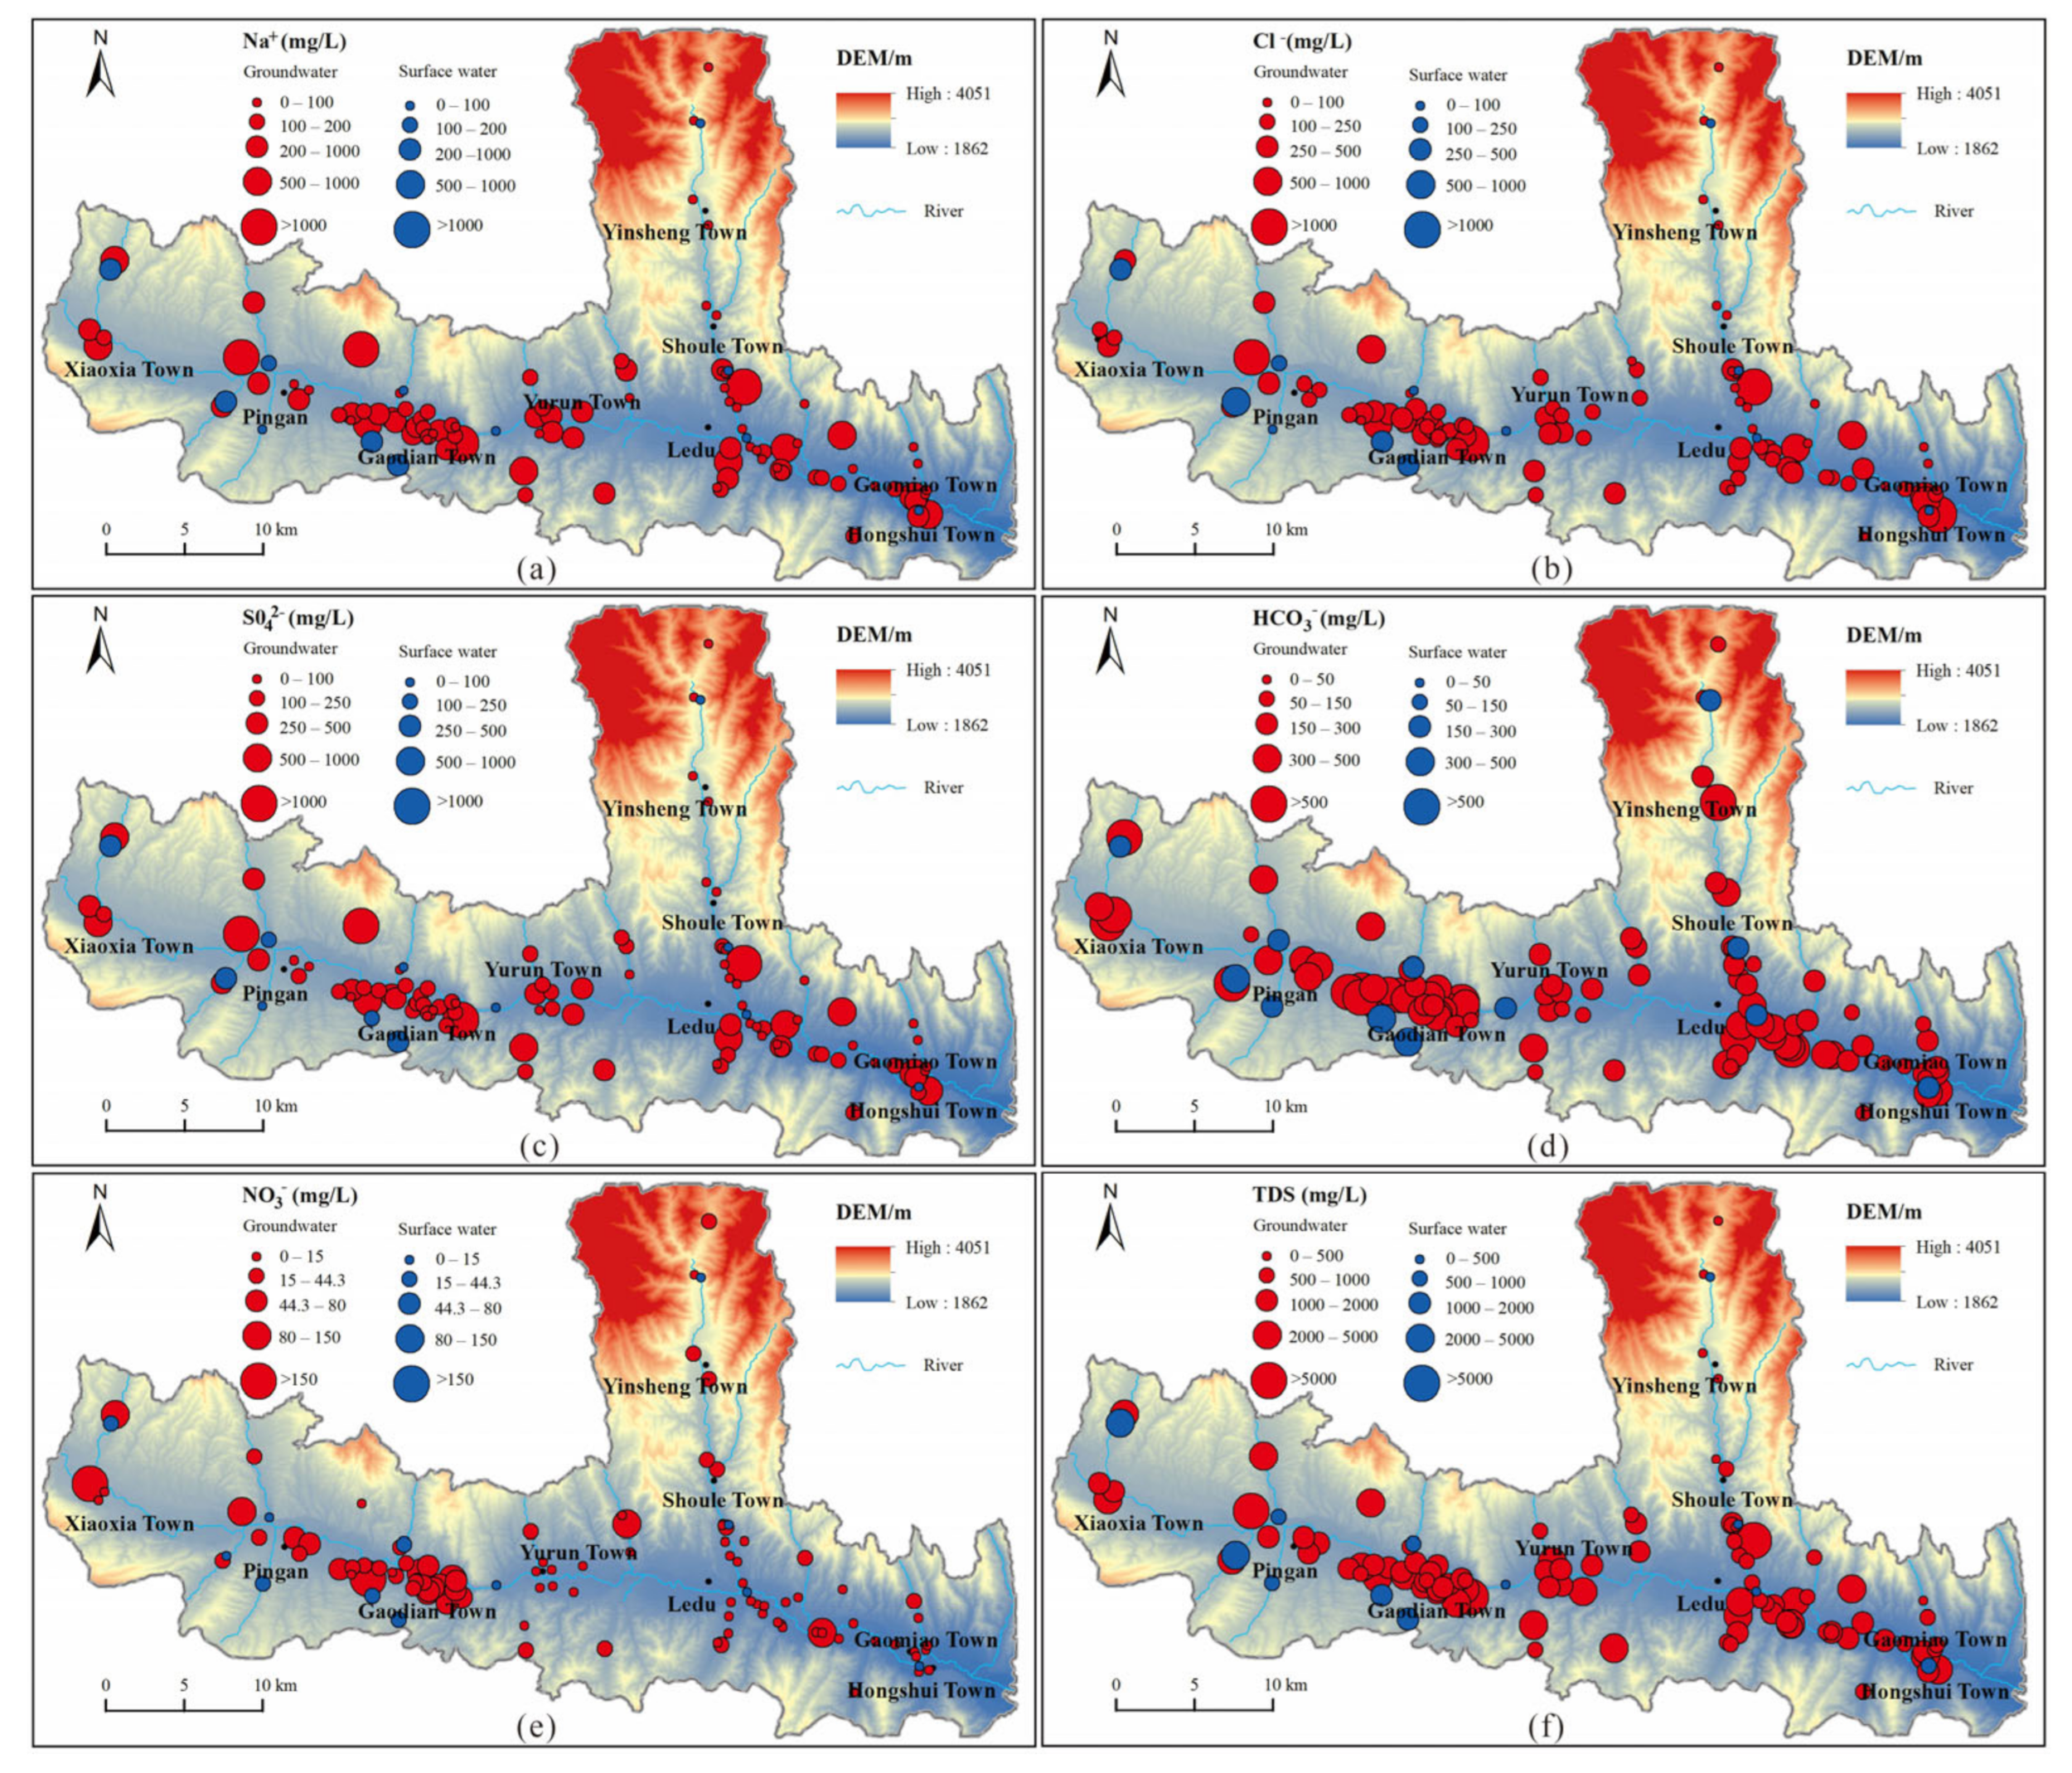
According to the distribution of each chemical constituent (Figure 3), groundwater with high TDS was primarily found on the periphery of river valleys. The chemical composition of this particular groundwater was dominated by SO42−, Cl−, and Na+. Conversely, HCO3−, Ca2+, and Mg2+ were relatively evenly distributed in the water samples and served as the main chemical components in groundwater with low TDS. The distribution of NO3− displayed regional variations, with higher concentrations observed in the western part of the study area compared to the eastern part. In fact, more than half of the water samples in the western region exceeded the Chinese drinking water standard for NO3−. However, in the eastern region, the concentrations of NO3− in most of the water samples fell within the range specified by Chinese drinking water standards. Nonetheless, sporadic occurrences of high NO3− concentrations exceeding the Chinese drinking water standards were observed in certain areas.
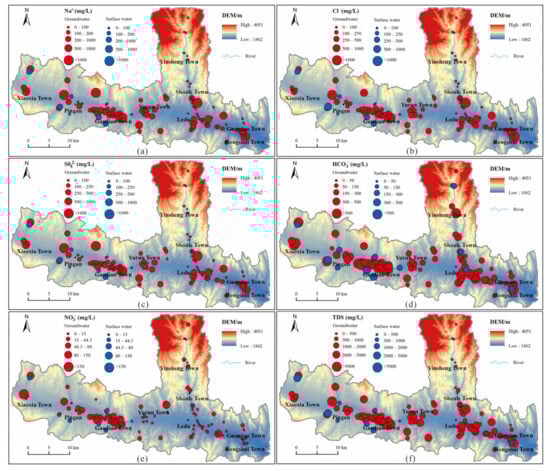
Figure 3.
Distribution of chemical constituents in groundwater samples and surface water samples. Distribution of (a) Na+, (b) Cl−, (c) SO42−, (d) HCO3−, (e) NO3−, (f) TDS in groundwater samples and surface water samples.
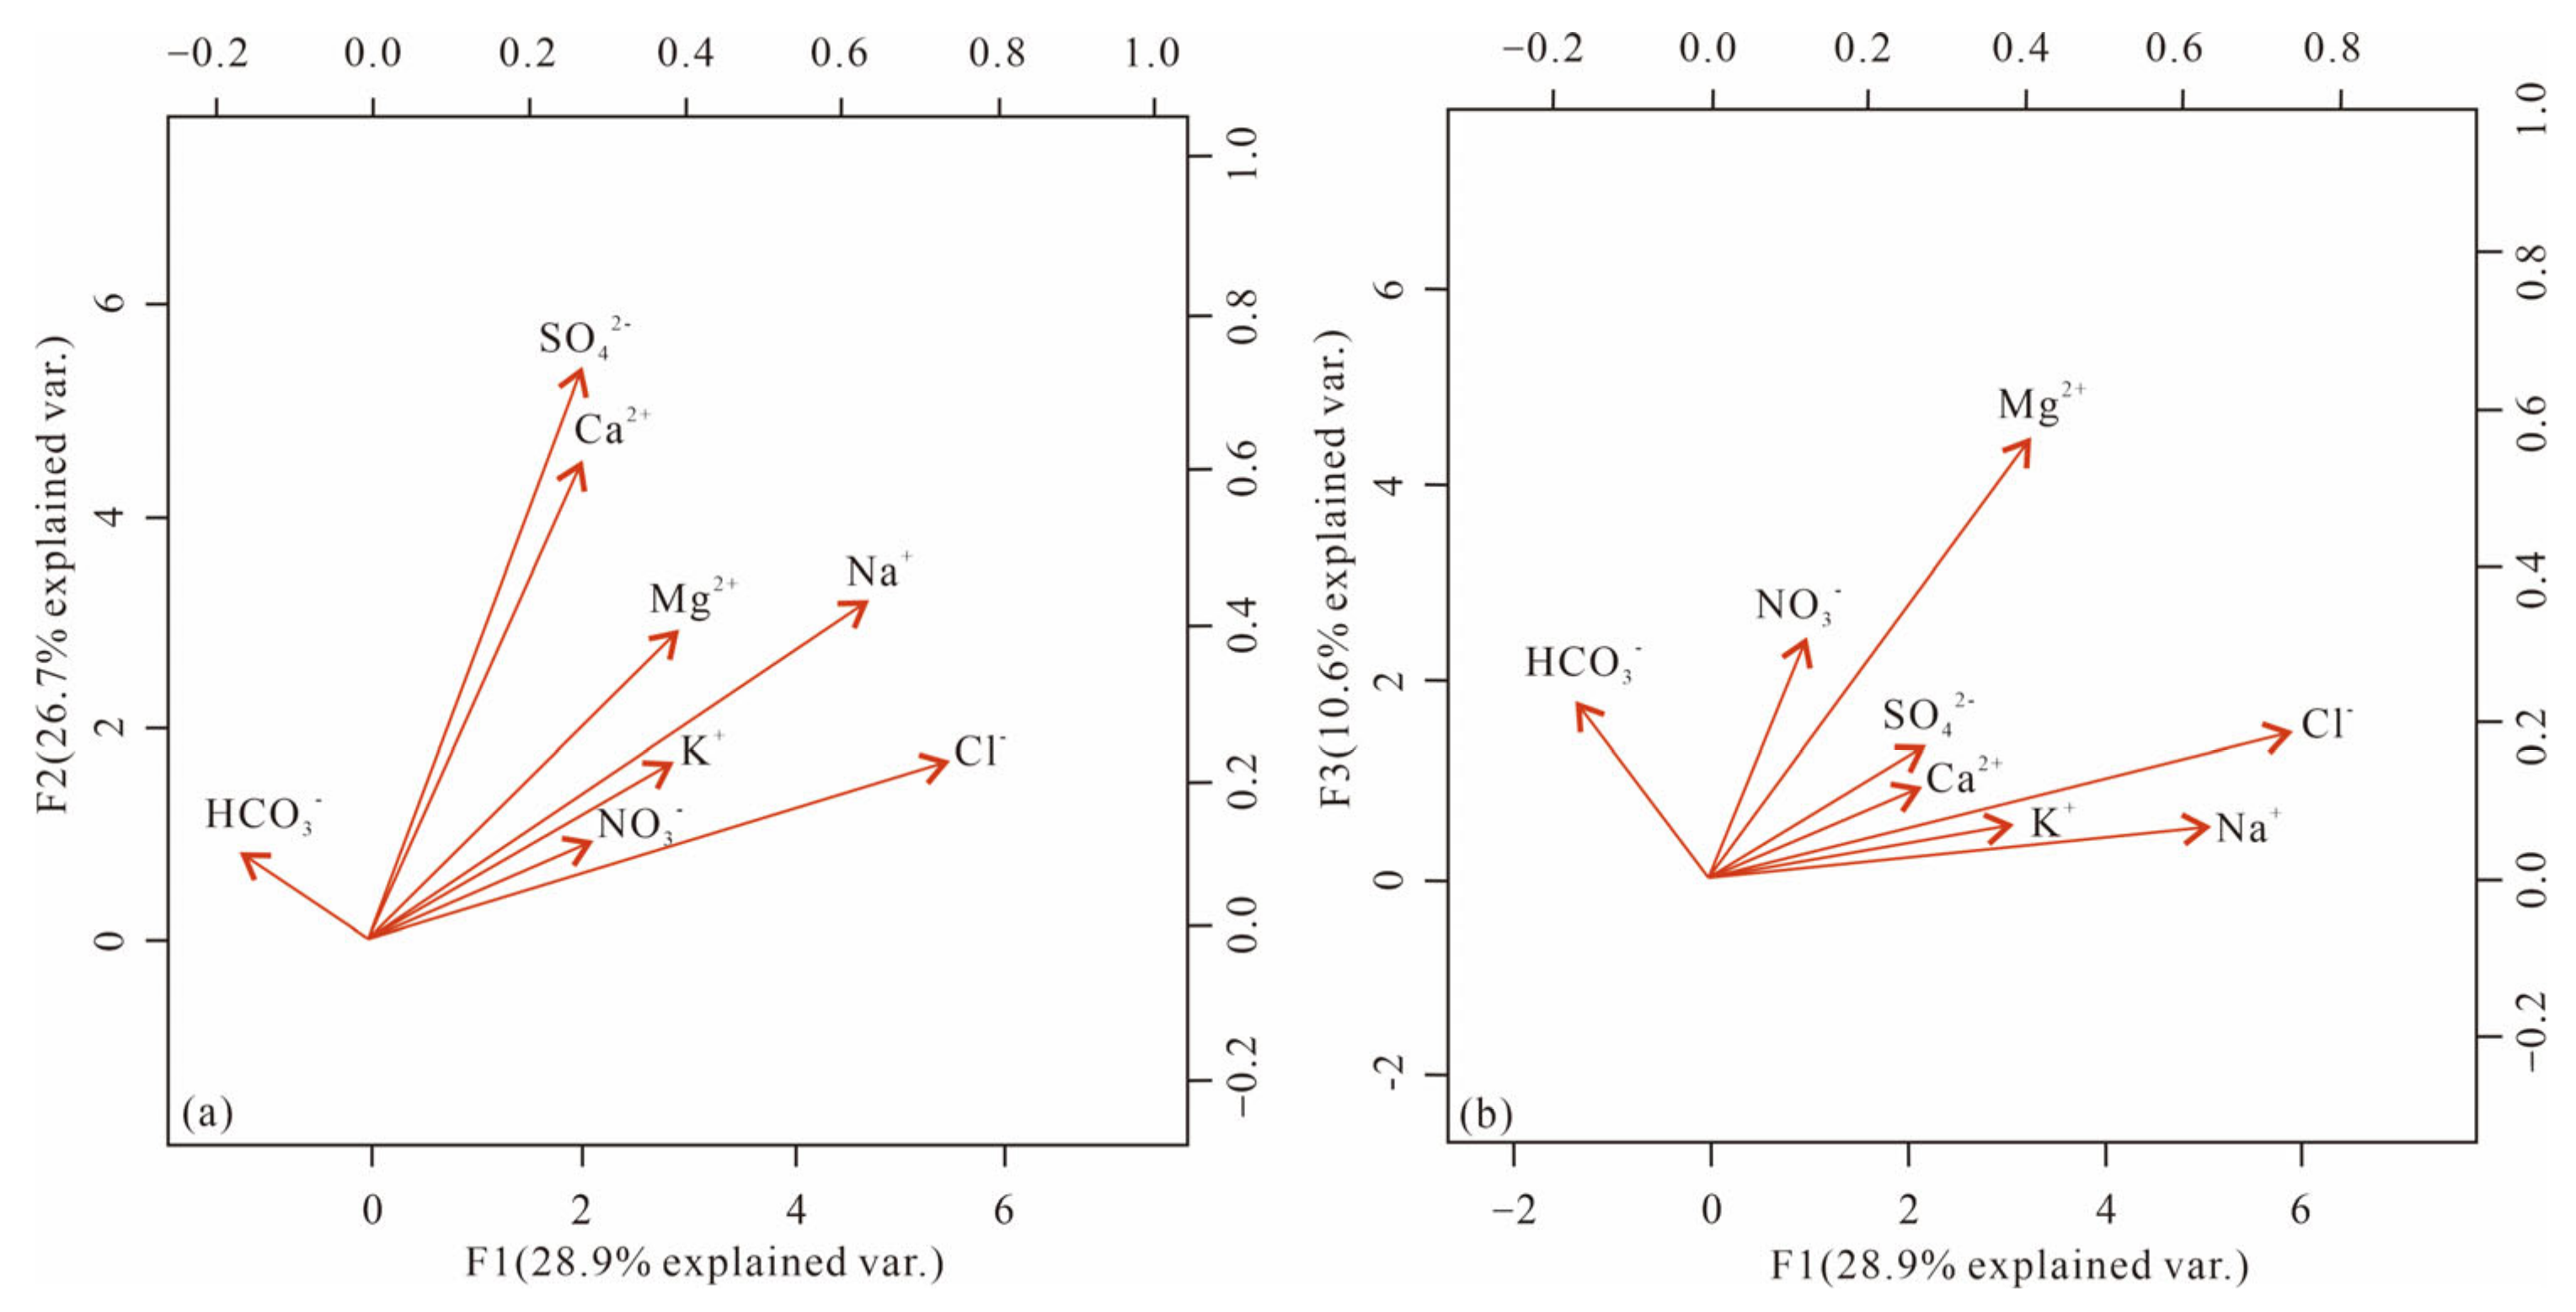
4.2. Result of Factor Analysis
A factor analysis was conducted on the groundwater samples in the study area, targeting the eight major ionic constituents. Factor rotation was applied to obtain three principal factors (Table 2). Among these factors, F1 exhibited a significant correlation with Na+ and Cl−, with a factor contribution of 28.9%. Conversely, F1 exhibited a weak correlation with Ca2+ and a negative correlation with HCO3−. F2 exhibited a strong correlation with Ca2+ and SO42− with a factor contribution of 26.7%, whereas relatively weak correlations were exhibited with Na+, K+, and Cl−. This can be attributed to the fact that F2 predominantly reflects rock weathering and the dissolution of minerals, such as mirabilite and gypsum. F3 with a factor contribution of 10.6% demonstrated high correlations with Mg2+, HCO3−, and NO3−. In contrast, it showed weak correlations with Na+ and K+. F3 is likely associated with carbonate rock dissolution and human activities. The first two factors exhibited similar contribution rates and are primarily determined by climatic and geological conditions, representing the main factors influencing the chemical composition of groundwater. On the other hand, the third factor is primarily linked to groundwater pollution by sewage and agricultural effluent discharge.
Table 2.
Table of principal component rotation variables.
It can be observed that SO42− and Ca2+ exhibit strong positive correlations, with similar loading across all three principal components. This suggests that these two ions share the same source, with only a small portion exhibiting different sources (Figure 4). Na+ and Cl− also display a strong correlation, but Na+ has higher loading for F2, whereas Cl− has higher loading for F3. However, only HCO3− demonstrates a negative loading on F1 compared to the other ions. This implies that HCO3− has reached a saturated concentration in the groundwater in the study area, and its concentration cannot be further increased through evaporation. The higher loading of NO3− on both F1 and F3, together with its very low loading on F2, reflects the fact that NO3− in groundwater is primarily influenced by human activities and evapotranspiration, rather than mineral dissolution.
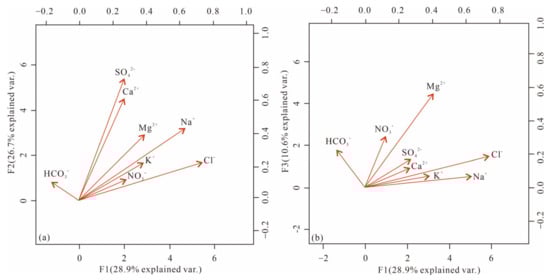
Figure 4.
Plot of information on each principal component. (a) load of ions on F1 and F2, (b) load of ions on F1 and F3.
4.3. Mechanism Controlling Water Chemistry
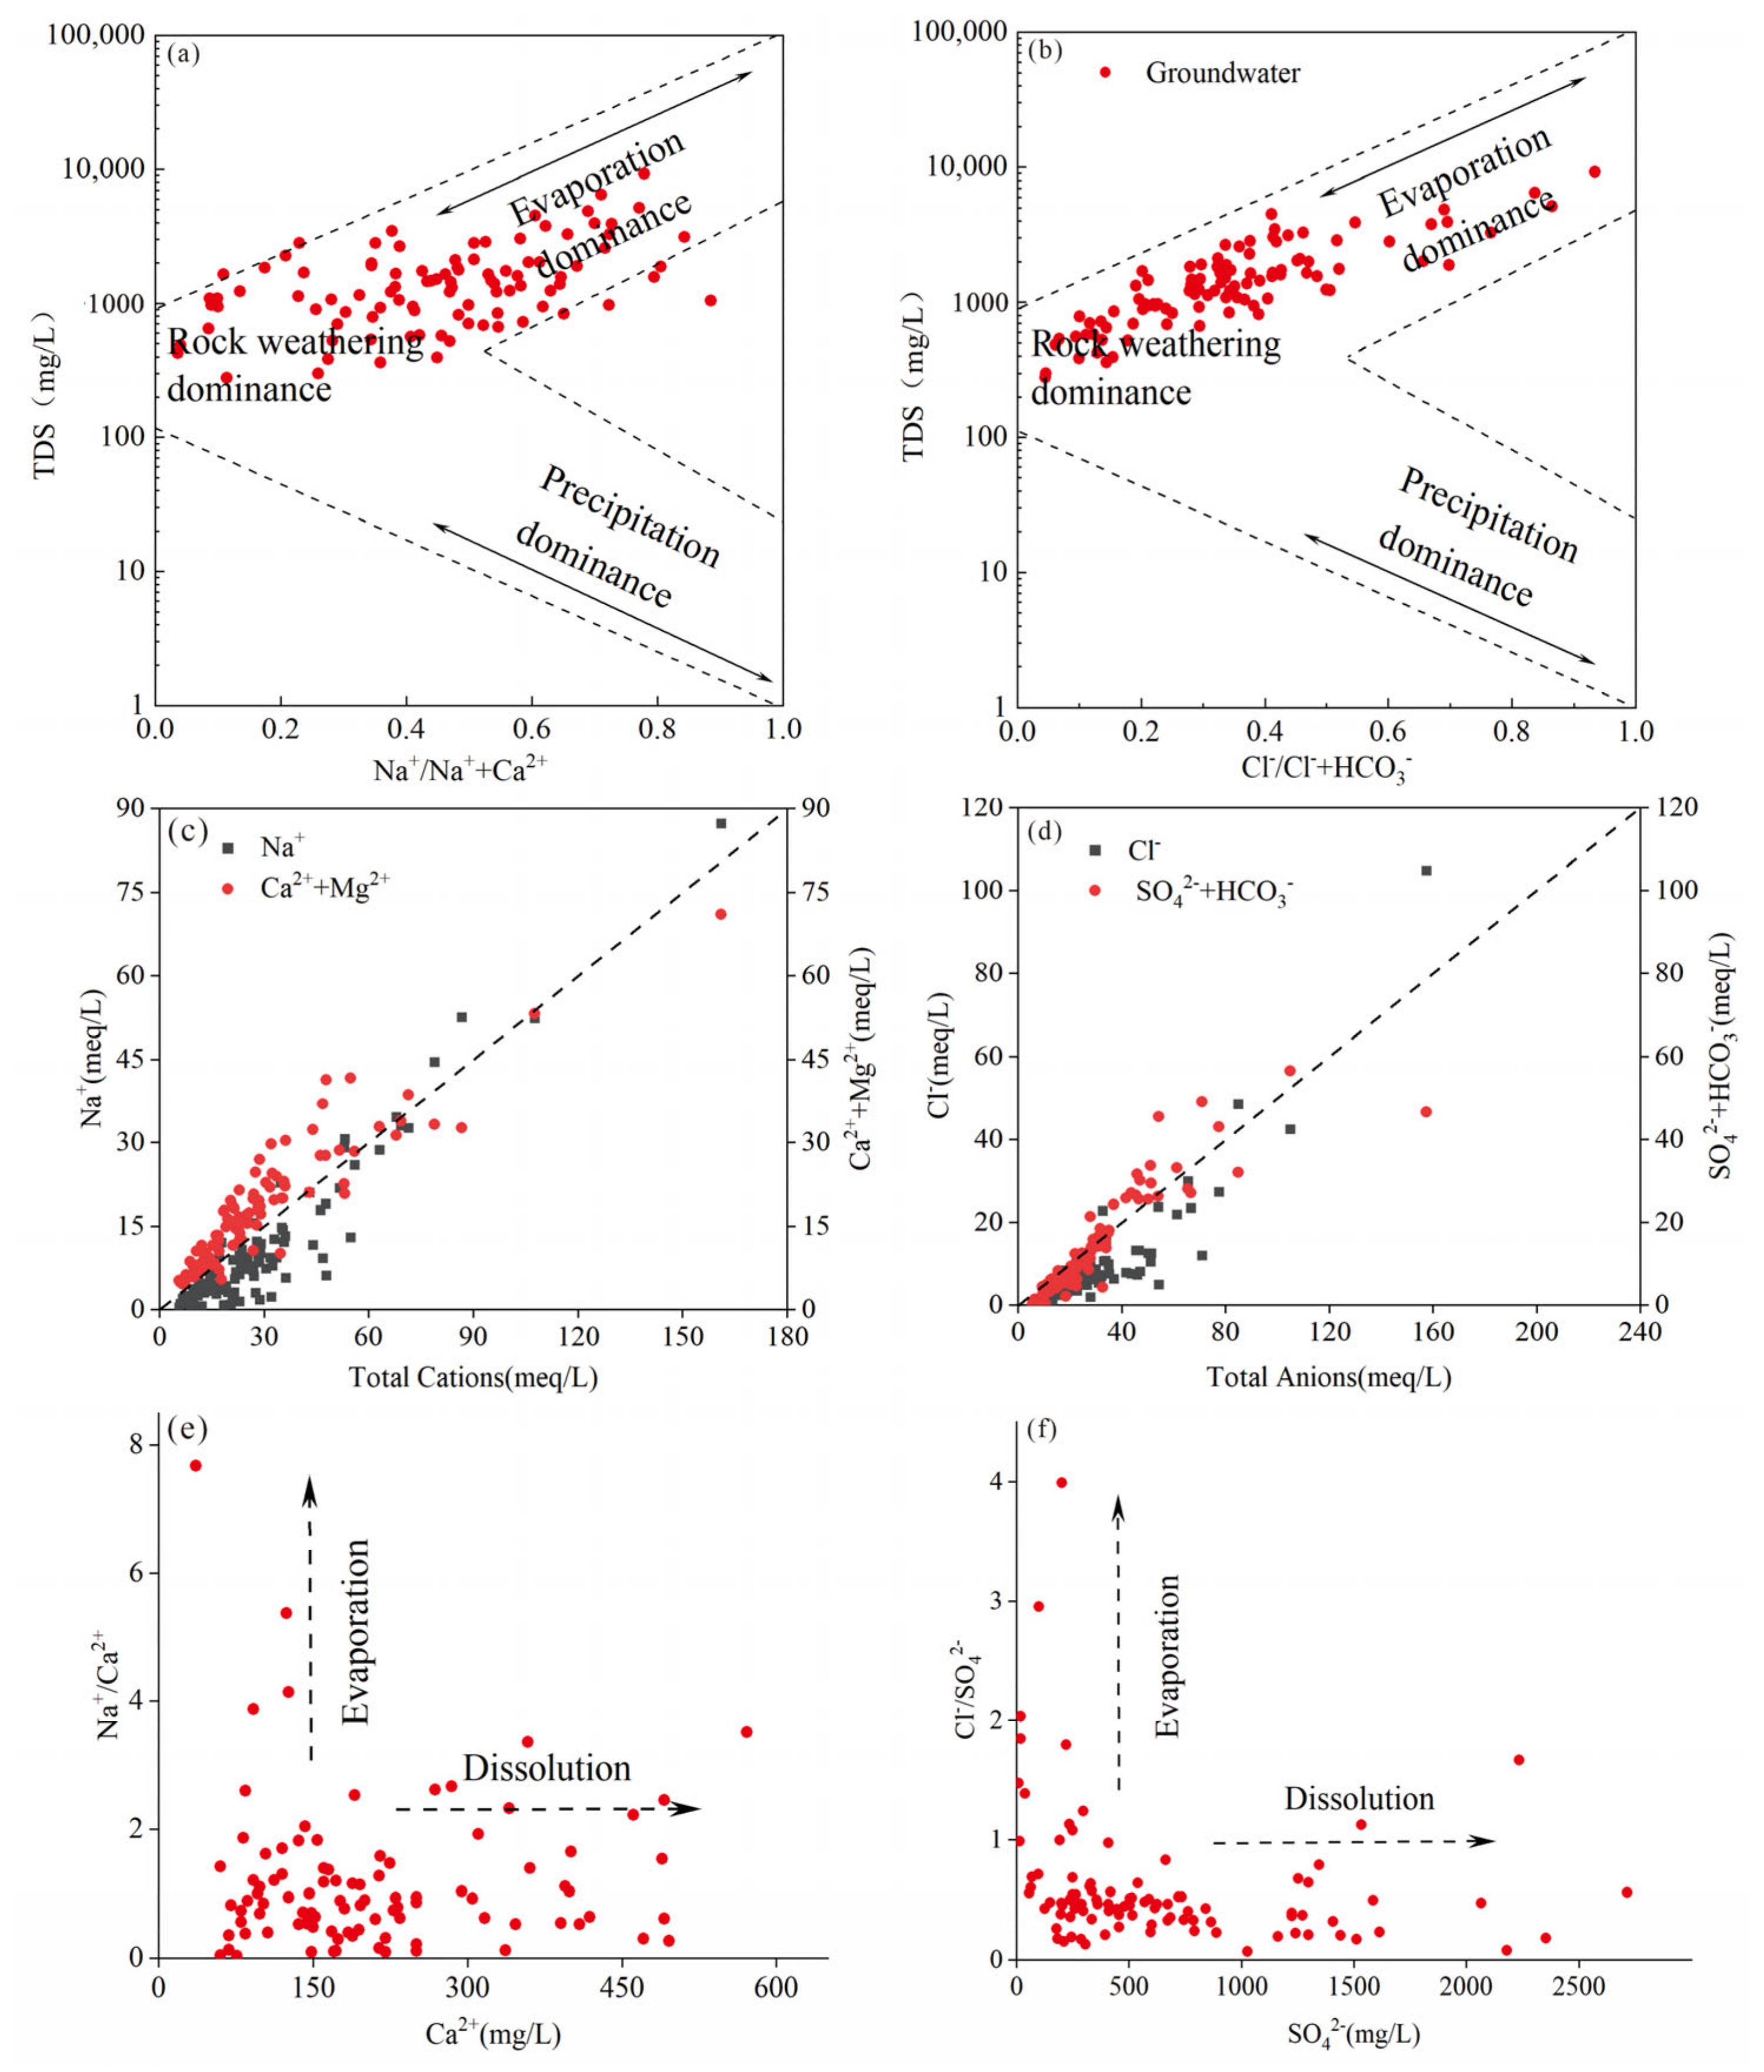
The formation of groundwater chemical characteristics is influenced by various factors, such as lithology, geological structure, climatic condition, and human activities. Gibbs [38] classified the mechanisms of hydrochemical formation in their natural state into three categories: rock weathering, evaporation, and precipitation. Based on this classification, Gibbs developed a semi-logarithmic plot representation. In this study, Gibbs diagrams were employed to identify the dominant factors contributing to the formation of groundwater chemistry features in the study area (Figure 5a). It is evident that the chemical characteristics of groundwater in the study area are primarily influenced by rock weathering and evapotranspiration. Conversely, the impact of precipitation on groundwater chemistry is minimal, aligning with the region’s low precipitation levels as previously indicated.
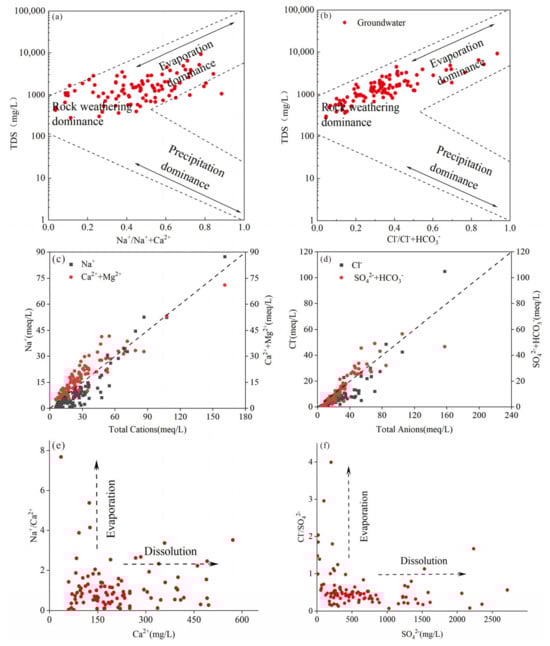
Figure 5.
The relationship between ions: (a,b) Gibbs diagrams indicating factors controlling the chemical characteristics of groundwater, (c) Na+, Ca2+ + Mg2+ vs. Total Cations (meq/L), (d) Cl−, SO42− + HCO3− vs. Total Anions (meq/L), (e) Na+/Ca2+ vs. Ca2+ (mg/L), and (f) Cl−/SO42− vs. SO42− (mg/L).
4.3.1. Rock Weathering
The weathering of rocks and mineral dissolution are the primary sources of various chemical constituents in groundwater [39]. As illustrated in Figure 5a,b, rock weathering and mineral dissolution were found to play an important role in shaping the chemical characteristics of groundwater. The correlation analysis results (Table 3) indicate a significant correlation between Na+ and Cl−, as well as SO42−. Additionally, a strong correlation between Ca2+ and SO42− was observed. Furthermore, HCO3− exhibits a correlation solely with Ca2+ and Mg2+, displaying limited association with other ions. This suggests that the dissolution of dolomite, gypsum, halite, and thenardite in the study area is likely responsible for these correlations. The red beds, containing a considerable amount of gypsum, thenardite, halite, and some dolomite, are widely distributed in the stratigraphy of the study area, which provide mineral sources for groundwater. These minerals dissolve in groundwater, and the reaction process is represented by the following equation:
Table 3.
Correlation coefficients of major ions.
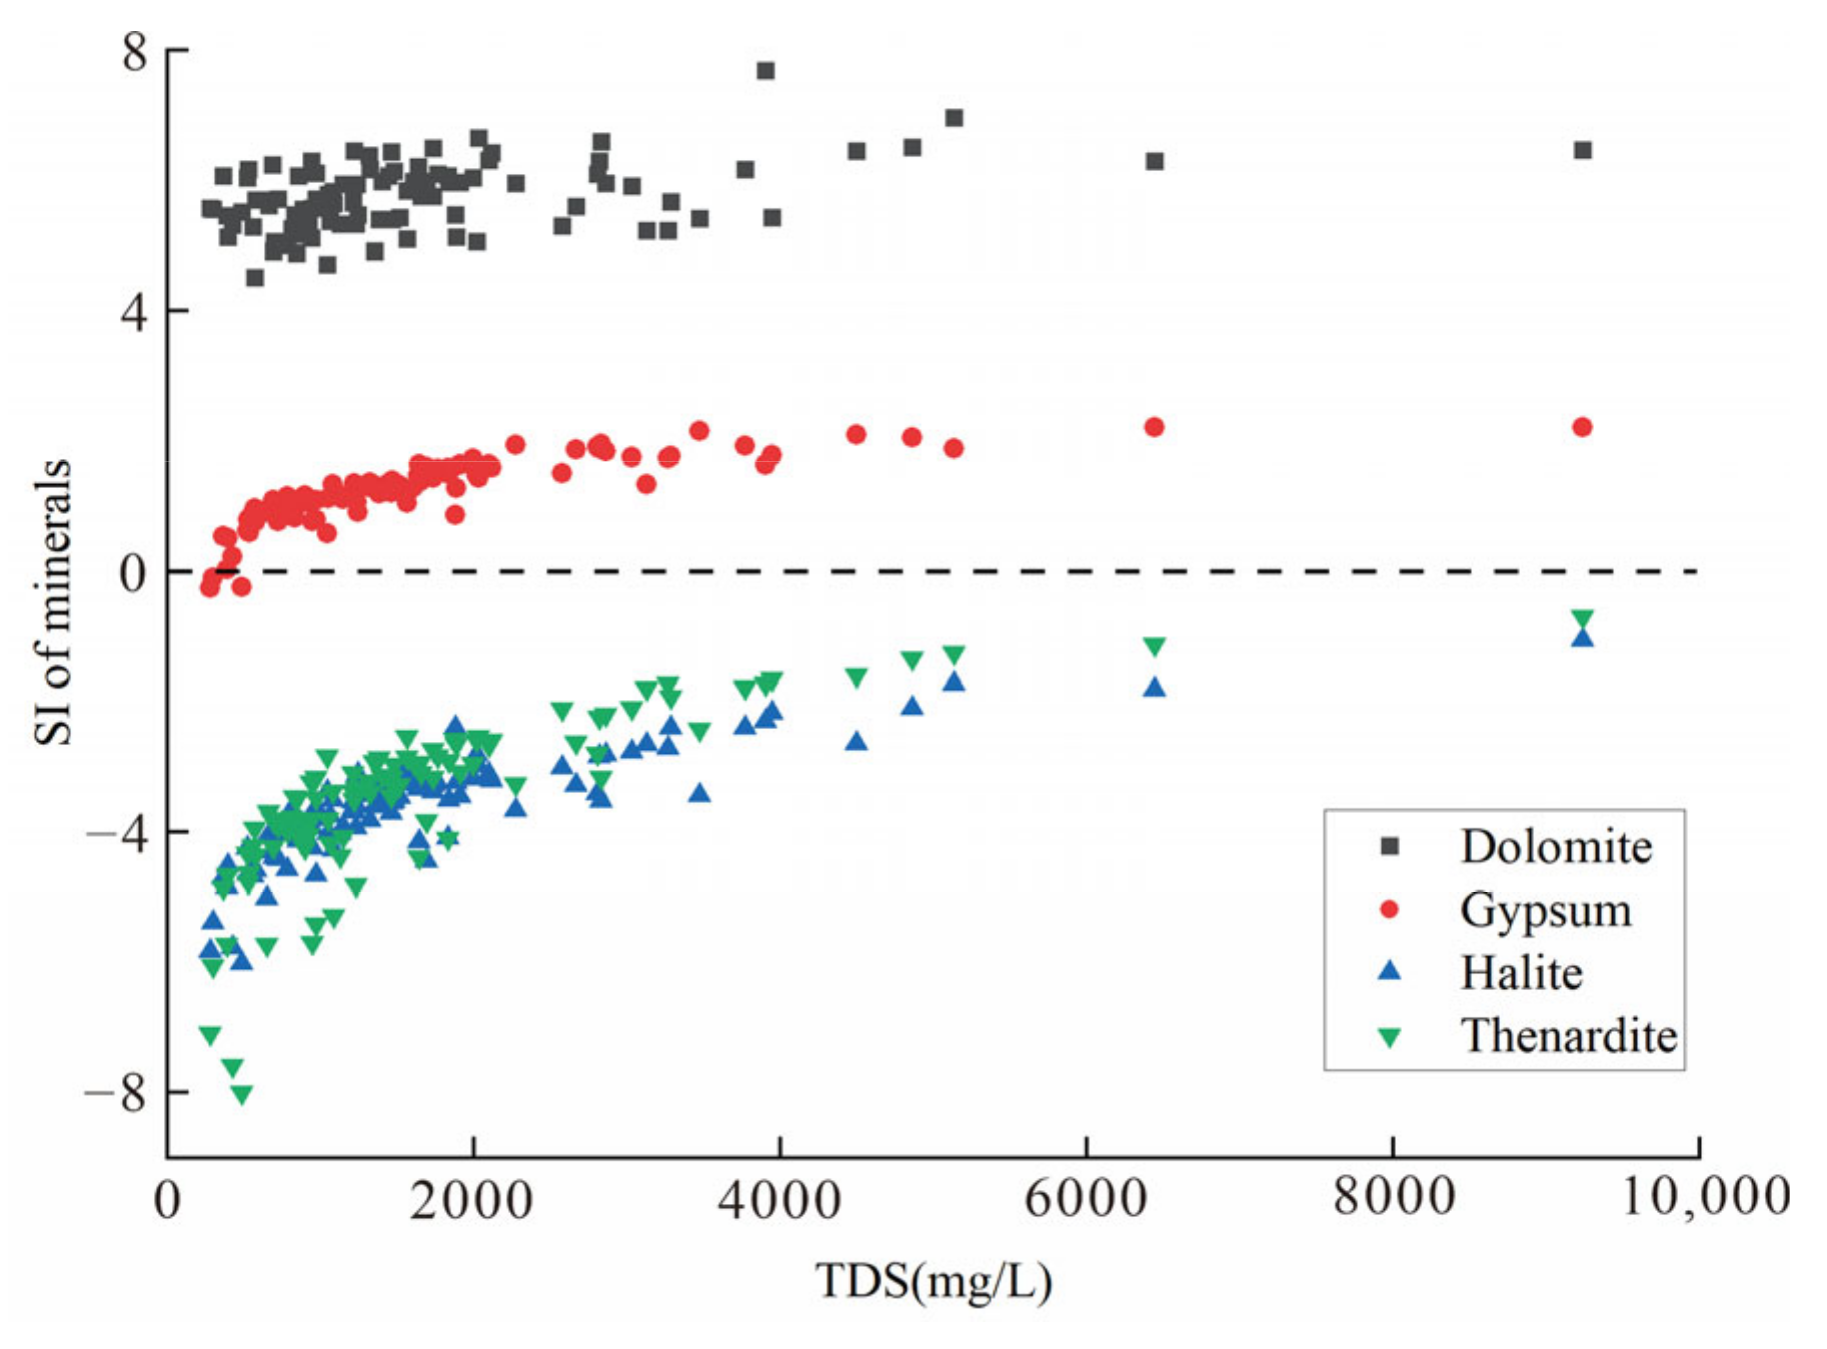
As shown in Figure 5c,d, when the TDS is high, the content of SO42− in groundwater is superior to that of Ca2+ and Mg2+, and the concentration of SO42− and Cl− is very high. As shown in Figure 5e,f, the formation of large amounts of Ca2+ and SO42− in groundwater in the study area contributed to rock weathering and mineral dissolution, and the concentration of SO42− was slightly higher than the concentration of Ca2+. After analyzing the solubility of several minerals (Figure 6), we found that the SI of dolomite and gypsum in the study area was greater than 0, indicating that both minerals were in a saturated state and that the concentration of Ca2+ in groundwater could not continue to increase. The SI of thenardite was less than 0, indicating that thenardite in groundwater was not yet saturated and was in a dissolved state and that SO42− in groundwater could continue to increase. Therefore, the concentration of SO42− in groundwater was higher than that of Ca2+. In addition, besides thenardite, the SI of halite was also less than 0, which was in a dissolved state, leading to the continuous increase in the concentration of SO42−, Na+, and Cl− in groundwater. Therefore, these three ions were the main components of highly mineralized groundwater.

Figure 6.
Variation of saturation indices of several minerals.
4.3.2. Evaporation
Evaporation is an important driving force controlling the formation of the chemical characteristics of groundwater [40]. The altitude of the study area is very high, ranging from 1862 to 4051 m, which leads to very strong lighting in the study area. The depth to the groundwater table in the study area is very shallow, typically ranging from 1 to 10 m. Under the influence of these two factors, the evaporation of groundwater in the study area is very strong. Precipitation in the study area is significantly lower than evaporation. Therefore, due to the continuous dissolution of minerals, the concentration of some ions in areas with poor groundwater mobility increases over time, leading to the formation of highly mineralized groundwater.
4.4. Analysis of the Origin of Nitrates
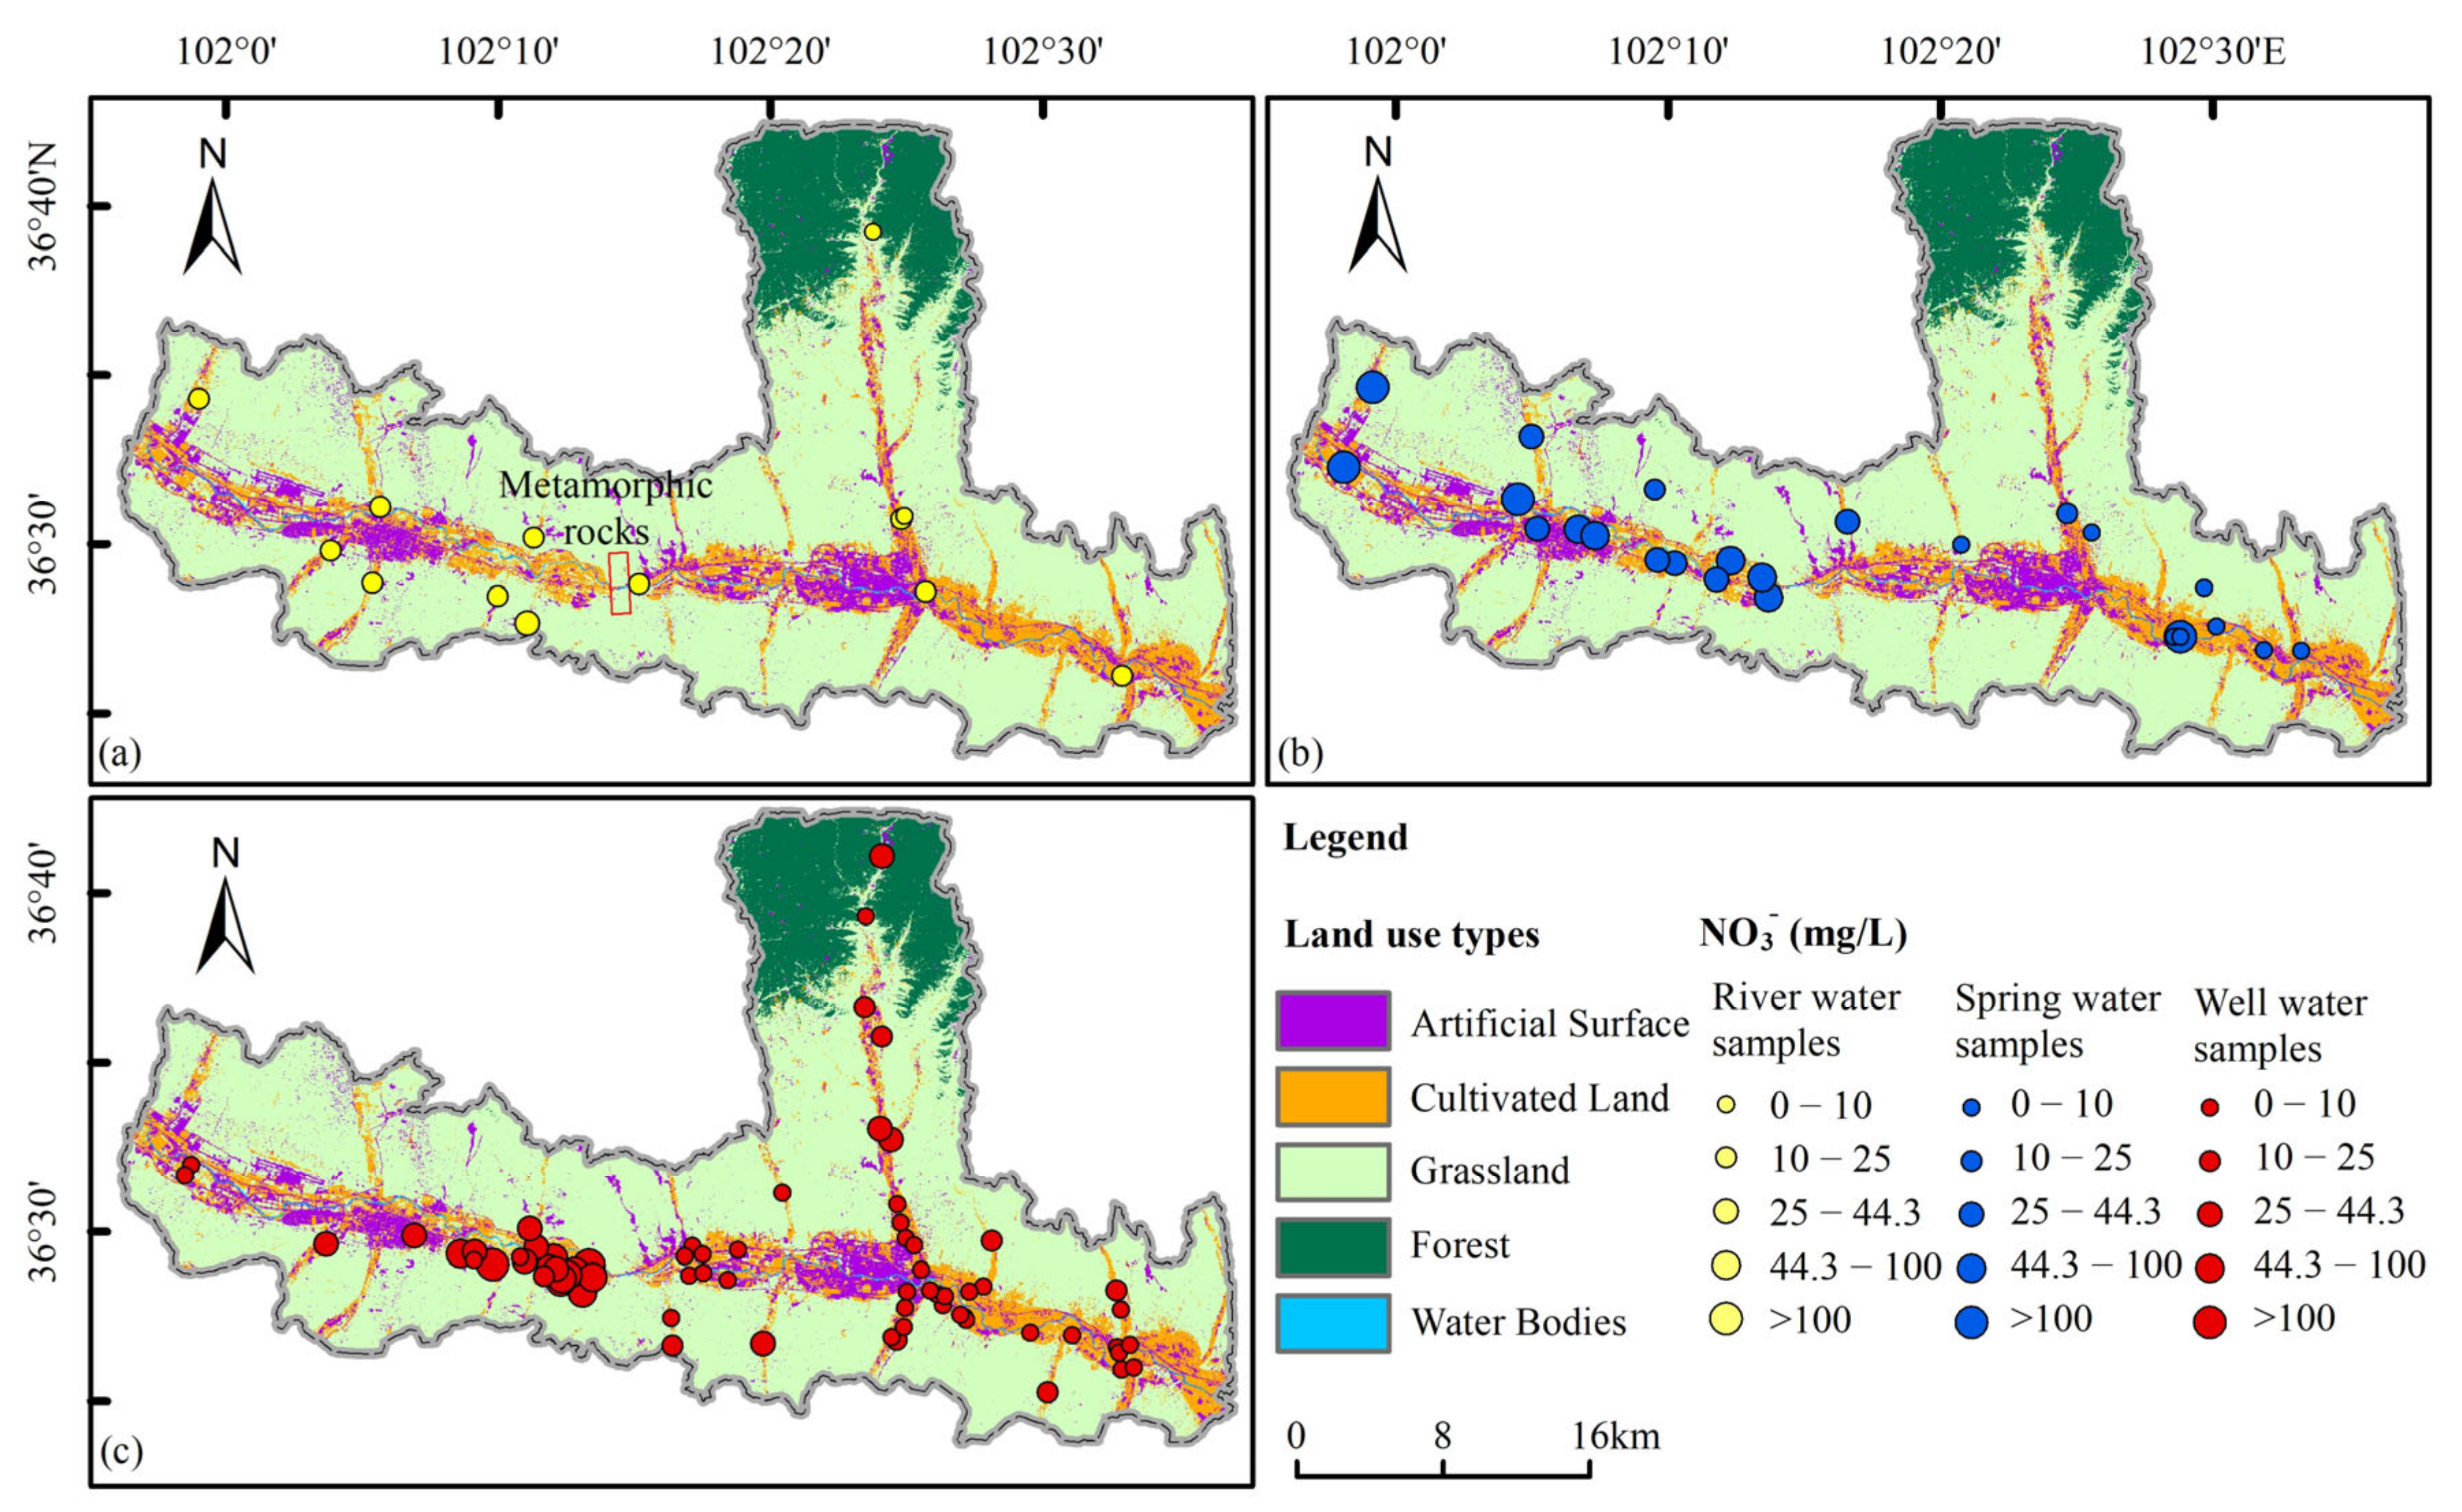
Based on the distribution of nitrate in groundwater (Figure 7), we observed a distinct pattern in the study area (Xiaoxia, highlighted in the red box in Figure 7a). In this area, the nitrate concentration in groundwater on the western side of this area was significantly higher, with a majority of water samples exceeding Chinese drinking water standards. However, on the eastern side of the area, the nitrate concentration in most groundwater samples was considerably lower, well below the Chinese drinking water standards. Upon analyzing the relationship between nitrate distribution in groundwater and land use types, we found that the groundwater with high nitrate concentration in the western part of the study area primarily originates from agricultural and residential areas situated in river valleys. Notably, no industrial wastewater generated by factories was found in this area. Conversely, the nitrate concentration in groundwater was low in the agricultural areas located in the eastern part of the study area. This suggests that agricultural activities and domestic wastewater likely contribute to the origin of nitrate in groundwater.

Figure 7.
Distribution of NO3− and land use types: (a) NO3− in surface water, (b) NO3− in spring water, and (c) NO3− in well water.
However, it is evident that other factors besides these also play a role in the formation of high concentrations of nitrate in groundwater. As metamorphic rocks are impermeable, they act as barriers to the phreatic aquifer, preventing any connection between the groundwater on either side. The aquifer located upstream on the west side of Xiaoxia poses difficulties for the downward flow and discharge of groundwater. Instead, groundwater is primarily discharged through the Huangshui River and through evaporation. Consequently, nitrate generated by agricultural activities has limited mobility into the groundwater. Further analysis of the lithology and geological structure of the study area’s inner strata reveals the presence of metamorphic rocks in the shallow layers in Xiaoxia, whereas pebble layers cover the shallow strata in other areas. In comparison, the aquifer on the east side of Xiaoxia is situated downstream, facilitating unobstructed groundwater flow. Nitrate enters the groundwater and is discharged downstream through runoff, making it challenging to develop groundwater with a high concentration of nitrate.
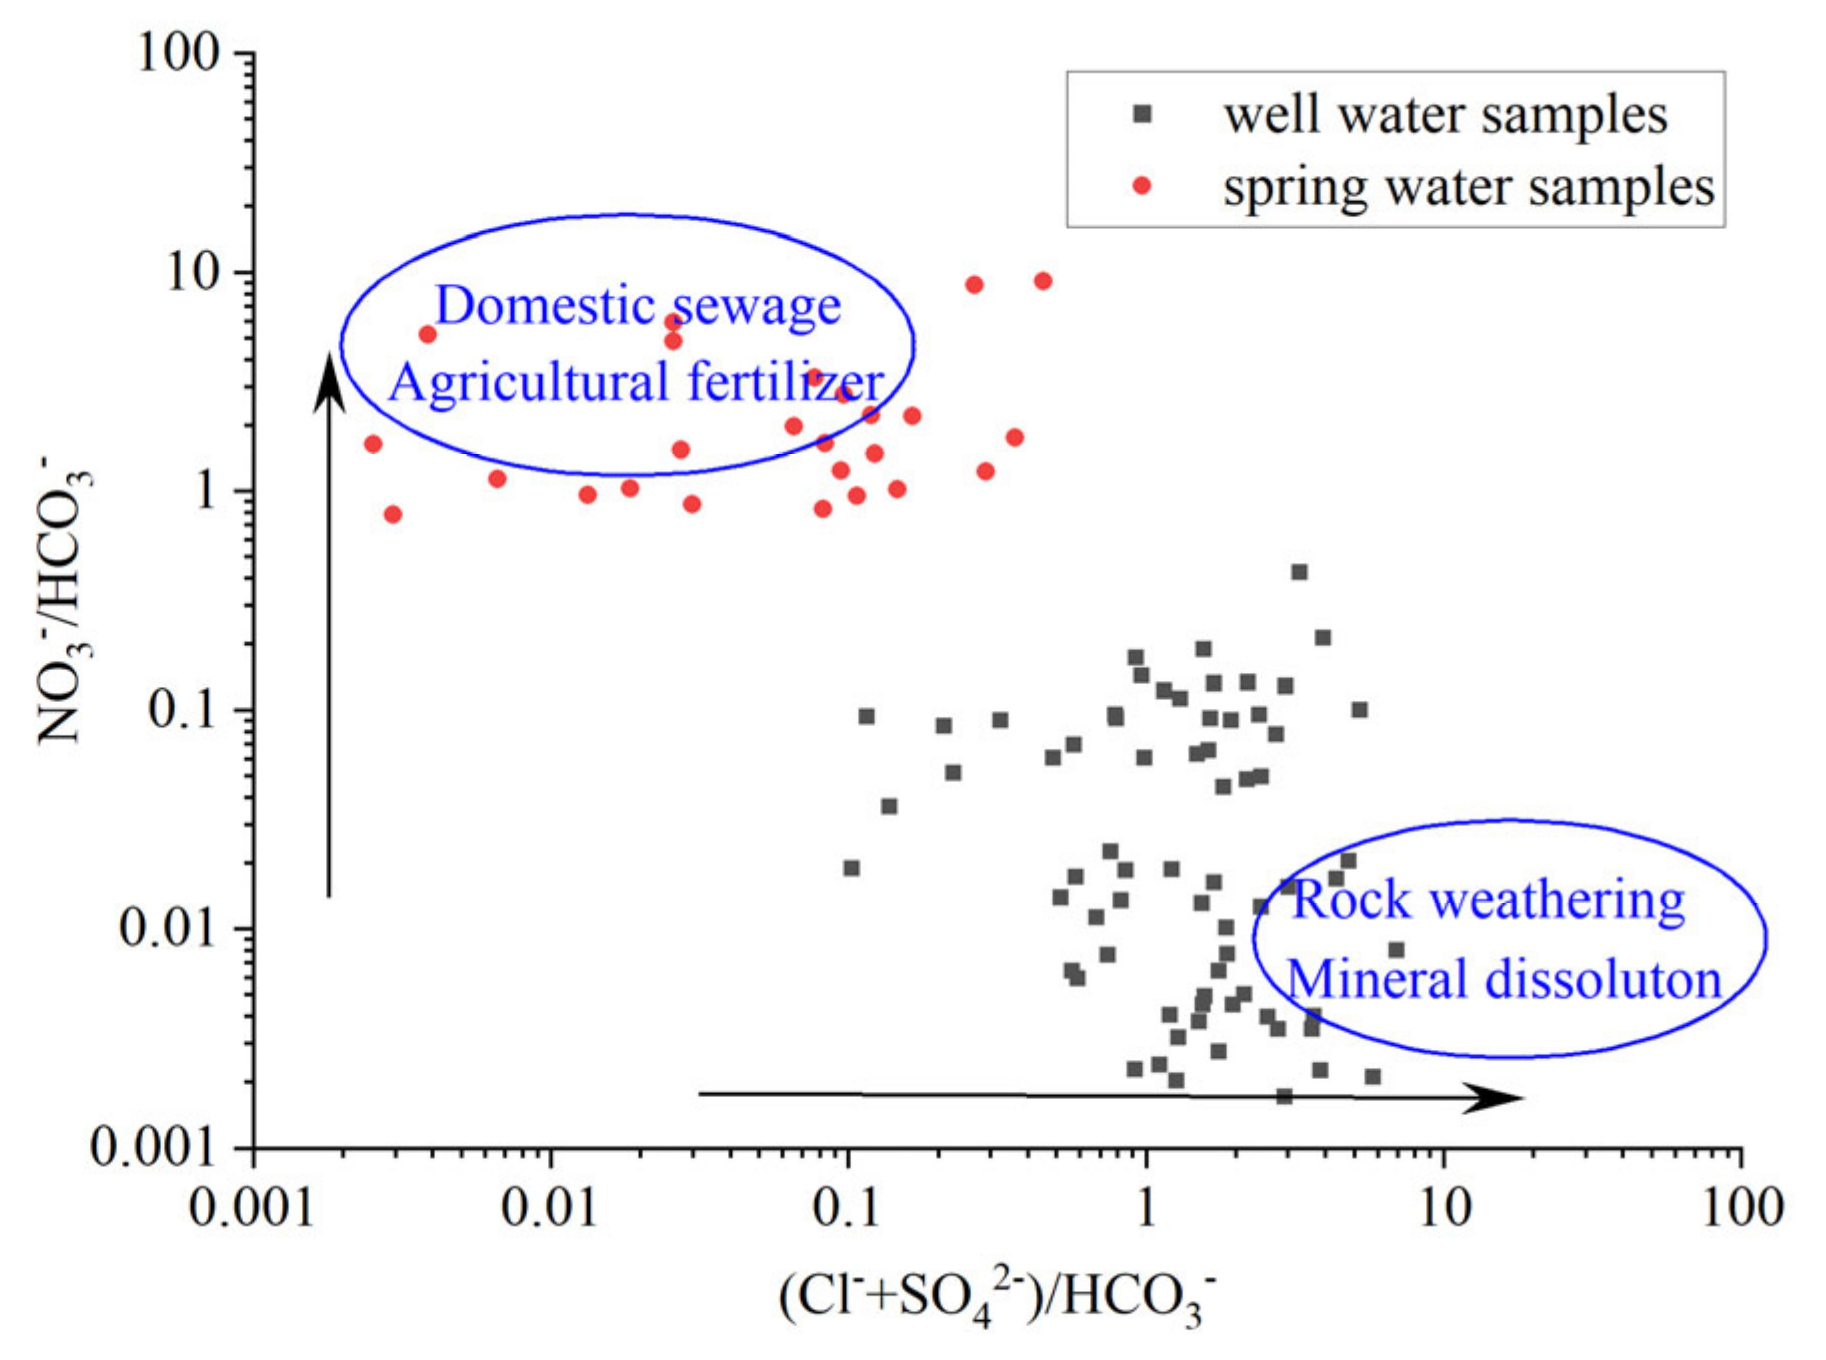
Considering the stable bicarbonate content of groundwater in the study area, we conducted an analysis of the relationship between NO3−/HCO3− and (Cl−+SO42−)/HCO3− in the spring and well water samples (Figure 8). We found that spring water had significantly higher concentrations of NO3− compared to well water. This disparity can primarily be attributed to the thin overlying vadose zone near the spring site, which allows pollutants from the surface, such as agricultural fertilizers, leakage from landfill sites, and domestic sewage, to infiltrate the aquifer more easily, resulting in elevated levels of NO3− in spring water. In contrast, the vadose zone of well water from deeper depths is thicker and offers greater resistance to pollutants. Furthermore, the upper portion of the aquifer in the study area consists of a layer of loess, whereas the soluble sedimentary rocks are located in the lower part of the aquifer. As a result, the chemical characteristics of well water at deeper depths are more significantly influenced by rock weathering and mineral dissolution, so there are higher levels of Cl− and SO42− in well water compared to spring water.
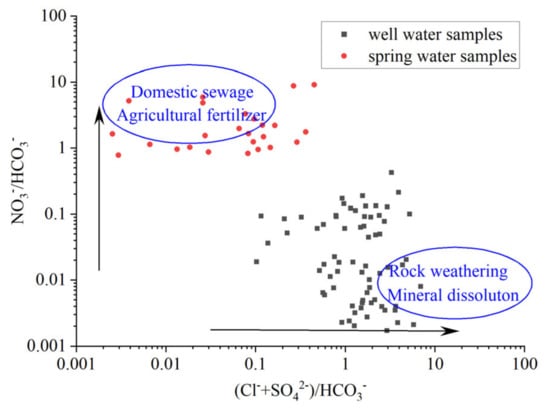
Figure 8.
Plot of NO3−/HCO3− vs. (Cl− + SO42−)/HCO3− in groundwater.
5. Conclusions
This study analyzed the chemical composition of groundwater and river water in Haidong City using hydrochemical methods and multivariate statistical analysis methods. The research results show that the chemical composition of groundwater in Haidong City is very similar to that of river water, indicating frequent water exchange and close connections between the two. Moreover, the concentrations of various chemical components in groundwater are generally high. The levels of Na+, Cl−, SO42−, and TDS in the groundwater are significantly higher, leading to the formation of highly mineralized groundwater in the study area.
The concentration of nitrate in groundwater in some areas is much higher than the Chinese drinking water standards. The groundwater in the study area can be classified into three main types using Piper plots and the Schukalev classification method: HCO3-SO4-Cl-Ca-Na, HCO3-SO4-Ca-Mg, and SO4-Na. According to the Gibbs diagrams, the formation of highly mineralized groundwater is mainly attributed to evaporation, rock weathering, and mineral dissolution. Among them, Na+ mainly comes from thenardite and halite, Cl− mainly comes from halite, and SO42− mainly comes from thenardite and gypsum. Affected by the influence of evaporation, their concentrations are very high. The concentration of HCO3− and Ca2+ in groundwater is relatively uniform, mainly due to their low solubility. By analyzing the relationship between the concentration of nitrate in groundwater and the land use types, we found that the nitrate in groundwater mainly comes from the infiltration of agricultural fertilizers and the discharge of domestic sewage. However, due to the special lithology and geological structure in the study area, special aquifer structural characteristics have formed. The aquifer is blocked by impermeable metamorphic rocks. This limits the connection between upstream and downstream groundwater, causing nitrate to accumulate in higher concentrations in upstream groundwater, whereas downstream aquifers with smoother water flow exhibit lower nitrate concentrations. There is evidence that the nitrate content in spring water is significantly higher than that in well water. This indicates that shallow groundwater is more susceptible to nitrate pollution than deep groundwater, as the overlying zone of shallow groundwater is thinner and has weaker resistance to pollutants.
Author Contributions
L.L., methodology, investigation, writing—original draft; L.Z., C.L. and J.Z., review and supervision; D.W., software and supervision. All authors have read and agreed to the published version of the manuscript.
Funding
This study was supported by a program from Institute of Hydrogeology and Environmental Geology, Chinese Academy of Geological Sciences, the Urban Geological Survey of Haidong City, Qinghai, China (No. Q202217).
Data Availability Statement
Data will be made available on request.
Conflicts of Interest
The authors declare no conflict of interest.
References
- Abbasnia, A.; Yousefi, N.; Mahvi, A.H.; Nabizadeh, R.; Radfard, M.; Yousefi, M.; Alimohammadi, M. Evaluation of groundwater quality using water quality index and its suitability for assessing water for drinking and irrigation purposes: Case study of Sistan and Baluchistan province (Iran). Hum. Ecol. Risk Assess. 2019, 25, 988–1005. [Google Scholar] [CrossRef]
- Li, R. Development and Performance Study of In-Situ Bioremediation Simulation Device for Nitrate Pollution in Groundwater; China University of Geosciences: Beijing, China, 2015. [Google Scholar]
- Qasemi, M.; Farhang, M.; Morovati, M.; Mahmoudi, M.; Ebrahimi, S.; Abedi, A.; Bagheri, J.; Zarei, A.; Bazeli, J.; Afsharnia, M.; et al. Investigation of potential human health risks from fluoride and nitrate via water consumption in Sabzevar, Iran. Int. J. Environ. Anal. Chem. 2022, 102, 307–318. [Google Scholar] [CrossRef]
- Xin, J.; Wang, Y.; Shen, Z.L.; Liu, Y.; Wang, H.T.; Zheng, X.L. Critical review of measures and decision support tools for groundwater nitrate management: A surface-to-groundwater profile perspective. J. Hydrol. 2021, 598, 126386. [Google Scholar] [CrossRef]
- Zhang, Q.Q.; Wang, H.W.; Wang, L. Tracing nitrate pollution sources and transformations in the over-exploited groundwater region of North China using stable isotopes. J. Contam. Hydrol. 2018, 218, 1–9. [Google Scholar] [CrossRef] [PubMed]
- Woodward, S.J.R.; Stenger, R.; Bidwell, V.J. Dynamic analysis of stream flow and water chemistry to infer subsurface water and nitrate fluxes in a lowland dairying catchment. J. Hydrol. 2013, 505, 299–311. [Google Scholar] [CrossRef]
- Sun, R.B.; Ding, J.K.; Li, H.Y.; Wang, X.G.; Li, W.; Li, K.X.; Ye, X.X.; Sun, S.Y. Mitigating nitrate leaching in cropland by enhancing microbial nitrate transformation through the addition of liquid biogas slurry. Agric. Ecosyst. Environ. 2023, 345, 108324. [Google Scholar] [CrossRef]
- Chen, R.D.; Hu, Q.H.; Shen, W.Q.; Guo, J.X.; Yang, L.; Yuan, Q.Q.; Lu, X.M.; Wang, L.C. Identification of nitrate sources of groundwater and rivers in complex urban environments based on isotopic and hydro-chemical evidence. Sci. Total Environ. 2023, 871, 162026. [Google Scholar] [CrossRef] [PubMed]
- Cao, X.; Shi, Y.Y.; Wei, H.; An, T.Y.; Chen, X.R.; Zhang, Z.H.; Liu, F.; Zhao, Y.; Zhou, P.P.; Chen, C.B.; et al. Impacts of anthropogenic groundwater recharge (AGR) on nitrate dynamics in a phreatic aquifer revealed by hydrochemical and isotopic technologies. Sci. Total Environ. 2022, 839, 156187. [Google Scholar] [CrossRef]
- Adimalla, N.; Qian, H. Groundwater chemistry, distribution and potential health risk appraisal of nitrate enriched groundwater: A case study from the semi-urban region of South India. Ecotoxicol. Environ. Saf. 2021, 207, 111277. [Google Scholar] [CrossRef]
- Gu, B.; Ge, Y.; Chang, S.; Luo, W.; Chang, J. Nitrate in groundwater of China: Sources and driving forces. Glob. Environ. Chang. Part A Hum. Policy Dimens. 2013, 23, 1112–1121. [Google Scholar] [CrossRef]
- Panahi, G.; Eskafi, M.H.; Rahimi, H.; Faridhosseini, A.; Tang, X.N. Physical–chemical evaluation of groundwater quality in semi-arid areas: Case study—Sabzevar plain, Iran. Sustain. Water Resour. Manag. 2021, 7, 2363–5037. [Google Scholar] [CrossRef]
- Zhai, Y.; Zheng, F.; Zhao, X.; Xia, X.; Teng, Y. Identification of hydrochemical genesis and screening of typical groundwater pollutants impacting human health: A case study in Northeast China (Article). Environ. Pollut. 2019, 252, 1202–1215. [Google Scholar] [CrossRef] [PubMed]
- He, S.; Wu, J.H.; Wang, D.; He, X.D. Predictive modeling of groundwater nitrate pollution and evaluating its main impact factors using random forest. Chemosphere 2022, 290, 133388. [Google Scholar] [CrossRef] [PubMed]
- Han, D.M.; Currell, M.J.; Cao, G.L. Deep challenges for China’s war on water pollution. Environ. Pollut. 2016, 218, 1222–1233. [Google Scholar] [CrossRef] [PubMed]
- Kazakis, N.; Voudouris, K.S. Groundwater vulnerability and pollution risk assessment of porous aquifers to nitrate: Modifying the DRASTIC method using quantitative parameters. J. Hydrol. 2015, 525, 13–25. [Google Scholar] [CrossRef]
- Wang, C.; Wang, X.; Zhang, G.; Zhang, F.; Li, J.; Chen, S.; Sauvage, S.; Sánchez-Pérez, J.-M.; Han, Y.; Liu, J. Identification of critical effect factors for prediction of spatial and intra-annual variability of shallow groundwater nitrate in agricultural areas. Sci. Total Environ. 2023, 891, 164342. [Google Scholar] [CrossRef] [PubMed]
- Wang, D.; Li, P.; Mu, D.; Liu, W.; Chen, Y.; Fida, M. Unveiling the biogeochemical mechanism of nitrate in the vadose zone-groundwater system: Insights from integrated microbiology, isotope techniques, and hydrogeochemistry. Sci. Total Environ. 2023, 906, 167481. [Google Scholar] [CrossRef] [PubMed]
- Feng, W.W.; Wang, C.; Lei, X.H.; Wang, H.; Zhang, X.L. Distribution of nitrate content in groundwater and evaluation of potential health risks: A case study of rural areas in northern China. Int. J. Environ. Res. Public Health 2020, 17, 9390. [Google Scholar] [CrossRef]
- Liu, L.N.; Wu, J.H.; He, S.; Wang, L. Occurrence and distribution of groundwater fluoride and manganese in the Weining Plain (China) and their probabilistic health risk quantification. Expo. Health 2022, 14, 263–279. [Google Scholar] [CrossRef]
- Tang, W.Z.; Pei, Y.S.; Zheng, H.; Zhao, Y.; Shu, L.M.; Zhang, H. Twenty years of China’s water pollution control: Experiences and challenges. Chemosphere 2022, 295, 133875. [Google Scholar] [CrossRef]
- Wen, X.H.; Feng, Q.; Lu, J.; Wu, J.; Wu, M.; Guo, X.Y. Risk assessment and source identification of coastal groundwater nitrate in northern China using dual nitrate isotopes combined with Bayesian mixing model. Hum. Ecol. Risk Assess. 2018, 24, 1043–1057. [Google Scholar] [CrossRef]
- Wu, J.; Zhao, W.D.; Lu, J.; Jin, S.; Wang, J.Q.; Qian, J.Z. Geographic information system based approach for the investigation of groundwater nitrogen pollution near a closed old landfill site in Beijing, China. Environ. Eng. Manag. J. 2018, 17, 1095–1101. [Google Scholar]
- Zhang, X.; Zhang, Y.; Shi, P.; Bi, Z.L.; Shan, Z.X.; Ren, L.J. The deep challenge of nitrate pollution in river water of China. Sci. Total Environ. 2021, 770, 144674. [Google Scholar] [CrossRef]
- Wang, M.; Janssen, A.B.G.; Bazin, J.; Strokal, M.; Ma, L.; Kroeze, C. Accounting for interactions between Sustainable Development Goals is essential for water pollution control in China. Nat. Commun. 2022, 13, 730. [Google Scholar] [CrossRef]
- Dragon, K.; Gorski, J. Identification of groundwater chemistry origins in a regional aquifer system (Wielkopolska region, Poland). Environ. Earth Sci. 2015, 73, 2153–2167. [Google Scholar] [CrossRef]
- Xiao, Y.; Liu, K.; Hao, Q.C.; Xiao, D.; Zhu, Y.C.; Yin, S.Y.; Zhang, Y.H. Hydrogeochemical insights into the signatures, genesis and sustainable perspective of nitrate enriched groundwater in the piedmont of Hutuo watershed, China. Catena 2022, 212, 106020. [Google Scholar] [CrossRef]
- Erostate, M.; Huneau, F.; Garel, E.; Lehmann, M.F.; Kuhn, T.; Aquilina, L.; Vergnaud-Ayraud, V.; Labasque, T.; Santoni, S.; Robert, S.; et al. Delayed nitrate dispersion within a coastal aquifer provides constraints on land-use evolution and nitrate contamination in the past. Sci. Total Environ. 2018, 644, 928–940. [Google Scholar] [CrossRef] [PubMed]
- Nestler, A.; Berglund, M.; Accoe, F.; Duta, S.; Xue, D.; Boeckx, P.; Taylor, P. Isotopes for improved management of nitrate pollution in aqueous resources: Review of surface water field studies. Environ. Sci. Pollut. Res. 2011, 18, 519–533. [Google Scholar] [CrossRef] [PubMed]
- Taufiq, A.; Effendi, A.J.; Iskandar, I. Controlling factors and driving mechanisms of nitrate contamination in groundwater system of Bandung Basin, Indonesia, deduced by combined use of stable isotope ratios, CFC age dating, and socioeconomic parameters. Water Res. 2019, 148, 292–305. [Google Scholar] [CrossRef] [PubMed]
- Lahjouj, A.; El Hmaidi, A.; Bouhafa, K. Spatial and statistical assessment of nitrate contamination in groundwater: Case of sais basin, Morocco. J. Groundw. Sci. Eng. 2020, 8, 143–157. [Google Scholar]
- Wang, D.; Zhang, L.; Pei, L.; Li, X.; Yang, Y.; Chen, Z.; Liang, L. Chemical Characteristics and Controlling Factors of Shallow Groundwater in the Lower Reaches of Changhua River Basin, Hainan Island, China. Water 2023, 15, 3508. [Google Scholar] [CrossRef]
- Jiao, Z.R. Research on Evolution of Groundwater Chemical Characteristics of Ledu Basin in the Eastern Qinhai Province; Hebei University of Geosciences: Shijiazhuang, China, 2018. [Google Scholar]
- Liu, Q. The Groundwater Chemical Characteristics in Ping′an Basin in East Qinghai Province; Hebei University of Geosciences: Shijiazhuang, China, 2018. [Google Scholar]
- Su, H.; Kang, W.D.; Li, Y.R.; Li, Z. Fluoride and nitrate contamination of groundwater in the Loess Plateau, China: Sources and related human health risks. Environ. Pollut. 2021, 286, 117287. [Google Scholar] [CrossRef] [PubMed]
- Farnham, I.M.; Johannesson, K.H.; Singh, A.K.; Hodge, V.F.; Stetzenbach, K.J. Factor analytical approaches for evaluating groundwater trace element chemistry data. Anal. Chim. Acta 2003, 490, 123–138. [Google Scholar] [CrossRef]
- GB 5749-2022; Standards for Drinking Water Quality. Standardization Administration of the People’s Republic of China: Beijing, China, 2022.
- Gibbs, R.J. Mechanisms controlling world water chemistry. Science 1970, 170, 1088–1090. [Google Scholar] [CrossRef]
- Saikrishna, K.; Purushotham, D.; Sunitha, V.; Reddy, Y.S.; Brahmaiah, T.; Reddy, B.M.; Nallusamy, B. Deciphering groundwater quality, mechanisms controlling groundwater chemistry in and around Suryapet, Telangana, South India. Total Environ. Res. Themes 2023, 6, 100035. [Google Scholar] [CrossRef]
- Zhang, H.Y.; Han, X.; Wang, G.C.; Mao, H.R.; Chen, X.L.; Zhou, L.; Huang, D.D.; Zhang, F.; Yan, X. Spatial distribution and driving factors of groundwater chemistry and pollution in an oil production region in the Northwest China. Sci. Total Environ. 2023, 875, 162635. [Google Scholar] [CrossRef]

Disclaimer/Publisher’s Note: The statements, opinions and data contained in all publications are solely those of the individual author(s) and contributor(s) and not of MDPI and/or the editor(s). MDPI and/or the editor(s) disclaim responsibility for any injury to people or property resulting from any ideas, methods, instructions or products referred to in the content. |
© 2023 by the authors. Licensee MDPI, Basel, Switzerland. This article is an open access article distributed under the terms and conditions of the Creative Commons Attribution (CC BY) license (https://creativecommons.org/licenses/by/4.0/).