Article

Coastal Water Clarity in Shenzhen: Assessment of Observations from Sentinel-2

1
Center for Geo-Spatial Information, Shenzhen Institute of Advanced Technology, Chinese Academy of Sciences, Shenzhen 518055, China
2
Shenzhen Engineering Laboratory of Ocean Environmental Big Data Analysis and Application, Shenzhen 518055, China
*
Author to whom correspondence should be addressed.
Water 2023, 15(23), 4102; https://doi.org/10.3390/w15234102
Submission received: 26 October 2023 / Revised: 21 November 2023 / Accepted: 22 November 2023 / Published: 27 November 2023
(This article belongs to the Special Issue Application of GRACE Observations in Water Cycle and Climate Change)

Abstract

:
Shenzhen is a crucial city in the Guangdong–Hong Kong–Macao Greater Bay Area (GBA). With high-intensity land development and rapid population growth, the ocean has become an essential space for expansion, leading to significant variations in water quality in the coastal area of Shenzhen. Water clarity (Zsd) is a key indicator for evaluating water quality. We applied the quasi-analytical algorithm (QAA) to Sentinel-2 data and retrieved the Zsd of the coastal area of Shenzhen. By adjusting the red band for distinguishing water types, we avoided underestimating Zsd for clear water. This study pioneered the production of a 10 m Zsd product for the coastal area of Shenzhen from 2016 to 2021. The results showed that the coastal area of Shenzhen exhibited a spatial distribution pattern with low Zsd in the west and high in the east, with Pearl River Estuary (PRE: 0.41–0.67 m) and Shenzhen Bay (SZB: 0.30–0.58 m) being lower than Dapeng Bay (DPB: 2.7–2.9 m) and Daya Bay (DYB: 2.5–2.9 m). We analyzed the seasonal and interannual variations and driving factors of the four areas, where PRE and SZB showed similar variation patterns, while DPB and DYB showed similar variation patterns. PRE and SZB are important estuaries in southern China, significantly affected by anthropogenic activities. DPB and DYB are important marine aquaculture areas, mainly affected by natural factors (wind speed, precipitation, and sea level). The Zsd of the coastal area of Shenzhen, along with the analysis of its results and driving factors, contributes to promoting local water resource protection and providing a reference for formulating relevant governance policies. It also provides a practical method for assessing and monitoring near-shore water quality.

1. Introduction

1.1. Background

Shenzhen, located in the South China Plain of China, is an important city in the GBA agglomeration. The western part of Shenzhen is adjacent to the PRE, SZB, and Lingdingyang Estuary (LDYE). The eastern part of Shenzhen is adjacent to the DPB and DYB, with a vast water area and rich marine resources. As a coastal city with scenic beauty, the water quality variations in the coastal area of Shenzhen are attributed to anthropogenic and urbanization activities. Decades of rapid development and urbanization have resulted in an overload of pollutant emissions, accelerating the deterioration of the coastal area of Shenzhen, causing shortages in water resources and affecting local development [1]. For example, plenty of marine pollution incidents—such as red tides and oil spills—have been reported in PRE and DYB [2,3]. Therefore, sustainable and daily monitoring of the coastal area is increasingly important for the environmental protection of Shenzhen, in order to ensure the life quality of its residents.
Water clarity provides visual perception of and vital information on the quality of aquatic ecosystems. At present, some parameters can quantitatively express Zsd. Previous studies have obtained Zsd by measuring the depth of the Secchi disk [4,5,6,7]. Because Zsd and underwater light field variations are closely related to optically active components, Zsd is considered a good indicator for evaluating water quality [8,9,10]. Moreover, on-site data acquisition is limited, making it difficult to analyze the spatiotemporal variations of Zsd in large-scale water [11]. To make up for the disadvantages of general methods, remote sensing technology compensates for the limitations of traditional ship survey methods with its advantages of continuous, large-scale monitoring, and low economic cost.

1.2. Status of Research

Various optical satellites have been launched over time, which can provide research data for time series monitoring of the spatiotemporal variations of Zsd. Commonly used optical satellites include the Coastal Zone Color Scanner (CZCS), Medium Resolution Spectro Radiometer (MERIS), Sea Viewing Wide Field of View Sensor (SeaWiFS), Sentinel-2 (Sentinel-2A and 2B), Landsat series (Thermal Mapper (TM), Enhanced Thermal Mapper Plus (ETM+), Operational Land Image (OLI), and GF series (GF-1, GF-2, GF-5, and GF-6). Due to its wide coverage and high temporal resolution, MODIS has been widely used for analyzing the spatiotemporal variations of water quality in large-scale water [10,12,13,14,15,16]. However, its spatial resolution is low, making it impossible to research small water. Landsat satellites have high spatial resolution and long time series, and have been widely used for studying temporal variations in small water [17,18,19,20,21,22,23,24]. However, their temporal resolution is low, making it difficult to research seasonal variations. Sentinel-2 not only covers a wide range, but also has high spatiotemporal resolutions, and, hence, has been widely used in the study of small water [25,26,27,28,29].
Rodrigues et al. (2017) proposed a new Zsd model based on Landsat8 OLI and Sentinel-2 monitoring, which was applied to a reservoir in Brazil [30]. Zhao et al. (2021) used the Zsd model proposed by Wang et al. (2020) to monitor the spatiotemporal variations and driving factors of Zsd in the Yangtze River mainstream from 2017 to 2020, through Sentinel-2 [15,26]. Qiu et al. (2023) monitored the variations of Zsd in lakes and reservoirs larger than 1 km2 in Hainan Province, from 2017 to 2021, using improved QAA and Sentinel-2 [25]. Xie et al. (2022) observed the variations of phytoplankton biomass in Daheiting Reservoir after the removal of cages through Sentinel-2 [31]. Zhao et al. (2023) analyzed the water color variations of 41 lakes and reservoirs in Guangzhou and Shenzhen from 2016 to 2021, through Sentinel-2 [29]. Li et al. (2021) combined Landsat8 OLI and Sentinel-2 to monitor the seasonal variations of suspended particle matter (SPM) at abandoned distributary mouths in the Yellow River Delta [32]. Zhao et al. (2021) used Sentinel-2 to analyze the variations in water color after the establishment of Baiyangdian Lake in Xiongan New Area [27].

1.3. Purpose of this Study

Numerous previous studies have analyzed water in the coastal area of Shenzhen, especially PRE. For example, in turbid PRE, the research and evaluation of SPM were performed using retrieval algorithms and remote sensing data, including its long-term variations and driving factors [18,19,33,34,35,36,37,38]. Nazeer et al. (2016) proposed a Chla prediction and classification model using remote sensing data for PRE with complex optical characteristics [39,40]. Ma et al. (2022) used Machine Learning and MODIS to retrieve the Chla of PRE, and conducted research on long-term variations [41]. These studies focused on the variations in the water quality of PRE in terms of spatial distribution and interannual variations; however, limited research exists on the spatiotemporal seasonal variations in water quality near Shenzhen.
Given the urgent local needs, this study investigates the spatiotemporal variations and driving factors of Zsd in the coastal area of Shenzhen. The study aims to achieve the following objectives: (1) To construct a Zsd retrieval model for the coastal area of Shenzhen based on Sentinel-2, and to distinguish clean and turbid water using the red band to avoid the underestimation of clean water. (2) Using the model proposed in this study, to evaluate the spatiotemporal variations of Zsd for the period of 2016–2021. (3) Analyze the relationship between Zsd and several key natural factors (precipitation, wind speed, and sea level).

2. Materials and Method
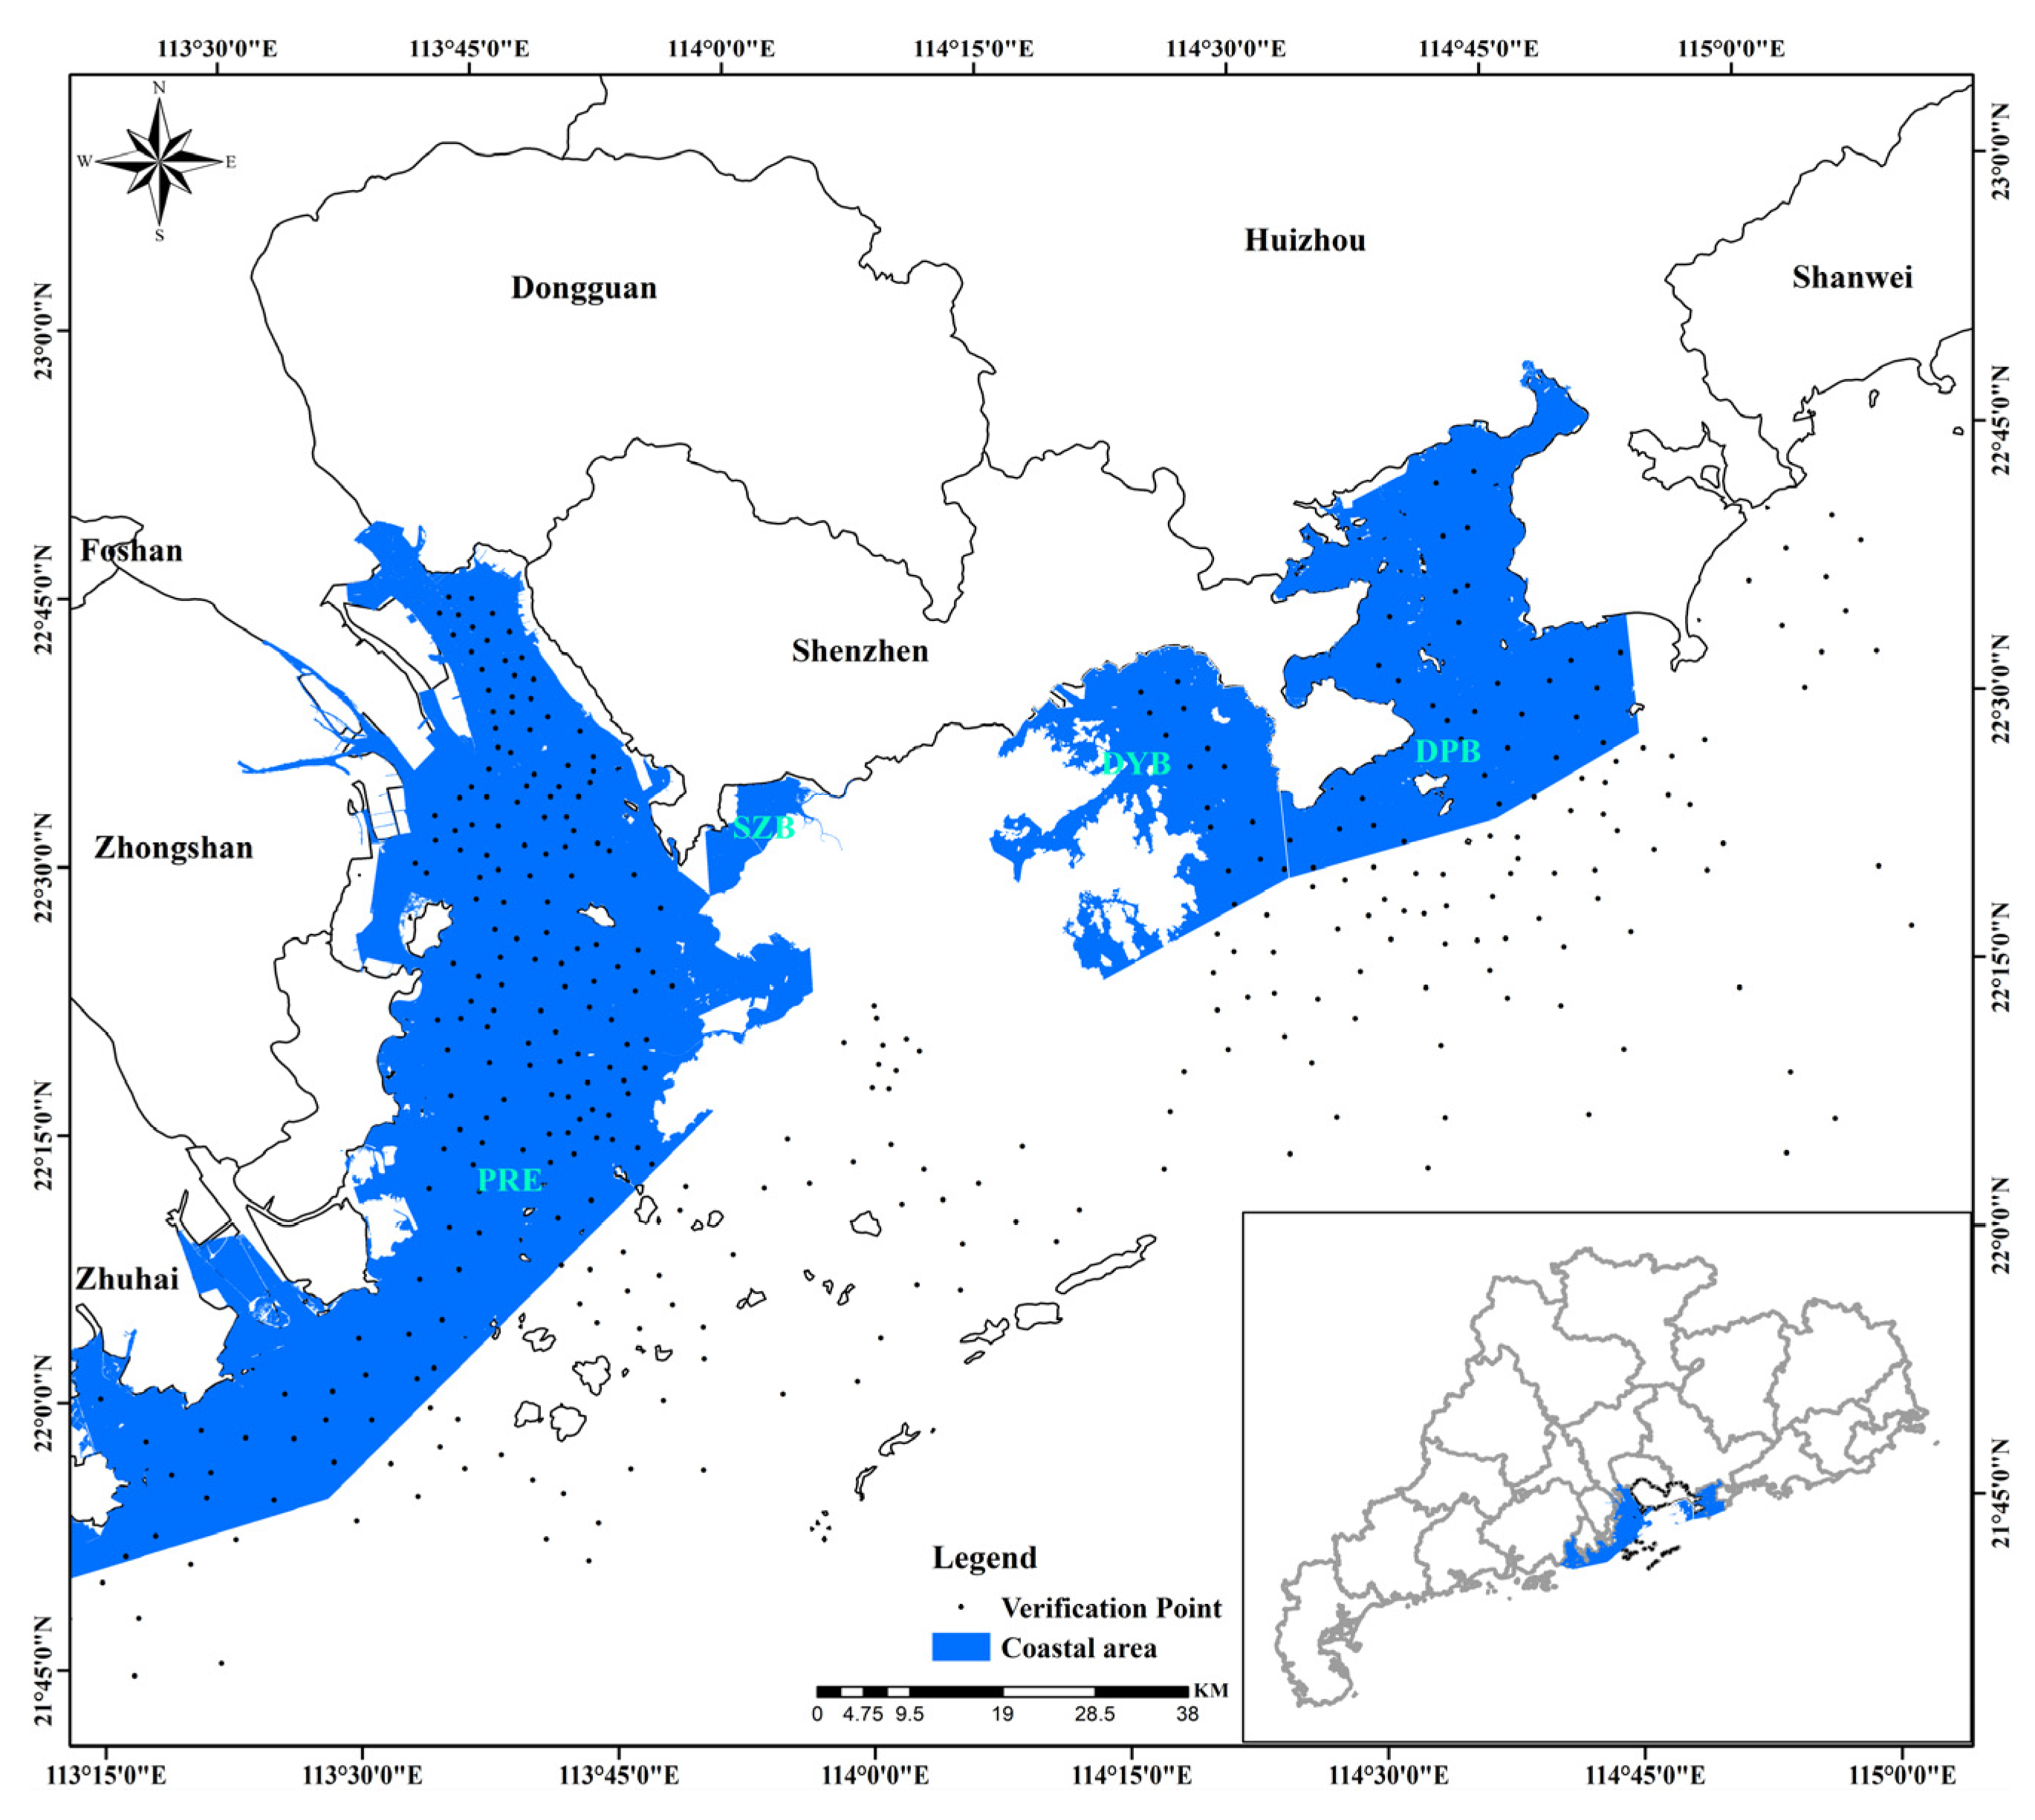
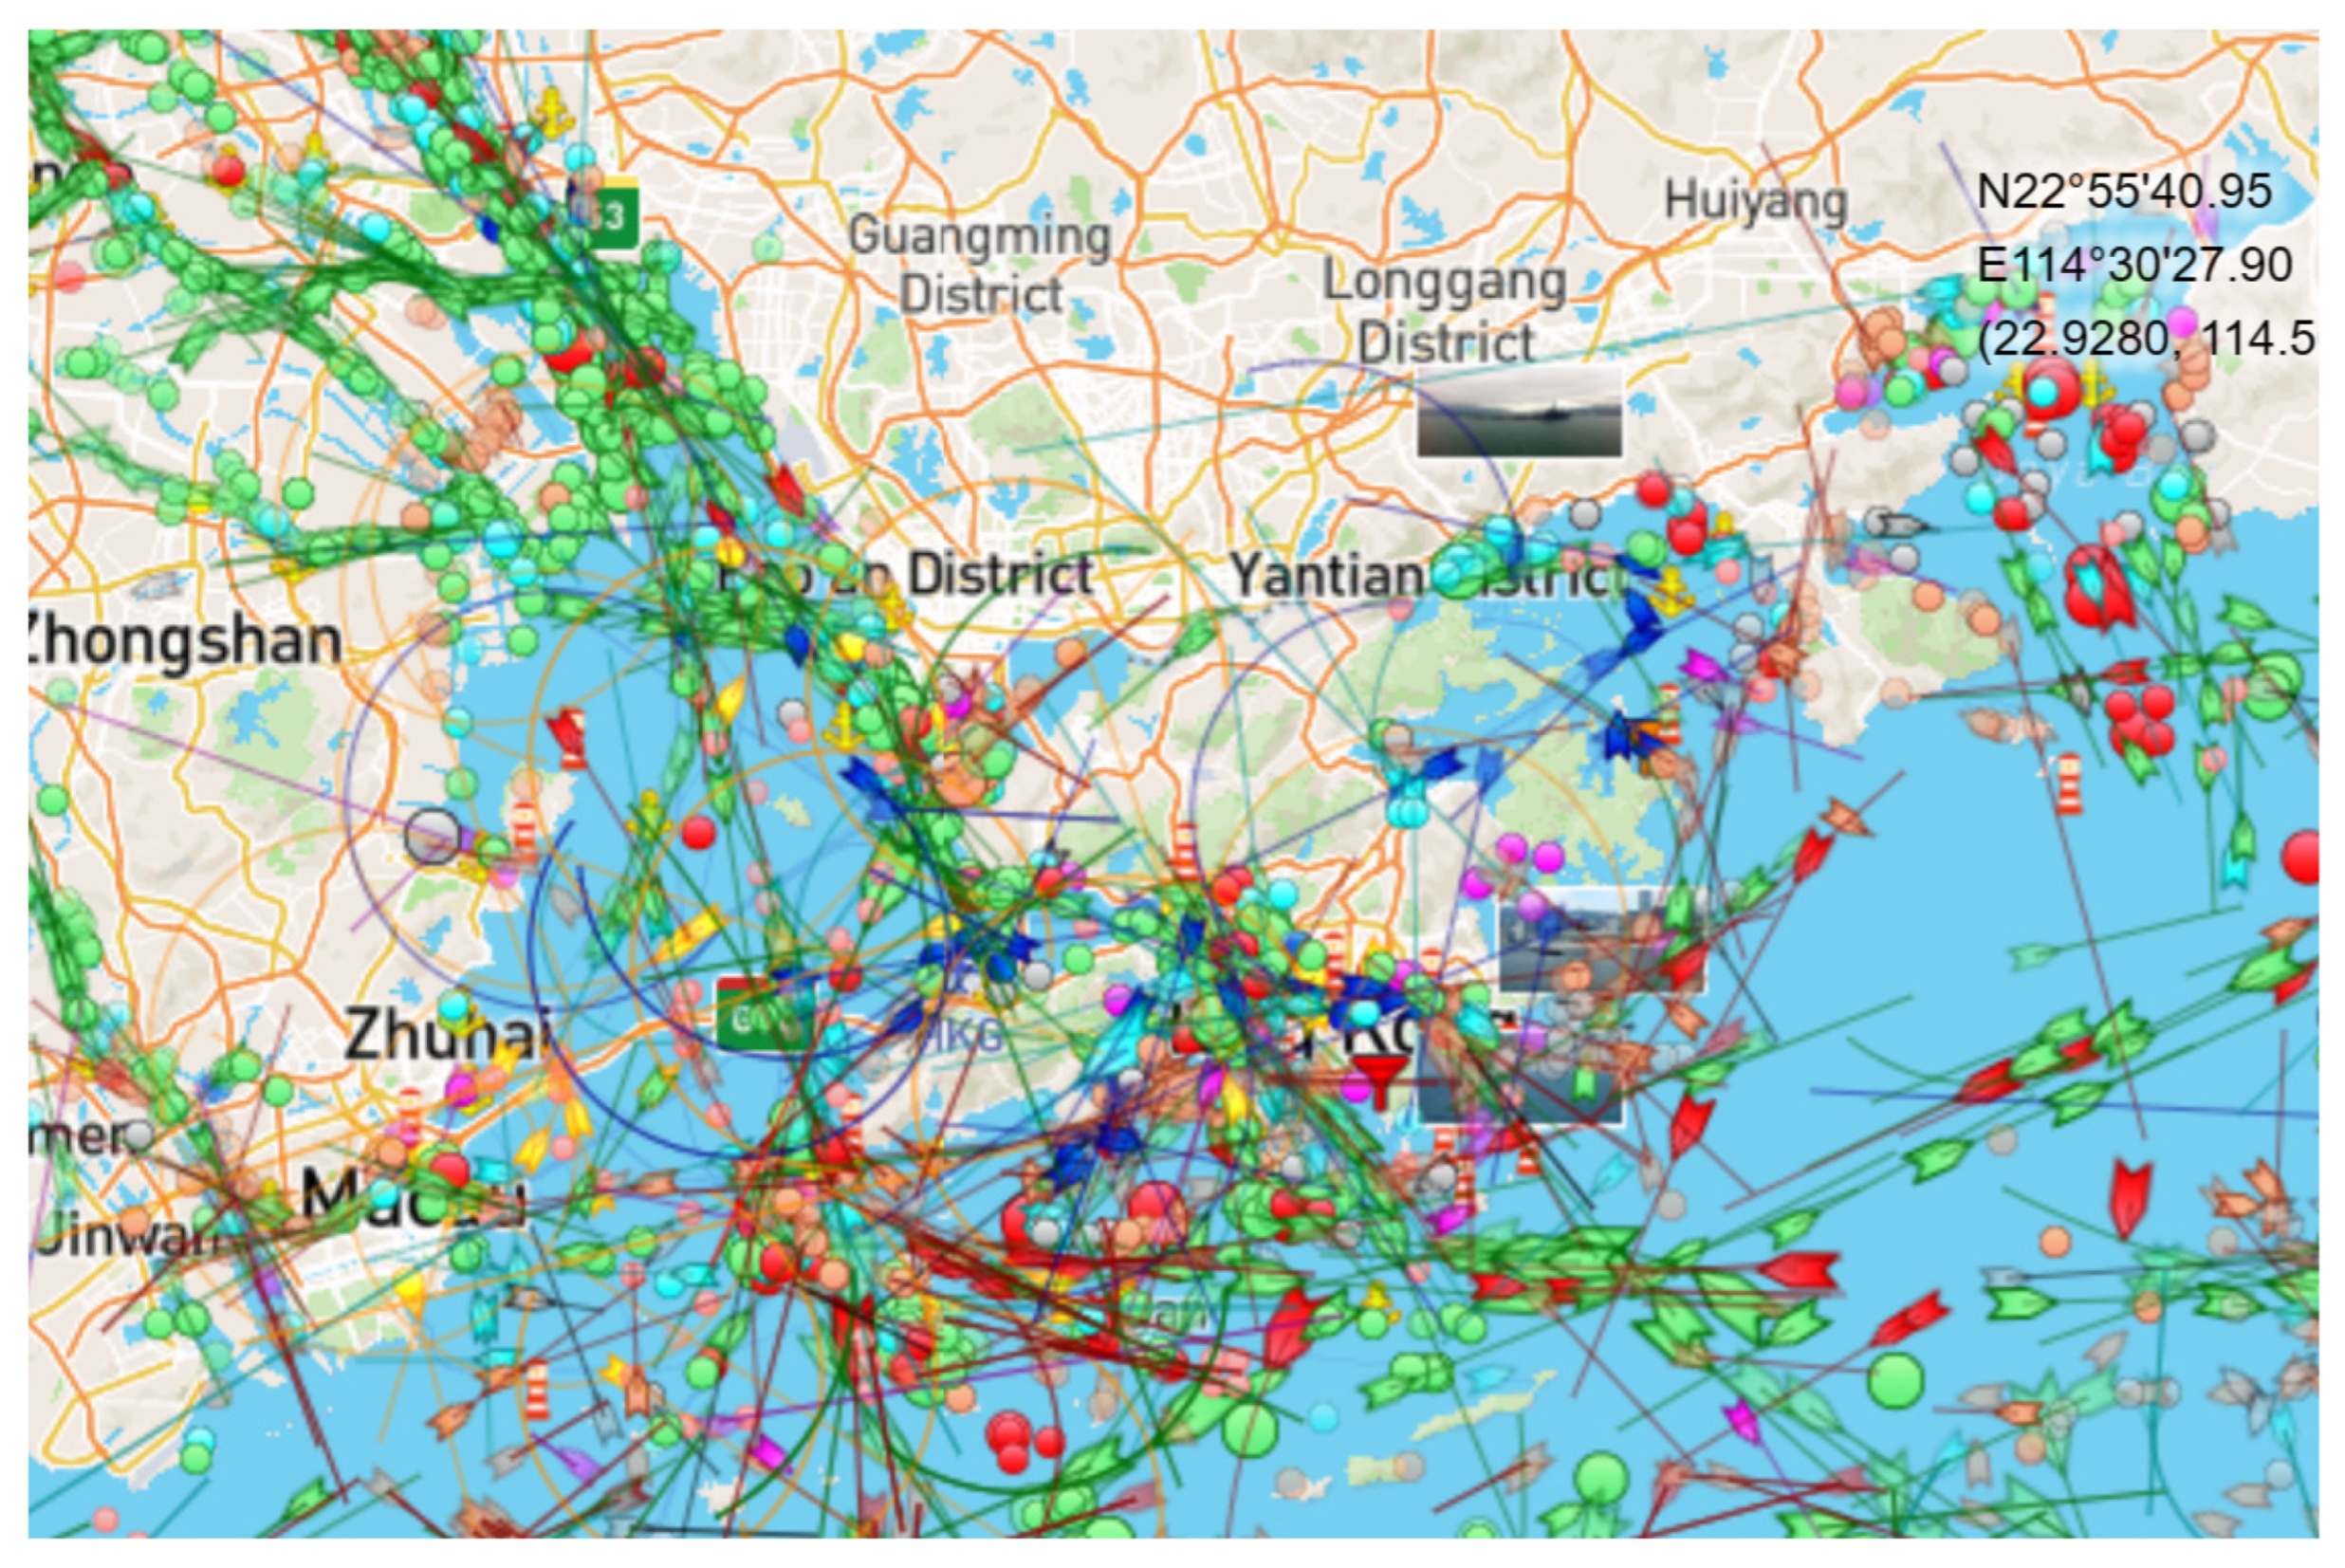
2.1. Study Area

Shenzhen is an important port located in southeastern China. It is also an important industrial maritime core city in China. Shenzhen is adjacent to PRE and LDYE in the west and includes DYB and DPB in the east, with a vast water area under its jurisdiction. PRE is China’s second estuary (runoff) and an important waterway. The PRE, with a total length of approximately 22.6 km and a drainage area of about 4.53 × 10⁵ km2, is the largest basin in southern China. The PRE mainly comprises the West, North, and East Rivers. These rivers flow into the South China Sea through eight western outlets (see in Figure 1). The water quality of both DYB and DPB is the best in Guangdong province. With an excellent geographical location, they are natural ports, scenic tourist areas, and aquaculture areas. DYB is located between Honghai Bay and DPB in the eastern Guangdong Province, with a total area of 650 km2; DPB is located between the Dapeng and Kowloon Peninsulas of Hong Kong, with a total area of about 335 km2.

2.2. Data

Sentinel-2A/2B was launched in 2015 and 2017 by the European Space Agency (ESA), with a revisit period of 10 d per sensor. When the two sensors complement each other, the revisit period can be shortened to 5 d, and in mid-latitude areas, it is reduced to 2–3 d. Sentinel-2 has high resolutions (including temporal and spatial). During 2016–2018, Sentinel-2 only included Level-1C Top of Atmosphere (L1C TOA), which obtained Level-2A Surface Reflectance (L2A SR) by Sen2Cor. Since 2019, Level-2 can be downloaded from the ESA.
Precipitation data for Guangzhou (https://swj.gz.gov.cn, accessed on 10 August 2023) and Shenzhen (https://swj.sz.gov.cn, accessed on 10 August 2023) were obtained from the monthly report of the Water Authority. Sea level data were obtained from the China Sea Level Bulletin (https://www.mnr.gov.cn/sj/sjfw/hy/gbgg/zghpmgb, accessed on 29 July 2023). Wind speed was obtained from the National Centers for Environmental Information (NCEI) of the National Oceanic and Atmospheric Administration (NOAA) (https://www.ncei.noaa.gov/data/global-summary-of-the-day/archive/, accessed on 29 June 2023). Maritime transportation information was obtained from Shiptracker.org (https://ship-tracker.org/marinetraffic, accessed on 20 June 2023).

2.3. Pre-Processing

We used images with cloud cover of ≤30% as valid data. If cloud cover was ≥30%, such data were excluded. The study selected Sentinel-2 L1C TOA (started in 2016) and Sentinel-2 L2A SR (started in 2019 in China) data from Sentinel-2. First, L1C TOA data for 2016–2018 were corrected using the Sen2Cor 02.11.00 software released by ESA to obtain SR data. Second, SNAP 9.0.0 software released by the ESA was used to resample SR data for 2016–2021, resulting in SR data with a spatial resolution of 10 m. Finally, cloud and mist removal was performed on SR data using the QA60 band (see in Figure 2).
To remove residual noise from SR data, we applied a simple correction method for Sentinel-2 SR [42]. The following correction formula was used:
R r s c λ = R r s λ m i n ( R r s N I R : R r s S W I R ) π
where R r s c λ is the corrected water-leaving reflectance of the Sentinel-2 band centered at λ i , R r s λ is the original reflectance of the Sentinel-2 band centered at λ i , and min (Rrs(NIR): Rrs(SWIR)) is the minimum positive reflectance value of the NIR and SWIR bands.

2.4. Mean Aggregation

Owing to the significant randomness of the spatiotemporal variations of water clarity in the coastal area of Shenzhen analyzed using single scene Zsd, the calculation of the monthly Zsd can be more accurate. If there are multiple valid data in a month, their mean value is calculated as the monthly result, and used as the calculation unit to obtain the quarterly and annual results. Figure 3 is the quantities of Sentinel-2 covering the coastal area of Shenzhen during 2016–2021.

2.5. Algorithm to Retrieve Zsd

Lee et al. (2002) found that the classic underwater visibility theory cannot accurately explain the observation of the human eye on the Secchi disk [43], and they proposed an innovative model based on radiation transfer theory to estimate Zsd, which ranges from 0.1 to 30 m. The validation results showed that the estimated results of the model were consistent with those of on-site measurements, with an average absolute difference of 18% (note: the 18% difference includes 10% uncertainty in the on-site in situ measurement of Zsd).
The QAA has good stability and universality without adjusting for any coefficients, and its application is not limited by time, region, or sensors. The QAA has been widely used for marine, nearshore, and inland water. The latest version of QAA, that is, QAA_V6 [44], is widely used [10,16,25,45]. Through the relationship between Rrs and inherent optical property, the total absorption and backscattering coefficients of water are retrieved, and then the Zsd is obtained through the total absorption coefficient (See in Figure 4 and Table 1). The formula is as follows [44]:
Z s d = 1 2.5 m i n K d t r l n 0.14 R r s t r 0.13
where m i n K d t r is the minimum diffuse attenuation coefficient at the transparent window of the water within the visible domain (443–665 nm) and R r s t r is the remote sensing reflectance corresponding to the wavelength. We used the method described by Qiu et al. (2023) to distinguish between clean and turbid water [25], which improves the usability of the QAA model in retrieving Zsd in the coastal area of Shenzhen and avoids the underestimation of the results of clean water. This provides valuable reference information for improving the use of QAA models to retrieve the Zsd of water with complex optical characteristics. This method provides sustainable good data for the subsequent analysis of the spatiotemporal variations of Zsd in the coastal area of Shenzhen. The results obtained can serve as a reference for subsequent studies on water resource management.

2.6. Evaluation of Zsd

Because we lack synchronous (quasi-synchronous) in situ data in the coastal area of Shenzhen, it proves the applicability and reliability of the QAA algorithm by evaluating the consistency between Landsat8 OLI and Sentinel-2. Because the QAA algorithm has been widely applied to Landsat [30,45,46], we use the result of Landsat8 OLI as a reference. Validation points are randomly selected in PRE, SZB, DPB, and DYB (see in Figure 1). With each validation point as the center, 9 × 9 pixels (Sentinel-2) and 3 × 3 pixels (Landsat8 OLI) are selected. Both Landsat8 OLI and Sentinel-2 flew over on the same day, with times of 20190328, 20190927, 20191123, 20210119, 20210317, 20211205, and 20211227.
Two factors need to be considered while selecting the sampling points. First, if relevant validation points are selected on the edge, they may be affected by optical shallow water or land proximity effect. Second, the spatial resolution of Landsat8 OLI and Sentinel-2 is inconsistent at 30 and 10 m, respectively. If a relevant verification point selected is on the shore, mixed pixels may also affect it. To avoid the relevant influence of such confounding factors, the verification points selected in the study should be more than 1 km away from the shore.
Thus, the evaluation criteria were the coefficient of determination (R2), Pearson correlation coefficient (PCC), and unbiased percentage difference (UPD).
R 2 = 1 i = 1 N A A 2 i = 1 N A A ¯ 2
U P D = 1 N × i = 1 N A A 0.5 × A + A × 100 %
P C C = c o v A , A σ A σ A = A A A A n A 2 A 2 n A 2 A 2 n
where A is the Zsd of Landsat8 OLI, A’ is the Zsd of Sentinel-2, and n is quantity.

3. Result

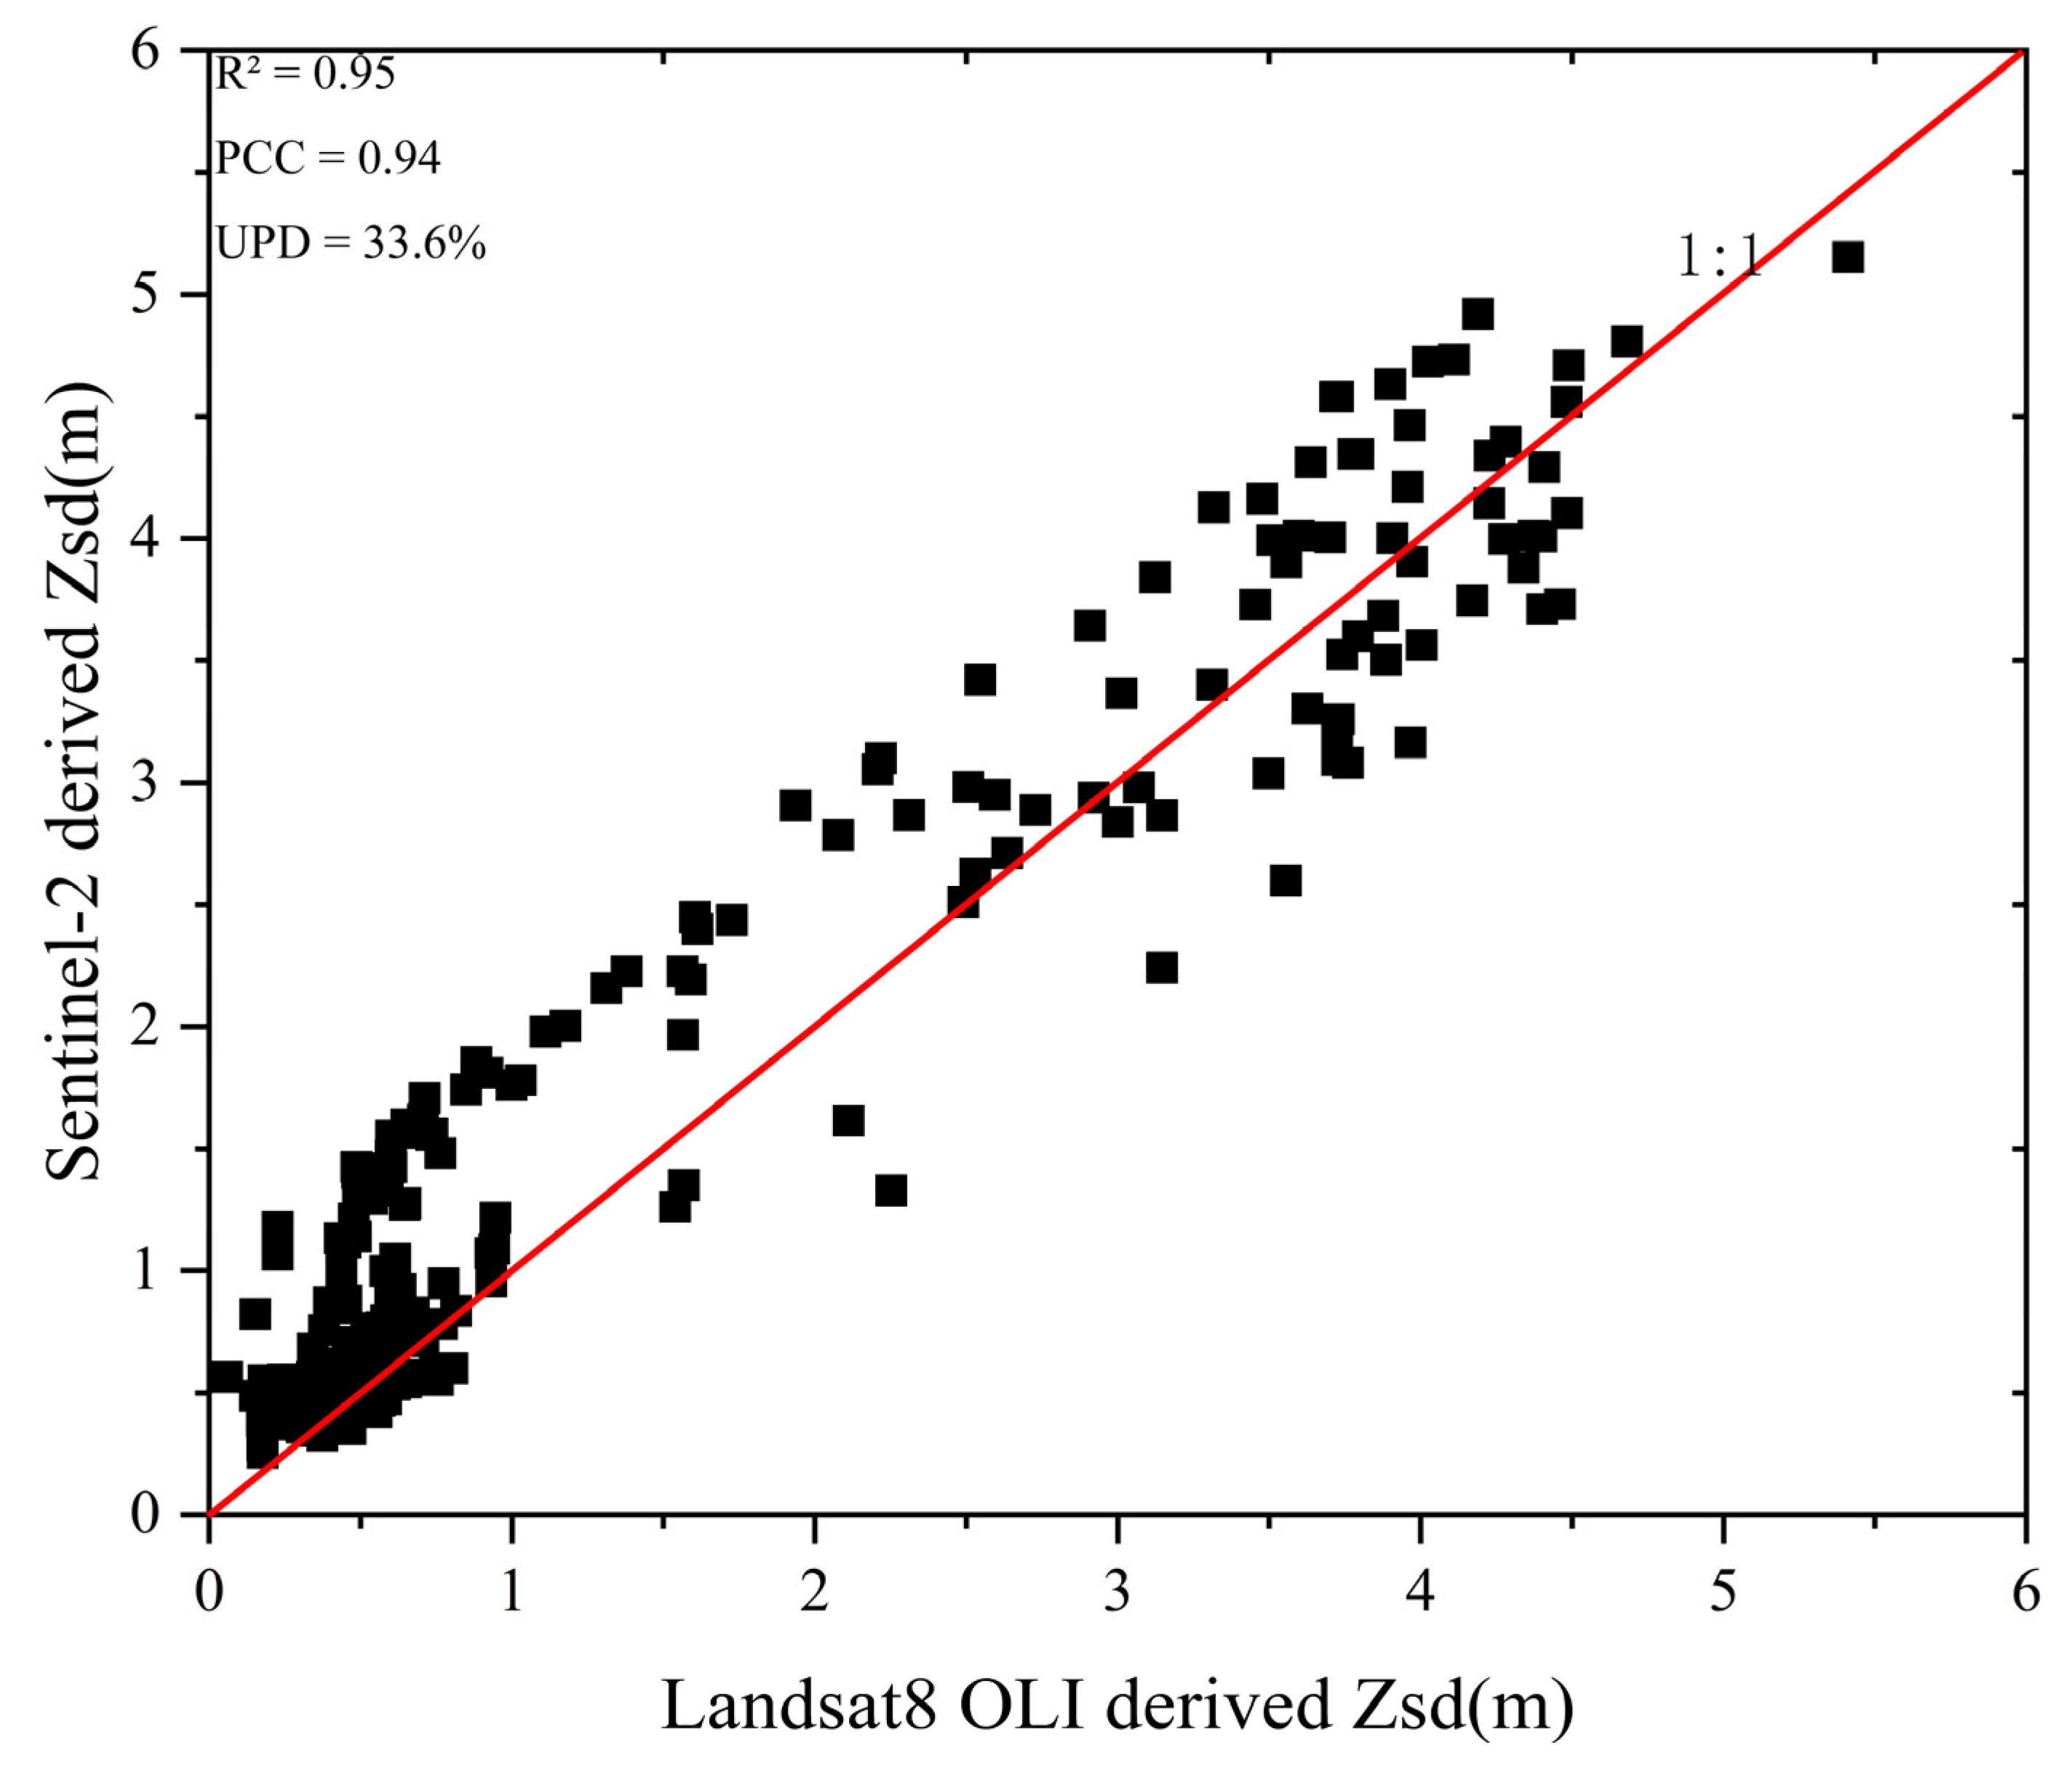
3.1. Evaluation of Model Applicability

In order to show the universality and stability of the QAA algorithm, the mean values of Zsd at each validation point in 9 × 9 pixels (Sentinel-2) and 3 × 3 pixels (Landsat8 OLI) were calculated separately, and the results showed that R2 = 0.95, PCC = 0.96, and UPD = 33.6%. The results of Zsd from Landsat8 OLI and Sentinel-2 had a high correlation, further proving that the QAA algorithm has good reliability and applicability in Sentinel-2 (See in Figure 5).

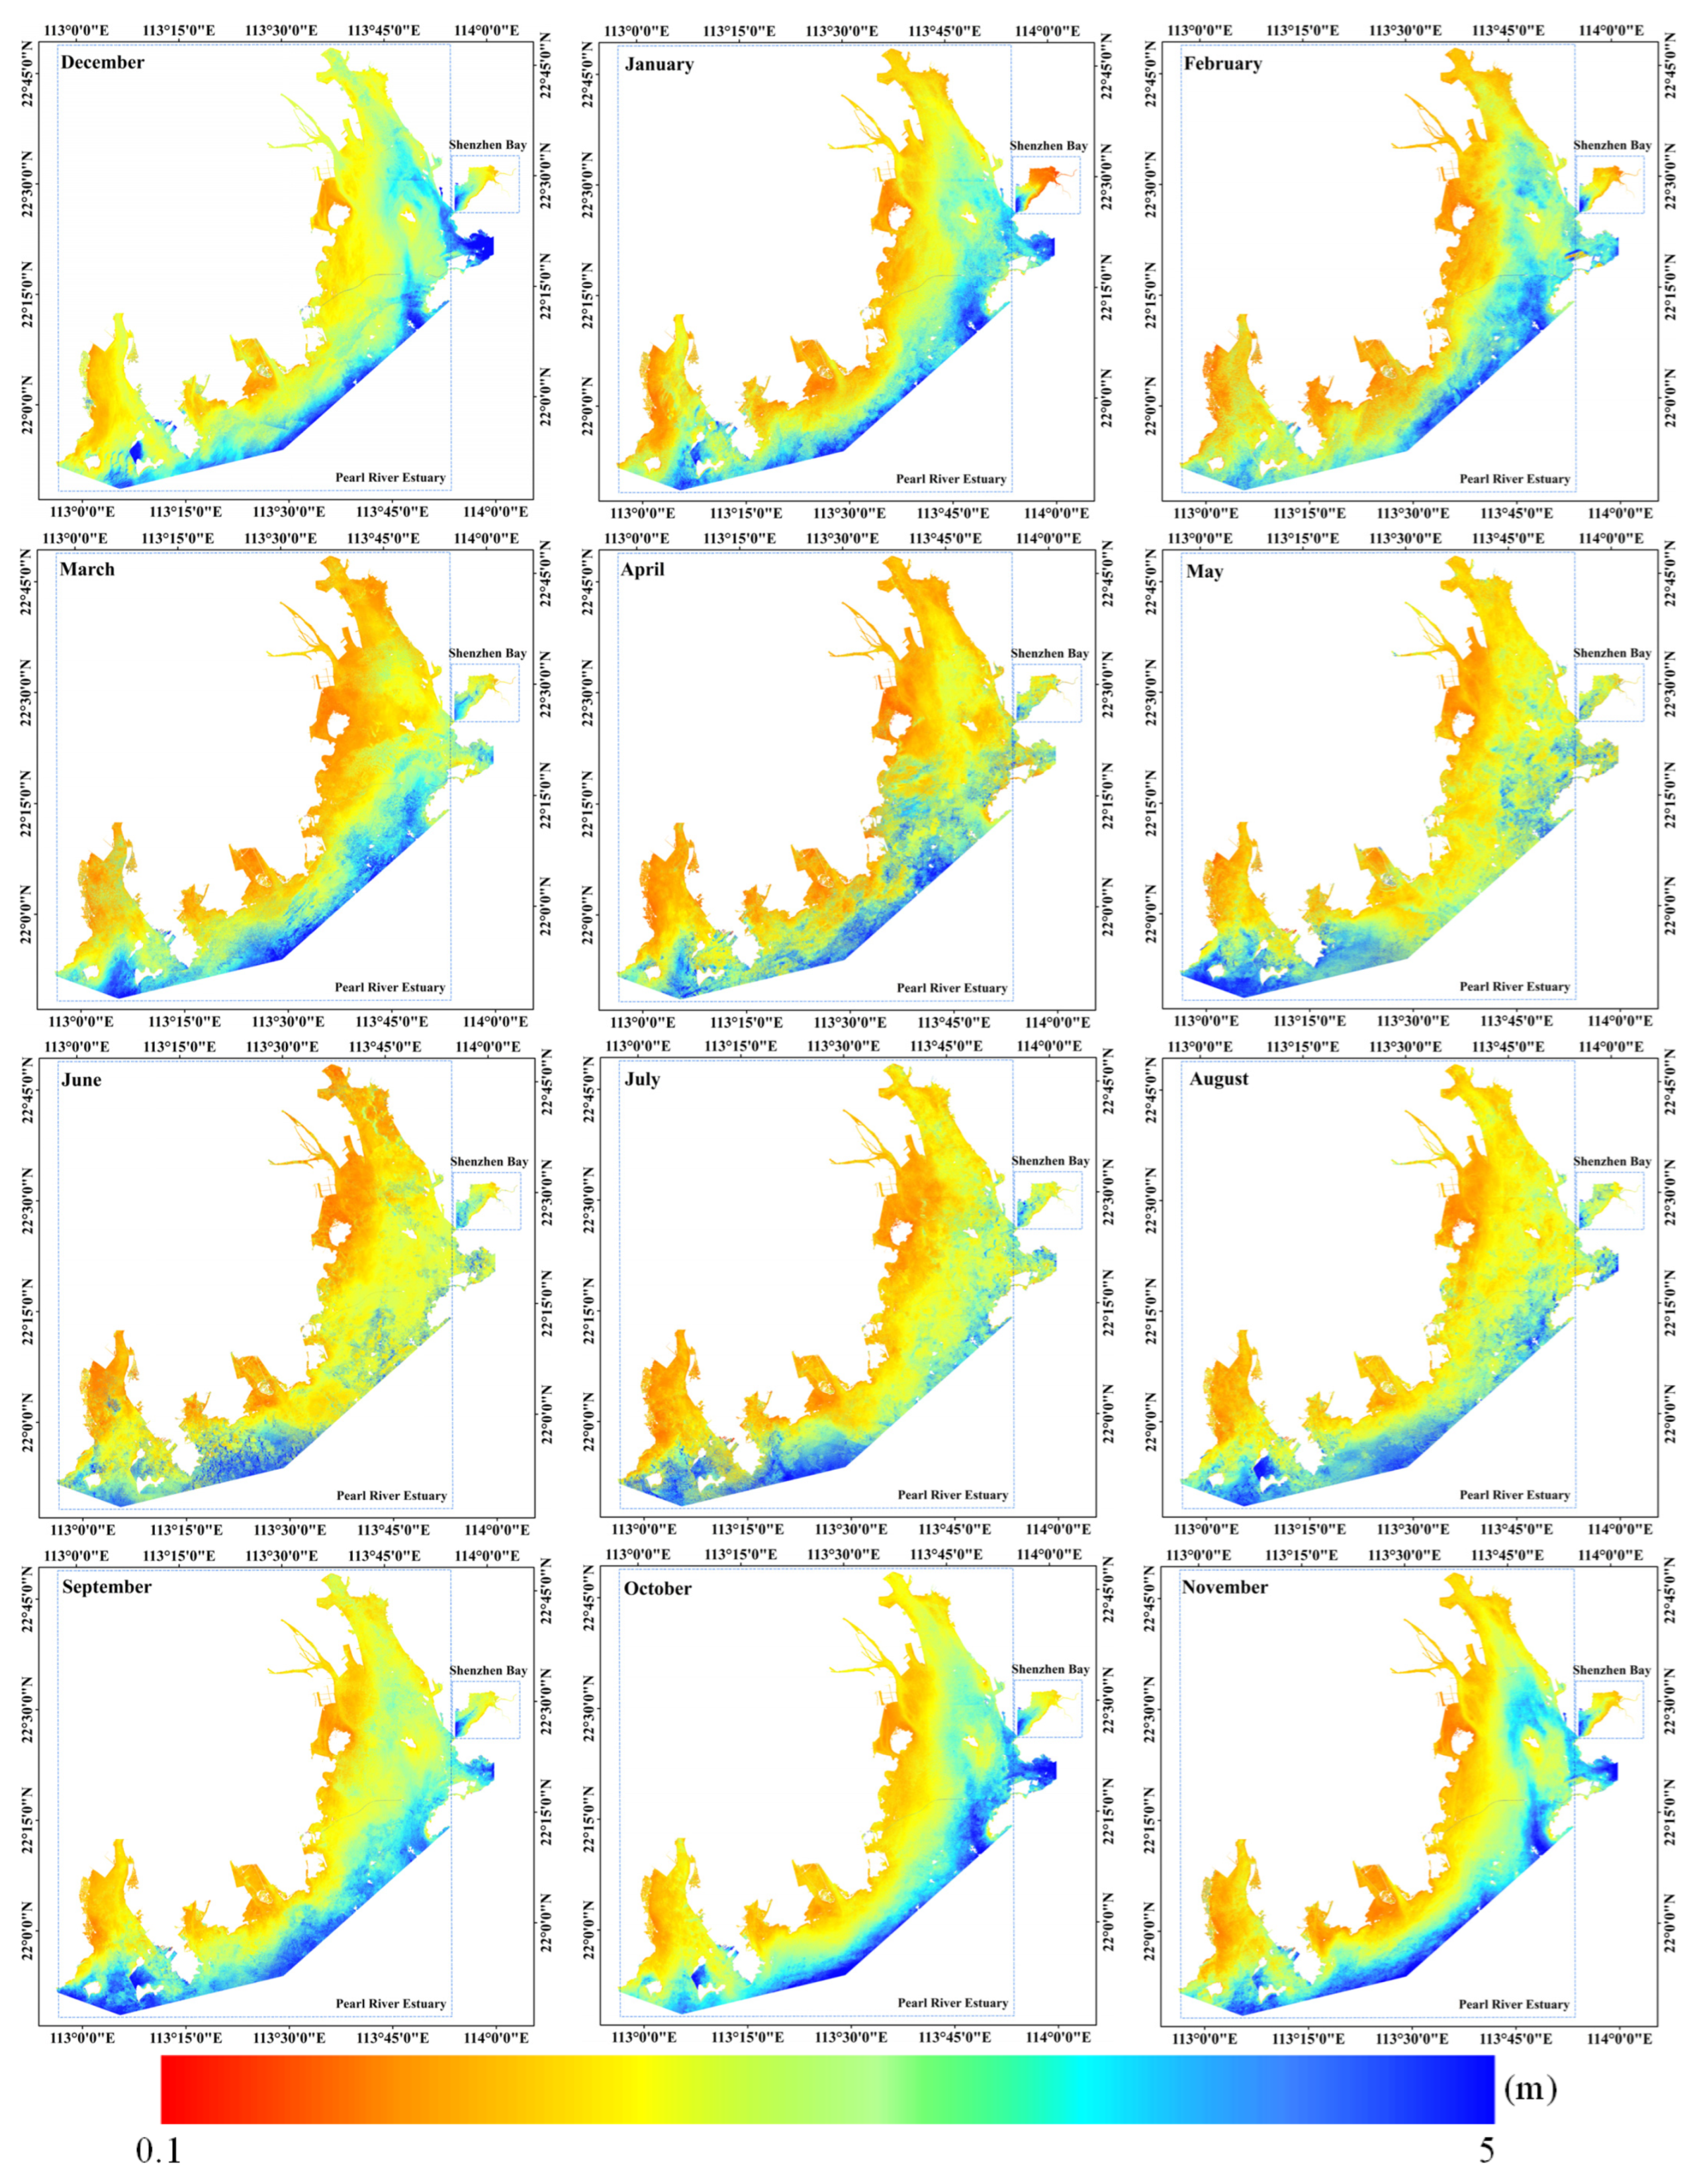
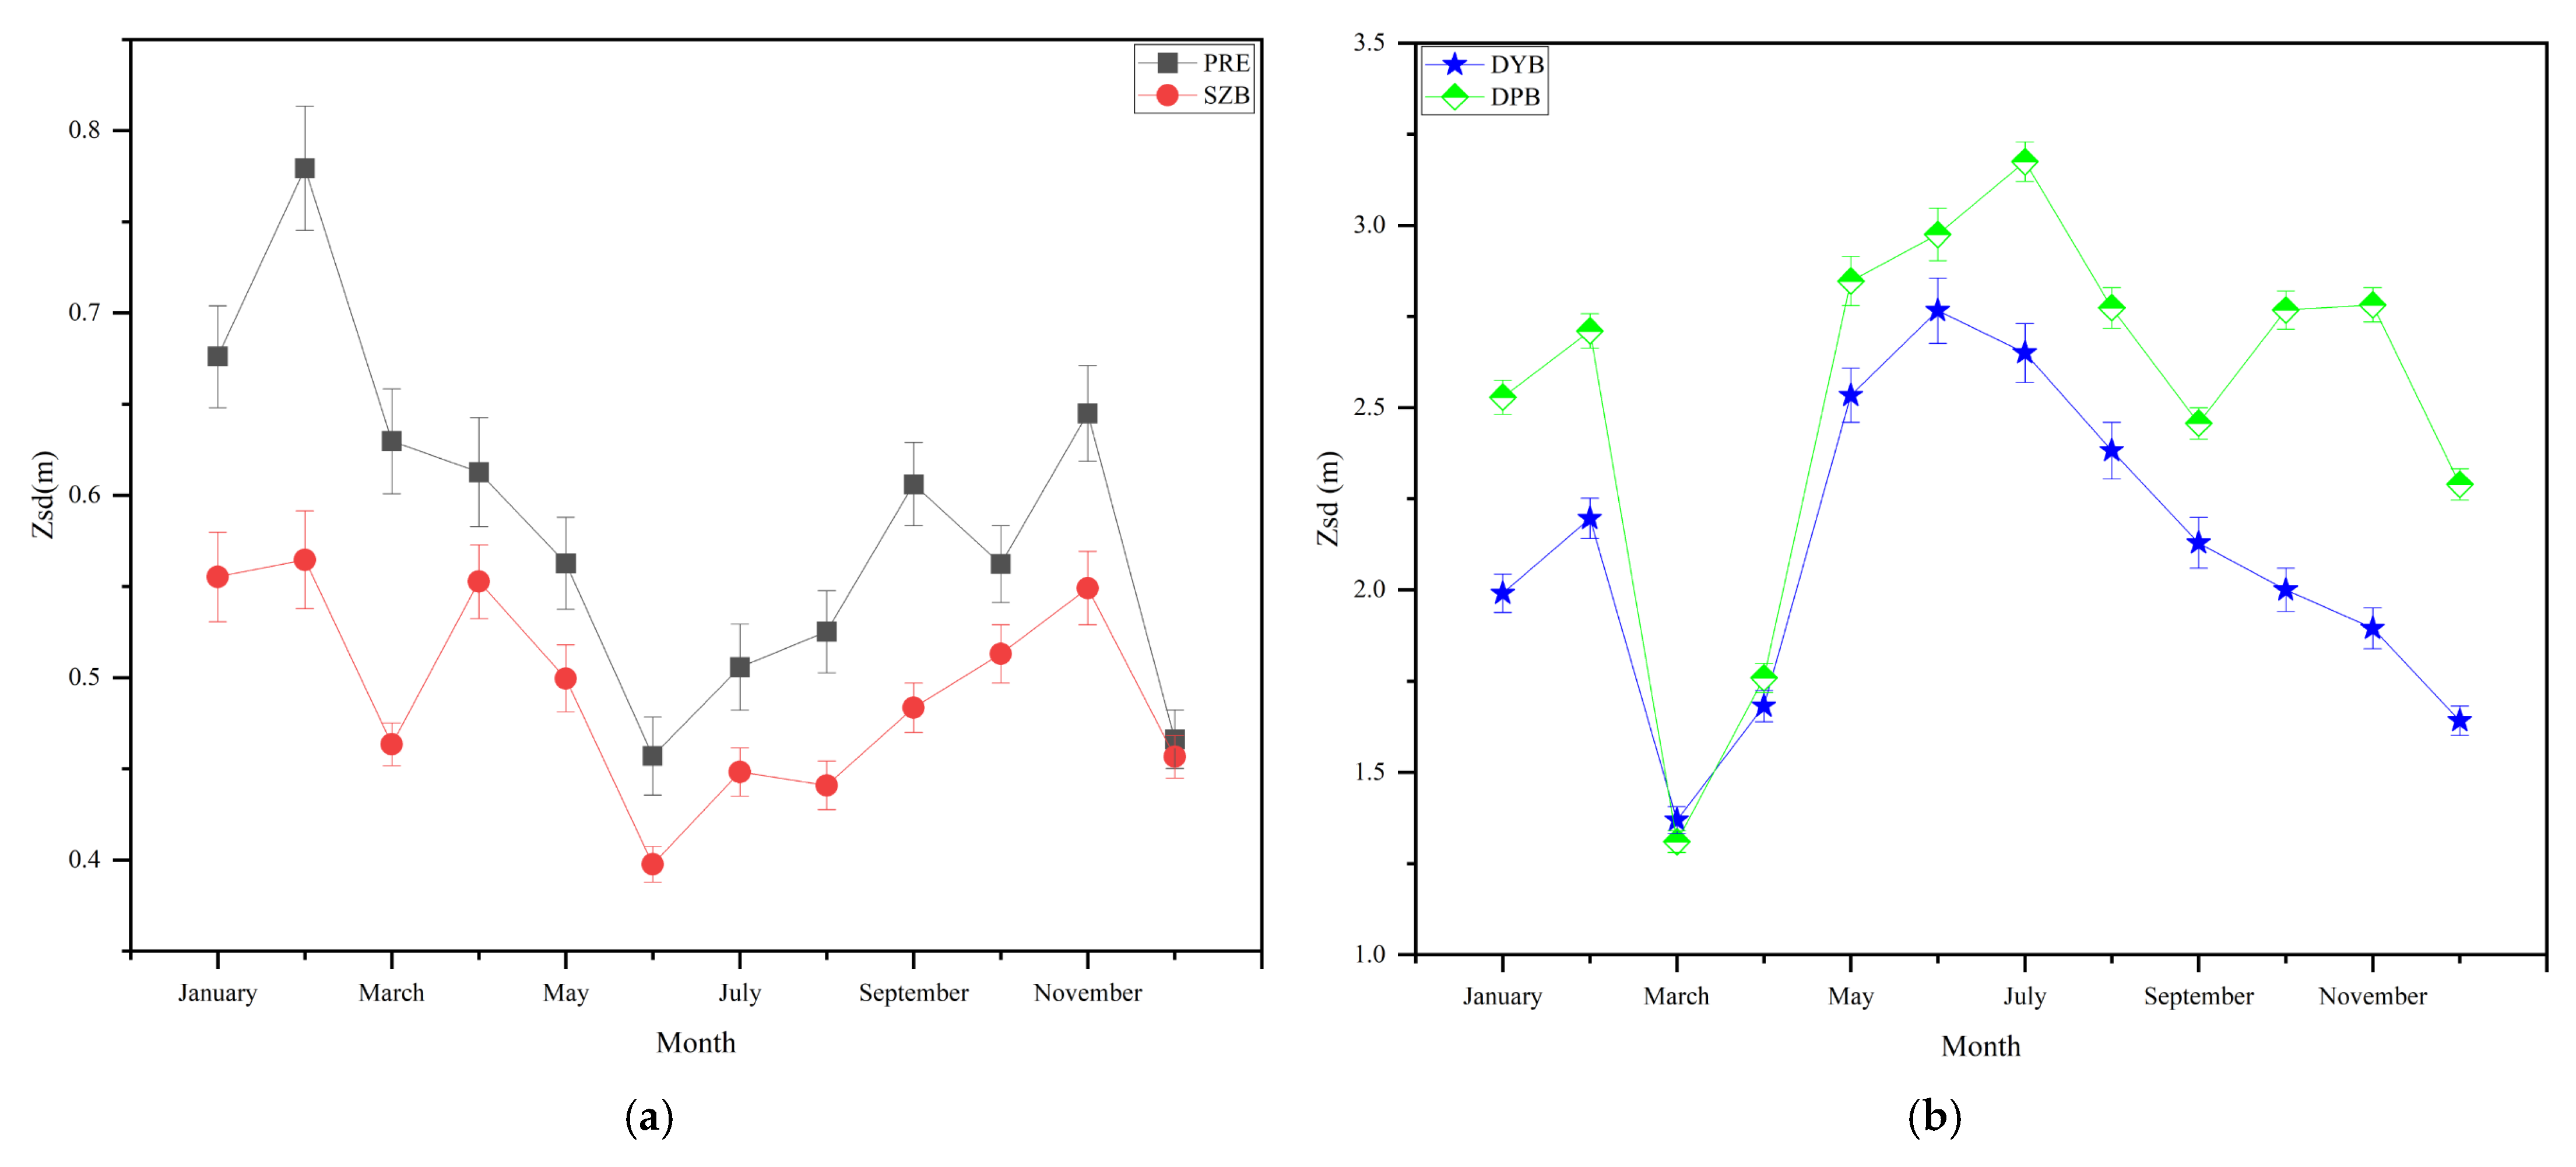
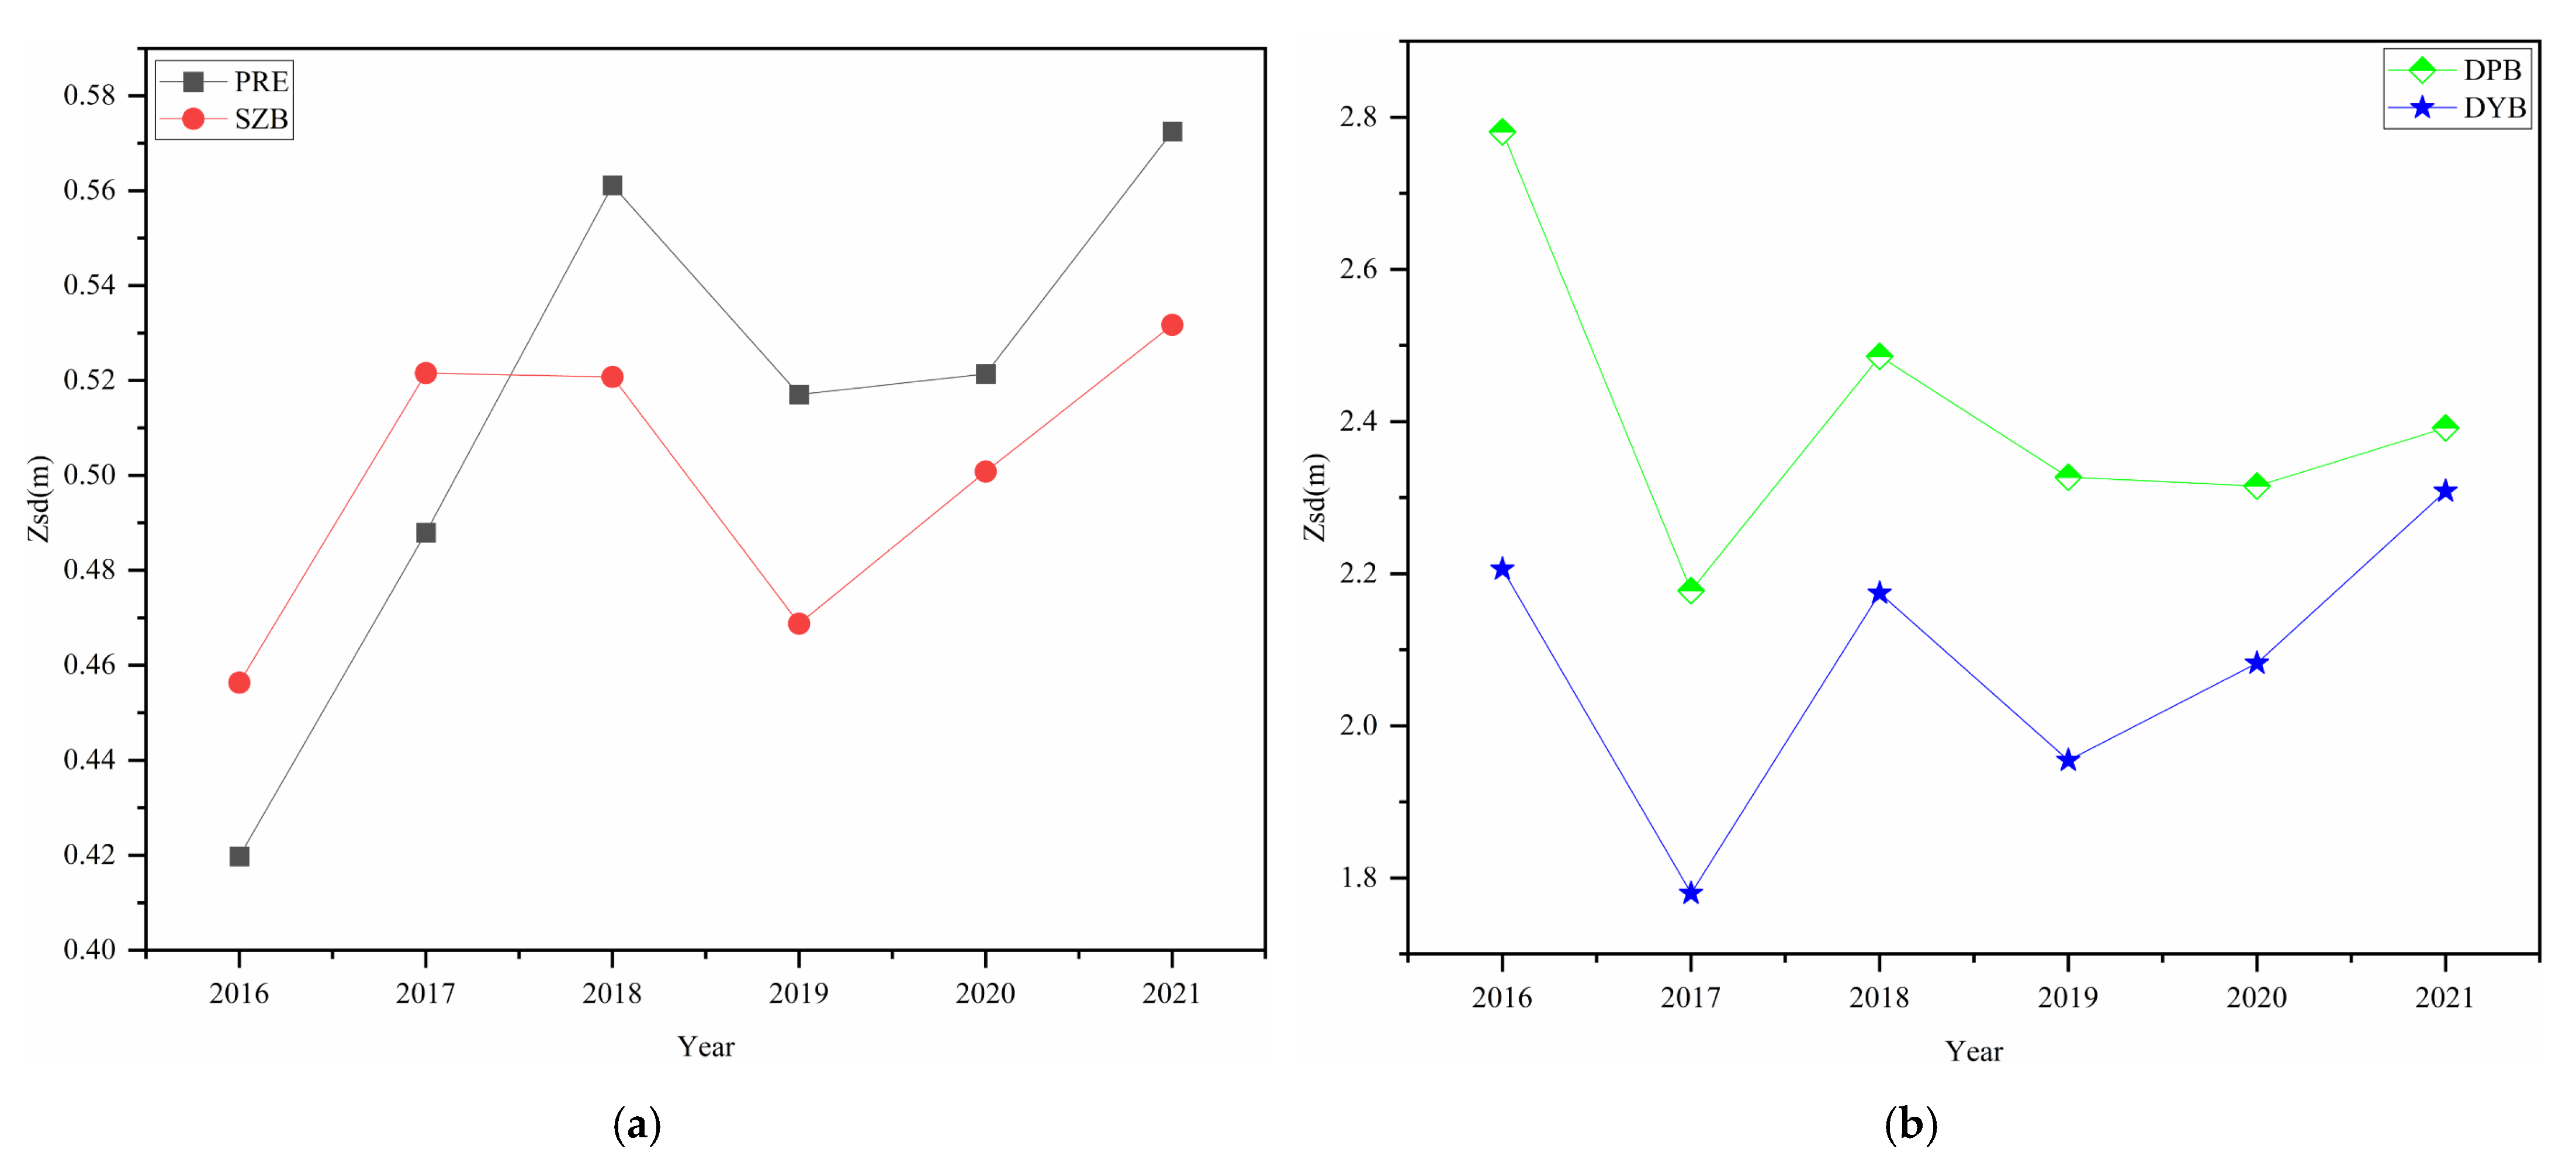
3.2. Variations in Water Clarity

Using Sentinel-2 as input, the monthly Zsd products of Shenzhen coastal areas (PRE, SZB, DPB, and DYB) for the period 2016–2021 were produced. The obvious spatiotemporal variations of Zsd were reflected by the monthly climatology products as high in summer and low in spring (Figure 6 and Figure 7). To provide a more intuitive explanation of the variations of Zsd in the coastal area of Shenzhen, the monthly spatial mean values of Zsd for PRE, SZB, DPB, and DYB were calculated separately (Figure 8). The Zsd of DPB and DYB are significantly better than those of PRE and SZB, with DPB having the best Zsd among the four water areas. Owing to the distribution, Zsd in the western coastal areas of Shenzhen (PRE and SZB) was lower than in the east (DPB and DYB). Both PRE and SZB exhibited the pattern of being low in the north and high in the south, low near the inlet and high on the seaward side. PRE and SZB became increasingly similar, and their variation ranges were 0.41~0.67 m and 0.39~0.58 m, respectively, with relatively small fluctuations. The Zsd of PRE was only slightly higher than that of SZB in February, September, and November. However, PRE and SZB were different from DPB and DYB. The seasonal variations of DPB and DYB were the highest in summer (2.7~2.9 m) and lowest in spring (2.5~2.9 m), with relatively huge fluctuations. DPB and DYB showed a monthly upward trend in Zsd during winter and spring, while DPB showed a monthly upward trend in autumn, and a monthly first downward, and then upward trend in summer. In summer, the Zsd variations in DPB and DYB were opposite, with DYB exhibiting a downward trend and then an upward trend. These spatial distribution patterns are consistent with PRE and SZB, with both showing low values in the north and high values in the south.
Trend variations were analyzed using the Mann–Kendall (M–K) significance test [47,48]. Figure 9 and Figure 10 show the statistical results of the interannual variations and mean annual variations of Zsd. Linear regression results are presented in Table 2. The Zsd of DPB (1.26~2.98 m) and DYB (1.41~3.27 m) were higher than those of PRE (0.41~0.61 m) and SZB (0.39~0.63 m), and the Zsd of PRE and SZB were very similar. The interannual variations of Zsd for DPB and DYB were significantly higher than those of PRE and SZB. The trends of DPB and DYB were similar, while those of PRE and SZB were also similar. DPB and DYB only reached their highest levels in the autumn of 2019, while the rest reached their highest in the summer. In 2016, 2017, 2019, and 2020, Zsd reached its lowest point in the spring, and in 2018 and 2021 it did so during the autumn. Analyses of the annual mean of Zsd from different waters during 2016–2021 showed that the Zsd variations in PRE and SZB showed a gentle trend, but both showed a slow upward trend. The Zsd variations in DPB and DYB were significant, showing a downward trend from 2016 to 2019 and an upward trend from 2019 to 2021.

4. Discussion

4.1. Uncertainties in Zsd Estimation

According to previous research, the QAA algorithm has good application capabilities for retrieving Zsd (Zsd: 0.1~30 m) in marine and coastal water [44,49], and it is not limited by region, time, or sensors. However, owing to regional differences, the water quality of PRE, SZB, DPB, and DYB was relatively clear, thus making the application of semi-analytical algorithms in the study area a challenge. However, QAA_V6 applies a red band threshold to distinguish turbid and clean water [25,45,46], modifies the QAA_V6 parameters [23,25], demonstrates good universality with significant regional differences, and further improves the ability of QAA to identify regional differences in water. On the one hand, owing to the lack of quasi-synchronous field measurement data in the study area, a correlation was conducted with the results of Landsat8 OLI Zsd. To widely apply the semi-analytical algorithm to regional differences in water, a large amount of synchronous or quasi-synchronous in situ data may improve the application of the algorithm in relevant areas. On the other hand, Zsd is managed by Kd(λ) and Rrs(λ), and Kd(λ) is determined by the calculation of a and bb using QAA. Owing to regional differences, the QAA has more accurate results for a and bb by changing the reference wavelength. Because the absorption coefficient of clean water is low, QAA_V6 is more suitable. Owing to the high absorption of turbid water, QAA_V6 generates estimation errors due to the underestimation of a [25].

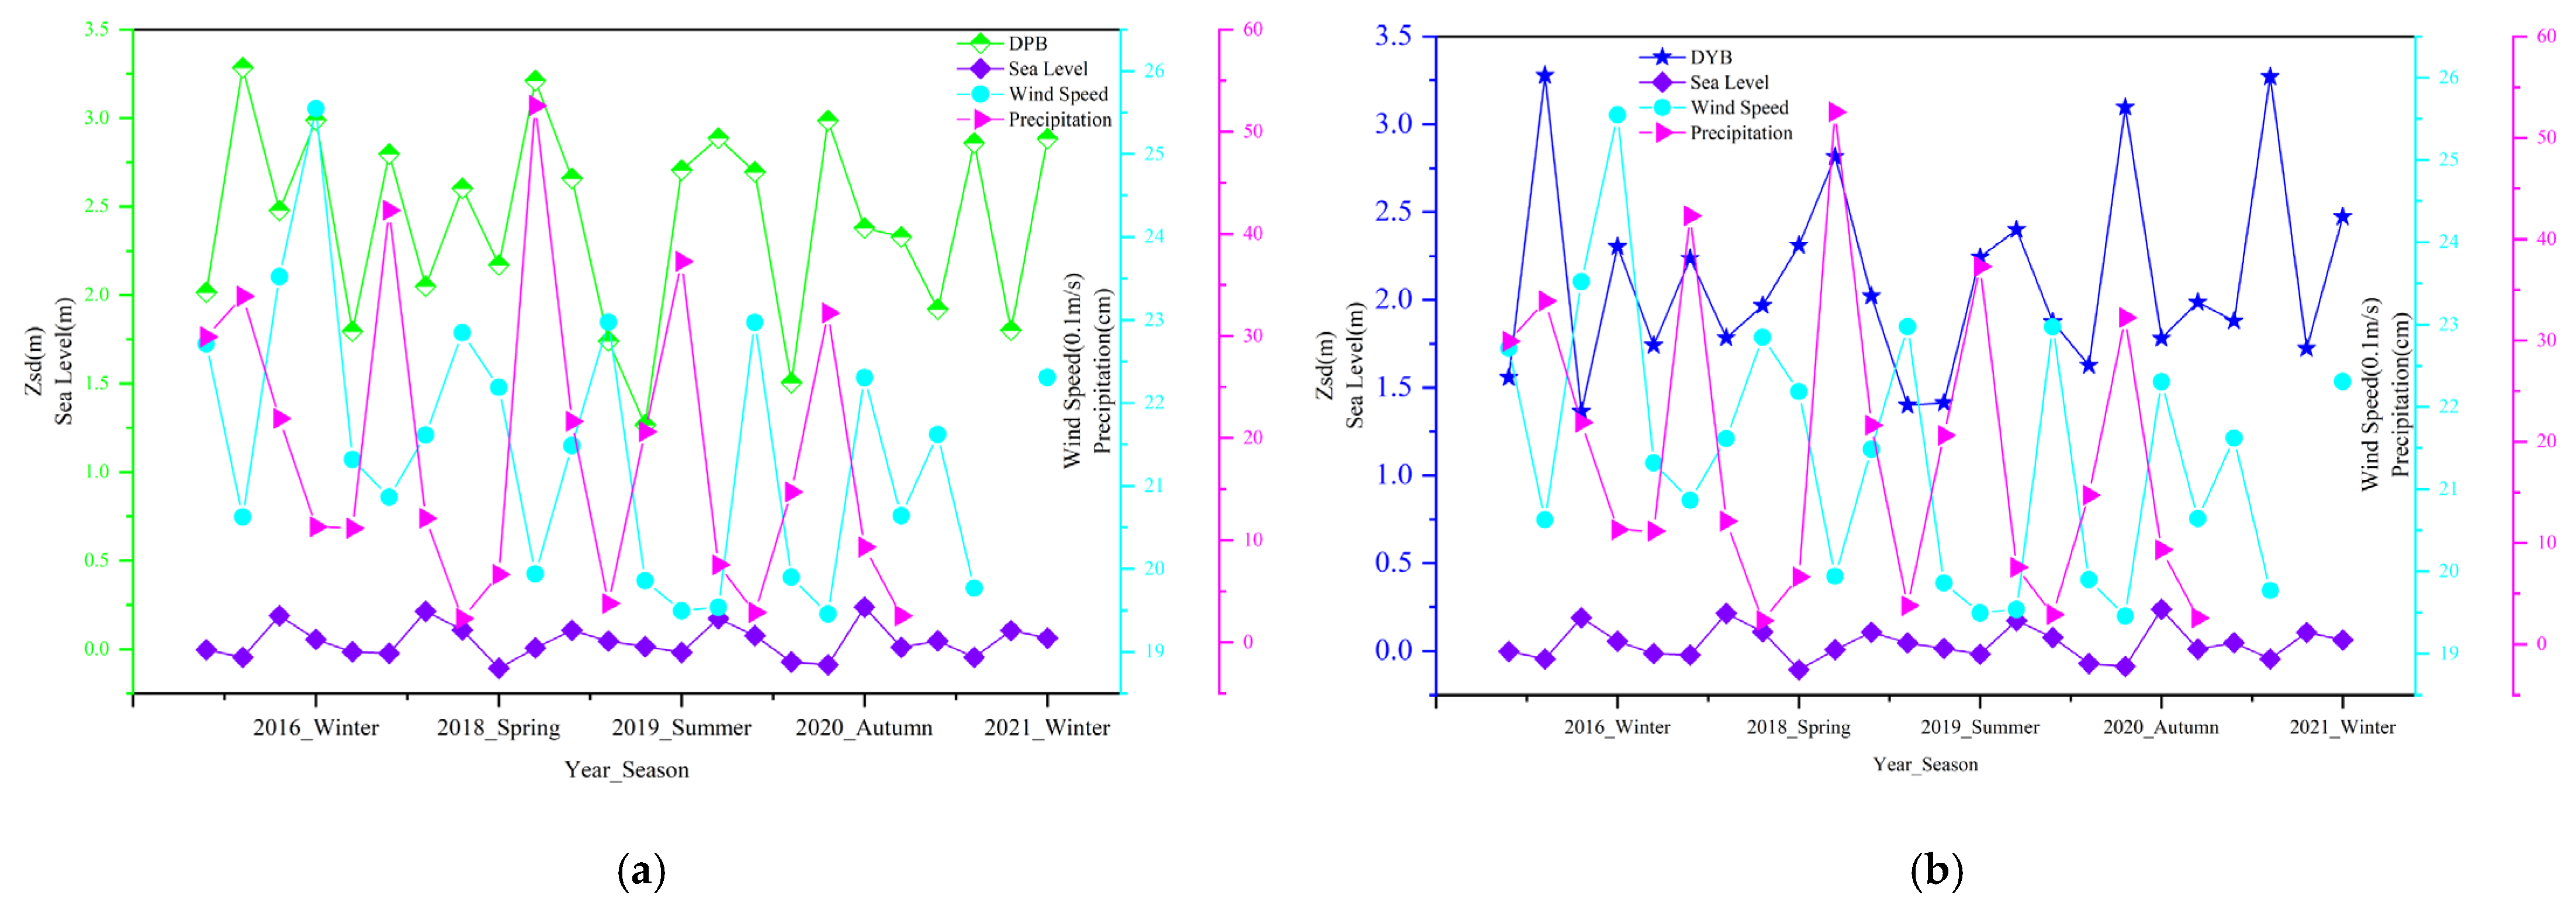
4.2. Driving Forces of Water Clarity

The coastal area of Shenzhen is an important estuary in southeastern China; the driving factors affecting water quality were mainly divided into natural factors (precipitation, wind speed, and sea level) and human factors (navigation and land reclamation) for the purpose of this study. The correlation coefficients between Zsd and three natural factors were counted, respectively.
PRE has a negative correlation with precipitation and positive correlations with wind speed and sea level (See in Figure 11a and Table 3). When precipitation increases, the discharge of pollutants and sediments in multiple estuaries of PRE also increases, leading to plenty of pollutants and sediments being discharged into the sea through the estuary, resulting in a decrease in Zsd. As PRE is a typical subtropical estuary with ocean monsoon climate characteristics (southwesterly winds in summer and northeasterly winds in winter), variations in wind speed may cause Zsd at the estuary mouth to be higher than that on the seaward side due to different forcing mechanisms and synergistic effects, making the hydrodynamic conditions complex [50]. Sea level variations accelerate water stratification and extend the residence time of river inputs, which may increase Zsd [51,52]. On the other hand, PRE is a micro-tidal estuary, with tidal ranges increasing from 0.8–0.9 m near the Wanshan Islands to 1.7 m near Humen [50]. Tidal mixing is increasingly important for weakening stratification, especially during the spring tide period, as river discharge is relatively low in winter when tides propagate from southeast to northwest in PRE. Therefore, this phenomenon is weaker in winter and stronger in summer, and the seasonal variations in these hydrodynamic conditions will also cause seasonal variations in Zsd in PRE.
SZB has a negative correlation with precipitation and positive correlations with wind speed and sea level (See in Figure 11b and Table 3). When precipitation increases, the discharge of pollutants and sediments in various estuaries of SZB also increases, leading to plenty of pollutants and sediments being discharged into the sea through the estuary, thus reducing Zsd. As SZB is a semi-enclosed pocket bay with weaker marine dynamics and poor exchange capacity, it may be that SZB has a low correlation with wind speed and sea level.
As PRE and SZB are important estuaries in southern China, the water environment is significantly affected by humans. The low Zsd near the shore of SZB may be influenced by human activities such as land reclamation. In recent decades, rapid urbanization has led to groundwater exploitation and sand excavation activities in the PRE, resulting in settlement and variations in sedimentation. The rise in sea level caused by global warming and local land subsidence may weaken sediment resuspension, and push the maximum turbidity of the estuary towards land [52]. In addition, with the increasingly changing structure of the coastline, a decrease in nonpoint source loads from the coast will lead to a decrease in sediment supply [53]. In previous studies, factors such as soil erosion [54], meteorological and hydrological conditions [55], dam construction [56], and sand mining [57] have all been well explained. PRE and SZB are important marine transportation areas (see in Figure 12), with the daily heavy discharge of pollutants from marine transportation potentially debasing water quality. Moreover, the trend of Zsd variations in PRE in this study is negatively correlated with the results of SPM variations reported by Nukapothula (2019) [18], further proving that the algorithm used in this study has good stability and universality, and the Zsd results obtained are reliable.
DPB and DYB are not only beautiful vacation destinations, but also important aquaculture zones in the local area. The ecological environment is superior, so the Zsd in this area is mainly affected by natural factors. DPB and DYB are positively correlated with precipitation (See in Figure 13 and Table 3). When the precipitation increases, it dilutes SPM in water and excreta produced by the aquaculture areas, making the water much clearer. They are negatively correlated with wind speed. The increase in wind speed will disturb SPM in water and release pollutants from sediments, decreasing Zsd. They are also negatively correlated with sea level. Due to the small number of rivers entering the sea in DPB and DYB, that is, the variations of sea level reducing the stratification of water, the amount of river input is decreased, which may be another reason for the decrease of Zsd.
To protect the marine environment and ecological balance, we can adjust and improve the maritime functional areas; strengthen land-based pollution control; and improve the quality of the marine environment, thus enhancing comprehensive utilization of the ocean and ecological restoration of polluted areas, as well as strengthening public education, regional communication, and cooperation in comprehensive prevention and control of marine pollution.

4.3. Implications

Zsd is an important evaluation indicator that can intuitively reflect the clarity and quality of water [56,57]. Using Sentinel-2 to retrieve Zsd to evaluate water quality can not only help to obtain the spatial distribution of water quality, but also the continuous and dynamic water quality variations. Therefore, from 2016 to 2021, a 10 m dataset was produced using Sentinel-2 data in the coastal area of Shenzhen, and based on this dataset, an analysis of the spatiotemporal variations and driving factors of Zsd was conducted. According to the analysis results, the overall trend of PRE and SZB was flat, but both showed a slow upward trend. The interannual trends of DPB and DYB were significant, showing a downward trend from 2016 to 2019 and an upward trend from 2019 to 2021. The results indicate that the overall water quality in the coastal area of Shenzhen has improved from 2016 to 2021; Zsd variations in PRE were negatively correlated with the results of SPM variations reported by Nukapothula et al. (2019) [18]. Therefore, the results further prove the reliability and applicability of the model.

5. Conclusions

The study analyzed the spatiotemporal variations of Zsd obtained from Sentinel-2 in the coastal areas of Shenzhen (such as PRE, SZB, DPB, and DYB) for the period of 2016–2021. First, this study processed Sentinel-2 SR data for cloud and mist removal and water-leaving reflectance correction. Second, to avoid the underestimation of Zsd in clean water, the red band was used to distinguish between clean and turbid water, which is more suitable for retrieving the Zsd results in the coastal area of Shenzhen. Finally, spatiotemporal variations of the Zsd and driving factors in the coastal area of Shenzhen from 2016 to 2021 were conducted. The overall spatial distribution pattern of the coastal area of Shenzhen is low in the west and high in the east, and low in the north and high in the south. From 2016 to 2021, the overall water quality of the coastal area of Shenzhen has improved, which may be attributed to the good governance measures taken locally.
The main natural factors affecting the Zsd in the coastal area of Shenzhen are precipitation, wind speed, and sea level. However, the correlation between PRE and SZB with the aforementioned meteorological factors is completely opposite to that of DPB and DYB, in regard to correlation with wind speed (PRE: 0.24, SZB: 0.01, DPB: −0.02, DYB: −0.39), correlation with precipitation (PRE: −0.71, SZB: −0.64, DPB: 0.41, DYB: 0.47), and correlation with sea level (PRE: 0.39, SZB: 0.13, DPB: −0.01, DYB: −0.42).
Although the 10 m Zsd dataset produced in this study can provide valuable reference information for achieving sustainable utilization of marine resources, it has certain limitations in terms of accuracy. First, we lack the Zsd satellite–ground synchronous in situ data from the study area to evaluate the accuracy of the QAA algorithm and prove its universality. Second, the time series of this study is relatively short, and the data sources and evaluation parameters are limited. This hinders both an in-depth analysis of spatiotemporal variations in water quality and the evaluation of correlations among various water quality parameters. To enhance the reliability of our results, future research will involve multi-source remote sensing data and an analysis of multiple evaluation parameters to assess spatiotemporal variations. Additionally, we will collect more driving factors, such as marine discharge volume and distribution of marine outfalls. By conducting a detailed analysis of such data, we can gain an accurate understanding of the factors contributing to the variations in water quality in the study area, in order to undertake effective measures for the protection and management of water resources.

Author Contributions

Methodology, Y.Z.; Software, X.L.; Validation, H.L.; Resources, H.L.; Writing—original draft, Y.Z.; Writing—review & editing, Y.Z.; Visualization, X.L.; Supervision, L.Z.; Project administration, J.C.; Funding acquisition, J.C. All authors have read and agreed to the published version of the manuscript.

Funding

This work was supported by the National Key Research and Development Program of China (2021YFF0703901), the National Natural Science Foundation of China (42271353, 42001286), the Fundamental Research Foundation of Shenzhen Technology and Innovation Council (Key Program) (JCYJ20220818101617037, JCYJ20220818101617038), Scientific Research Project of Ecology Environment Bureau of Shenzhen Municipality: “Research on the Application of Multi-source Data in the Investigation and Evaluation of Ecosystem Status in Shenzhen” (SZDL2023001387), Excellent Youth Innovation Foundation of the Shenzhen Institutes of Advanced Technology (SIAT) of the Chinese Academy of Science (CAS) (E3G044).

Data Availability Statement

The data used in this study are available upon request.

Conflicts of Interest

The authors declare no conflict of interest.

References

  1. Zhang, Y.; Yufei, W.; Wang, Y.; Xi, H. Investigating the Impacts of Landuse-Landcover (LULC) Change in the Pearl River Delta Region on Water Quality in the Pearl River Estuary and Hong Kong’s Coast. Remote Sens. 2009, 1, 1055–1064. [Google Scholar] [CrossRef]
  2. Li, Y.; Huang, L.; Chen, J.; Zhou, M.; Tan, Y. Water Quality and Phytoplankton Blooms in the Pearl River Estuary. In The Environment in Asia Pacific Harbours; Wolanski, E., Ed.; Springer: Dordrecht, The Netherlands, 2006; pp. 139–145. ISBN 978-1-4020-3655-2. [Google Scholar]
  3. Zhu, Y.; Zhao, J.; Zhao, Y.; Shou, Y. Numerical Model Research on the Oil Spill in Channel of Anchorage Outside Pearl River Estuary. J. Coast. Res. 2020, 111, 130–139. [Google Scholar] [CrossRef]
  4. Boyce, D.G.; Lewis, M.; Worm, B. Integrating Global Chlorophyll Data from 1890 to 2010. Limnol. Oceanogr. Methods 2012, 10, 840–852. [Google Scholar] [CrossRef]
  5. Capuzzo, E.; Stephens, D.; Silva, T.; Barry, J.; Forster, R. Decrease in Water Clarity of the Southern and Central North Sea during the 20th-Century. Glob. Chang. Biol. 2015, 21, 2206–2214. [Google Scholar] [CrossRef] [PubMed]
  6. Fleming-Lehtinen, V.; Laamanen, M. Long-Term Changes in Secchi Depth and the Role of Phytoplankton in Explaining Light Attenuation in the Baltic Sea. Estuar. Coast. Shelf Sci. 2012, 102–103, 1–10. [Google Scholar] [CrossRef]
  7. Philippart, C.J.M.; Salama, M.S.; Kromkamp, J.C.; van der Woerd, H.J.; Zuur, A.F.; Cadée, G.C. Four Decades of Variability in Turbidity in the Western Wadden Sea as Derived from Corrected Secchi Disk Readings. J. Sea Res. 2013, 82, 67–79. [Google Scholar] [CrossRef]
  8. Carlson, R.E. A Trophic State Index for Lakes 1. Limnol. Oceanogr. 1977, 22, 361–369. [Google Scholar] [CrossRef]
  9. Kaika, M. The Water Framework Directive: A New Directive for a Changing Social, Political and Economic European Framework. Eur. Plan. Stud. 2003, 11, 299–316. [Google Scholar] [CrossRef]
  10. Shang, S.; Lee, Z.; Shi, L.; Lin, G.; Wei, G.; Li, X. Changes in Water Clarity of the Bohai Sea: Observations from MODIS. Remote Sens. Environ. 2016, 186, 22–31. [Google Scholar] [CrossRef]
  11. Hoitink, A.J.F.; Hoekstra, P. Observations of Suspended Sediment from ADCP and OBS Measurements in a Mud-Dominated Environment. Coast. Eng. 2005, 52, 103–118. [Google Scholar] [CrossRef]
  12. Li, J.; Wang, S.; Wu, Y.; Zhang, B.; Chen, X.; Zhang, F.; Shen, Q.; Peng, D.; Tian, L. MODIS Observations of Water Color of the Largest 10 Lakes in China between 2000 and 2012. Int. J. Digit. Earth 2016, 9, 788–805. [Google Scholar] [CrossRef]
  13. Wang, S.; Li, J.; Shen, Q.; Zhang, B.; Zhang, F.; Lu, Z. MODIS-Based Radiometric Color Extraction and Classification of Inland Water With the Forel-Ule Scale: A Case Study of Lake Taihu. IEEE J. Sel. Top. Appl. Earth Obs. Remote Sens. 2015, 8, 907–918. [Google Scholar] [CrossRef]
  14. Wang, S.; Li, J.; Zhang, B.; Spyrakos, E.; Tyler, A.N.; Shen, Q.; Zhang, F.; Kuster, T.; Lehmann, M.K.; Wu, Y.; et al. Trophic State Assessment of Global Inland Waters Using a MODIS-Derived Forel-Ule Index. Remote Sens. Environ. 2018, 217, 444–460. [Google Scholar] [CrossRef]
  15. Wang, S.; Li, J.; Zhang, B.; Lee, Z.; Spyrakos, E.; Feng, L.; Liu, C.; Zhao, H.; Wu, Y.; Zhu, L.; et al. Changes of Water Clarity in Large Lakes and Reservoirs across China Observed from Long-Term MODIS. Remote Sens. Environ. 2020, 247, 111949. [Google Scholar] [CrossRef]
  16. Liu, C.; Zhu, L.; Li, J.; Wang, J.; Ju, J.; Qiao, B.; Ma, Q.; Wang, S. The Increasing Water Clarity of Tibetan Lakes over Last 20 Years According to MODIS Data. Remote Sens. Environ. 2021, 253, 112199. [Google Scholar] [CrossRef]
  17. Song, K.; Liu, G.; Wang, Q.; Wen, Z.; Lyu, L.; Du, Y.; Sha, L.; Fang, C. Quantification of Lake Clarity in China Using Landsat OLI Imagery Data. Remote Sens. Environ. 2020, 243, 111800. [Google Scholar] [CrossRef]
  18. Nukapothula, S.; Chen, C.; Wu, J. Long-Term Distribution Patterns of Remotely Sensed Water Quality Variables in Pearl River Delta, China. Estuar. Coast. Shelf Sci. 2019, 221, 90–103. [Google Scholar] [CrossRef]
  19. Guo, J.; Ma, C.; Ai, B.; Xu, X.; Huang, W.; Zhao, J. Assessing the Effects of the Hong Kong-Zhuhai-Macau Bridge on the Total Suspended Solids in the Pearl River Estuary Based on Landsat Time Series. J. Geophys. Res. Oceans 2020, 125, e2020JC016202. [Google Scholar] [CrossRef]
  20. Olmanson, L.G.; Brezonik, P.L.; Finlay, J.C.; Bauer, M.E. Comparison of Landsat 8 and Landsat 7 for Regional Measurements of CDOM and Water Clarity in Lakes. Remote Sens. Environ. 2016, 185, 119–128. [Google Scholar] [CrossRef]
  21. Olmanson, L.G.; Brezonik, P.L.; Bauer, M.E. Geospatial and Temporal Analysis of a 20-Year Record of Landsat-Based Water Clarity in Minnesota’s 10,000 Lakes. JAWRA J. Am. Water Resour. Assoc. 2014, 50, 748–761. [Google Scholar] [CrossRef]
  22. Olmanson, L.G.; Bauer, M.E.; Brezonik, P.L. A 20-Year Landsat Water Clarity Census of Minnesota’s 10,000 Lakes. Remote Sens. Environ. 2008, 112, 4086–4097. [Google Scholar] [CrossRef]
  23. Yin, Z.; Li, J.; Liu, Y.; Xie, Y.; Zhang, B. Water Clarity Changes in Lake Taihu over 36 Years Based on Landsat TM and OLI Observations. Int. J. Appl. Earth Obs. Geoinf. 2021, 102, 102457. [Google Scholar] [CrossRef]
  24. Setiawan, F.; Subehi, L.; Matsushita, B. Long-Term Change of Water Clarity in Lake Limboto Derived from Landsat Data. IOP Conf. Ser. Earth Environ. Sci. 2021, 789, 012035. [Google Scholar] [CrossRef]
  25. Qiu, R.; Wang, S.; Shi, J.; Shen, W.; Zhang, W.; Zhang, F.; Li, J. Sentinel-2 MSI Observations of Water Clarity in Inland Waters across Hainan Island and Implications for SDG 6.3.2 Evaluation. Remote Sens. 2023, 15, 1600. [Google Scholar] [CrossRef]
  26. Zhao, Y.; Wang, S.; Zhang, F.; Shen, Q.; Li, J. Retrieval and Spatio-Temporal Variations Analysis of Yangtze River Water Clarity from 2017 to 2020 Based on Sentinel-2 Images. Remote Sens. 2021, 13, 2260. [Google Scholar] [CrossRef]
  27. Zhao, Y.; Wang, S.; Zhang, F.; Shen, Q.; Li, J.; Yang, F. Remote Sensing-Based Analysis of Spatial and Temporal Water Colour Variations in Baiyangdian Lake after the Establishment of the Xiong’an New Area. Remote Sens. 2021, 13, 1729. [Google Scholar] [CrossRef]
  28. Zhao, Y.; Shen, Q.; Wang, Q.; Yang, F.; Wang, S.; Li, J.; Zhang, F.; Yue, Y. Recognition of Water Colour Anomaly by Using Hue Angle and Sentinel 2 Image. Remote Sens. 2020, 12, 716. [Google Scholar] [CrossRef]
  29. Zhao, Y.; Chen, J.; Li, X. Sentinel-2 Observation of Water Color Variations in Inland Water across Guangzhou and Shenzhen after the Establishment of the Guangdong-Hong Kong-Macao Bay Area. Appl. Sci. 2023, 13, 9039. [Google Scholar] [CrossRef]
  30. Rodrigues, T.; Alcântara, E.; Watanabe, F.; Imai, N. Retrieval of Secchi Disk Depth from a Reservoir Using a Semi-Analytical Scheme. Remote Sens. Environ. 2017, 198, 213–228. [Google Scholar] [CrossRef]
  31. Ya, X.; Zhao, H.; Li, J.; Zhang, F.; Wang, S.; Yin, Z.; Shen, W. Phytoplankton Biomass Variation after Cage Aquaculture Removal from the Daheiting Reservoir, China: Observations from Satellite Data. Hydrobiologia 2022, 849, 4759–4775. [Google Scholar] [CrossRef]
  32. Li, P.; Chen, S.; Ji, H.; Ke, Y.; Fu, Y. Combining Landsat-8 and Sentinel-2 to Investigate Seasonal Changes of Suspended Particulate Matter off the Abandoned Distributary Mouths of Yellow River Delta. Mar. Geol. 2021, 441, 106622. [Google Scholar] [CrossRef]
  33. Dai, S.B.; Yang, S.L.; Cai, A.M. Impacts of Dams on the Sediment Flux of the Pearl River, Southern China. Catena 2008, 76, 36–43. [Google Scholar] [CrossRef]
  34. Wu, G.; Cui, L.; Duan, H.; Fei, T.; Liu, Y. An Approach for Developing Landsat-5 TM-Based Retrieval Models of Suspended Particulate Matter Concentration with the Assistance of MODIS. ISPRS J. Photogramm. Remote Sens. 2013, 85, 84–92. [Google Scholar] [CrossRef]
  35. Xing, Q.; Lou, M.; Chen, C.; Shi, P. Using in Situ and Satellite Hyperspectral Data to Estimate the Surface Suspended Sediments Concentrations in the Pearl River Estuary. IEEE J. Sel. Top. Appl. Earth Obs. Remote Sens. 2013, 6, 731–738. [Google Scholar] [CrossRef]
  36. Ye, H.; Chen, C.; Tang, S.; Tian, L.; Sun, Z.; Yang, C.; Liu, F. Remote Sensing Assessment of Sediment Variation in the Pearl River Estuary Induced by Typhoon Vicente. Aquat. Ecosyst. Health Manag. 2014, 17, 271–279. [Google Scholar] [CrossRef]
  37. Zhao, J.; Cao, W.; Xu, Z.; Ye, H.; Yang, Y.; Wang, G.; Zhou, W.; Sun, Z. Estimation of Suspended Particulate Matter in Turbid Coastal Waters: Application to Hyperspectral Satellite Imagery. Opt. Express 2018, 26, 10476. [Google Scholar] [CrossRef]
  38. Ye, H.; Yang, C.; Tang, S.; Chen, C. The Phytoplankton Variability in the Pearl River Estuary Based on VIIRS Imagery. Cont. Shelf Res. 2020, 207, 104228. [Google Scholar] [CrossRef]
  39. Nazeer, M.; Nichol, J.E. Improved Water Quality Retrieval by Identifying Optically Unique Water Classes. J. Hydrol. 2016, 541, 1119–1132. [Google Scholar] [CrossRef]
  40. Nazeer, M.; Nichol, J. Development and Application of a Remote Sensing-Based Chlorophyll-a Concentration Prediction Model for Complex Coastal Waters of Hong Kong. J. Hydrol. 2015, 532, 80–89. [Google Scholar] [CrossRef]
  41. Chunlei, M.; Zhao, J.; Ai, B.; Sun, S.; Yang, Z. Machine Learning Based Long-Term Water Quality in the Turbid Pearl River Estuary, China. J. Geophys. Res. Oceans 2022, 127, e2021JC018017. [Google Scholar] [CrossRef]
  42. Wang, S.; Junsheng, L.; Bing, Z.; Qian, S.; Fangfang, Z.; Zhaoyi, L. A Simple Correction Method for the MODIS Surface Reflectance Product over Typical Inland Waters in China. Int. J. Remote Sens. 2016, 37, 6076–6096. [Google Scholar] [CrossRef]
  43. Lee, Z.; Carder, K.L.; Arnone, R.A. Deriving Inherent Optical Properties from Water Color: A Multiband Quasi-Analytical Algorithm for Optically Deep Waters. Appl. Opt. 2002, 41, 5755. [Google Scholar] [CrossRef] [PubMed]
  44. Lee, Z.P.; Shang, S.; Hu, C.; Du, K.; Weidemann, A.; Hou, W.; Lin, J.; Lin, G. Secchi Disk Depth: A New Theory and Mechanistic Model for Underwater Visibility. Remote Sens. Environ. 2015, 169, 139–149. [Google Scholar] [CrossRef]
  45. Chen, M.; Xiao, F.; Wang, Z.; Feng, Q.; Ban, X.; Zhou, Y.; Hu, Z. An Improved QAA-Based Method for Monitoring Water Clarity of Honghu Lake Using Landsat TM, ETM+ and OLI Data. Remote Sens. 2022, 14, 3798. [Google Scholar] [CrossRef]
  46. Hamed, K.H.; Ramachandra Rao, A. A Modified Mann-Kendall Trend Test for Autocorrelated Data. J. Hydrol. 1998, 204, 182–196. [Google Scholar] [CrossRef]
  47. Mann, H.B. Nonparametric Test against Trend. Econometrica 1945, 13, 245–259. [Google Scholar] [CrossRef]
  48. Lee, Z.; Shang, S.; Qi, L.; Yan, J.; Lin, G. A Semi-Analytical Scheme to Estimate Secchi-Disk Depth from Landsat-8 Measurements. Remote Sens. Environ. 2016, 177, 101–106. [Google Scholar] [CrossRef]
  49. Wong, L.; Xue, H.; Dong, L.; Su, J.; Heinke, G. A Model Study of the Circulation in the Pearl River Estuary (PRE) and Its Adjacent Coastal Waters: 1. Simulations and Comparison with Observations. J. Geophys. Res. 2003, 108. [Google Scholar] [CrossRef]
  50. Hong, B.; Liu, Z.; Shen, J.; Wu, H.; Gong, W.; Xu, H.; Wang, D. Potential Physical Impacts of Sea-Level Rise on the Pearl River Estuary, China. J. Mar. Syst. J. Eur. Assoc. Mar. Sci. Tech. 2020, 201. [Google Scholar] [CrossRef]
  51. Lu, Z.; Gan, J. Controls of Seasonal Variability of Phytoplankton Blooms in the Pearl River Estuary. Deep Sea Res. Part II Top. Stud. Oceanogr. 2015, 117, 86–96. [Google Scholar] [CrossRef]
  52. Wang, J.; Tong, Y.; Feng, L.; Zhao, D.; Zheng, C.; Tang, J. Satellite-Observed Decreases in Water Turbidity in the Pearl River Estuary: Potential Linkage With Sea-Level Rise. J. Geophys. Res. Oceans 2021, 126, e2020JC016842. [Google Scholar] [CrossRef]
  53. Syvitski, J.P.M.; Kettner, A.J.; Overeem, I.; Hutton, E.W.H.; Hannon, M.T.; Brakenridge, G.R.; Day, J.; Vörösmarty, C.; Saito, Y.; Giosan, L.; et al. Sinking Deltas Due to Human Activities. Nat. Geosci. 2009, 2, 681–686. [Google Scholar] [CrossRef]
  54. Dai, S.B.; Yang, S.; Li, M. The Sharp Decrease in Suspended Sediment Supply from China’s Rivers to the Sea: Anthropogenic and Natural Causes. Hydrol. Sci. J. 2009, 54, 135–146. [Google Scholar] [CrossRef]
  55. Chen, Z.; Gong, W.; Cai, H.; Chen, Y.; Zhang, H. Dispersal of the Pearl River Plume over Continental Shelf in Summer. Estuar. Coast. Shelf Sci. 2017, 194, 252–262. [Google Scholar] [CrossRef]
  56. Wu, C.S.; Yang, S.L.; Lei, Y. Quantifying the Anthropogenic and Climatic Impacts on Water Discharge and Sediment Load in the Pearl River (Zhujiang), China (1954–2009). J. Hydrol. 2012, 452–453, 190–204. [Google Scholar] [CrossRef]
  57. Hu, D.-L.; Yang, Q.-S.; Wu, C.-Y.; Bao, Y.; Ren, J. Changing Water and Sediment Dynamics in the Pearl River Network and Consequences on Water and Sediment Regimes in the Lingdingyang Estuary. Adv. Water Sci. 2010, 21, 69–76. [Google Scholar]
Figure 1. The coastal area of Shenzhen.
Water 15 04102 g001
Figure 2. Flowchart of image processing.
Water 15 04102 g002
Figure 3. The quantities of Sentinel-2 covering the coastal area of Shenzhen during 2016–2021.
Water 15 04102 g003
Figure 4. The flowchart of QAA.
Water 15 04102 g004
Figure 5. Scatterplots showing the consistency of Landsat8 OLI and Sentinel-2-derived Zsd.
Water 15 04102 g005
Figure 6. Monthly Zsd in PRE and SZB during 2016–2021.
Water 15 04102 g006
Figure 7. Monthly Zsd in DPB and DYB during 2016–2021.
Water 15 04102 g007
Figure 8. Seasonal variations of Zsd in PRE, SZB, DPB, and DYB. (a) Seasonal variations of Zsd in PRE and SZB. (b) Seasonal variations of Zsd in DPB and DYB.
Water 15 04102 g008
Figure 9. Interannual variations of Zsd of PRE, SZB, DPB, and DYB. (a) Interannual variations of Zsd of PRE and SZB. (b) Interannual variations of Zsd of DYB and DPB.
Water 15 04102 g009
Figure 10. Mean annual Zsd of PRE, SZB, DPB, DYB. (a) Mean annual of Zsd of PRE and SZB. (b) Mean annual of Zsd of DPB and DYB.
Water 15 04102 g010
Figure 11. The correlation between the Zsd of PRE and SZB and wind speed, precipitation, and sea level. (a) The correlation between the Zsd of PRE and wind speed, precipitation, and sea level. (b) The correlation between the Zsd of SZB and wind speed, precipitation, and sea level.
Water 15 04102 g011
Figure 12. The route of marine traffic over the coastal areas of Shenzhen.
Water 15 04102 g012
Figure 13. The correlation between the Zsd of DPB and DYB and wind speed, precipitation, and sea level. (a) The correlation between the Zsd of DPB and wind speed, precipitation, and sea level. (b) The correlation between the Zsd of DYB and wind speed, precipitation, and sea level.
Water 15 04102 g013
Table 1. The flowchart of QAA_V6.
StepPropertyCalculation
1rrs(λ) r r s ( λ ) = R r s ( λ ) 0.52   +   R r s ( λ )
2u(λ) u λ = g 0   +   g 0 2   +   4 g 1 r r s ( λ ) 2 g 1
3 a λ 0 If   R r s 670 < 0.005 s r 1 a λ 0 = a w λ 0   +   10 1.146 1.366 X 0.469 X 2 X = l o g r r s 443   +   r r s 490 r r s λ 0   +   5 r r s 670 r r s 490 r r s 670 Else [25] a λ 0 = a w λ 0   +   0.39 r r s ( 670 ) r r s 443   +   r r s ( 490 ) 1.14
λ 0 = 560   n m λ 0 = 665   n m
4 b b p λ 0 b b p λ 0 = u λ 0 a λ 0 1     u λ 0 b b w λ 0
5η η = 2.0 1 1.2 e x p 0.9 r r s ( 443 ) r r s 560
6 b b p λ b b p λ = b b p λ 0 λ 0 λ η
7 a λ a λ = 1     u ( λ ) b b p λ   +   b b w λ u ( λ )
8 K d λ K d λ = 1   +   0.005 × θ s a λ   + 1 0.265 b b w λ b b λ × 4.26 × 1 0.52 × e 10.8 λ b b λ
Notes: Rrs: above-surface remote-sensing reflectance; rrs: below-surface remote sensing reflectance; u(λ): ratio of backscattering coefficient to the sum of absorption and backscattering coefficients (bb/(a + bb)); λ0: reference wavelength; aw: absorption coefficient of pure water; bbp: backscattering coefficient of suspended particles; bbw: backscattering coefficient of pure seawater; η: spectral power of particle-scattering coefficient; θ s : solar zenith angle.
Table 2. Results of regression analysis performed on an interannual scale of Zsd.
PSlopeIntercept
PRE0.0230.0060.457
SZB0.1720.0030.455
DPB0.709−0.0082.628
DYB0.4410.0111.845
Table 3. Results of correlation analyses performed on interannual Zsd and wind speed, precipitation, and sea level over the PRE, SZB, DPB, and DYB.
PRESZBDPBDYB
Wind Speed0.240.01−0.02−0.39
Precipitation−0.71-0.640.410.47
Sea Level0.390.13−0.01−0.42
Disclaimer/Publisher’s Note: The statements, opinions and data contained in all publications are solely those of the individual author(s) and contributor(s) and not of MDPI and/or the editor(s). MDPI and/or the editor(s) disclaim responsibility for any injury to people or property resulting from any ideas, methods, instructions or products referred to in the content.

