Article

Spatiotemporal Variations in Actual Evapotranspiration Based on LPJ Model and Its Driving Mechanism in the Three Gorges Reservoir Area

1
School of Geomatics, Remote Sensing, and Information, Guangdong Polytechnic of Industry and Commerce, Guangzhou 510510, China
2
College of History and Culture, Tianjin Normal University, Tianjin 300387, China
3
State Key Laboratory of Simulation and Regulation of Water Cycle in River Basin, China Institute of Water Resources and Hydropower Research, Beijing 100038, China
*
Author to whom correspondence should be addressed.
Water 2023, 15(23), 4105; https://doi.org/10.3390/w15234105
Submission received: 22 September 2023 / Revised: 14 November 2023 / Accepted: 22 November 2023 / Published: 27 November 2023
(This article belongs to the Special Issue Impacts of Climate Change on Hydrology and Water Resources)

Abstract

:
Under the influence of climate change and human activities, the ecohydrological processes in the Three Gorges Reservoir Area (TGRA) present new evolution characteristics at different temporal and spatial scales. Research on the evolution and driving mechanism of key ecohydrological element in the TGRA under the changing environment has important theoretical and practical values for correctly understanding the ecohydrological situation in the reservoir area and guiding the coordinated development of water and soil resources. In this study, the LPJ (Lund–Potsdam–Jena) model was used to simulate and analyze the spatiotemporal variations in evapotranspiration (AET) from 1981 to 2020. Sen’s slope and sensitivity analysis methods were used to quantify individual contributions of climate and human factors to changes in AET in different periods. The results indicate the following: (1) The simulation accuracy of the LPJ model for AET in the TGRA was high, with a certainty coefficient (R2), Nash efficiency coefficient (NSE), and mean relative error (MRE) of 0.89, 0.76, and 4.32%, respectively. (2) The multiyear average AET was 650.71 mm and increased at a rate of 21.63 mm/10a from 1981 to 2020. The annual distribution of AET showed a unimodal seasonal variation trend. The peak value occurred in July, reaching 113.02 mm, and the valley value occurred in January and December, less than 13 mm. (3) AET increased by 5.60% and 6.28% before and after impoundment, respectively. The contribution rate of human activities increased significantly from −3.75% before impoundment to 26.95% after impoundment, and the contribution ratios of climate change were 89.39% and 73.09%, respectively, during these two periods. From 1981 to 2020, AET increased by 5.28%, in which the contribution ratios of climate and human factors were 89.39% and 10.61%, respectively.

1. Introduction

Actual evapotranspiration (AET), which is defined as the synthesis process of evaporation and transpiration, plays a key role in surface energy balance by linking the hydrological cycle, carbon budget, and energy transfer [1,2,3]. As a crucial component of energy balance and the water–carbon cycle under global climate change [4], AET is widely used in water resource management, irrigation planning, ecological projects, and other practices of agricultural production [5,6,7]. From a background of continuous global warming and increasing human disturbance, the influence of climatic and human factors on regional hydrological processes continues to deepen [8], and the water cycle process has shown new characteristics. Accurate measurement and estimation of AET, as well as quantitative differentiation of the influence of climate and human factors on the change in AET, are very important for the sustainable relationship of regional water resources and ecological environment protection [9,10].
The acquisition of AET has always been an important and difficult point in ecohydrological research [11,12,13]. The AET, which is composed of canopy transpiration (EP), vegetation interception (EI), and bare soil evaporation (ES), is not only influenced by climate change but also closely related to vegetation, and it is greatly influenced by the underlying surface and vegetation dynamics [14]. Therefore, it is necessary to consider the growth process of vegetation in AET simulation [7,15]. Dynamic Global Vegetation Models (DGVMs) express land surface biophysics, terrestrial carbon cycle, and global vegetation dynamics through an independent and naturally continuous model framework [16]; these models integrate a wide range of biophysical, vegetation physiological, and ecological processes, and they can simulate land surface physical processes, vegetation canopy physiology, vegetation phenology, vegetation dynamics and competition, carbon and nitrogen cycle, and other processes, which are suitable for research at different temporal and spatial scales [17]. Common DGVMs include CLM (Community Land Model), VIC (Variable Infiltration Capacity), IBIS (Integrated Biosphere Simulator), and LPJ (Lund–Potsdam–Jena) models [18]. CLM, VIC, and IBIS are highly complex and difficult DGVMs, which have high requirements for model users and hardware equipment and are suitable for large-scale and global simulations. The LPJ [19] model was jointly researched and developed by Lund University, Potsdam Climate Research Centre, and Max Planck Institute for Biogeochemistry, Jena. As a moderately complex DGVM, the framework and principles of the early version are derived from the BIOME model [16,17]. The vegetation dynamic process of the model is based on natural vegetation, and the establishment and death of natural vegetation depend on a set of plant functional environmental limiting factors based on the 20-year mobile climate extreme [20]. LPJ explicitly considers key attributes, such as physiological adaptability, phenological characteristics, morphological attributes, resource utilization ability, disturbance response, and photosynthetic efficiency of different plant species, and it determines the distribution and composition of vegetation by population statistics. Subsequently, through continuous development and improvement, fire interference [21] was introduced, and the calculation scheme was improved [22]. Recently, the LPJ model has made great progress in ecosystem research and has been widely used in simulations of vegetation productivity, evapotranspiration, and the hydrological cycle [23,24,25,26]. While meeting the needs of ecohydrological simulation on the small and medium scales, it can also ensure high simulation accuracy and computing efficiency, obtaining good applicability in small- and medium-scale research [27,28].
As the world’s largest hydroelectric power station, the construction of the Three Gorges Project greatly promoted the economic and social development around the TGRA and played an important role in flood control, shipping, power generation, and other aspects [29,30]. However, as a special human activity, the construction of the project, including dam construction, migration engineering, power generation, and reservoir dispatching, has caused severe disturbance to the underlying surface [31], causing changes in land coverage types, which, in turn, changed the surface albedo [32,33] and affected the energy balance [34]. In addition, the impact of a warming climate on the hydrological cycle processes is increasingly aggravated [35]; water resources, water ecology, and water environment in the reservoir area are also facing severe pressure [36,37]. Under the influence of climate change and human activities, the ecohydrological processes in the TGRA have been marked by the strong interference of “natural and artificial” [38,39]. It is necessary and urgent to study the evolution and driving mechanism of key ecohydrological elements in the TGRA under a changing environment [40].
The Three Gorges Dam site was determined in 1984, and a construction plan was approved in 1992. Following this, the dam entered the construction phase. The water level of the Three Gorges Project reached 135 m in 2003 and 175 m in 2009. After 2010, the Three Gorges Project was officially put into operation, and we entered the Three Gorges era. In the past 40 years, the TGRA has experienced four different periods of development, including the stage before the project (1981–1992), the early stage of the project (1993–2002), the later construction and completion stages (2003–2010), and the formal operational stage (2011–2020). There are evident differences in trends in climate change and the disturbance to the underlying surface in different periods, especially between before (1981–2002) and after (2003–2010) impoundment. The impounding of the reservoir caused the water level to rise, and a large number of farmland and residential settlements on both sides of the river were flooded; the underlying surface was thus strongly disturbed. In addition, the increase in the water surface area produced a certain climate effect, and the climatic factors and ecohydrological factors had significant changes after impounding.
Therefore, this paper takes AET as the key ecohydrological element and attempts to estimate the AET over the TGRA based on the LPJ model with multisource remote sensing data from 1981 to 2020 and to quantify individual contributions of climate and human factors to the variations in AET before and after impoundment. The results of this study can provide a scientific basis and data support for the effective evaluation of ecosystem service functions and provide a decision-making basis for a correct understanding of the ecohydrological condition of the reservoir area and for guiding future spatial coordinated development for the TGRA.

2. Material and Methodology

2.1. Study Area

The TGRA refers to the catchment area between the dam site and the backwater end of the reservoir, which was created after the completion of the Three Gorges Dam and the successful impoundment of the reservoir area. This region is situated in the lower section of the upper reaches of the Yangtze River, within 105°50′–111°40′ E, 28°31′–31°44′ N (Figure 1), covering a total area of 59,326 km2, with a main channel length of 660 km. The TGRA mainly includes Chongqing Municipality, Hubei Province, part of Linshui County, Dazhu County and Luxian County in Sichuan Province, and Xishui County and Tongzi County in Guizhou Province. This area spans the south foot of the Daba Mountains to the north and extends to the north edge of the Yunnan-Guizhou Plateau to the south. The TGRA is located at the intersection of the Daba Mountain fold belt, East Sichuan fold belt and Sichuan, Hubei, Hunan, and Guizhou uplift belt, thereby crisscrossing areas containing mountains, hills, basins, and valleys. The region is mainly composed of mountains along the northeast and south margins of the Yangtze River and hills in the Midwest [41]. The elevation of the TGRA ranges from 54 to 3099 m, with an average elevation of 773 m (Figure 1). According to the area proportion of different elevation intervals, the area with elevation between 100–500 m, 500–1000 m, and 1000–2000 m accounted for 37%, 35%, and 26%, respectively. Less than 2% of the area has an elevation of more than 2000 m. The TGRA is subject to a subtropical monsoon climate, with an average annual temperature (T) of 16.84 °C. The rainfall in the reservoir area is abundant, but the temporal distribution is uneven. The annual average precipitation (P) in the TGRA is 1186 mm, dominated by summer P (the total P from June to September accounts for about 54% of the annual P). There are four distinct seasons in the TGRA, characterized by warm winters, early springs, hot summers, and rainy autumns [42].

2.2. LPJ Model

2.2.1. Model Description

Based on physiological, morphological, phenological, and disturbance response attributes and a few bioclimatic limiting factors, the LPJ model defines 10 Plant Functional Types (PFTs) for photosynthesis simulation, including 8 kinds of tree and 2 kinds of herb vegetation. Under the influences of the strong control of East Asian monsoon and the transformation of Qinghai-Tibet Plateau on the westerly flow, a unique natural environment has been formed. Depending on field investigation and reference to relevant information [20,43], Zhao et al. [28] added two PFTs of temperate desert shrub and cold herb and defined their physiological parameters of leaf longevity. Huang [44] defined the distribution ratio of roots between the upper and lower soil layers. Finally, 12 PFTs, including 9 kinds of tree and 3 kinds of herb vegetation, were defined. The parameter values of relevant PFTs and their ecological environmental limiting factors are shown in Table 1.
The simulation of AET by LPJ is mainly divided into three parts, namely, EP, EI, and ES. The water balance simulation in the LPJ model mainly adopts the water tank model. The soil is divided into two layers. The water balance formulas of the upper and lower layers (soil thickness is 0.5 m and 1.0 m, respectively) are as follows:
Δ W 1 = P ES EI β 1 × EP R 1 P e r c 1
Δ W 2 = P erc 1 β 2 × EP R 2 P erc 2
where Δ W 1 and Δ W 2 are the changes in water content in the upper and lower soil layers (mm/d); β 1 and β 2 are the proportion of water consumed by roots for vegetation transpiration from the upper and lower soil layers; R1 and R2 are the surface and underground runoff (mm/d), respectively; Perc1 and Perc2 are the infiltration quantity (mm/d) of the upper and lower soil layers, respectively; P is precipitation (mm/d). The model does not consider the lateral water exchange and the convergence path between the grids.
EI is calculated using the following formula:
EI = E q × α × f w e t
where fwet is the daytime canopy wetness ratio of each vegetation functional type. The remaining canopy 1 − fwet is used to calculate vegetation transpiration. Eq and α are the equilibrium evaporation rate and Priestley–Taylor coefficient, respectively. Eq and α , involved in the calculation, are calculated from the Priestley–Taylor formula:
E q = + Υ ( R n G )
α = L E E q = L E / + Υ R n G
where Rn is the net radiation (MJ/m2/d); G is the soil heat flux (MJ/m2/d); LE is the latent heat flux (MJ/m2/d); is the slope of the saturated water vapor pressure–temperature relation curve (Claussius–Clapeyron relation—kPa/°C); and Υ is the wet and dry table constant, which is equal to 66.5 × 10 6 kPa/°C.
EP is the minimum value of water demand (D) and water supply (S) of vegetation under the condition of adequate water supply, and the formula is as follows:
EP = Min S , D × f v
S = E max × W r
D = E q × α max × 1 f wet / 1 + g m / g p o t
where Emax is maximum transpiration rate of each vegetation functional type, and the value ranges from 5 to 7 mm/d; Wr is soil moisture content that can be utilized by vegetation roots; α max is the maximum Priestley–Taylor coefficient, which is equal to 1.391 in LPJ model; gm is the conversion conductance, which is equal to 3.26 mm /s in the LPJ model; gpot is the canopy latent conductance (mm/s); and fv is the vegetation coverage.
ES occurs only in the surface 20 cm soil layer of bare land (1 − fv), and the formula is:
ES = E q × α × W r 20 × 1 f v
where W r 20 is the water content in the surface 20 cm soil layer. All the above factors were calculated based on vegetation functional types.

2.2.2. Model Input

The LPJ model was run for the period 1981–2020, preceded by a 1000-year spin-up period to reach an initial equilibrium with respect to ecosystem and soil structure [24]. In this study, we used climate data from 1981 to 2020 to drive the LPJ model 25 times to reach equilibrium. Taking the equilibrium state as the initial state, the ecohydrological process in the TGRA during the study period was simulated. The simulations were driven by gridded monthly fields (0.1° resolution) of T, P, number of wet days, cloud cover, and soil texture. Non-gridded model inputs include annual CO2 concentrations. Furthermore, various parameters are assigned to the different PFTs (Table 1). The source, website, spatial and temporal resolution, and time scale of all input datasets are shown in Table 2.
Monthly T and monthly P are provided by National Tibetan Plateau Data Center. In this study, we extracted the T and P data in the TGRA and synthesized the 3 h data into a monthly scale. Finally, we obtained the monthly average T and P from January 1981 to December 2018. The average error is less than 5% by comparing the synthesized data and the measured data from meteorological stations, indicating that the synthesized data are reliable and can be used for model spin-up and simulation. The P and T data from January 2019 to December 2020 were extended via the interpolation of station data. Monthly cloud cover and monthly wet days were derived from the CRU4.07 data set. We collected monthly cloud cover and monthly wet days in the TGRA from January 1981 to December 2020. The soil data were mainly used to simulate the infiltration in precipitation process, soil moisture content, and the process of absorbing nutrients and minerals in the roots of vegetation, and they objectively reflect the distribution of the surface in the study area. The spatial distribution data of soil type in China adopted in this paper is supported by the Geographic Data Sharing Infrastructure, College of Urban and Environmental Science, Peking University. All these data were resampled to 0.1° for model-driven use. CO2 concentration data are derived from the Earth’s CO2 Network, which updates CO2 concentrations on a daily basis and provides annual, monthly, and daily data on Global, Northern, and Southern Hemisphere scales for the past 2000 years. In this paper, the annual CO2 concentration in the Northern Hemisphere from 1981 to 2020 was captured to drive the model.

2.2.3. Accuracy Validation

MODIS AET products (https://modis.gsfc.nasa.gov; accessed on 1 January 2023) were used to verify the simulation results. MODIS AET is an 8-day composite product with a spatial resolution of 500 m, and the timescale is from 2001 to 2020. The validation of AET simulations was conducted from 2001 to 2020. The quality of AET simulations was determined via the certainty coefficient (R2), Nash efficiency coefficient (NSE), and mean relative error (MRE). The calculation formula is as follows:
R 2 = i = 1 n ( O i O a v g ) ( Q i Q a v g ) 2 i = 1 n O i O a v g 2 i = 1 n Q i Q a v g 2
NSE = 1 i = 1 n O i Q i 2 i = 1 n O i O a v g 2
MRE = 1 n i = 1 n Q i O i O a v g
where Qi is the monthly average AET simulated by the LPJ model, Oi is the MODIS AET results for model verification, Qavg is the total monthly average AET in the simulation period (all months), Oavg is the total monthly average MODIS AET results for model verification (all months), and n is the total number of months in the simulation period. The closer R2 and NSE are to 1, and the closer MRE is to 0, the higher the simulation accuracy is.

2.3. Analysis Methods

2.3.1. Change Characteristics Analysis

Sen’s slope [46] and the Mann–Kendall (M-K) test method [47,48,49] are relatively mature statistical methods in the field of geosciences and have been applied to analyze the trends, mutations, and magnitudes of hydrological and meteorological factors in basins. In this study, the analysis of the change characteristics for each element adopted the above two methods.

2.3.2. Driving Mechanism of AET

The sensitivity coefficient (SC) calculation method proposed by Beven [50] and the method by Zhao et al. [51] were used to discuss the driving mechanism of AET and quantify the contribution rate of driving factors to the change in AET; the formula is as follows:
S e v i = lim v i 0 ( A E T A E T / V i V i ) = A E T V i V i A E T
G v i = V i V ¯ i S e v i
where Sevi is the SC of the ith meteorological factor (Vi). Gvi is the contribution rate of the ith meteorological factor (Vi) to the change in AET. The SC of a meteorological element is positive or negative, indicating that AET increases or decreases as the element increases.

3. Results

3.1. Validation of AET Simulation Results

In this study, seasonal statistics and analysis were conducted from March to May for spring, June to August for summer, September to November for autumn, and December to February for winter. From Table 3, in terms of seasonal simulation results, spring has the best effect, followed by autumn and winter, and summer has the biggest error. In spring, R2, NSE, and MRE were 0.83, 0.72, and 6.39%, respectively, indicating that the LPJ model could accurately simulate the AET characteristics in the TGRA. Both R2 and NSE in autumn were higher than those in spring, indicating that the description of the change characteristics in AET in autumn was better than that in spring, and MRE was higher than that in spring, indicating that the characterization of AET in autumn was inferior to that in spring. The overall simulation accuracy in winter was slightly worse than that in spring and autumn, and it was the worst in summer, with R2, NSE, and MRE percentages of 0.76, 0.63, and 17.68%, respectively. For the annual simulation results, R2 and NSE were 0.89 and 0.76, respectively, indicating a high degree of fitting between simulated and measured AET sequences. The MRE was 4.32%, indicating a small error between the simulated and measured values of AET. From the scatterplot of measured and simulated AET (Figure 2), scatter points are basically distributed around the trend line, and the slope of the trend line is less than 1, indicating that the simulated AET was slightly lower than the measured AET. In general, the LPJ model had good performance in simulating the AET, which can accurately represent the actual trend characteristics of AET in the TGRA.

3.2. Spatial and Temporal Characteristics of Variations in AET

From the perspective of the interannual variation trend, the AET showed a fluctuating upward trend (Figure 3a), with a multiyear average value of 651.43 mm. The highest and lowest values were 739.77 mm and 583.04 mm, respectively. After 2002, it was significantly higher than before. The annual distribution of AET showed a unimodal seasonal variation trend (Figure 3b). The peak value occurred in July, reaching 113.02 mm, whereas the valley value occurred in January and December, less than 13 mm. In addition to a slight decreasing trend in May, AET showed an increasing trend in other months, among which Sen’s slope statistics in January to April and July to September passed the significance test. AET increased the fastest in July at a speed of 6.64 mm/10a, and the overall change was evident.
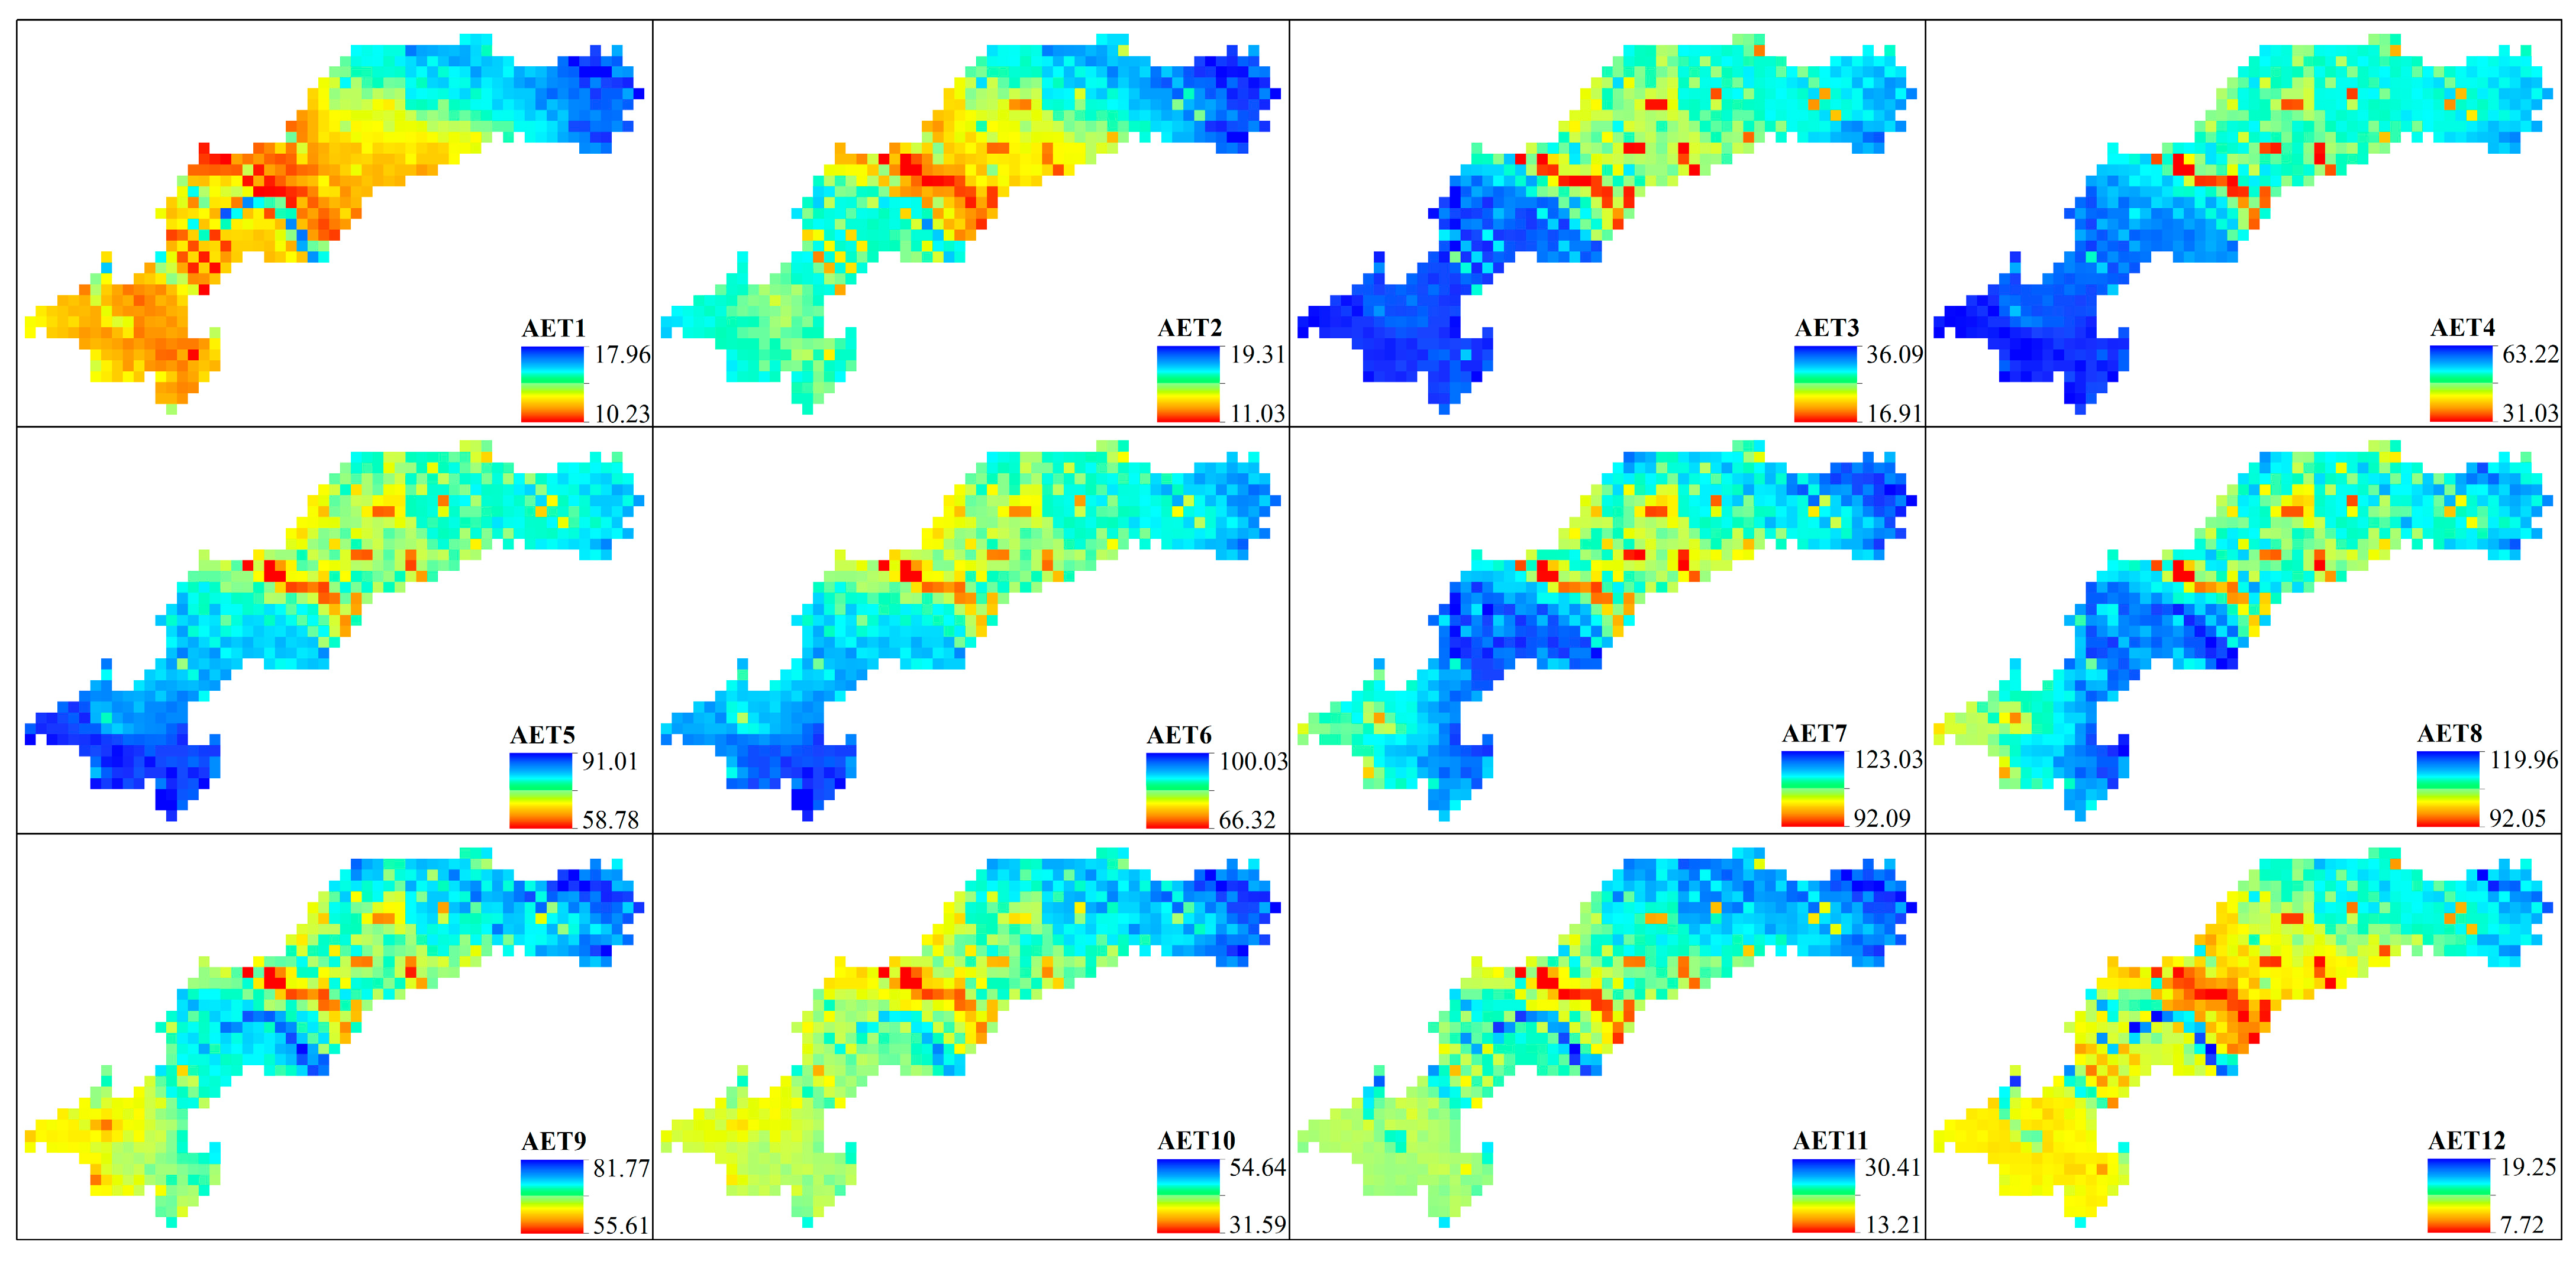
As shown in Figure 4, the spatial distribution of monthly AET showed significant seasonal differences. In spring and summer from March to August, the spatial distribution of AET showed significant characteristics of high in the west and low in the east. The value of monthly AET in summer was higher than other seasons, reflecting the characteristics of increased soil evaporation and vegetation transpiration level under adequate water and heat conditions, which led to good vegetation growth in summer. The spatial distribution of autumn AET from September to November showed similar characteristics of high in the head and the west and lower in the end and the east of the reservoir. In November, the AET clearly decreased, reflecting the characteristics of vegetation fading and evapotranspiration decreasing in late autumn and early winter. The spatial pattern of AET from December to February was similar and reached the lowest level of the whole year, reflecting the characteristics of the low AET level caused by vegetation decay and insufficient hydrothermal conditions in winter.
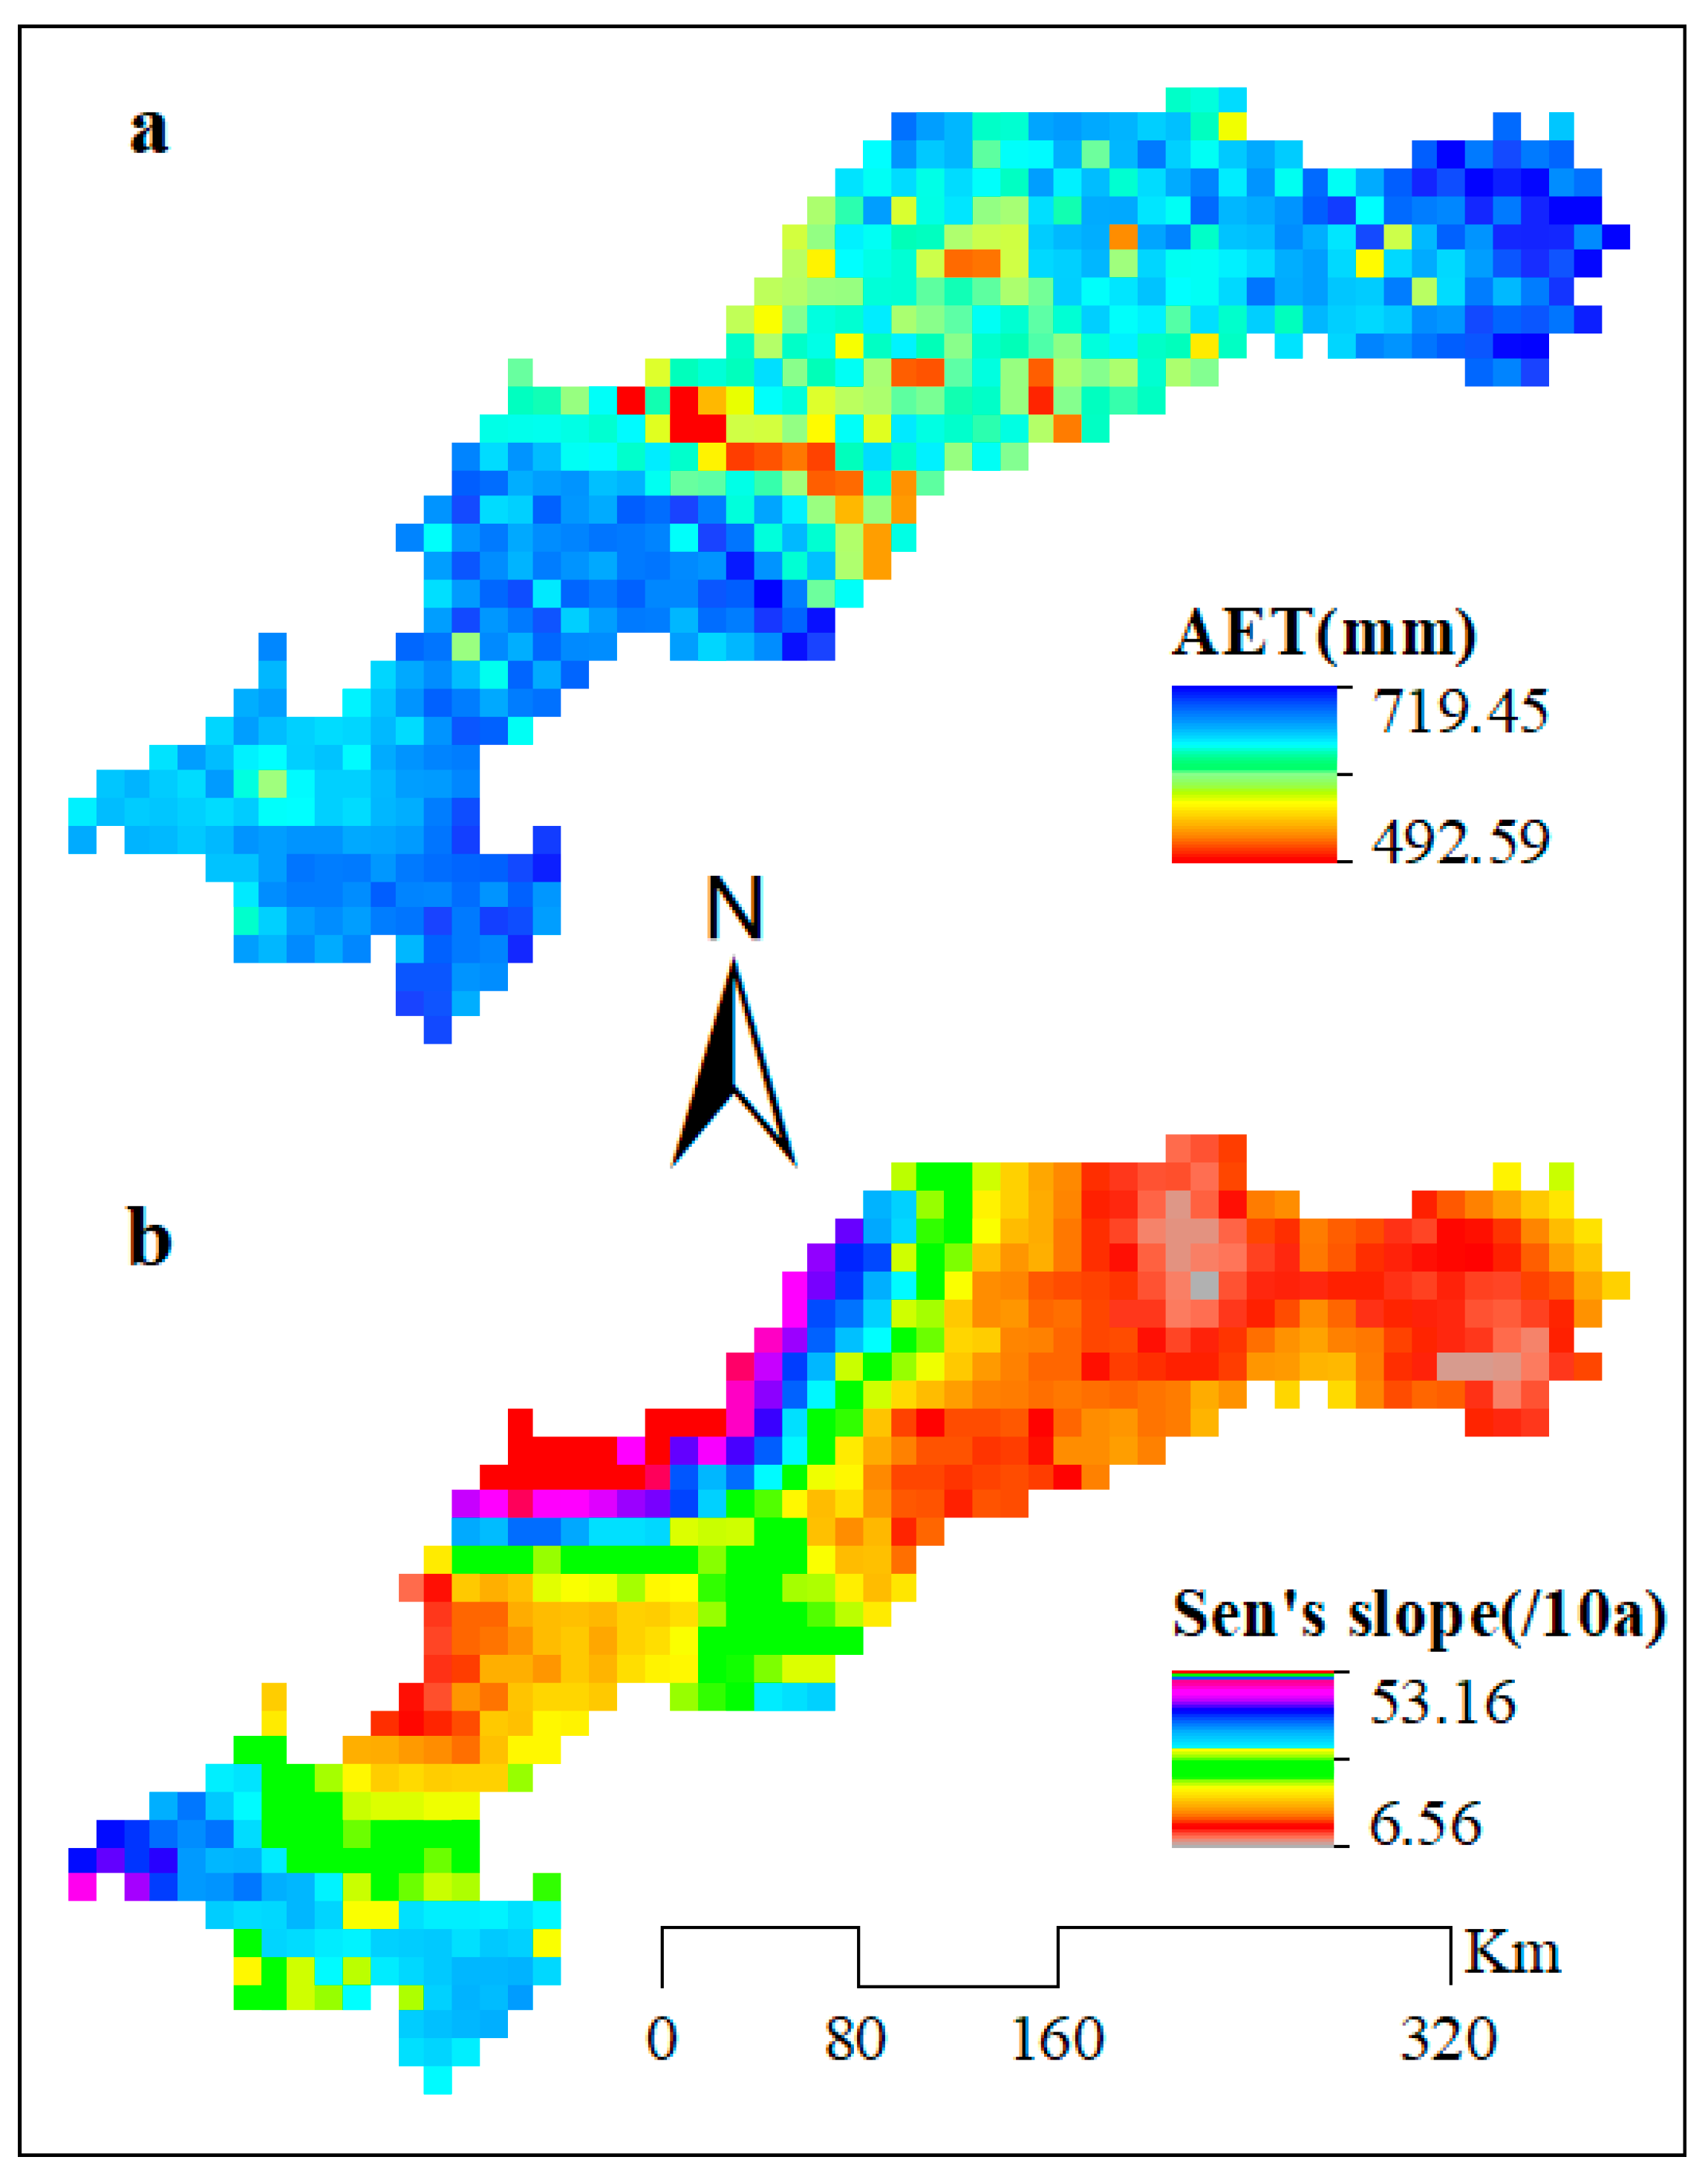
The multiyear average AET in the TGRA ranged from 492.59 to 719.45 mm (Figure 5a), and the average for the whole area was 645.96 mm. AET exhibited nonsignificant spatial differentiation and showed a decreasing trend from the east and west to the center. As shown in Figure 5b, from 1981 to 2020, the annual change rate of AET in the TGRA ranged from 6.56 to 53.16 mm/10a, and the spatial statistical mean value was 21.63 mm/10a. The changes in AET in the end of tail areas and part of the northern belly areas were significant, and the increased amplitude in other regions was small.

3.3. Analysis of Driving Mechanism for AET in the TGRA

3.3.1. Correlation Analysis

Correlation analysis [52] was conducted between AET and climate factors to identify the key climate factors affecting AET. The results showed a significant linear correlation between AET and P, T, and net radiation (Rs) in the TGRA, with correlation coefficients of 0.74, 0.96, and 0.91, respectively (Table 4). In order to improve the fitting accuracy, the principle of the maximum correlation coefficient was adopted. After many simulations, it was found that the correlation coefficients of exponential regression between AET and P, T, and Rs were relatively higher than linear regression, with correlation coefficients of 0.78, 0.97, and 0.94, respectively (Table 4).
Figure 6 shows the exponential regression relationships between AET and P, T, and Rs in the TGRA. In comparison, the regression relation between AET and T was the best, followed by Rs and the lowest of P, with an adjusted R2 of 0.95, 0.88, and 0.61, respectively. It showed that AET in the TGRA was mainly affected by the temperature and radiation term, which is consistent with the conclusion of Yan et al. [53].

3.3.2. Change Characteristics of Key Climatic Factors

The interannual variation characteristics (Figure 7a,c,e) and M-K test (Figure 7b,d,f) of P, T, and Rs in the TGRA from 1981 to 2020 are shown in Figure 7. Table 5 shows the statistical variation results of each factor based on Sen’s slope tests. In the past 40 years, the P has fluctuated significantly (Figure 7a) and increased slightly at a change rate of 11.86 mm/10a (Table 5). There were several abrupt transition points in P, which occurred in 1981, 1983, 2015, and 2018 during the statistical period (Figure 7b). Since 1981, the T has been steadily increasing at a rate of 0.31 °C/10a (Table 5), and an abrupt transition point occurred in 2000 (Figure 7d). From 1981 to 2020, the mean value of Rs was 2297.31 MJ/m2 (Figure 7e) and decreased at a rate of 2.75 MJ/m2/10a (Table 5). The abrupt transition points in Rs occurred in 2001, 2003, and 2018 (Figure 7f). In general, there were certain fluctuations in climate change in the TGRA, but the whole trend was relatively stable.

3.3.3. Sensitivity Analysis

Combined with the abrupt change time of T (Figure 7d: 2001) and Rs (Figure 7f: 2001 and 2003), which has a large-degree influence on AET, and the change trend in AET (Figure 3a), there is a significant difference between the two periods before and after impoundment for the Three Gorges Project. Therefore, the statistical period (1981–2020) for the driving mechanism of AET was divided into two stages of before (BI: 1981–2002) and after impoundment (AI: 2003–2020).
Table 6 shows the amplitudes of the SCs calculated according to Equation (13) for the P, T, and Rs of the TGRA. The SC of AET to P increased at a rate of 0.07/10a, 0.15/10a, and 0.01/10a during BI, AI, and the whole study period, respectively. The statistical results did not pass the significance test. The SC of AET to T changed by 0.09/10a and −0.03/10a in BI and AI, respectively. The influence of T on AET increased before impoundment and began to weaken after impoundment. During the whole study period, the SC for T showed a weak increasing trend with a change rate of 0.03/10a. The SC of AET to Rs showed a decreasing trend in BI, AI, and the whole study period. From 2003 to 2020, the decrease trend was significant, with a change rate of −0.08/10a, indicating that the influence of Rs on AET clearly weakened during AI.
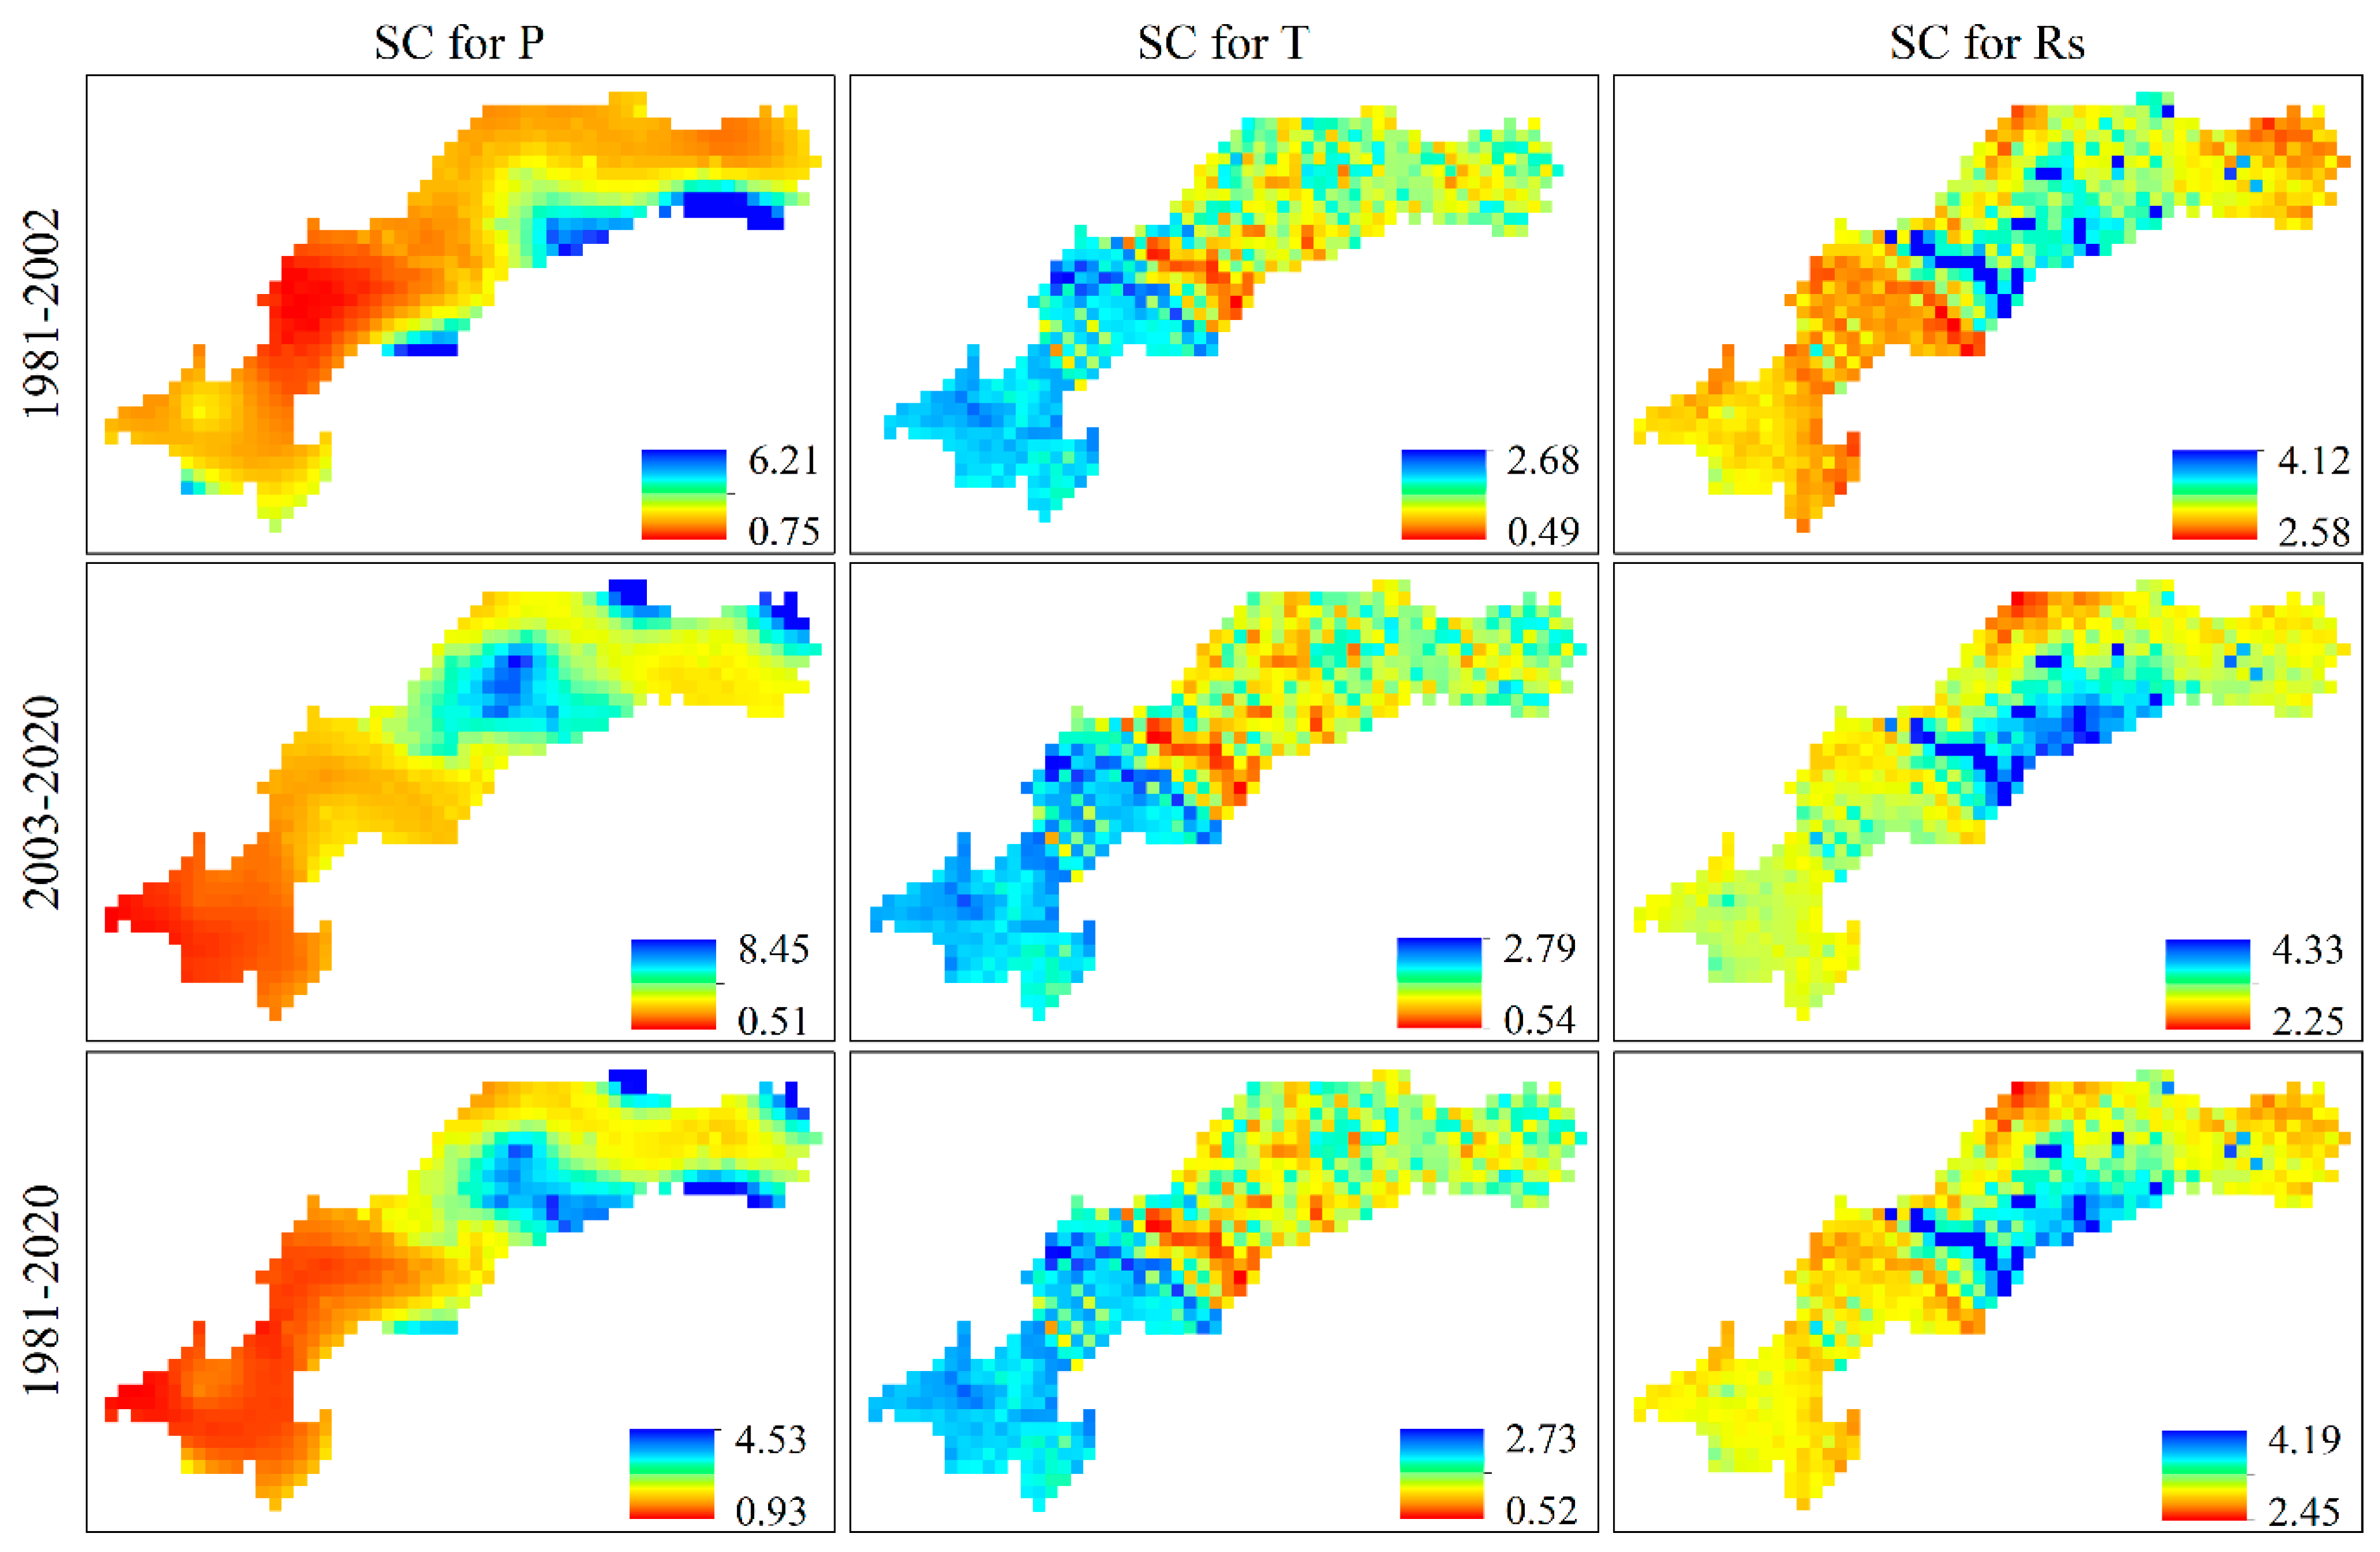
Figure 8 shows the spatial distributions of the annual average SCs of AET to each climate factor in different periods. From 1981 to 2002, the SC for P ranged from 0.75 to 6.21, with a spatial averaged value of 1.07. Except for a few areas in the southern edge of the TGRA reaching a higher value, the SC for P distribution in other areas was even. The averaged SC for T was 1.76, and the spatial distribution was high in the west and low in the east. The averaged SC for Rs was 3.09. The spatial distribution showed a characteristic of ‘high in the middle and low at both end’. During 2003–2020, the spatial difference of the SC for P was significant, with maximum and minimum values of 0.51 and 8.45, respectively, and the mean value was 1.12, slightly increased compared with that before 2002. The SC for P was higher in east belly areas and head areas of the reservoir and evenly distributed at a lower level in other areas. The SC for T increased compared with that before 2002, with a mean value of 1.84. The spatial distribution of the SC for Rs was basically the same as that in BI, and the value of SC decreased slightly, with a spatial mean value of 2.84. During the whole study period, the SCs of AET to P, T, and Rs were 1.09, 1.80, and 2.99, respectively. The spatial distributions were generally consistent with that in AI. The SC for Rs was the highest, followed by T, and P was the lowest, which indicates that the change in Rs per unit quantity leads to the largest degree of change in AET, whereas P was the least. It also indicates that the temperature and radiation term was the dominant climatic factor leading to the change in AET in the TGRA.

3.3.4. Contribution of Driving Factors to the Change in AET

The contribution rates of meteorological factors to the change in AET in different statistical periods in the TGRA were calculated according to the sensitivity analysis results and Equation (14), and the results are shown in Table 7. From 1981 to 2002, the changes in P, T, and Rs could cause the change rates of AET to be 5.54%, 0.24%, and 0.03%, respectively. The influences of the three factors on AET were all positive driving, in which the P contributed the most to the change in AET, followed by T, and the contribution of Rs was the smallest. During 2003 to 2020, the contribution of P and T to the change in AET decreased to a certain extent compared with that before 2002, whereas Rs had a certain inhibitory effect on the increase in AET, which was mainly related to the significant decrease trend in Rs during this period. From the perspective of the whole study period, P and T had a great influence on the change in AET. In general, the increases in P and T were the main reasons for the increase in the AET of the TGRA, and the decrease in Rs weakened the increased tendency.
The change rates of AET in BI, AI, and the whole study period were calculated, and the contribution of human activities to the change in AET was obtained by subtracting the change rate caused by climate factors from the total change rate of AET. As shown in Table 8, during 1981–2002, the AET changed by 5.60%, the change rate caused by climate factors was 5.81%, accounting for 103.75%, and the contribution of human activities was −0.21%, accounting for −3.75%, indicating that the effect of human activities on AET during this period was negative driving. In BI, human activities caused a certain degree of disturbance to the underlying surface and vegetation destruction, which inhibited the increase in AET. From 2003 to 2020, the AET changed by 6.28%, in which climate factors and human activities contributed 4.59% and 1.69%, with contribution rates of 73.09% and 26.91%, respectively; the contribution rate of human activities increased significantly. During the whole study period, the change rate of AET was 5.28%, the contributions of climate change and human activities were 4.72% and 0.56%, respectively, and the contribution ratios were 89.39% and 10.61%, respectively, indicating that in the nearly 40 years from BI to AI, human activities contributed 10.61% to the increase in AET, and the climate factor was the dominant factor on the increase in AET.

4. Discussion

4.1. Reliability of the Simulated AET

The validation of AET simulated by the LPJ was mainly based on MODIS AET products from 2001 to 2020. In order to further explore the reliability of this study, we compared other scholars’ research results about AET in the TGRA and its surrounding areas. The specific comparison results are shown in Table 9. Wang et al. [54] used CLM4.5, which belongs to a kind of DGVM-simulated AET of the TGRA, from 1993 to 2013. The results showed that the multiyear average AET was 606 mm. In our study, the multiyear average AET during the same time scale was 655.11 mm, which is close to the CLM4.5-simulated AET, with a relative error of 7.50%. Cui et al. [55] also used the CLM4.5 to estimate the AET in the TGRA from 1990 to 2015 and obtained a multiyear average AET of 590.75 mm, which had a relative error of 9.17% with this paper. Cao et al. [56] estimated the regional AET in the middle and lower reaches of the Yangtze River by using the principle of water balance and remote-sensed data from 1992 to 2015 and found that the multiyear average AET was 728.70 mm, which was more than our result by 10.57%. Considering that the middle and lower reaches of the Yangtze River contain a part of the TGRA, we think the results are reliable for comparison to a certain extent.
According to the above comparisons, it is concluded that the results of AET in this study match well with previous studies in different research periods and locations around the TGRA. Therefore, we are convinced that the simulation of AET in this study is reliable and credible.

4.2. Distribution and Variations in AET Components

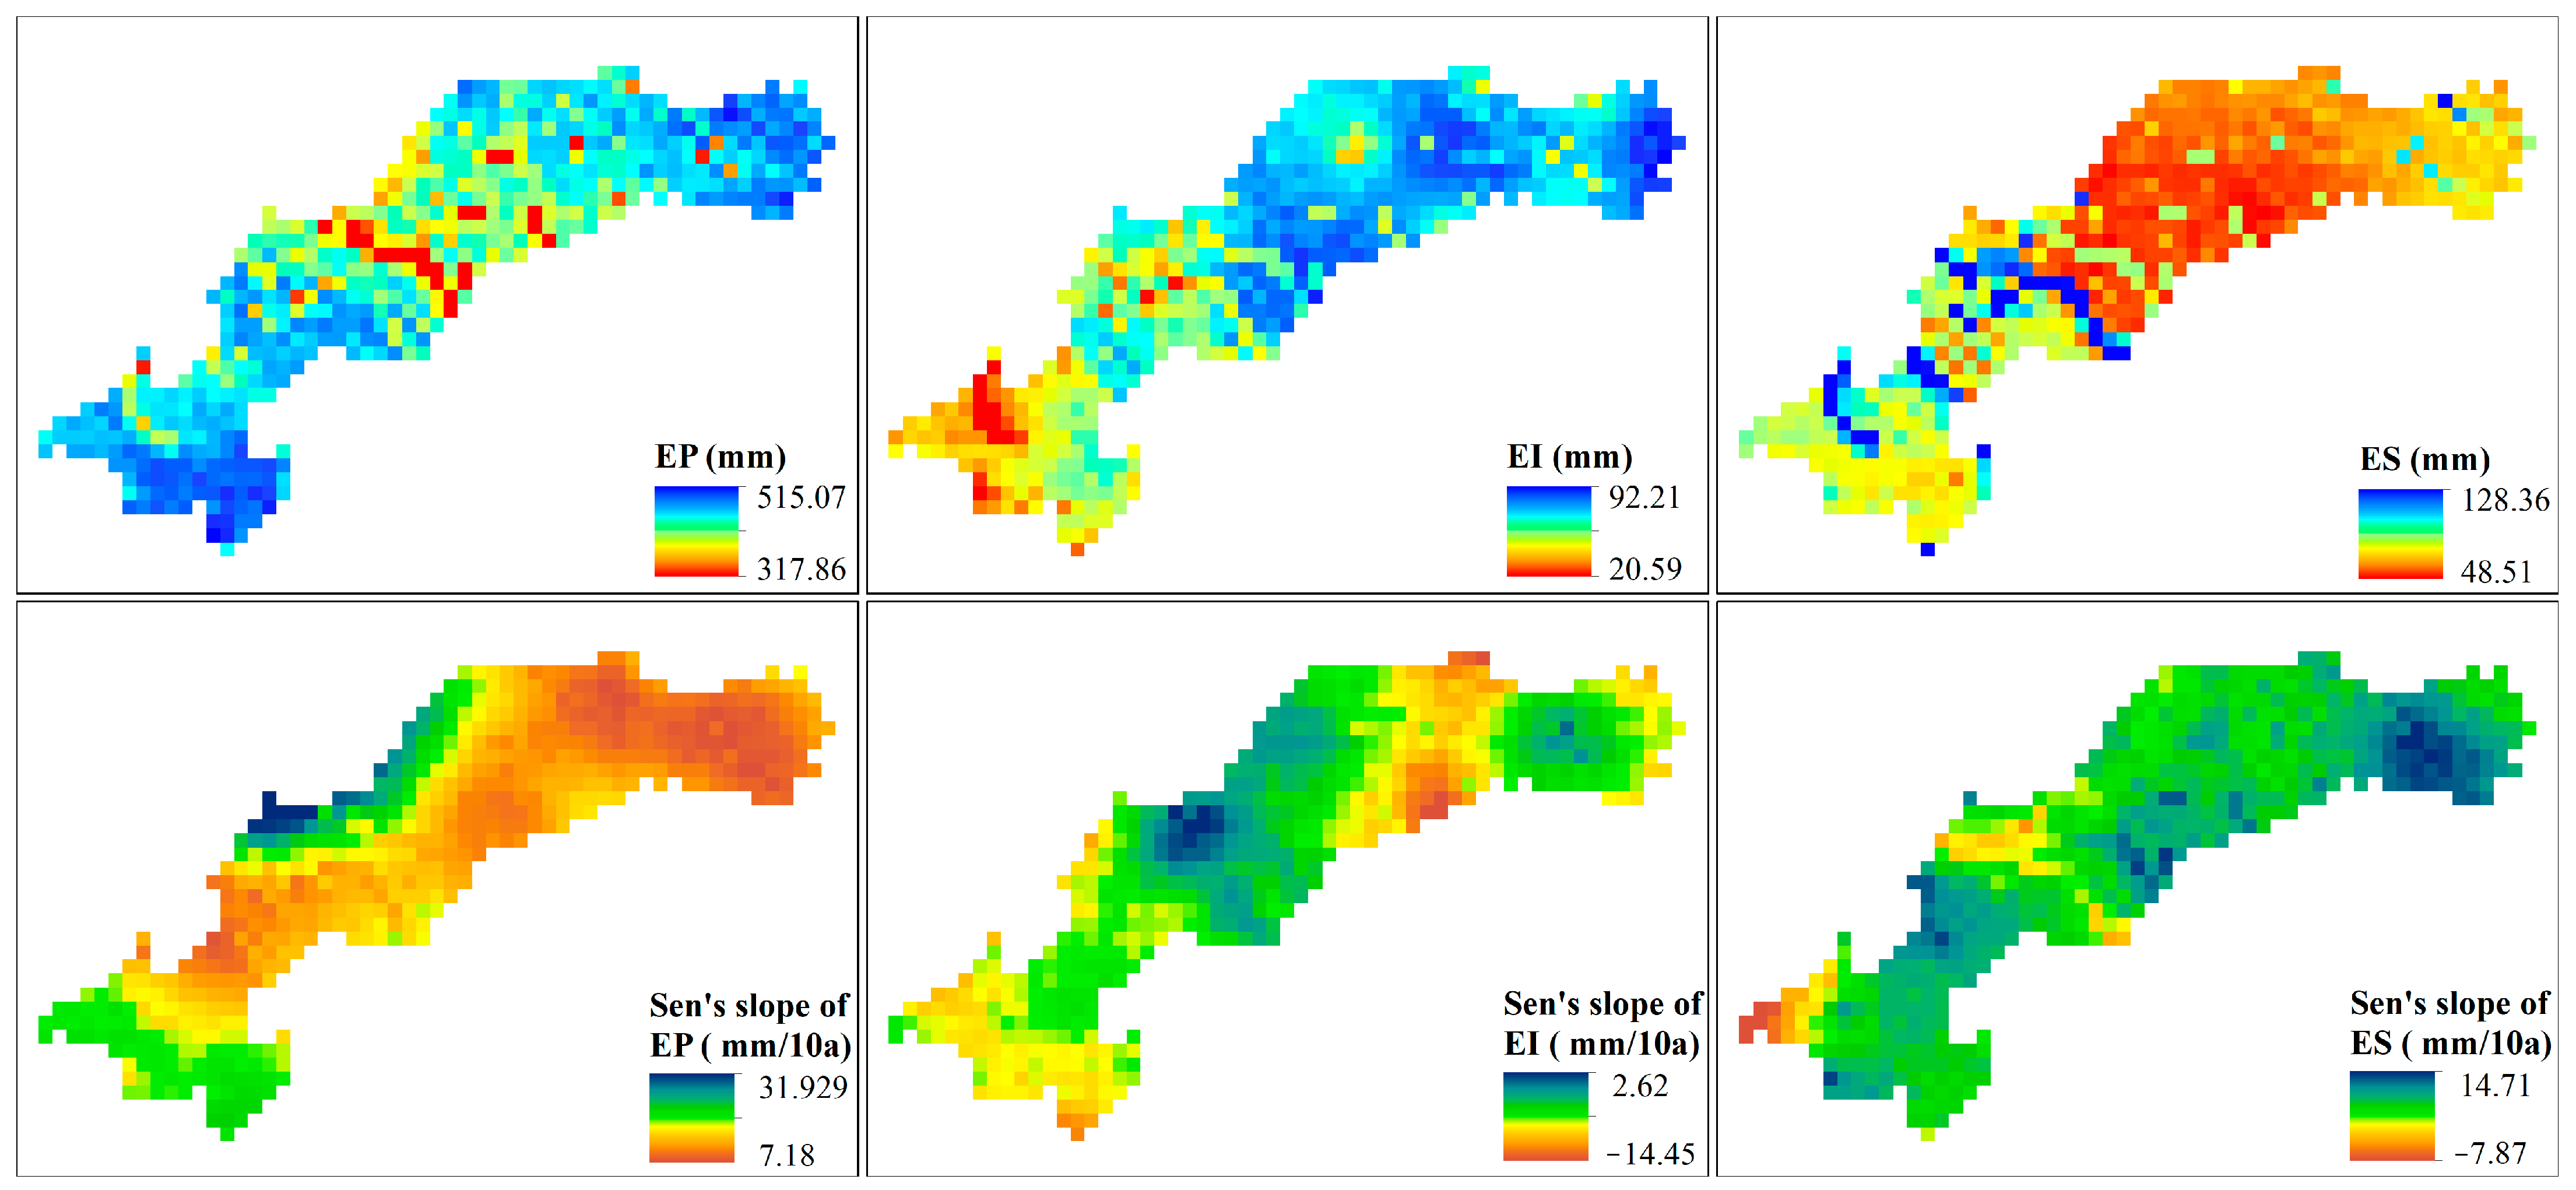
In the LPJ model, AET consists of EP, EI, and ES. An analysis of the variation characteristics in these three parts is helpful to understand the variation in AET. Figure 9 shows the spatial distribution and variation amplitude of the three parts in the TGRA. The spatial statistical mean values of EP, EI, and ES were 459.33 mm, 78.57 mm, and 108.06 mm, respectively. Among them, EP accounted for the largest proportion of AET, with 71.11%, indicating that the AET was mainly from canopy transpiration. EP ranged from 317.86 to 515.07 mm. Under the background of increasing T and P, which provided a hydrothermal condition, vegetation growth showed a benign trend, and EP increased accordingly. EI accounted for the smallest proportion of AET with 12.16%. The annual averaged EI ranged from 20.59 to 92.21 mm and showed a decreasing trend in most regions, especially in urban areas, where the urban expansion was the main reason for the decrease in EI. ES ranged from 48.51 to 128.36 mm, accounting for 16.72% of AET. Except for a few areas at the end of the reservoir, ES increased in most areas of the TGRA. As for the reservoir impoundment, the water level and water surface area increased; the water supply was sufficient to fully meet the potential evapotranspiration demand. Therefore, ES increased significantly in water bodies and surrounding areas. In general, the AET increased during the study period, and its components presented different spatial and variation characteristics.

4.3. Limitations and Future Improvements

Although the LPJ model had a good performance in simulating the AET over the TGRA, it is still necessary to discuss the limitations of the modeling results. Firstly, the spatial resolution of the atmospheric forcing data is 0.1 degrees, which leads to the spatial distribution of AET not being accurately described. Secondly, the parameters in the LPJ model are numerous and difficult to obtain, and the ecological physiological parameters in the model mainly refer to the previous research results; we used just 2009 soil texture data in the LPJ model, which created uncertainty in the simulation of AET. Finally, human activities drive AET, mainly in two ways. The first is to directly affect the dynamic process of the hydrologic cycle by changing the land use types [54], and the second is to make a certain climate effect due to the disturbance to the underlying surface. This climate effect feeds back into climate change, which, in turn, affects the hydrologic cycle [57,58,59]. The change in the contribution rate of human activities on AET variation indicates that human activities drove AET mainly through the first and second ways before and after impoundment. In fact, the process of producing climate effects by human activities throughout the whole study period and the contribution of climate factors on AET change partially include human effects. Therefore, localization parameters need to be acquired through field detection or experimental observation, and a more accurate input dataset and different ages of soil data for different simulation periods are needed to carry out future research. Based on the higher-resolution simulation results and setting different simulation scenarios, separating the part of the effect produced by human factors from climate change would also be the focus of future research.

5. Conclusions

In this study, we simulated the AET from 1981 to 2020 in the TGRA by using the LPJ model, and we quantified the individual contributions of climate and human factors to changes in AET in different periods using Sen’s slope and sensitivity analysis methods. The results of this study demonstrate the following:
(1) The simulation accuracy of the LPJ model for AET in the TGRA was the best in spring and autumn, followed by winter, and the worst in summer. In general, the overall accuracy was high, which can accurately represent the trend characteristics of AET in the TGRA.
(2) During 1981–2020, the AET showed a fluctuating upward trend, with a multiyear average value and increase rate of 645.96 mm and 21.63 mm/10a. The annual distribution of AET showed a unimodal seasonal variation trend, with a peak value in July of 113.02 mm and the valley value in January and December at less than 13 mm. The spatial distribution of AET was even. The changes in AET in the end of tail areas and part of the northern belly areas were significant, whereas the increased amplitude in other regions was small.
(3) Correlation analysis showed that the key climate factors affecting AET changes in the TGRA were mainly P, T, and Rs. The SC of AET to Rs was the highest at 2.99, followed by T of 1.80, and P was the lowest at 1.09, which means that the change in Rs per unit quantity leads to the largest degree of change in AET, whereas P was the least. It also indicates that the temperature and radiation term was the dominant climatic factor, leading to the change in the AET in the TGRA.
(4) From 1981 to 2002, the change rate in the AET was 5.60%; the change rates caused by climate factors and human activities were 5.81% and −0.21%, accounting for 103.75% and −3.75%, respectively. From 2003 to 2020, the AET changed by 6.28%, in which climate and human factors contributed 73.09% and 26.91%, respectively. From the whole study period, the change rate of AET was 5.28%, and the contribution ratios of climate and human factors were 89.39% and 10.61%, respectively. Overall, human activities and climate change, which hold a dominant position, jointly promoted the increase in AET in the TGRA.

Author Contributions

H.W. conceived the idea and helped with language editing. X.Z. performed the analyses and wrote the paper. G.W. helped revise the paper. All authors have read and agreed to the published version of the manuscript.

Funding

This research was funded by the Special Topic on Basic and Applied Research of Guangzhou Science and Technology Bureau (SL2023A04J00927), Special program for high level talents of Guangdong polytechnic of industry and commerce (2022-gc-12), and National Key Research and Development Project of China (Grant 2021YFC3000202).

Data Availability Statement

Data are contained within the article.

Acknowledgments

We thank the anonymous reviewers and the editor for their suggestions, which substantially improved the manuscript. Special thanks need to go to the National Tibetan Plateau Data Center; they provided the China meteorological forcing dataset.

Conflicts of Interest

The authors declare no conflict of interest.

References

  1. Wu, B.; Yan, N.; Xiong, J.; Bastiaanssen, W.G.M.; Zhu, W.; Stein, A. Validation of ETWatch using field measurements at diverse landscapes: A case study in Hai Basin of China. J. Hydrol. 2012, 436-437, 67–80. [Google Scholar] [CrossRef]
  2. Mahmoud, S.H.; Gan, T.Y. Irrigation water management in arid regions of Middle East: Assessing spatio-temporal variation of actual evapotranspiration through remote sensing techniques and meteorological data. Agric. Water Manag. 2019, 212, 35–47. [Google Scholar] [CrossRef]
  3. Wu, B.; Zhu, W.; Yan, N.; Xing, Q.; Xu, J.; Ma, Z.; Wang, L. Regional Actual Evapotranspiration Estimation with Land and Meteorological Variables Derived from Multi-Source Satellite Data. Remote Sens. 2020, 12, 332. [Google Scholar] [CrossRef]
  4. Su, W.; Shao, H.; Xian, W.; Xie, Z.; Zhang, C.; Yang, H. Quantification of Spatiotemporal Variability of Evapotranspiration (ET) and the Contribution of Influencing Factors for Different Land Cover Types in the Yunnan Province. Water 2023, 15, 3309. [Google Scholar] [CrossRef]
  5. Yao, J.; Mao, W.; Yang, Q.; Xu, X.; Liu, Z. Annual actual evapotranspiration in inland river catchments of China based on the Budyko framework. Stoch. Environ. Res. Risk Assess. 2016, 31, 1409–1421. [Google Scholar] [CrossRef]
  6. Shi, Z.; Xu, L.; Yang, X.; Guo, H.; Dong, L.; Song, A.; Zhang, X.; Shan, N. Trends in reference evapotranspiration and its attribution over the past 50 years in the Loess Plateau, China: Implications for ecological projects and agricultural production. Stoch. Environ. Res. Risk Assess. 2017, 31, 257–273. [Google Scholar] [CrossRef]
  7. Ji, Y.; Tang, Q.; Yan, L.; Wu, S.; Yan, L.; Tan, D.; Chen, J.; Chen, Q. Spatiotemporal Variations and Influencing Factors of Terrestrial Evapotranspiration and Its Components during Different Impoundment Periods in the Three Gorges Reservoir Area. Water 2021, 13, 2111. [Google Scholar] [CrossRef]
  8. Jiao, P.; Hu, S. Estimation of Evapotranspiration in the Desert–Oasis Transition Zone Using the Water Balance Method and Groundwater Level Fluctuation Method—Taking the Haloxylon ammodendron Forest at the Edge of the Gurbantunggut Desert as an Example. Water 2023, 15, 1210. [Google Scholar] [CrossRef]
  9. Wei, L.; Duan, K.; Liu, X.; Lin, Y.; Chen, X.; Wang, X. Assessing human-induced evapotranspiration change based on multi-source data and Bayesian model averaging at the basin scale. Shuili Xuebao 2022, 53, 433–444. [Google Scholar] [CrossRef]
  10. Duan, K.; Sun, G.; Liu, N. A review of research on watershed water-carbon balance evolution in a changing environment. Shuili Xuebao 2021, 52, 300–309. [Google Scholar] [CrossRef]
  11. Chen, H.; Zhu, G.; Shang, S.; Qin, W.; Zhang, Y.; Su, Y.; Zhang, K.; Zhu, Y.; Xu, C. Uncertainties in partitioning evapotranspiration by two remote sensing-based models. J. Hydrol. 2022, 604, 127223. [Google Scholar] [CrossRef]
  12. Mekonnen, K.; Melesse, A.M.; Woldesenbet, T.A. How suitable are satellite rainfall estimates in simulating high flows and actual evapotranspiration in MelkaKunitre catchment, Upper Awash Basin, Ethiopia? Sci. Total Environ. 2022, 806, 150443. [Google Scholar] [CrossRef] [PubMed]
  13. Zhang, X.; Duan, Y.; Duan, J.; Jian, D.; Ma, Z. A daily drought index based on evapotranspiration and its application in regional drought analyses. Sci. China Earth Sci. 2022, 65, 317–336. [Google Scholar] [CrossRef]
  14. Zhang, Y.; Yao, L.; Geurink, J.S.; Parajuli, K.; Wang, D. Climatic Control on Mean Annual Groundwater Evapotranspiration in a Three-Stage Precipitation Partitioning Framework. Water Resour. Res. 2023, 59, e2022WR034167. [Google Scholar] [CrossRef]
  15. Chen, H.; Liu, H.; Chen, X.; Qiao, Y. Analysis on impacts of hydro-climatic changes and human activities on available water changes in Central Asia. Sci. Total Environ. 2020, 737, 139779. [Google Scholar] [CrossRef]
  16. Sitch, S.; Huntingford, C.; Gedney, N.; Levy, P.E.; Lomas, M.; Piao, S.L.; Betts, R.; Ciais, P.; Cox, P.; Friedlingstein, P.; et al. Evaluation of the terrestrial carbon cycle, future plant geography and climate-carbon cycle feedbacks using five Dynamic Global Vegetation Models (DGVMs). Glob. Chang. Biol. 2008, 14, 2015–2039. [Google Scholar] [CrossRef]
  17. Che, M.; Chen, B.; Wang, Y.; Guo, X. Review of dynamic global vegetation models (DGVMs). Chin. J. Appl. Ecol. 2014, 25, 263–271. [Google Scholar]
  18. Wang, G.; Qian, J.; Cheng, G. Current situation and prospet of the ecological hydrology. Adv. Earth Sci. 2001, 16, 314–323. [Google Scholar]
  19. Smith, B.; Sykes, P.M.T. Representation of vegetation dynamics in the modelling of terrestrial ecosystems: Comparing two contrasting approaches within European climate space. Glob. Ecol. Biogeogr. 2001, 10, 621–637. [Google Scholar] [CrossRef]
  20. Bonan, G.; Levis, S.; Sitch, S.; Vertenstein, M.; Oleson, K. A dynamic global vegetation model for use with climate models: Concepts and description of simulated vegetation dynamics. Glob. Chang. Biol. 2003, 9, 1543–1566. [Google Scholar] [CrossRef]
  21. Thonicke, K.; Venevsky, S.; Sitch, S.; Cramer, W. The role of fire disturbance for global vegetation dynamics: Coupling fire into a Dynamic Global Vegetation Model. Glob. Ecol. Biogeogr. 2001, 10, 661–677. [Google Scholar] [CrossRef]
  22. Venevsky, S.; Maksyutov, S. SEVER: A modification of the LPJ global dynamic vegetation model for daily time step and parallel computation. Environ. Model. Softw. 2007, 22, 104–109. [Google Scholar] [CrossRef]
  23. Renwick, K.M.; Fellows, A.; Flerchinger, G.N.; Lohse, K.A.; Clark, P.E.; Smith, W.K.; Emmett, K.; Poulter, B. Modeling phenological controls on carbon dynamics in dryland sagebrush ecosystems. Agric. For. Meteorol. 2019, 274, 85–94. [Google Scholar] [CrossRef]
  24. Sitch, S.; Smith, B.; Prentice, I.; Arneth, A.; Bondeau, A.; Cramer, W.; Kaplan, J.; Levis, S.; Lucht, W.; Sykes, M.; et al. Evaluation of ecosystem dynamics, plant geography and terrestrial carbon cycling in the LPJ dynamic global vegetation model. Glob. Chang. Biol. 2003, 9, 161–185. [Google Scholar] [CrossRef]
  25. Zhao, M.; Yue, T.; Zhao, N.; Sun, X.; Zhang, X. Combining LPJ-GUESS and HASM to simulate the spatial distribution of forest vegetation carbon stock in China. J. Geogr. Sci. 2014, 24, 249–268. [Google Scholar] [CrossRef]
  26. Sun, G.; Mu, M. Understanding variations and seasonal characteristics of net primary production under two types of climate change scenarios in China using the LPJ model. Clim. Chang. 2013, 120, 755–769. [Google Scholar] [CrossRef]
  27. Zhang, F.; Zhang, Z.; Tian, J.; Huang, R.; Kong, R.; Zhu, B.; Zhu, M.; Wang, Y.; Chen, X. Forest NPP simulation in the Yangtze River Basin and its response to climate change. J. Nanjing For. Univ. (Nat. Sci. Ed.) 2021, 45, 175–181. [Google Scholar]
  28. Zhao, D.; Wu, S.; Yin, Y. Variation trends of natural vegetation net primary productivity in China under climate change scenario. Chin. J. Appl. Ecol. 2011, 22, 897–904. [Google Scholar] [CrossRef]
  29. Hao, B.; Yang, H.; Ma, M.; Hao, D.; Liu, Y.; Han, X.; Li, S.; Lai, P. Variation in Land Use and Land Surface Parameters in the Three Gorges Reservoir Catchment Based on Google Earth Engine. Resour. Environ. Yangtze Basin 2020, 29, 1343–1355. [Google Scholar]
  30. Luo, R.; Luo, D.; Xiao, J. A Brief Analysis of the Categories and Characteristics of Reservoir Area Towns’ Cityscape Changes along the River in the Post Three Gorges Period: Case Studies of Wanzhou, Wushan and Yunyang. Ecol. Environ. Landsc. 2020, 38, 5–11+43. [Google Scholar]
  31. Lv, S. Study on Land Use Change and Ecological Service Value in the Three Gorges Reservoir Area. Master’s Thesis, Southwest University, Chongqing, China, 2019. [Google Scholar]
  32. Shao, P.; Zeng, X. Progress in the study of the effects of land use and Land cover change on the climate system. Clim. Environ. Res. 2012, 17, 103–111. [Google Scholar]
  33. Zhai, J.; Liu, R.; Liu, J.; Zhao, G.; Huang, L. Radiative forcing over China due to albedo change caused by land cover change during 1990–2010. J. Geogr. Sci. 2013, 68, 875–885. [Google Scholar] [CrossRef]
  34. Liu, F.; Tao, F.; Xiao, D.; Zhang, S.; Wang, M.; Zhang, H. Influence of land use change on surface energy balance and climate: Results from SiB2 model simulation. Prog. Geogr. 2014, 33, 815–824. [Google Scholar]
  35. Ding, X.; Zhou, H.; Wang, Y.; Lei, X. Prediction and evaluation on status of water cycle elements within area of Three Gorges Reservoir. Water Resour. Hydropower Eng. 2011, 42, 1–5. [Google Scholar]
  36. Yang, H.; Wang, G.; Wang, L.; Zheng, B. Impact of land use changes on water quality in headwaters of the Three Gorges Reservoir. Environ. Sci. Pollut. Res. Int. 2016, 23, 11448–11460. [Google Scholar] [CrossRef] [PubMed]
  37. Webber, M.; Li, M.T.; Chen, J.; Finlayson, B.; Chen, D.; Chen, Z.Y.; Wang, M.; Barnett, J. Impact of the Three Gorges Dam, the South–North Water Transfer Project and water abstractions on the duration and intensity of salt intrusions in the Yangtze River estuary. Hydrol. Earth Syst. Sci. 2015, 19, 4411–4425. [Google Scholar] [CrossRef]
  38. Yue, P. Land Use/Cover Change and it’s Eco-Environment Effect of Typical Districts in the Three Gorges Reservoir Region (Chongqing). Ph.D. Thesis, Southwest University, Chongqing, China, 2010. [Google Scholar]
  39. Nakayama, T.; Shankman, D. Impact of the Three-Gorges Dam and water transfer project on Changjiang floods. Glob. Planet. Chang. 2013, 100, 38–50. [Google Scholar] [CrossRef]
  40. Xiao, Q.; Hu, D.; Xiao, Y. Assessing changes in soil conservation ecosystem services and causal factors in the Three Gorges Reservoir region of China. J. Clean. Prod. 2017, 163, 172–180. [Google Scholar] [CrossRef]
  41. Meng, H.; Zhou, Q.; Li, M.; Chen, P.; Tan, M. Topographic Distribution Characteristics of Vegetation Cover Change in the Three Gorges Reservoir Area Based on MODIS Pixel Scale. Resour. Environ. Yangtze Basin 2020, 29, 1790–1799. [Google Scholar]
  42. Li, Y.C.; Liu, C.X.; Min, J.; Wang, C.J.; Zhang, H.; Wang, Y. RS/GIS-based integrated evaluation of the ecosystem services of the Three Gorges Reservoir area (Chongqing section). Acta Ecol. Sin. 2013, 33, 168–178. [Google Scholar]
  43. Bonan, G.; Levis, S.; Kergoat, L.; Oleson, K. Landscapes as patches of plant functional types: An integrating concept for climate and ecosystem models. Glob. Biogeochem. Cycles 2002, 16, 5–1–5-23. [Google Scholar] [CrossRef]
  44. Huang, W. Impacts of Climate Change on Typical Ecohydrological Variables in the Upper-Middle Reaches of Heihe River Basin. Master’s Thesis, China University of Geosciences, Qinhuangdao, China, 2018. [Google Scholar]
  45. Chen, Y.; Yang, K.; Tang, W.; Li, X.; Lu, H.; He, J.; Qin, J. China meteorological forcing dataset (1979–2018). Natl. Tibet. Plateau Data Cent. 2015. [Google Scholar] [CrossRef]
  46. Sen, P. Estimates of the Regression Coefficient Based on Kendall’s Tau. J. Am. Stat. Assoc. 1968, 63, 1379–1389. [Google Scholar] [CrossRef]
  47. Güçlü, Y.S. Improved visualization for trend analysis by comparing with classical Mann-Kendall test and ITA. J. Hydrol. 2020, 584, 124674. [Google Scholar] [CrossRef]
  48. Hamed, K.H.; Ramachandra Rao, A. A modified Mann-Kendall trend test for autocorrelated data. J. Hydrol. 1998, 204, 182–196. [Google Scholar] [CrossRef]
  49. Güçlü, Y.S. Multiple Şen-innovative trend analyses and partial Mann-Kendall test. J. Hydrol. 2018, 566, 685–704. [Google Scholar] [CrossRef]
  50. Beven, K. A Sensitivity Analysis of the Penman-Monteith Actual Evapotranspiration Estimates. J. Hydrol. 1979, 44, 169–190. [Google Scholar] [CrossRef]
  51. Zhao, J.; Xu, Z.; Zuo, D.; Wang, X. Temporal variations of reference evapotranspiration and its sensitivity to meteorological factors in Heihe River Basin, China. Water Sci. Eng. 2015, 8, 1–8. [Google Scholar] [CrossRef]
  52. Yang, S.Y.; Meng, D.; Li, X.J.; Wu, X.L. Multi-scale responses of vegetation changes relative to the SPEI meteorological drought index in North China in 2001–2014. Acta Ecol. Sin. 2018, 38, 1028–1039. [Google Scholar]
  53. Yan, R.; Li, L. Exploring the Influence of Seasonal Cropland Abandonment on Evapotranspiration and Water Resources in the Humid Lowland Region, Southern China. Water Resour. Res. 2022, 58, e2021WR031888. [Google Scholar] [CrossRef]
  54. Wang, H.; Xiao, W.; Zhao, Y.; Wang, Y.; Hou, B.; Zhou, Y.; Yang, H.; Zhang, X.; Cui, H. The Spatiotemporal Variability of Evapotranspiration and Its Response to Climate Change and Land Use/Land Cover Change in the Three Gorges Reservoir. Water 2019, 11, 1739. [Google Scholar] [CrossRef]
  55. Cui, H.; Wang, L.; Wang, H.; Xiao, W.; Hou, B.; Gao, B. Temporal and Spatial Changes of Actual Evapotranspiration and Its Relationship with Meteorological Factors in the Three Gorges Reservoir Area. Res. Soil Water Conserv. 2021, 28, 193–202. [Google Scholar] [CrossRef]
  56. Cao, X.; Xing, W.; Fu, Q.; Yang, L. Evolution characteristics and driving mechanism of actual evapotranspiration in the middle and lower reaches of the Yangtze River. J. North China Univ. Water Resour. Electr. Power (Nat. Sci. Ed.) 2023, 1–11. [Google Scholar]
  57. Song, Z.; Liang, S.; Feng, L.; He, T.; Song, X.-P.; Zhang, L. Temperature changes in Three Gorges Reservoir Area and linkage with Three Gorges Project. J. Geophys. Res. Atmos. 2017, 122, 4866–4879. [Google Scholar] [CrossRef]
  58. Gao, L.; Chen, H.; Sun, S. Impacts of Three Gorges Project on Land Surface Temperature Based on MODIS Dataset. Progress. Inquisitionesde Mutat. Clim. 2014, 10, 226–234. [Google Scholar]
  59. Tao, Y.; Wang, Y.; Rhoads, B.; Wang, D.; Ni, L.; Wu, J. Quantifying the impacts of the Three Gorges Reservoir on water temperature in the middle reach of the Yangtze River. J. Hydrol. 2020, 582, 124476. [Google Scholar] [CrossRef]
Figure 1. Location of the Three Gorges Reservoir Area (TGRA).
Water 15 04105 g001
Figure 2. Scatter plot of the simulated and measured AET in the TGRA.
Water 15 04105 g002
Figure 3. Interannual variation in of the AET (a) and monthly trends in AET and Sen’s slope tests for the monthly AET in the TGRA (b): the black columns represent Sen’s slope passed the significance test; the gray columns represent Sen’s slope not passed the significance test.
Water 15 04105 g003
Figure 4. Monthly distribution in AET from 1891 to 2020 in the TGRA.
Water 15 04105 g004
Figure 5. Spatial distribution of the multiyear average of the AET (a) and amplitude of the variation in the AET based on Sen’s slope (b) in the TGRA.
Water 15 04105 g005
Figure 6. Exponential regression relations and adjusted R2 of AET and P, T, and Rs in the TGRA (p ≤ 0.01).
Water 15 04105 g006
Figure 7. Interannual variations (a,c,e) and M-K test (b,d,f) of the variation trends in P, T, and Rs during 1981 to 2020 in the TGRA.
Water 15 04105 g007
Figure 8. Distributions of the SCs for the P, T, and Rs in different periods in the TGRA.
Water 15 04105 g008
Figure 9. Spatial distribution and amplitude of the variation based on Sen’s slope of the EP, EI, and ES in the TGRA.
Water 15 04105 g009
Table 1. Eco-hydrologically relevant PFT parameter values.
PFT (Unit)Tc_minTc_maxGDD5_minTw_minTw_maxLeaflongRootdist
Tropical rainforest12----0.50.7/0.3
Tropical broadleaved evergreen tree12----20.85/0.15
Temperate needleleaved evergreen tree−222900--20.6/0.4
Temperate broadleaved evergreen tree0141500--10.7/0.3
Temperate broadleaved deciduous tree−1701500--0.50.65/0.35
Northern needleleaved evergreen tree0−2555023-0.50.9/0.1
Northern needleleaved deciduous tree-−2350234320.9/0.1
Northern broadleaved deciduous tree-−1535023-0.50.9/0.1
Temperate desert scrub-−535023-10.9/0.1
Tropical herb15--12-10.9/0.1
Temperate herb·-−8---10.9/0.1
Cold herb-−12---10.9/0.1
Note: Tc_min, minimum average temperature in the coldest month (°C); Tc_max, maximum average temperature in the coldest month (°C); GDD5_min, minimum annual accumulated temperature above 5 °C required for vegetation settlement and growth (°C); Tw_min, minimum average temperature in the hottest month (°C); Tw_max, maximum average temperature in the hottest month (°C); leaflong, leaf longevity(a); rootdist, distribution ratio of roots between the upper and lower soil layers.
Table 2. Attributes of the input data.
Data TypeSourceWebsiteResolutionTime Scale
Monthly temperature (T)China meteorological forcing dataset [45]https://data.tpdc.ac.cn/zh-hans/data/8028b944-daaa-4511-8769-965612652c49/ (accessed on 1 January 2023)0.1°/3 hJanuary 1981~December 2018
Monthly precipitation (P)China meteorological forcing dataset [45]https://data.tpdc.ac.cn/zh-hans/data/8028b944-daaa-4511-8769-965612652c49/ (accessed on 1 January 2023)0.1°/3 hJanuary 1981~December 2018
Monthly cloud coverCRU TS Version 4.07https://crudata.uea.ac.uk/cru/data/hrg/cru_ts_4.07/cruts.2304141047.v4.07/ (accessed on 1 January 2023)0.5°January 1981~December 2020
Monthly wet daysCRU TS Version 4.07https://crudata.uea.ac.uk/cru/data/hrg/cru_ts_4.07/cruts.2304141047.v4.07/ (accessed on 1 January 2023)0.5°January 1981~December 2020
Soil textureGeographic data platform of Peking universityhttps://geodata.pku.edu.cn (accessed on 1 January 2023)1:1062009
Annual CO2Earth’s CO2https://www.co2.earth (accessed on 1 January 2023)Northern Hemisphere/Annually1981~2020
Table 3. Precision evaluation of seasonal and annual AET simulation results in the TGRA.
Evaluation IndexSpringSummerAutumnWinterAnnual Average
R20.83 0.76 0.86 0.75 0.89
NSE0.72 0.63 0.74 0.67 0.76
MRE6.39% 17.68% 7.49% 9.59% 4.32%
Table 4. Linear and exponential correlation coefficients between AET and P, T, and Rs.
Fitting RelationPTRs
Linear correlation0.740.960.91
Exponential correlation0.780.970.94
Table 5. Sen’s slope test for amplitude of the variation in P, T, and Rs in the TGRA (/10a).
P (mm)T (°C)Rs (MJ/m2)
Sen’s slope11.86 * 0.31 ** −2.75
Note: * The values are significant at p ≤ 0.05; ** the values are significant at p ≤ 0.01 (the same below).
Table 6. Sen’s slope tests for the amplitudes of the SCs for P, T, and Rs in the TGRA (/10a).
Time IntervalPTRs
1981–20020.07 0.09 * −0.03 *
2003–20200.15 −0.03 −0.08 *
1981–20200.01 0.03 * −0.10 **
Table 7. Contribution of P, T, and Rs to AET changes in different statistical periods (%).
Time IntervalPTRs
1981–20025.54 0.24 0.03
2003–20204.46 0.17 −0.04
1981–20204.59 0.19 −0.06
Table 8. Contribution of climate change and human activities to AET changes in different statistical periods (%).
Time IntervalAETClimate ChangeHuman Activity
Total Change Rate/%Contribution/%Rate/%Contribution/% Rate/%
1981–20025.605.81103.75 −0.21 −3.75
2003–20206.284.5973.09 1.69 26.91
1981–20205.284.7289.39 0.56 10.61
Table 9. The comparison of the LPJ simulated values of AET with previous studies.
Research Study Area and PeriodMethodsTheir Values (mm)This Study’s Values (mm)Relative Error (%)
Wang et al. [54]TGRA/1993–2013CLM4.5606.00 655.11 7.50
Cui et al. [55]TGRA/1990–2015CLM4.5590.75 650.41 9.17
Cao et al. [55]middle and lower reaches of Yangtze River/1992–2015water balance and remote sensed data728.70 651.70 10.57
Disclaimer/Publisher’s Note: The statements, opinions and data contained in all publications are solely those of the individual author(s) and contributor(s) and not of MDPI and/or the editor(s). MDPI and/or the editor(s) disclaim responsibility for any injury to people or property resulting from any ideas, methods, instructions or products referred to in the content.