Article

Effect of Confining Pressure on CO2-Brine Relative Permeability Characteristics of Sandstone in Ordos Basin

1
Research Institute of Petroleum Exploration & Development, PetroChina, Beijing 100083, China
2
National Energy Underground Gas Storage R&D Center, Beijing 100083, China
3
Shaanxi Coal and Chemical Industry Group Co., Ltd., Xi’an 710100, China
4
School of Civil and Resource Engineering, University of Science and Technology Beijing, Beijing 100083, China
*
Author to whom correspondence should be addressed.
Water 2023, 15(24), 4235; https://doi.org/10.3390/w15244235
Submission received: 31 October 2023 / Revised: 29 November 2023 / Accepted: 5 December 2023 / Published: 9 December 2023

Abstract

:
CO2-brine relative permeability significantly impacts CO2 injection and is a key parameter for carbon dioxide storage simulation in saline aquifers. In the study of relative permeability, factors such as temperature, pressure, and reservoir rock physical properties play a crucial role. To better understand the impact of confining pressure on the CO2-brine relative permeability characteristics of sandstone in the Ordos Basin, five sets of CO2-brine relative permeability data were obtained through unsteady-state displacement tests conducted at various confining pressures ranging from 12 to 20 MPa. The research findings indicate that with an increase in confining pressure there is a slight decrease in irreducible brine saturation. Furthermore, the CO2 relative permeability in the irreducible brine state decreased by 57% as the pressure increased from 12 MPa to 20 MPa. The study demonstrates notable differences in the CO2-brine relative permeability curves under varying confining pressure conditions. As the confining pressure increases, the CO2 relative permeability curve decreases, while the brine relative permeability increases. The change in brine relative permeability is not as pronounced as that of CO2. These experimental results offer essential support for subsequent numerical calculations and practical applications in engineering. Experimental research holds significant importance in the assessment of storage potential and the prediction of the evolutionary patterns of CO2 migration.

1. Introduction

Climate change has been identified as one of the most significant global environmental issues due to the continuous increase in carbon dioxide (CO2) and other greenhouse gas emissions in recent years. Consequently, reducing atmospheric CO2 content has become a critical area of research within the international scientific community [1]. Carbon Capture and Storage (CCS) technology has emerged as a highly effective method for reducing significant CO2 emissions into the atmosphere [2]. One of the potential sites for large-scale CO2 storage is deep saline aquifers. This is because the rocks in saline aquifers are often permeable sandstones, and the depth of the reservoir allows CO2 to be maintained in a dense supercritical state. In these deep saline aquifers, supercritical CO2 can be permanently stored through structural, solubility, mineral, and residual trapping mechanisms [3].
The flow and distribution of CO2 in saline aquifers are highly complex processes influenced by reservoir characteristics, interactions between CO2 and brine, as well as flow and transport properties [4]. Relative permeability (RP) is an important basic parameter for predicting CO2 reserves in deep saline aquifers; it significantly affects the CO2 injection capacity and transportation capacity [5]. Currently, the primary method of obtaining RP is laboratory testing, usually using steady-state and unsteady-state methods [6].
Several studies have reported data on the CO2-brine RP in common sedimentary formations, including Berea sandstone, carbonate rocks, and other rock types [7,8,9,10,11,12,13,14,15,16,17,18,19,20,21]. Most of these studies discussed the impacts of temperature, injection pressure, and porosity on RP. Apart from the aforementioned influencing factors, confining pressure (CP) is also an important parameter. Given that the stress state can influence the rock physical properties of the reservoir [22], studying the impact of alterations in CP on RP is essential. In previous studies, research efforts have explored the influence of CP on absolute permeability, and these studies typically arrive at consistent conclusions [23,24,25,26]. However, there is limited research focusing on RP, and the existing studies have presented conflicting conclusions regarding the impact of CP on RP.
Fatt [27] was the first to investigate the correlation between RP and CP in sandstone. There are no effects on non-wetting RP at all considering CP. Zhang et al. [28] employed the unsteady-state method and identified significant variations in gas–water two-phase RP curves under various CP conditions. With an increase in CP, the water RP experiences a significant decrease. Additionally, when the water saturation is below 80%, the gas RP exhibits a discernible increasing trend. Liu et al. [29], through experiments, demonstrated that with an increase in CP the gas RP increases while the water RP decreases. Lai and Miskimins [30] observed the influence of CP on the gas–water RP curve through experiments. With an increase in CP, the gas RP decreases significantly, whereas the water RP shows minimal change. Thomas and Ward [31] believed that the RP of both the gas and water phases would remain unaffected by changes in CP. It is evident that researchers hold varying opinions on the impact of CP on RP, and there are very limited studies on the effect of CP on CO2-brine RP. There are numerous factors influencing the RP of two-phase fluids, encompassing temperature, pressure, rock type, wettability, and interfacial tension [32,33,34]. Changes in CP can modify pore properties, wettability, and interfacial tension within rocks, thereby inducing notable correlations in the two-phase fluid flow characteristics and varying CPs [35,36]. Adenutsi et al. [37] and others conducted comparisons of NMR T2 spectra before and after applying CP, revealing a decrease in pore volume with increasing CP. This corresponding reduction in the local pore throat radius heightens the capillary resistance of the oil phase through the pores, resulting in a diminished RP of the oil phase as CP rises. Lei et al. [38] and Zhang et al. [28] applied fractal theory to investigate the pressure correlation with the RP. The pressure correlation was expounded by analyzing the relationship between fractal dimensions, pore radius ratios, wettability, and RP. Existing studies generally concentrate on a singular factor, and observing changes in pore properties, wettability, and interfacial tension in rocks is challenging. This results in a lack of clarity regarding the potential causes of changes in RP due to variations in CP. Therefore, in the absence of CO2-brine RP CP correlation data, it is imperative to conduct CO2-brine RP tests on cores under various CPs. This is crucial for enhancing our understanding of CO2 storage in saline aquifers, particularly in the geographical locations where the cores are obtained.
This article explores the influence of CP on the CO2-brine RP characteristics of sandstone in the Ordos Basin. Unsteady-state drainage experiments were performed in five sets under varying CP conditions (12, 14, 16, 18, 20 MPa). The ‘J.B.N’ method was employed to calculate CO2-brine RP. The study analyzed the impacts of CP on irreducible brine saturation, CO2 RP in the irreducible brine state, and CO2-brine RP curves. The results of the experiments provide necessary data support for numerical calculations of CO2 storage in saline aquifers.

2. Materials and Methods

2.1. Experimental Sample and Conditions

The experiment was conducted using a natural sandstone core extracted from the Yi-Shan slope in the eastern Ordos Basin. Five cores are shown in Figure 1. These were all drilled from the same original full-diameter core. Each core is approximately 2.5 cm in diameter and 6.0 cm in length. The five cores were tested for their porosity and single-phase gas permeability. Detailed information on the size, porosity, and permeability of each core sample is given in Table 1.
An incubator was used in the experiment to maintain a constant temperature of 70 °C, representing the formation temperature. The core holder’s inlet pressure was kept at 10 MPa by a constant speed and constant pressure pump. Meanwhile, the back pressure pump maintained the outlet pressure at 8 MPa. The pressure difference between the core’s inlet and outlet was always maintained at 2 MPa. Therefore, the physical properties of brine and CO2 were determined based on the temperature and average core pressure (9 MPa). The salinity of brine is 23.5 g/L, density is 0.984 g·cm−3, and viscosity is 0.415 mpa·s at 70 °C [39,40]. For temperatures (T) and pressures (P) exceeding the critical point (Tc = 31.1 °C and Pc = 7.38 MPa), CO2 exists in the supercritical phase, exhibiting gas-like behavior while possessing the density of a liquid. Therefore, CO2 is in a supercritical state at a temperature of 70 °C and a pressure of 9 MPa, with a density of 0.208 g·cm−3 and a viscosity of 0.021 mpa·s. Five sets of CP conditions were established, namely 12 MPa, 14 MPa, 16 MPa, 18 MPa, and 20 MPa.

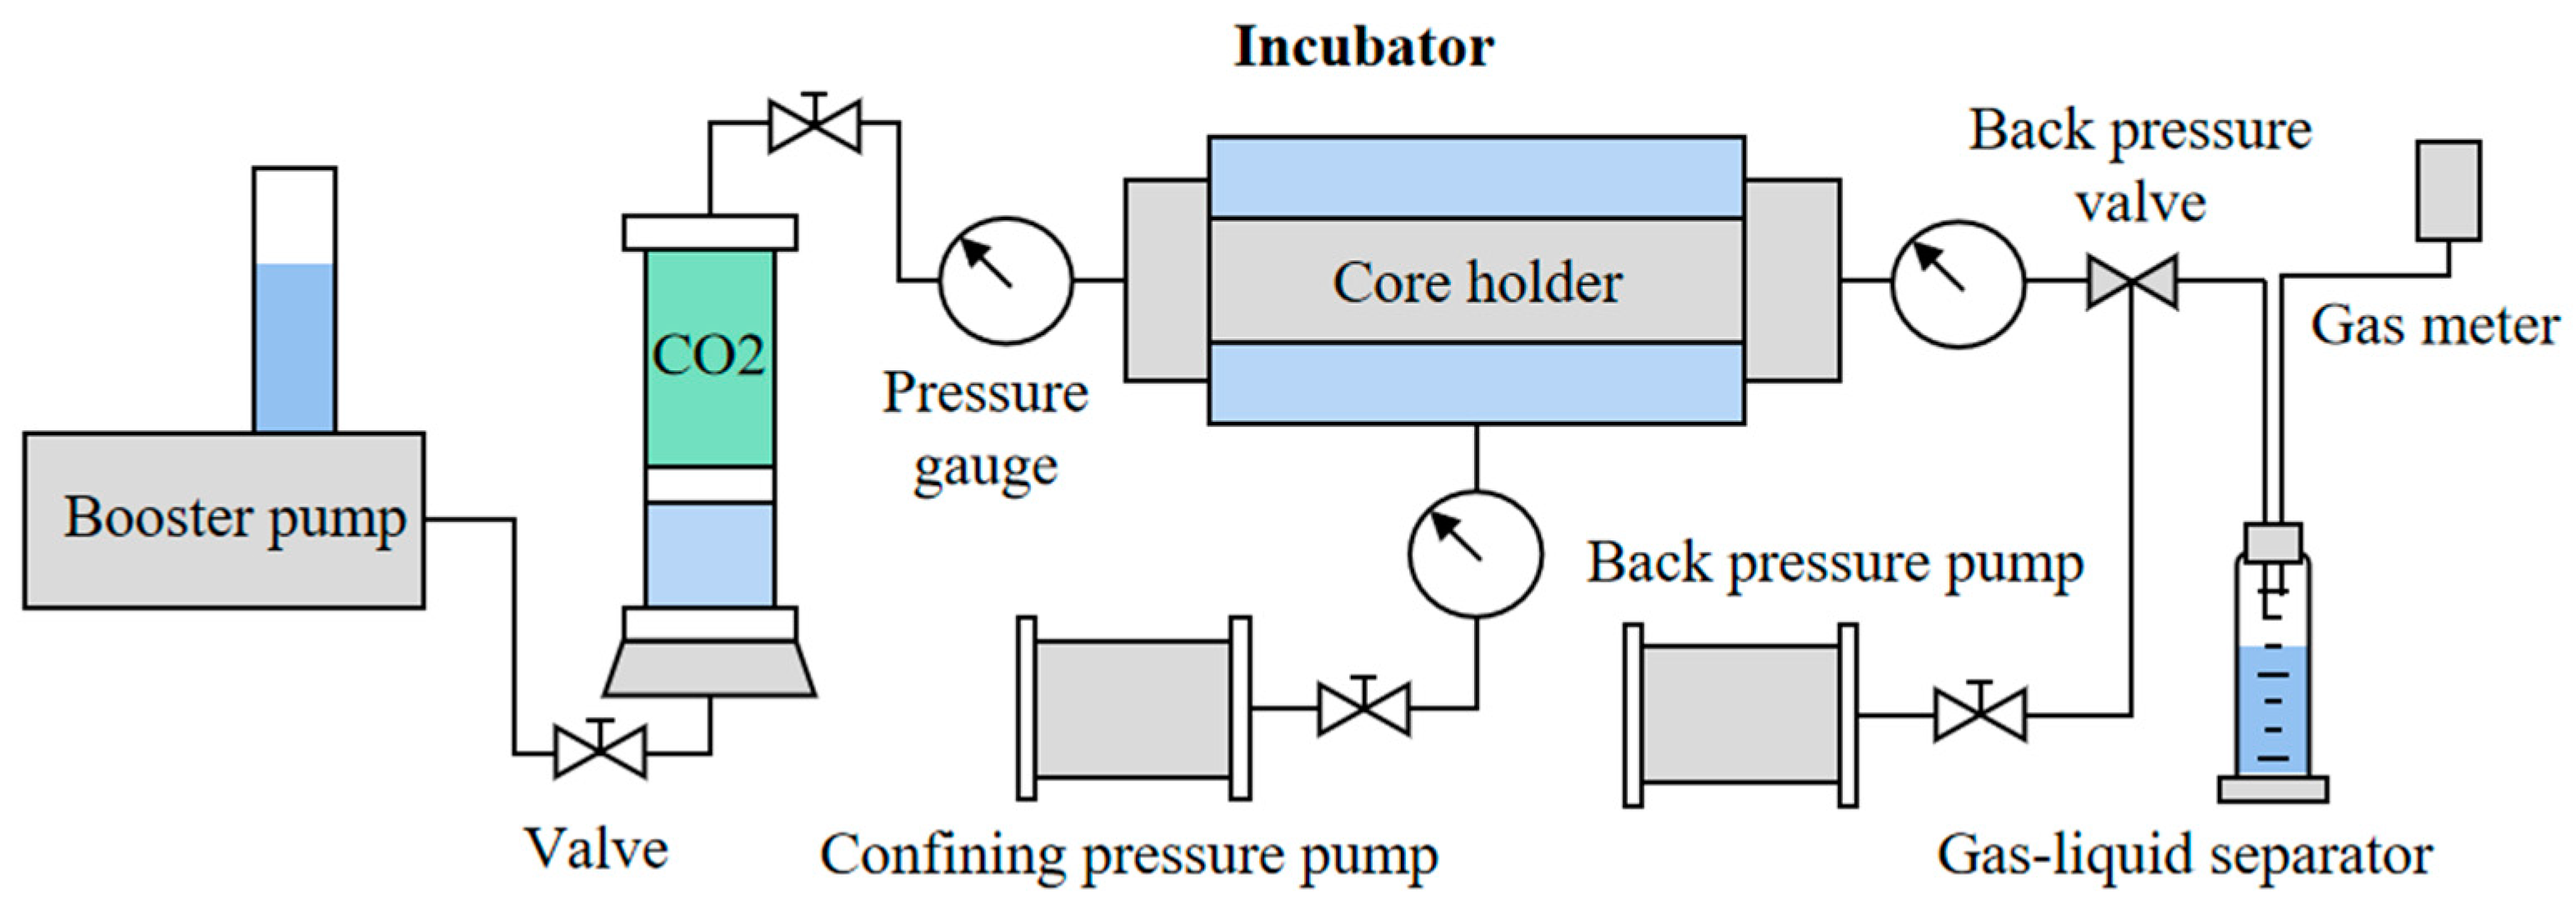
2.2. Experimental Equipment and Process

2.2.1. Experimental Setup

Figure 2 illustrates the experimental setup for unsteady CO2-brine RP testing. The system comprises a CO2 storage tank, constant speed and constant pressure pump, pressure gauge, incubator, core holder, CP pump, back pressure valve, back pressure pump, gas–liquid separator, and gas–water metering device. The main equipment for the experiment is divided into a core holder, various pressurization devices, and experimental measurement instruments. The core holder fixes the core through the clamping heads at both ends and the rubber sleeve in the middle. The inlet is connected to a CO2 storage tank and a constant speed and constant pressure pump to provide CO2 injection pressure, set at 10 MPa for this experiment. The outlet is connected to a back pressure valve and a back pressure pump to maintain the outlet pressure. In the middle of the core holder, there is a connection for a CP pump, which supplies CP by injecting water into the rubber sleeve’s outer periphery, simulating the reservoir pressure of the saline aquifer. It can provide five sets of CP conditions from 12 MPa to 20 MPa. After the back pressure valve, the experimental measurement instruments are connected, including a gas–liquid separator, a graduated cylinder, and a gas flow meter, used to measure fluid flow rate.

2.2.2. Experimental Process

In this study, the CO2-brine RP was measured using the unsteady-state method. Compared with the steady-state method, which is more accurate but also more time-consuming and expensive, the unsteady-state method allows for a significantly shorter experimental time frame. To generate RP curves, different ratios of fluid injection were used to obtain multiple data points [41]. The steady-state method involves the simultaneous injection of CO2 and brine into the core, which does not reflect the actual injection scenario for CO2 saline aquifer storage [42]. In contrast, the unsteady-state method displaces one fluid with another, allowing for continuous changes in fluid saturation. This approach better simulates the actual flow conditions of reservoir storage in saline aquifers.
Two types of RP affect CO2 migration, namely drainage and imbibition RP [43]. This article focuses on the RP of drainage, which corresponds to the injection stage of the geological storage project. The design method of this experiment only obtains the RP of CO2-displaced brine at irreducible water saturation, that is, the drainage RP.
(a)
Dry the core at 60 °C for 24 h and weigh it. Pump to vacuum, then saturate the core with brine. Weigh the rock samples saturated with brine to calculate the effective pore volume of the core.
(b)
Before experimenting, CO2 needs to be pressurized. Open the outlet valve of the CO2 cylinder to allow CO2 to enter the piston container. Close the inlet valve of the container and utilize a booster pump to pressurize the CO2 to the required pressure for the displacement experiment.
(c)
Load the rock sample saturated with brine into the core holder. Utilize the CP and back pressure device to apply the necessary back pressure and CP to both ends and to the middle section of the core holder. After completing the pressurization, activate the heating device and maintain the instrument at the experiment’s required temperature conditions for 2 h before commencing the experiment.
(d)
Activate the booster pump and apply a specific injection pressure to enable the formation brine to pass through the rock sample. Once the pressure difference and flow rate at both ends of the inlet and outlet of the rock sample stabilize, record the flow value.
(e)
Utilize the CO2 displacement brine method and record the time, cumulative brine production, CO2 production, and pressure conditions at both ends of the rock sample until no brine is produced (visual observation). Reach the irreducible brine state, establish the irreducible brine saturation of the core sample, and measure the effective permeability of the CO2 in this irreducible brine state.

2.3. Experimental Data Processing Methods

The experiment uses the unsteady-state method to conduct a constant pressure drop CO2 displacement brine test on the core. Record the flow rate of each fluid at the core outlet. The CO2-brine RP is calculated using the ‘J.B.N’ method [44,45]. The method is as follows.
Due to compressibility, the average volume flow rate needs to be used to correct the total fluid production according to Equation (1):
V t = V w + V t 1 + 2 P a P + 2 P a V g
where V t denotes the cumulative flow rate of each fluid at time t , mL; V t 1 is the cumulative flow rate of each fluid at time t − 1, mL; V w is the increased flow rate of brine from t − 1 to time t , mL; P a is the value of atmospheric pressure; P is the value of the displacement pressure difference; and V g represents the measured increase in CO2 flow rate over a specific time interval under atmospheric pressure, expressed in mL.
After correcting the cumulative CO2 and brine flow rate according to Equation (1), use Equations (2)–(6) to calculate the unsteady gas-water RP:
f w S g = d V w ¯ ( t ) d V ¯ ( t )
K r w = f w S g d 1 / V ¯ t d 1 / I · V ¯ t
K r g = K r w μ g μ w 1 f w ( S g ) f w ( S g )
I = ( Q t / Q 0 ) ( P 0 / P t )
S g = V w ¯ t V ¯ t f w S g
where f w ( S g ) denotes the moisture content; V w ¯ ( t ) represents the dimensionless cumulative brine flow rate, expressed as pore volume fraction; V ¯ ( t ) is the dimensionless cumulative CO2 and brine flow rate; K r w and K r g are the RP of CO2 and brine, respectively; I is the relative injection capability; Q 0 and Q ( t ) are the brine flow rate at the core outlet at the initial time and time t, respectively, cm3/s; P 0 and P t are the driving pressure drop at the initial time and time t, respectively, MPa. In constant pressure drop displacement experiments, P 0 and P t are equal. S g is the CO2 saturation at the core outlet.

3. Results and Discussion

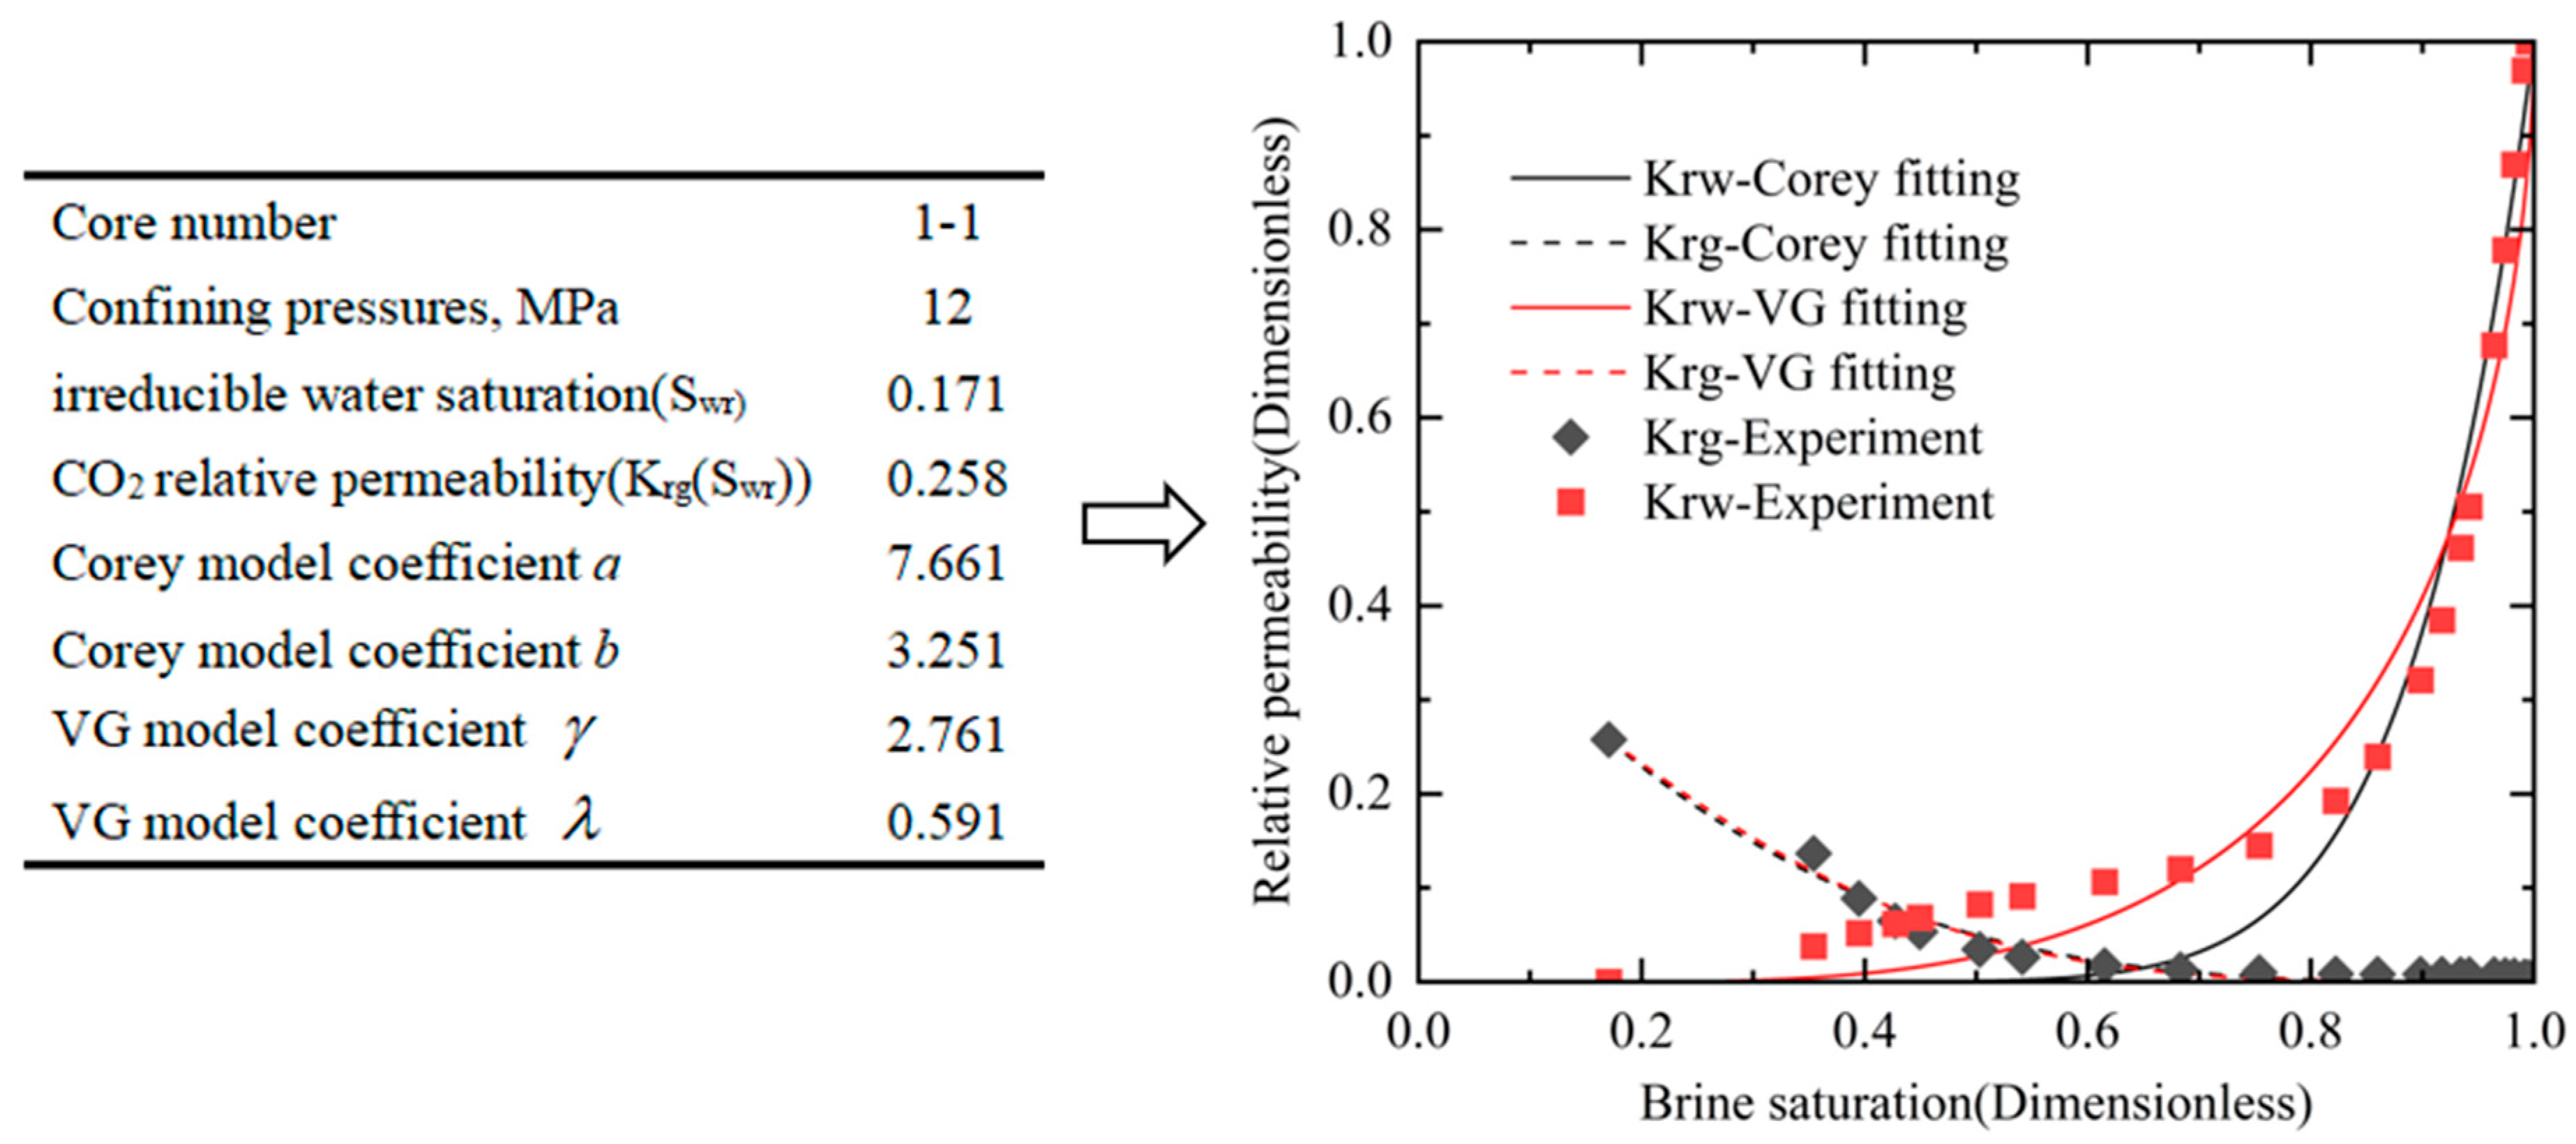
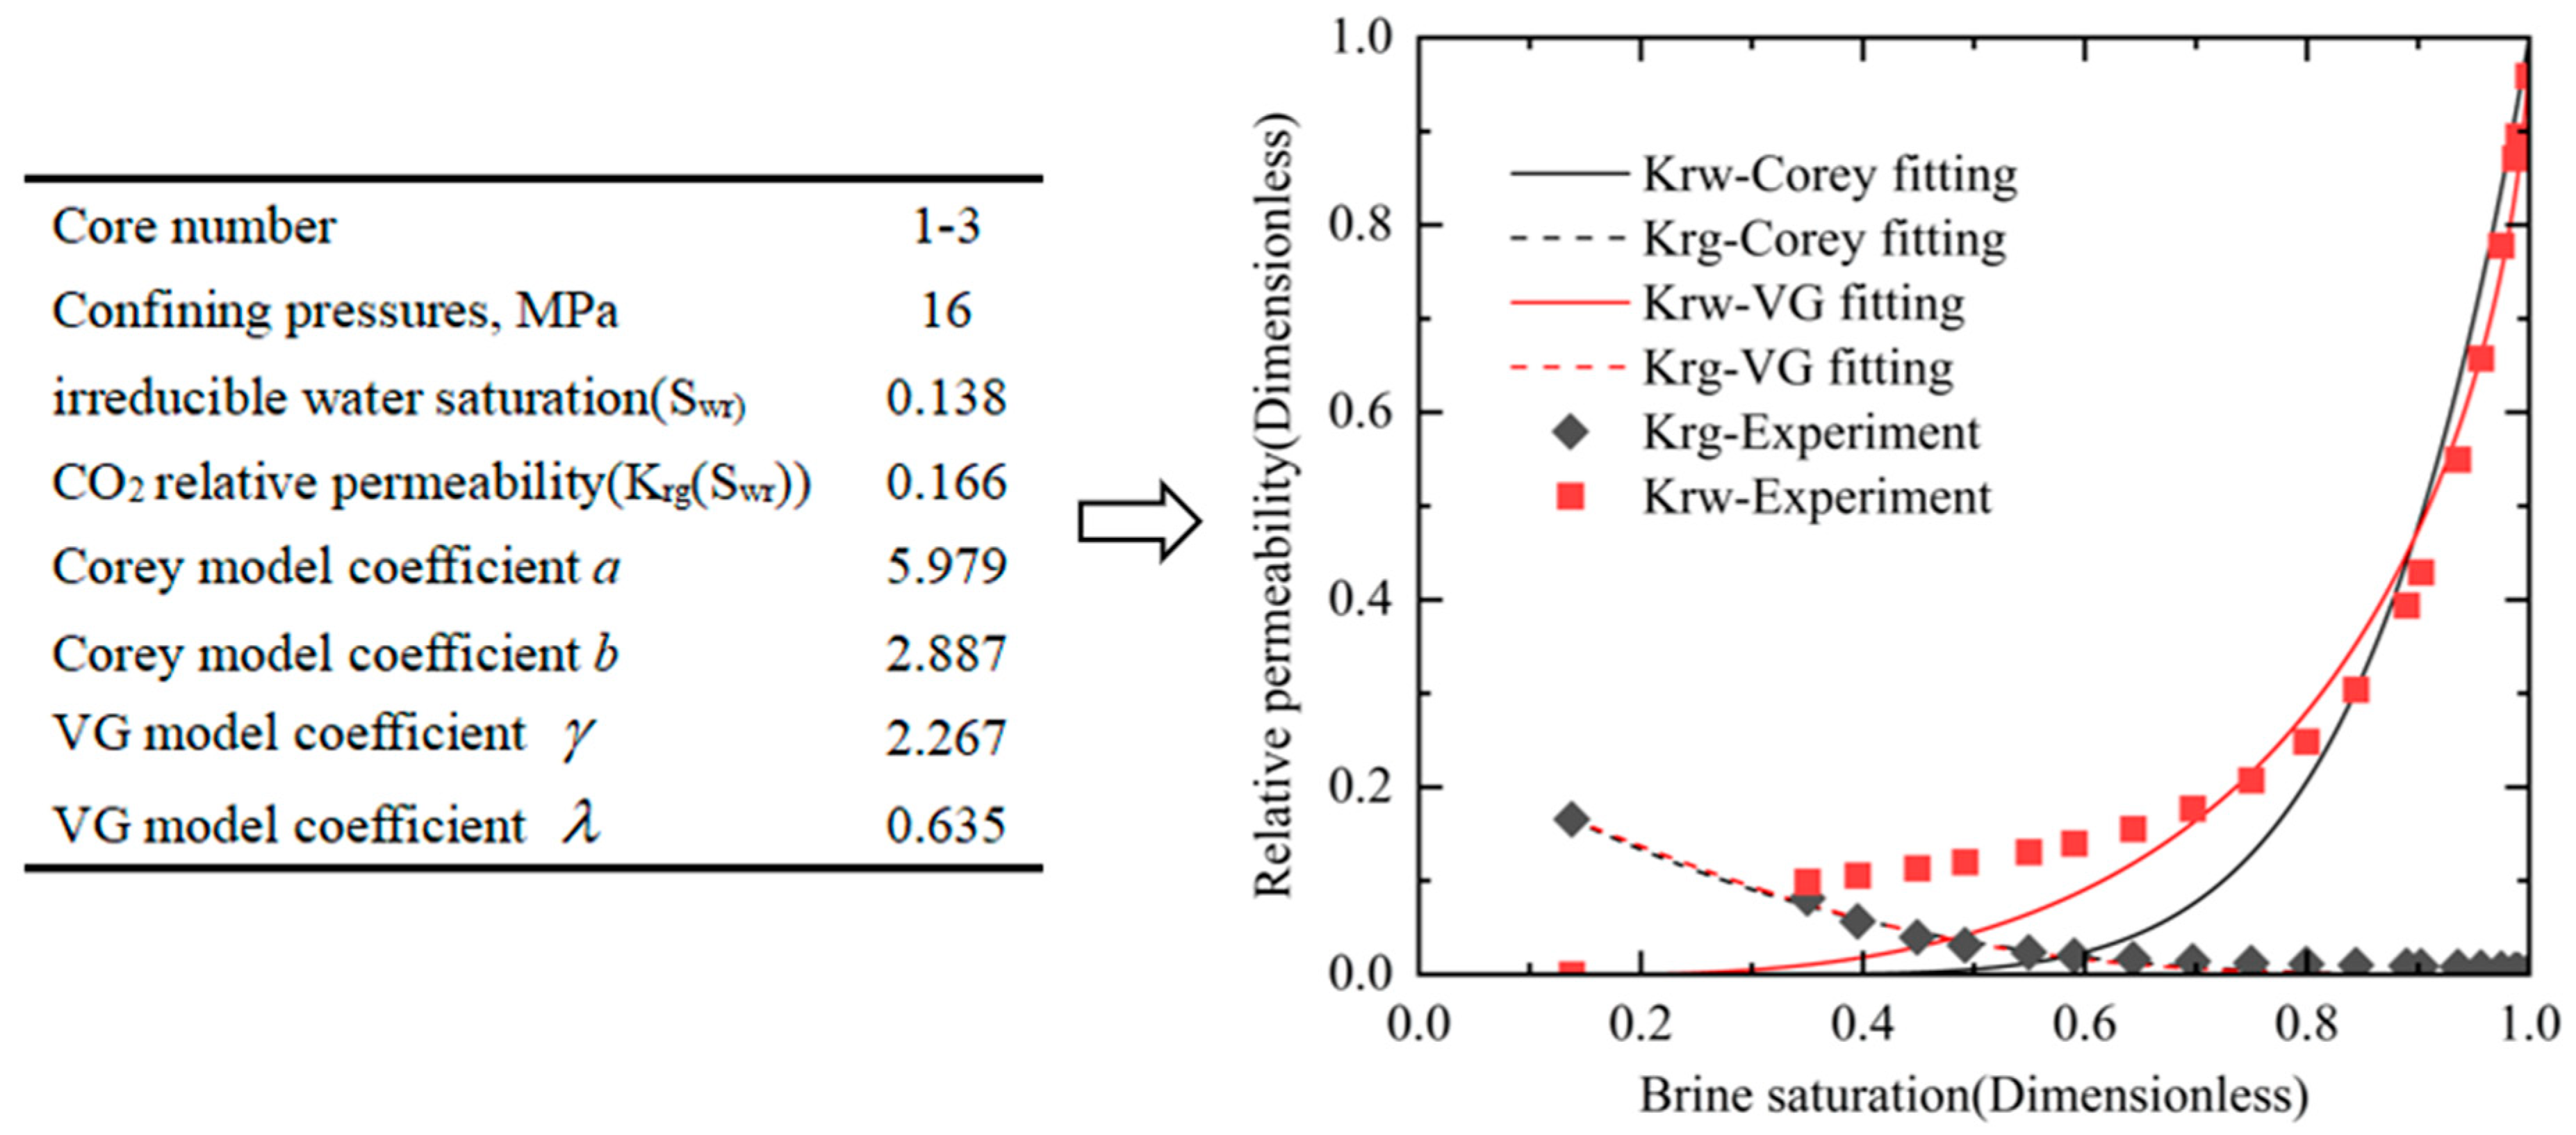
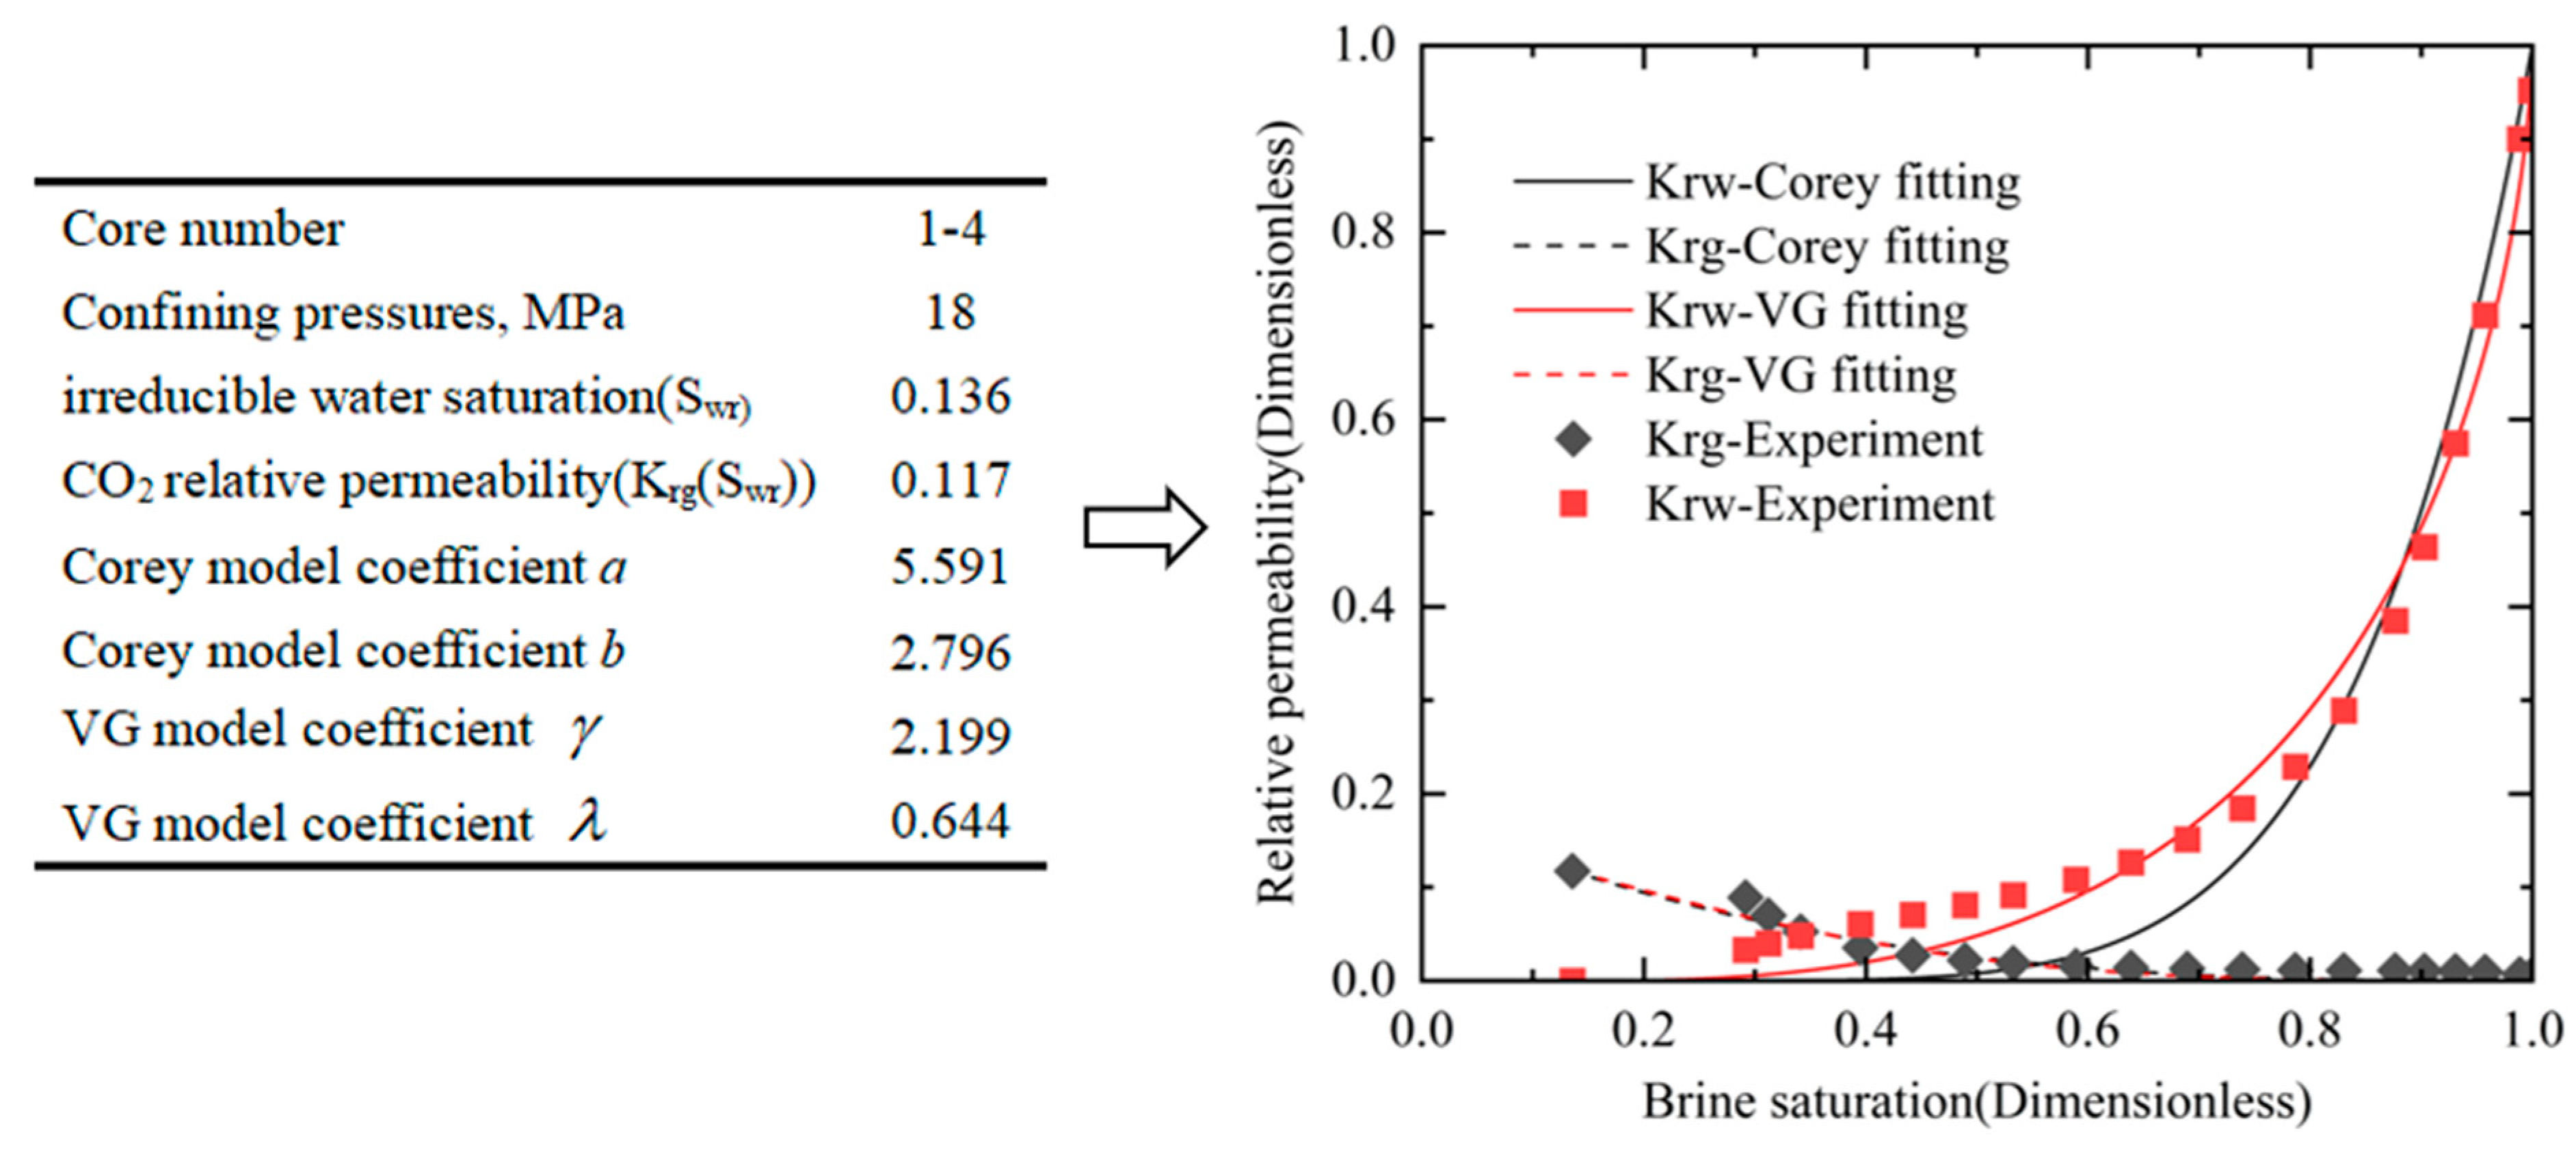
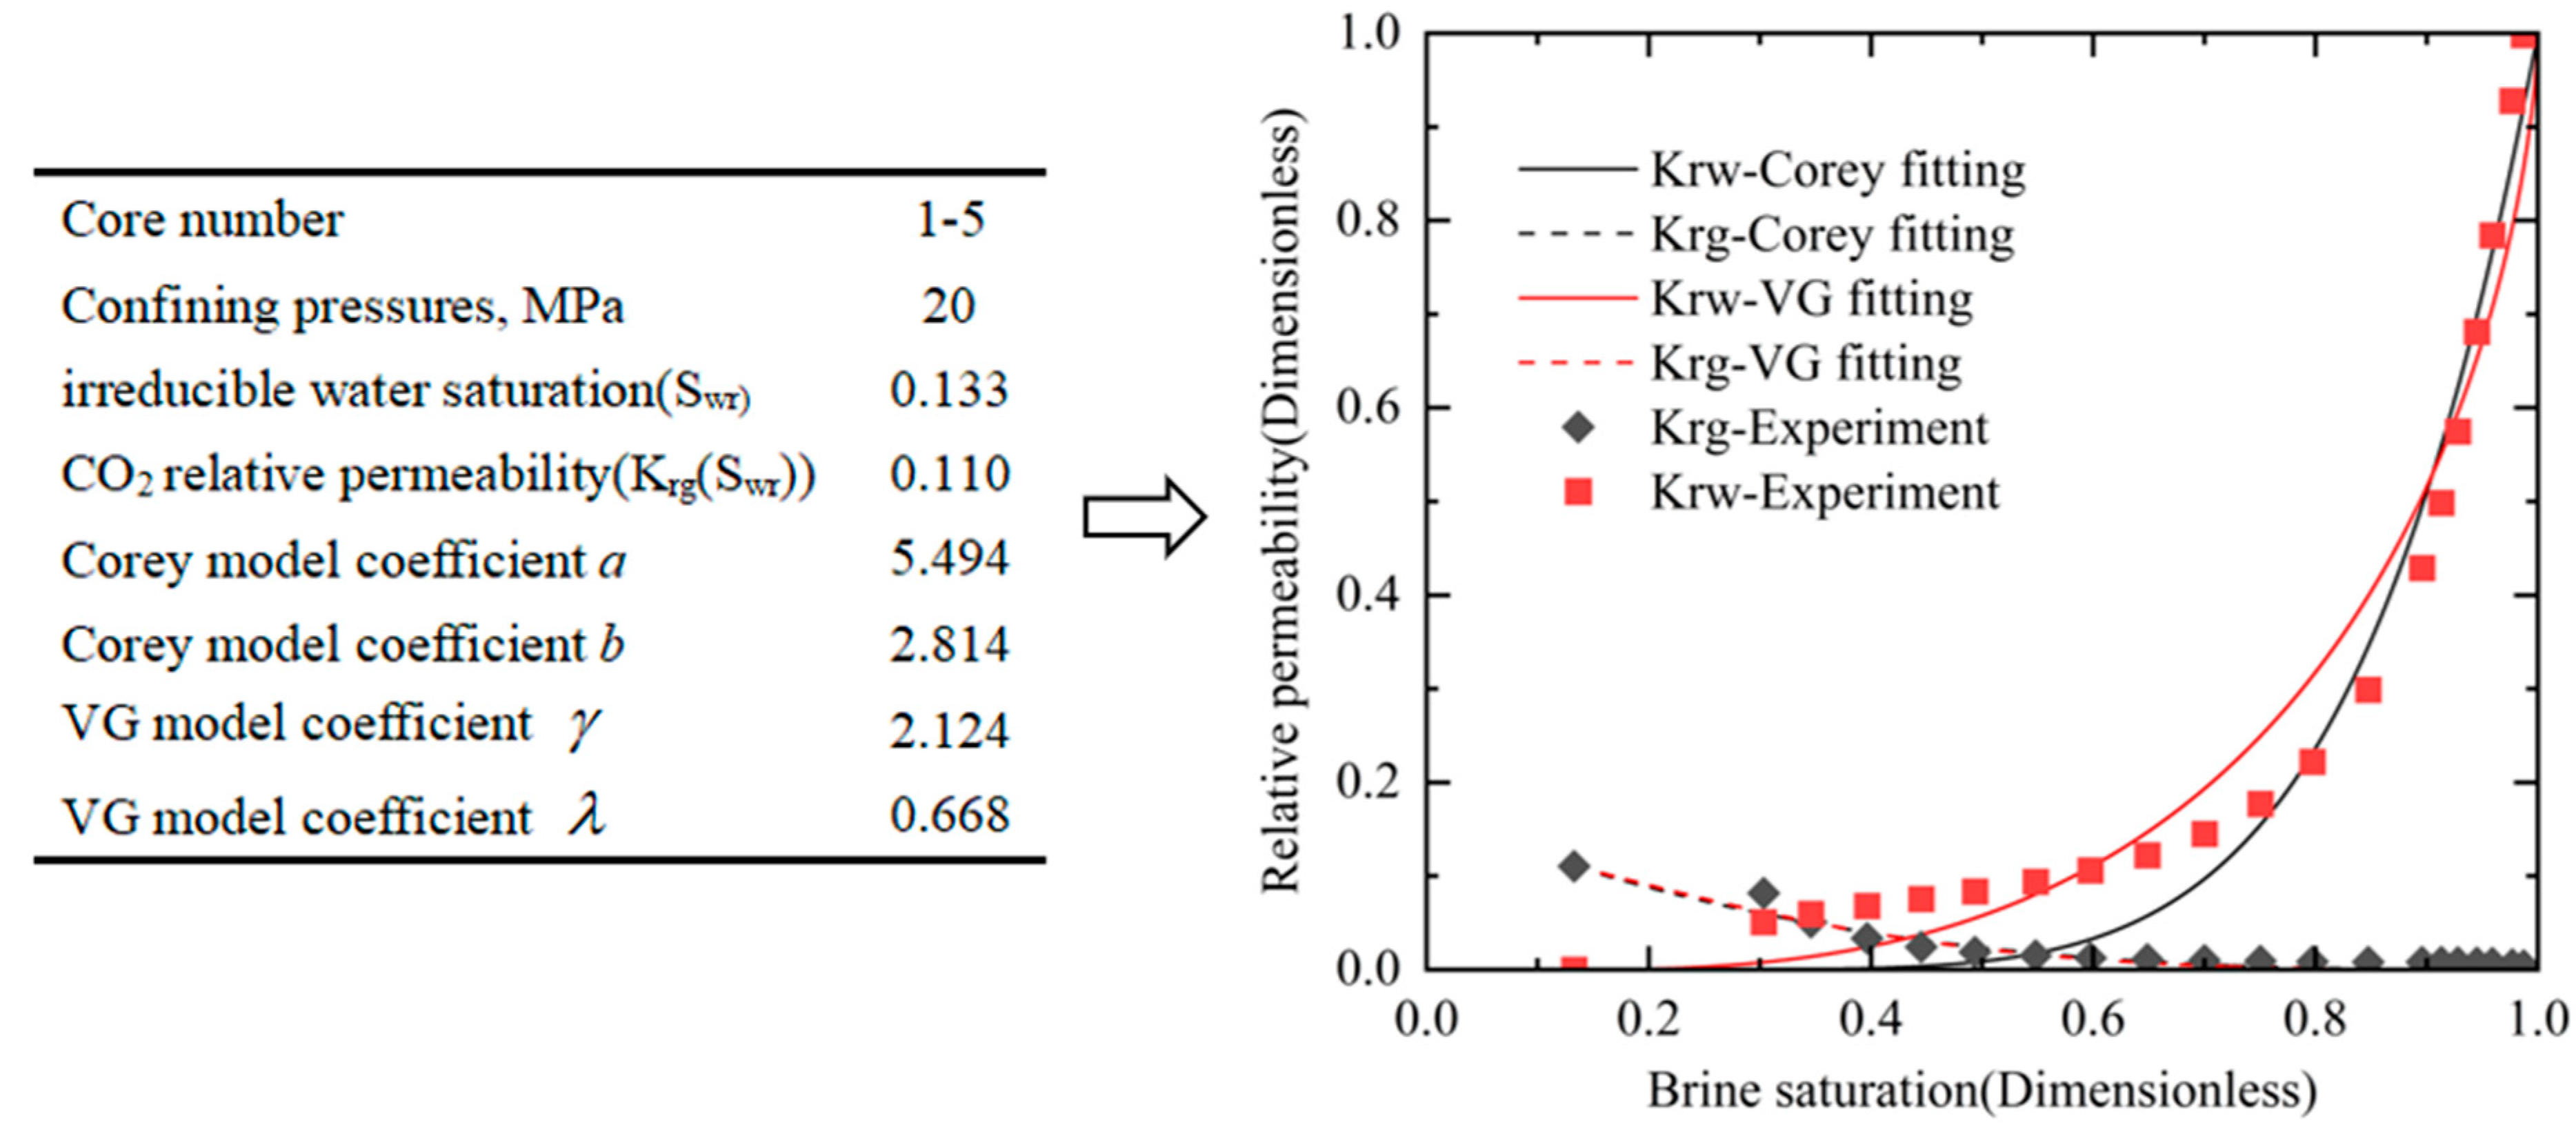
3.1. Relative Permeability Results for Five Sets of Confining Pressure Conditions

Five sets of CO2-brine RP were obtained through unsteady-state displacement tests conducted at various CPs ranging from 12 to 20 MPa. The experimental data of CO2-brine RP at various CPs were calculated using the ‘J.B.N’ method.
The experimental data were fitted using the Corey model and the Van Genuchten modified model. The basic expression of the Corey model is as follows [46,47]:
K r w = K r w S g r S w S w r 1 S w r S g r a ,
K r g = K r g S w r 1 S w S g r 1 S w r S g r b
where S g r is the irreducible CO2 saturation and K r w ( S g r ) is the RP of brine in the irreducible CO2 state; similarly, S w r is the irreducible brine saturation, and K r g ( S w r ) is the CO2 RP in the irreducible brine state. Since the experiment is a drainage process, S g r = 0 and K r w S g r = 1 are taken.
The expression of the Van Genuchten modified model is as follows [48]:
S = ( S w S w r ) / ( 1 S w r ) ,
K r w = S 1 ( 1 S 1 / λ ) λ 2
K r g = K r g ( S w r ) 1 S γ ( 1 S 1 / λ ) 2 λ ,
Core 1-1 was used for a displacement experiment under a CP of 12 MPa. After processing the experimental data, the irreducible brine saturation was 0.171, and the CO2 RP under irreducible brine saturation was 0.258. Figure 3 shows the experimental results of CO2-brine RP, which were fitted using the Corey model—with parameters a = 7.661, b = 3.251—and plotted as the black curve. The Van Genuchten modified model was also used for fitting with parameters of γ   = 2.761 and λ   = 0.591. The resulting curve is shown in red in Figure 3.
Core 1-2 was used for a displacement experiment under a CP of 14 MPa. The irreducible brine saturation was 0.143, with the CO2 RP under irreducible brine saturation measured at 0.230. Corey model parameters were found to be a = 5.959 and b = 3.280. Additionally, the Van Genuchten parameters were determined as γ   = 2.704 and λ   = 0.632. Experimental and model-fitting results are depicted in Figure 4.
Core 1-3 was used for a displacement experiment under a CP of 16 MPa. Irreducible brine saturation was 0.138 and CO2 RP under irreducible brine saturation was 0.166. Corey model parameters were a = 5.979 and b = 2.887. Van Genuchten parameters were γ   = 2.267 and λ   = 0.635. The results from experiments and model-fitting for RP are shown in Figure 5.
Core 1-4 was used for a displacement experiment under a CP of 18 MPa. Irreducible brine saturation was 0.136 and CO2 RP under irreducible brine saturation was 0.117. Corey model parameters were a = 5.591 and b = 2.796. Van Genuchten parameters were γ   = 2.199 and λ = 0.644. The results from experiments and model-fitting for RP are shown in Figure 6.
Core 1-5 was used for a displacement experiment under a CP of 20 MPa. Irreducible brine saturation was 0.133 and CO2 RP under irreducible brine saturation was 0.110. Corey model parameters were a = 5.494 and b = 2.814. Van Genuchten parameters were γ   = 2.124 and λ   = 0.668. Experimental and model-fitting results are shown in Figure 7.
Based on the images of the results, differences were found in the accuracy of the models used to determine the RP of CO2 and brine. Both fitting models agree with the experimental results of CO2 RP. The Van Genuchten modified model was found to be more consistent with experimental results when calculating brine RP. As the CP increased, the coefficient λ in the model also increased, while γ decreased gradually.
The resulting curve in the study clearly shows the process of core drainage, where CO2 gradually replaces brine in the saturated core, resulting in a decrease in brine saturation. With the decrease in brine saturation, CO2 RP increases while brine RP decreases gradually. On the left side of the isotonic point, as brine saturation decreases, CO2 RP increases rapidly. Conversely, on the right side of the isotonic point, as brine saturation increases, brine RP increases rapidly. When brine saturation decreases to the irreducible state, CO2 RP reaches the maximum while brine RP decreases to 0.

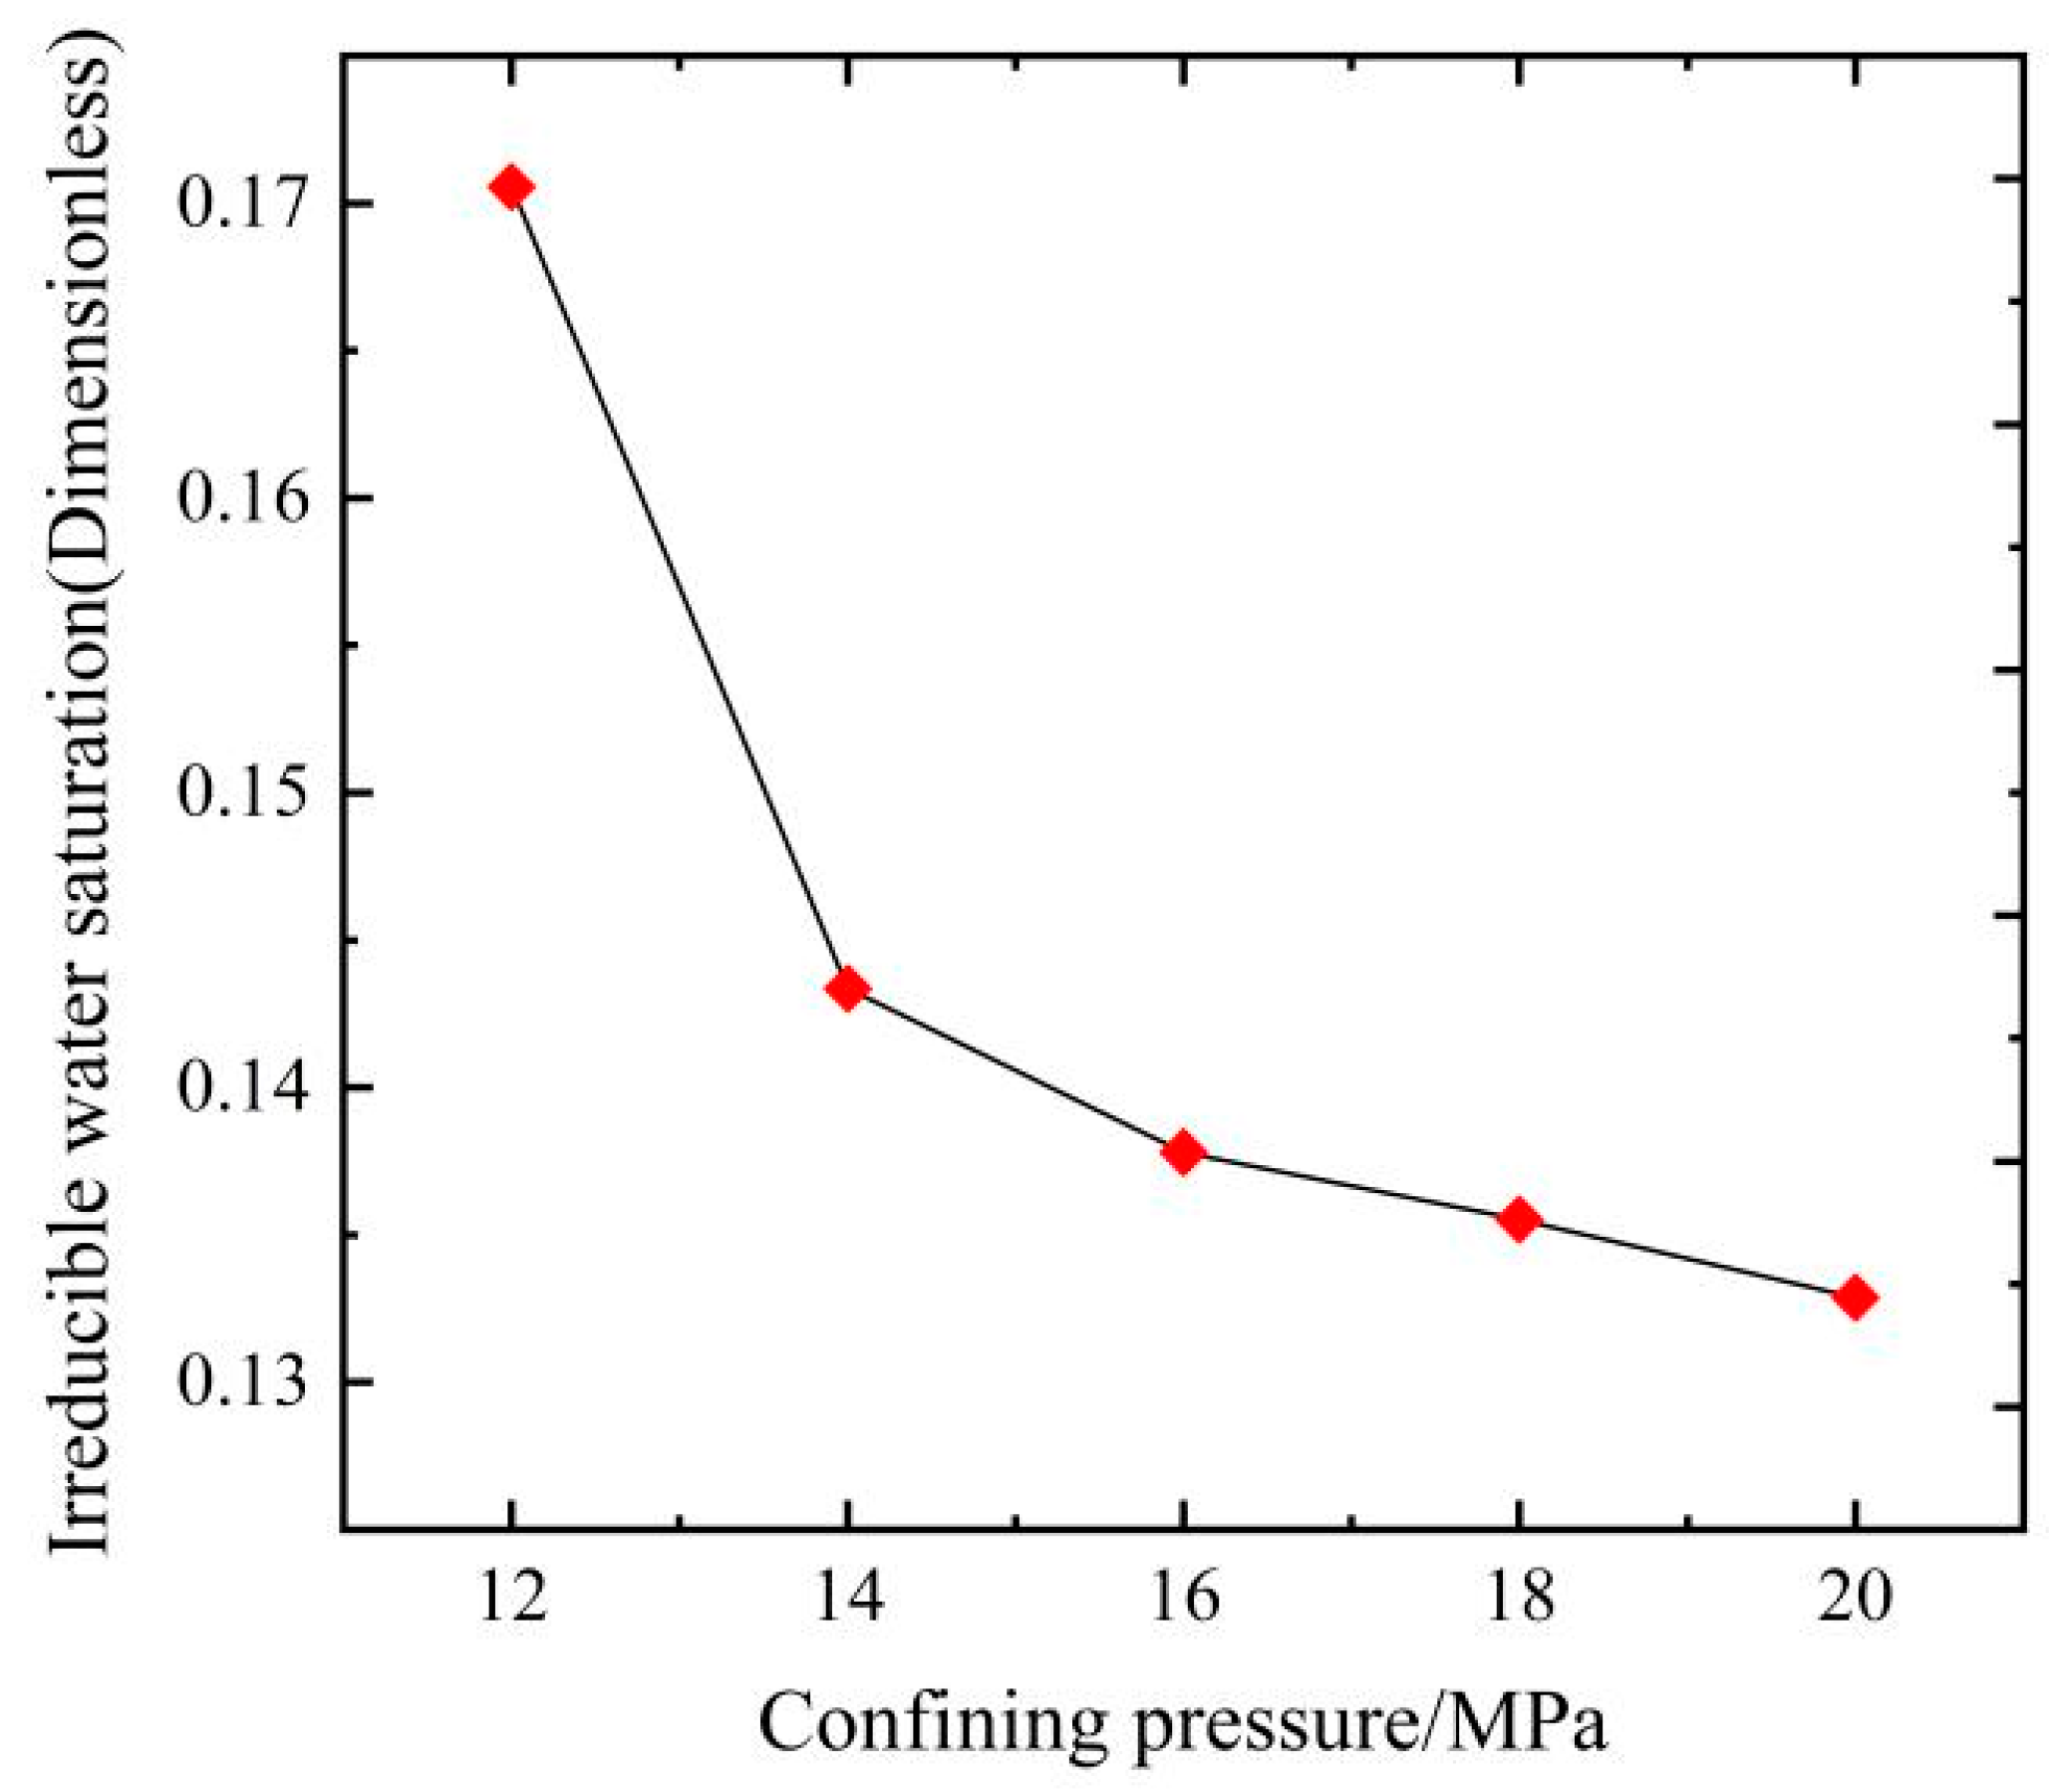
3.2. Effects of Confining Pressures on Irreducible Water Saturation

Irreducible brine refers to the immobile water adsorbed on rock surfaces and trapped in rock pores and throats [49]. Irreducible brine saturation (Swr) is a crucial parameter in reservoir evaluation, directly influencing permeability prediction models and reserve estimations [50]. In the displacement experiment, irreducible brine saturation is reached when the core stops producing brine. The core is weighed, and irreducible brine saturation is calculated.
This study investigates the impact of various CP conditions on irreducible brine saturation. Figure 8 depicts the irreducible brine saturation under varying CP conditions. It can be observed that with the increase in CP, there is a slight decrease in irreducible brine saturation. The elevated CP can alter the rock pore structure [51,52]. Higher pressure may compress larger pores, forming smaller capillary pores, thereby reducing the retention of irreducible brine [53]. This alteration in pore structure might be a primary reason for the decrease in irreducible brine saturation.

3.3. Effect of Confining Pressure on CO2 Relative Permeability in the Irreducible Water State

The relationship between CO2 RP and CP in the irreducible brine state was studied and the results are presented in Figure 9. The experimental findings indicated that as the CP increased from 12 MPa to 14 MPa while in the irreducible water state, the CO2 RP decreased considerably. However, as the CP was further increased to 20 MPa, the decrease in the CO2 RP was relatively small.
This phenomenon may be due to alterations in the rock pore structure induced by CP, involving a decrease in pore size and the development of capillary pores [54,55]. Certain larger pores transform into capillary pores with water-binding potential [37]. This shift in pore structure hinders CO2 flow, causing a decline in CO2 RP. Simultaneously, the reduction in the pore throat radius results in increased capillary forces. This augmented capillary force hinders CO2 from displacing bound water, further diminishing the CO2 RP. The effect of pore structure compression might have been significant under the 14 MPa CP. Consequently, under the 20 MPa CP the alteration in pore structure has a relatively minor impact on CO2 RP.

3.4. Effect of Confining Pressure on CO2-Brine Relative Permeability Curve

Figure 10 illustrates the CO2-brine RP curves fitted by five sets of Van Genuchten modified models. The results show significant variations in the CO2-brine RP curves depending on the CP. The CO2 RP curve decreases as the CP increases, while the brine RP increases. Specifically, as the pressure was raised from 12 MPa to 20 MPa, the CO2 RP in the irreducible brine state decreased by 57%. However, the change in brine RP is not as noticeable as that of CO2. The reduction in CO2 RP is more apparent when the brine saturation is below the isotonic point saturation. Figure 10’s right image provides an enlarged view of the isotonic point area of the RP curve. The isotonic point shifts progressively to the left with increasing CP, while the brine saturation corresponding to the isotonic point decreases. This decrease significantly hampers CO2 flow.
The observed results may be attributed to changes in CP altering rock properties, thereby influencing the RP magnitude [9,56]. These rock properties encompass wettability and pore characteristics. Wettability plays a pivotal role in RP; a shift in rock wettability from strongly water-wetting to gas-wetting leads to a decrease in the RP of gas and an increase in the RP of water [57]. Research on wettability in saline aquifers indicates that increased pressure enhances the wettability of CO2 [58,59]. Wettability governs the distribution and flow of CO2 and brine in rock pores. An escalation in CP transforms wettability from water-wetting to mixed-wetting to CO2-wetting, ultimately resulting in a decrease in the RP of CO2. Beyond altering wettability, CP may also impact the pore properties of the rock, including porosity, pore size distribution, pore geometry, and pore connectivity. Investigations into CO2-brine two-phase RP reveal a significant decrease in the RP of CO2 with decreasing porosity [60]. An increase in CP compacts sand grains, leading to a denser core structure, reduced pore volumes, smaller pore throat sizes, and diminished porosity [61,62]. Small pores are occupied by the wetting phase, forming a thin film on rock particle surfaces. The non-wetting phase occupies larger pores’ central region [63,64]. With rising CP, core pore volume decreases, causing pore fluids to redistribute. Some larger pores that originally allowed the unrestricted flow of the non-wetting phase gradually shrink, becoming pores bound by the wetting phase [65]. As the number of pores capable of binding the wetting phase increases, the number of pores permitting non-wetting phase flow decreases. As the CP increases, the local pore throat size decreases, resulting in higher capillary resistance when the non-wetting phase passes through the pore throat. This makes it more challenging for the non-wetting phase to traverse the pores. Consequently, with the increase in CP, the RP of CO2 decreases. Pore connectivity similarly influences RP [66,67,68], as fluid can efficiently flow only through connected pores. An increase in CP may isolate pores that were previously interconnected, disrupting fluid flow and decreasing the RP of the terminal gas, even as the final gas saturation increases.
Figure 11 demonstrates that when water saturation is below 80% the ratio of gas RP to water RP (Krg/Krw) decreases as CP increases. The intersection point between the horizontal line and the curve in the figure represents the isotonic point. The brine saturation corresponding to the isotonic point decreases. This suggests that the increase in CP has a more significant impact on gas RP than it does on brine RP.
Compared with CO2, the mobility of brine within the core is less influenced by CP. Water molecules may interact with the solid particle surfaces in the formation, and they are more prone to forming water films within the formation pores [69]. At low CP, water molecules can already flow relatively freely in the pores, and increasing the CP has little effect on brine RP.

4. Conclusions

Five sets of unsteady-state drainage experiments were conducted using natural sandstone cores in the Ordos Basin under different CP conditions (12, 14, 16, 18, 20 MPa). The ‘J.B.N’ method was used to calculate the relative permeability of CO2-brine. Relative permeability curves for the CO2-brine system at various confining pressures were plotted. Analyses of confining pressure effects on irreducible brine saturation, CO2 relative permeability in the irreducible brine state, and CO2-brine relative permeability curves were conducted.
The research results show that for the sandstone in the Ordos Basin in this study, as the confining pressure increases irreducible brine saturation slightly decreases. As the confining pressure was raised from 12 MPa to 20 MPa, the CO2 relative permeability in the irreducible brine state decreased by 57%. The results reveal notable differences in the CO2-brine relative permeability curves at various confining pressures. As the confining pressure increases, the CO2 relative permeability curve decreases, while the brine relative permeability increases. The change in brine relative permeability is not as pronounced as that of CO2.

Author Contributions

Conceptualization, L.T. and G.D.; methodology, H.W.; validation, W.X., L.T. and Y.Z.; formal analysis, S.S.; investigation, Z.S.; resources, H.S.; data curation, C.X.; writing—original draft preparation, Y.Z.; writing—review and editing, G.D.; visualization, H.W.; supervision, H.S.; project administration, L.T. All authors have read and agreed to the published version of the manuscript.

Funding

This study was funded by the National Natural Science Foundation of China (Grant No. 52274027 and No. 11972073).

Data Availability Statement

The data is available from the corresponding author on reasonable request.

Conflicts of Interest

Authors Shijie Song, Huimin Wang and Wuqiang Xie were employed by the company Shaanxi Coal and Chemical Industry Group Co., Ltd. The remaining authors declare that the research was conducted in the absence of any commercial or financial relationships that could be construed as a potential conflict of interest.

References

  1. Hansen, J.; Johnson, D.; Lacis, A.; Lebedeff, S.; Lee, P.; Rind, D.; Russell, G. Climate impact of increasing atmospheric carbon dioxide. Science 1981, 213, 957–966. [Google Scholar] [CrossRef] [PubMed]
  2. Leung, D.Y.; Caramanna, G.; Maroto-Valer, M.M. An overview of current status of carbon dioxide capture and storage technologies. Renew. Sustain. Energy Rev. 2014, 39, 426–443. [Google Scholar]
  3. Kumar, S.; Foroozesh, J.; Edlmann, K.; Rezk, M.G.; Lim, C.Y. A comprehensive review of value-added CO2 sequestration in subsurface saline aquifers. J. Nat. Gas Sci. Eng. 2020, 81, 103437. [Google Scholar] [CrossRef]
  4. Cui, G.; Wang, Y.; Rui, Z.; Chen, B.; Ren, S.; Zhang, L. Assessing the combined influence of fluid-rock interactions on reservoir properties and injectivity during CO2 storage in saline aquifers. Energy 2018, 155, 281–296. [Google Scholar] [CrossRef]
  5. Xie, C.; Zhu, J.; Yang, H.; Wang, J.; Liu, L.; Song, H. Relative permeability curve prediction from digital rocks with variable sizes using deep learning. Phys. Fluids 2023, 35, 096605. [Google Scholar] [CrossRef]
  6. Honarpour, M.M. Relative Permeability of Petroleum Reservoirs; CRC Press: Boca Raton, FL, USA, 2018. [Google Scholar]
  7. Al-Menhali, A.; Niu, B.; Krevor, S. Capillarity and wetting of carbon dioxide and brine during drainage in b erea sandstone at reservoir conditions. Water Resour. Res. 2015, 51, 7895–7914. [Google Scholar] [CrossRef]
  8. Bachu, S.; Bennion, B. Effects of in-situ conditions on relative permeability characteristics of CO2-brine systems. Environ. Geol. 2008, 54, 1707–1722. [Google Scholar] [CrossRef]
  9. Chen, X. Experimental Studies on CO2-Brine-Decane Relative Permeabilities in Berea Sandstone with New Steady-State and Unsteady-State Methods. Doctoral Dissertation, UT Austin, Austin, TX, USA, 2016. [Google Scholar]
  10. Levine, J.S.; Goldberg, D.S.; Lackner, K.S.; Matter, J.M.; Supp, M.G.; Ramakrishnan, T.S. Relative permeability experiments of carbon dioxide displacing brine and their implications for carbon sequestration. Environ. Sci. Technol. 2014, 48, 811–818. [Google Scholar] [CrossRef]
  11. Krevor, S.C.; Pini, R.; Zuo, L.; Benson, S.M. Relative permeability and trapping of CO2 and water in sandstone rocks at reservoir conditions. Water Resour. Res. 2012, 48. [Google Scholar] [CrossRef]
  12. Manceau, J.C.; Ma, J.; Li, R.; Audigane, P.; Jiang, P.X.; Xu, R.N.; Tremosa, J.; Lerouge, C. Two-phase flow properties of a sandstone rock for the CO2/water system: Core-flooding experiments, and focus on impacts of mineralogical changes. Water Resour. Res. 2015, 51, 2885–2900. [Google Scholar] [CrossRef]
  13. Pini, R.; Krevor, S.C.; Benson, S.M. Capillary pressure and heterogeneity for the CO2/water system in sandstone rocks at reservoir conditions. Adv. Water Resour. 2012, 38, 48–59. [Google Scholar] [CrossRef]
  14. Akbarabadi, M.; Piri, M. Relative permeability hysteresis and capillary trapping characteristics of supercritical CO2/brine systems: An experimental study at reservoir conditions. Adv. Water Resour. 2013, 52, 190–206. [Google Scholar] [CrossRef]
  15. Chen, X.; DiCarlo, D.A. A new unsteady-state method of determining two-phase relative permeability illustrated by CO2-brine primary drainage in berea sandstone. Adv. Water Resour. 2016, 96, 251–265. [Google Scholar] [CrossRef]
  16. Bakhshian, S.; Hosseini, S.A.; Lake, L.W. CO2-brine relative permeability and capillary pressure of Tuscaloosa sandstone: Effect of anisotropy. Adv. Water Resour. 2020, 135, 103464. [Google Scholar] [CrossRef]
  17. Ruprecht, C.; Pini, R.; Falta, R.; Benson, S.; Murdoch, L. Hysteretic trapping and relative permeability of CO2 in sandstone at reservoir conditions. Int. J. Greenh. Gas Control 2014, 27, 15–27. [Google Scholar] [CrossRef]
  18. Lee, Y.S.; Kim, K.H.; Lee, T.H.; Sung, W.M.; Park, Y.C.; Lee, J.H. Analysis of CO2 endpoint relative permeability and injectivity by change in pressure, temperature, and phase in saline aquifer. Energy Sources Recovery Util. Environ. Eff. 2009, 32, 83–99. [Google Scholar]
  19. Farokhpoor, R.; Lindeberg, E.G.B.; Torsæter, O.; Mørk, M.B.; Mørk, A. Permeability and relative permeability measurements for CO2-brine system at reservoir conditions in low permeable sandstones in Svalbard. Greenh. Gases Sci. Technol. 2014, 4, 36–52. [Google Scholar] [CrossRef]
  20. Ren, X.; Li, A.; Memon, A. Experimental Study on Gas–Water Relative Permeability Characteristics of Tight Sandstone Reservoir in Ordos Basin. Geofluids 2022, 2022, 1521837. [Google Scholar] [CrossRef]
  21. Reynolds, C.; Blunt, M.; Krevor, S. Impact of reservoir conditions on CO2-brine relative permeability in sandstones. Energy Procedia 2014, 63, 5577–5585. [Google Scholar] [CrossRef]
  22. Raghavan, R.; Chin, L.Y. Productivity changes in reservoirs with stress-dependent permeability. In SPE Annual Technical Conference and Exhibition? SPE: Houston, TX, USA, 2002; p. SPE-77535. [Google Scholar]
  23. Alam, A.B.; Niioka, M.; Fujii, Y.; Fukuda, D.; Kodama, J.I. Effects of confining pressure on the permeability of three rock types under compression. Int. J. Rock Mech. Min. Sci. 2014, 65, 49–61. [Google Scholar] [CrossRef]
  24. Gobran, B.D.; Brigham, W.E.; Ramey, H.J. Absolute permeability as a function of confining pressure, pore pressure, and temperature. SPE Form. Eval. 1987, 2, 77–84. [Google Scholar] [CrossRef]
  25. Dong, J.J.; Hsu, J.Y.; Wu, W.J.; Shimamoto, T.; Hung, J.H.; Yeh, E.C.; Wu, Y.H.; Sone, H. Stress-dependence of the permeability and porosity of sandstone and shale from TCDP Hole-A. Int. J. Rock Mech. Min. Sci. 2010, 47, 1141–1157. [Google Scholar] [CrossRef]
  26. Farrell NJ, C.; Healy, D.; Taylor, C.W. Anisotropy of permeability in faulted porous sandstones. J. Struct. Geol. 2014, 63, 50–67. [Google Scholar] [CrossRef]
  27. Fatt, I. The effect of overburden pressure on relative permeability. J. Pet. Technol. 1953, 5, 15–16. [Google Scholar] [CrossRef]
  28. Zhang, X.; Wu, C.; Liu, S. Characteristic analysis and fractal model of the gas–water relative permeability of coal under different confining pressures. J. Pet. Sci. Eng. 2017, 159, 488–496. [Google Scholar] [CrossRef]
  29. Liu, Y.; Pan, Y.; Zhen, X. Influence of rock stress sensitivity in tight gas reservoir on characteristics of gas/water two phase flows. Complex Hydrocarb. Reserv. 2013, 6, 36–39. [Google Scholar]
  30. Lai, B.; Miskimins, J.L. A new technique for accurately measuring two-phase relative permeability under non-Darcy flow conditions. J. Pet. Sci. Eng. 2015, 127, 398–408. [Google Scholar] [CrossRef]
  31. Thomas, R.D.; Ward, D.C. Effect of overburden pressure and water saturation on gas permeability of tight sandstone cores. J. Pet. Technol. 1972, 24, 120–124. [Google Scholar] [CrossRef]
  32. Esmaeili, S.; Modaresghazani, J.; Sarma, H.; Harding, T.; Maini, B. Effect of temperature on relative permeability—Role of viscosity ratio. Fuel 2020, 278, 118318. [Google Scholar] [CrossRef]
  33. Owens, W.W.; Archer, D. The effect of rock wettability on oil–water relative permeability relationships. J. Pet. Technol. 1971, 23, 873–878. [Google Scholar] [CrossRef]
  34. Safaei-Farouji, M.; Thanh, H.V.; Dashtgoli, D.S.; Yasin, Q.; Radwan, A.E.; Ashraf, U.; Lee, K.K. Application of robust intelligent schemes for accurate modelling interfacial tension of CO2 brine systems: Implications for structural CO2 trapping. Fuel 2022, 319, 123821. [Google Scholar] [CrossRef]
  35. Lian, P.; Cheng, L. The characteristics of relative permeability curves in naturally fractured carbonate reservoirs. J. Can. Pet. Technol. 2012, 51, 137–142. [Google Scholar] [CrossRef]
  36. Zheng, X.; Zhigang, C.; Weichuan, L. Gas/water flowing ability influence experimental study of permeability stress sensibility in tight gas reservoir. Well Logging Technol. 2013, 4, 360–363. [Google Scholar]
  37. Adenutsi, C.D.; Li, Z.; Xu, Z.; Sun, L. Influence of net confining stress on NMR T2 distribution and two-phase relative permeability. J. Pet. Sci. Eng. 2019, 178, 766–777. [Google Scholar] [CrossRef]
  38. Lei, G.; Mo, S.; Dong, Z.; Wang CA, I.; Li, W. Theoretical and experimental study on stress-dependency of oil–water relative permeability in fractal porous media. Fractals 2018, 26, 1840010. [Google Scholar] [CrossRef]
  39. Simion, A.I.; Grigoraş, C.G.; Roşu, A.M.; Gavrilă, L. Mathematical modelling of density and viscosity of NaCl aqueous solutions. J. Agroaliment. Process. Technol 2015, 21, 41–52. [Google Scholar]
  40. Kestin, J.; Khalifa, H.E.; Correia, R.J. Tables of the dynamic and kinematic viscosity of aqueous NaCl solutions in the temperature range 20–150 C and the pressure range 0.1–35 MPa. J. Phys. Chem. Ref. Data 1981, 10, 71–88. [Google Scholar] [CrossRef]
  41. Honarpour, M.; Mahmood, S.M. Relative-permeability measurements: An overview. J. Pet. Technol. 1988, 40, 963–966. [Google Scholar] [CrossRef]
  42. Müller, N. Supercritical CO2-brine relative permeability experiments in reservoir rocks—Literature review and recommendations. Transp. Porous Media 2011, 87, 367–383. [Google Scholar] [CrossRef]
  43. Flett, M.; Gurton, R.; Taggart, I. The function of gas-water relative permeability hysteresis in the sequestration of carbon dioxide in saline formations. In SPE Asia Pacific Oil and Gas Conference and Exhibition; OnePetro: Richardson, TX, USA, 2004. [Google Scholar]
  44. Welge, H.J. A simplified method for computing oil recovery by gas or water drive. J. Pet. Technol. 1952, 4, 91–98. [Google Scholar] [CrossRef]
  45. Johnson, E.F.; Bossler, D.P.; Bossler, V.N. Calculation of relative permeability from displacement experiments. Trans. AIME 1959, 216, 370–372. [Google Scholar] [CrossRef]
  46. Corey, A.T. The interrelation between gas and oil relative permeabilities. Prod. Mon. 1954, 19, 38–41. [Google Scholar]
  47. Brooks, R.H.; Corey, A.T. Hydraulic properties of porous media. Hydrol. Pap. 1964, 3, 1–27. [Google Scholar]
  48. Van Genuchten, M.T. A closed-form equation for predicting the hydraulic conductivity of unsaturated soils. Soil Sci. Soc. Am. J. 1980, 44, 892–898. [Google Scholar] [CrossRef]
  49. Cheng, Y.; Zhang, C.; Zhu, L.Q. A fractal irreducible water saturation model for capillary tubes and its application in tight gas reservoir. J. Pet. Sci. Eng. 2017, 159, 731–739. [Google Scholar] [CrossRef]
  50. Chilingarian, G.V.; Torabzadeh, J.; Rieke, H.H.; Metghalchi, M.; Mazzullo, S.J. Interrelationships among surface area, permeability, porosity, pore size, and residual water saturation. In Developments in Petroleum Science; Elsevier: Amsterdam, The Netherlands, 1992; Volume 30, pp. 379–397. [Google Scholar]
  51. Luo, N.; Suo, Y.; Fan, X.; Yuan, Y.; Zhai, C.; Sun, W. Research on confining pressure effect of pore structure of coal-rich in coalbed methane under cyclic impact. Energy Rep. 2022, 8, 7336–7348. [Google Scholar] [CrossRef]
  52. Blanton, T.L. Deformation of chalk under confining pressure and pore pressure. Soc. Pet. Eng. J. 1981, 21, 43–50. [Google Scholar] [CrossRef]
  53. Zhang, F.; Jiang, Z.; Sun, W.; Li, Y.; Zhang, X.; Zhu, L.; Wen, M. A multiscale comprehensive study on pore structure of tight sandstone reservoir realized by nuclear magnetic resonance, high pressure mercury injection and constant-rate mercury injection penetration test. Mar. Pet. Geol. 2019, 109, 208–222. [Google Scholar] [CrossRef]
  54. Liu, B.; Ma, Y.; Liu, N.; Han, Y.; Li, D.; Deng, H. Investigation of pore structure changes in Mesozoic water-rich sandstone induced by freeze-thaw process under different confining pressures using digital rock technology. Cold Reg. Sci. Technol. 2019, 161, 137–149. [Google Scholar] [CrossRef]
  55. Li, Y.; Wu, Y.; Qiao, W.; Zhang, S.; Li, X. The Permeability Evolution of Sandstones with Different Pore Structures under High Confining Pressures, High Pore Water Pressures and High Temperatures. Appl. Sci. 2023, 13, 1771. [Google Scholar] [CrossRef]
  56. Alizadeh, A.H.; Piri, M. Three-phase flow in porous media: A review of experimental studies on relative permeability. Rev. Geophys. 2014, 52, 468–521. [Google Scholar] [CrossRef]
  57. Beltrán, A.; Hernández-Díaz, D.; Chávez, O.; García, A.; Mena, B.; Zenit, R. Experimental study of the effect of wettability on the relative permeability for air–water flow through porous media. Int. J. Multiph. Flow 2019, 120, 103091. [Google Scholar] [CrossRef]
  58. Broseta, D.; Tonnet, N.; Shah, V. Are rocks still water-wet in the presence of dense CO2 or H2S? Geofluids 2012, 12, 280–294. [Google Scholar] [CrossRef]
  59. Iglauer, S. CO2–water–rock wettability: Variability, influencing factors, and implications for CO2 geostorage. Acc. Chem. Res. 2017, 50, 1134–1142. [Google Scholar] [CrossRef] [PubMed]
  60. Bennion, D.B.; Bachu, S. Drainage and imbibition relative permeability relationships for supercritical CO2/brine and H2S/brine systems in intergranular sandstone, carbonate, shale, and anhydrite rocks. SPE Reserv. Eval. Eng. 2008, 11, 487–496. [Google Scholar] [CrossRef]
  61. Pan, L.; Jones, S.J.; Wang, X.; Guan, W.; Li, L. Re-evaluation of the porosity measurements under different confining pressures: A better appraisal of reservoir porosity. AAPG Bull. 2019, 103, 515–526. [Google Scholar] [CrossRef]
  62. Handin, J.; Hager, R.V., Jr.; Friedman, M.; Feather, J.N. Experimental deformation of sedimentary rocks under confining pressure: Pore pressure tests. Aapg Bull. 1963, 47, 717–755. [Google Scholar]
  63. Anderson, W.G. Wettability literature survey part 5: The effects of wettability on relative permeability. J. Pet. Technol. 1987, 39, 1453–1468. [Google Scholar] [CrossRef]
  64. Anderson, W.G. Wettability literature survey-part 6: The effects of wettability on waterflooding. J. Pet. Technol. 1987, 39, 1605–1622. [Google Scholar] [CrossRef]
  65. Lei, G.; Liao, Q.; Lin, Q.; Zhang, L.; Xue, L.; Chen, W. Stress dependent gas-water relative permeability in gas hydrates: A theoretical model. Adv. Geo-Energy Res. 2020, 4, 326–338. [Google Scholar] [CrossRef]
  66. Gharbi, O.; Blunt, M.J. The impact of wettability and connectivity on relative permeability in carbonates: A pore network modeling analysis. Water Resour. Res. 2012, 48. [Google Scholar] [CrossRef]
  67. Berg, S.; Rücker, M.; Ott, H.; Georgiadis, A.; Van der Linde, H.; Enzmann, F.; Kersten, M.; Armstrong, R.T.; de With, S.; Becker, J.; et al. Connected pathway relative permeability from pore-scale imaging of imbibition. Adv. Water Resour. 2016, 90, 24–35. [Google Scholar] [CrossRef]
  68. He, M.; Zhou, Y.; Wu, K.; Hu, Y.; Feng, D.; Zhang, T.; Liu, Q.; Li, X. Pore network modeling of thin water film and its influence on relative permeability curves in tight formations. Fuel 2021, 289, 119828. [Google Scholar] [CrossRef]
  69. Kimmel, G.A.; Stevenson, K.P.; Dohnalek, Z.; Smith, R.S.; Kay, B.D. Control of amorphous solid water morphology using molecular beams. I. Experimental results. J. Chem. Phys. 2001, 114, 5284–5294. [Google Scholar] [CrossRef]
Figure 1. Five cores for CO2-brine relative permeability experiments, numbered as 1-1, 1-2, 1-3, 1-4, and 1-5, respectively.
Water 15 04235 g001
Figure 2. CO2-brine relative permeability test flow chart.
Water 15 04235 g002
Figure 3. Results from experiments and model-fitting for relative permeability under a confining pressure of 12 MPa.
Water 15 04235 g003
Figure 4. Results from experiments and model-fitting for relative permeability under a confining pressure of 14 MPa.
Water 15 04235 g004
Figure 5. Results from experiments and model-fitting for relative permeability under a confining pressure of 16 MPa.
Water 15 04235 g005
Figure 6. Results from experiments and model-fitting for relative permeability under a confining pressure of 18 MPa.
Water 15 04235 g006
Figure 7. Results from experiments and model-fitting for relative permeability under a confining pressure of 20 MPa.
Water 15 04235 g007
Figure 8. Relationship between irreducible water saturation and confining pressure.
Water 15 04235 g008
Figure 9. Relationship between CO2 relative permeability and confining pressure in the irreducible water state.
Water 15 04235 g009
Figure 10. CO2-brine relative permeability under different confining pressures.
Water 15 04235 g010
Figure 11. Relationship between relative permeability ratio Krg/Krw and brine saturation under different confining pressures.
Water 15 04235 g011
Table 1. Detailed information on experimental cores.
Core NumberLength/cmDiameter/cmPorosity/%Dry Weight/gPermeability/mD
1-15.9652.5028.969.8997
1-25.9772.5068.470.95101
1-35.9652.5028.470.28103
1-45.9652.5028.170.3397
1-55.9772.5068.470.95101
Disclaimer/Publisher’s Note: The statements, opinions and data contained in all publications are solely those of the individual author(s) and contributor(s) and not of MDPI and/or the editor(s). MDPI and/or the editor(s) disclaim responsibility for any injury to people or property resulting from any ideas, methods, instructions or products referred to in the content.

