Article

Using Clustering, Geochemical Modeling, and a Decision Tree for the Hydrogeochemical Characterization of Groundwater in an In Situ Leaching Uranium Deposit in Bayan-Uul, Northern China

1
School of Environmental Studies, China University of Geosciences, Wuhan 430078, China
2
Nanjing Institute of Environmental Sciences, Ministry of Ecology and Environment of the People’s Republic of China, Nanjing 210042, China
3
College Urban and Environmental Sciences, Northwest University, Xi’an 710127, China
4
School of Mathematics and Physics, China University of Geosciences, Wuhan 430078, China
5
College of Water Resources and Architectural Engineering, Northwest A&F University, Yangling 712100, China
*
Authors to whom correspondence should be addressed.
Water 2023, 15(24), 4234; https://doi.org/10.3390/w15244234
Submission received: 24 October 2023 / Revised: 25 November 2023 / Accepted: 7 December 2023 / Published: 8 December 2023
(This article belongs to the Special Issue Application of Machine Learning to Water Resource Modeling)

Abstract

:
Uranium extraction through the in situ leaching method stands as a pivotal approach in uranium mining. In an effort to comprehensively assess the repercussions of in situ uranium leaching on groundwater quality, this study collected 12 representative groundwater samples within the Bayan-Uul mining area. The basic statistical characteristics of the water samples showed that the concentrations of SO42− and total dissolved solids (TDS) were relatively high. Through the use of cluster analysis, the water samples were categorized into two distinct clusters. Seven samples from wells W-d, W-u, N01, W10-2, W08-1, W10-1, and W13-1, situated at a considerable distance from the mining area, were grouped together. Conversely, five samples from wells W08-2, W13-2, W01-1, W02-2, and the pumping well located in closer proximity to the mining area, formed a separate cluster. A decision tree-based machine learning approach was employed to discern the influence of various hydrochemical indicators in forming these clusters, with results indicating that SO42− exerts the most substantial influence, followed by Ca2+. The mineral saturation indices from geochemical modeling indicated that, as the distance from the mining area increased, the trend of calcium minerals changed from dissolution to precipitation; iron minerals were in a precipitation state, and the precipitation trend was gradually weakening. In light of these findings, it is clear that in situ uranium leaching significantly impacted the groundwater in the vicinity of the mining area. The prolonged consumption of groundwater sourced near the study area, or its use for animal husbandry, poses potential health risks that demand heightened attention.

1. Introduction

Groundwater plays a vital role in promoting and supporting national socio-economic development as well as maintaining ecological balance [1,2,3]. With the acceleration of social industrialization and the rapid progress of society, the impact of human activities on groundwater has drawn increasing attention [4]. Activities such as mining water usage, wastewater discharge, and the in situ leaching of uranium [5,6,7,8,9] form a growing threat to the groundwater environment. Acidizing in situ leaching usually involves injecting a large amount of strong acid into an aquifer, and then extracting uranium-rich mining fluid from uranium deposits [10]. Throughout the process of the in situ leaching of uranium, various minerals are dissolved in groundwater [11,12]. The movement of mining fluids, driven by convection and dispersion, also causes the migration of various groundwater chemical constituents [13,14]. Consequently, the chemical ion composition of groundwater has changed, impacting both the quality and the overall health of groundwater resources and aquatic ecosystems [15].
Most uranium deposits in Northern China are located in arid or semi-arid areas [16], where surface water resources are often limited, and groundwater is essential for maintaining agricultural irrigation and domestic water [17,18]. Among these deposits, the Bayan-Uul mining site, characterized by a longstanding history of mining activities, particularly in the extraction of sandstone-type uranium deposits, employs acid in situ leaching methods for uranium extraction. Scholars have shown significant concern for the groundwater environment in this mining area, leading to various research endeavors. Investigations pertaining to the groundwater environment in the Bayan-Uul mining region have encompassed diverse aspects, including using tracer tests to analyze the variation characteristics of flow velocity within the mining area during in situ uranium leaching [19], the optimal design of mining well flow rates under different scenarios [20], and applying numerical simulation techniques to investigate the underground water flow field and hydrogeochemical field during both experimental and actual mining processes [21]. While these investigations have predominantly focused on mining efficiency and the characteristics of the underground flow field within and at the periphery of the mining area, there remains a notable gap in systematic research concerning the hydrochemical characteristics of groundwater around the mining area.
Previous studies have shown that, while the hydrochemical characteristics of groundwater are affected by natural processes [22,23,24,25] and human activities [26,27,28,29], its governing factors and mechanisms are complex and diverse. Currently, there are various methods for the study of the characteristics and governing factors of groundwater hydrochemistry, such as hydrochemical analysis [30], multivariate statistical analysis [31,32,33,34,35,36], geochemical modeling [37], and a decision tree-based machine learning approach [38,39,40,41]. These methods have proven their efficiency in hydrochemistry research, and excellent results have been achieved.
This study thus focused on the hydrochemical characteristics of the Bayan-Uul uranium mining area. Based on the geological and hydrogeological settings of the Bayan-Uul mining area, 12 groundwater samples were strategically collected in the proximity of the mining area. These samples were collected to evaluate the influence of leaching uranium on groundwater quality in the study area. The objective of this study is two-fold: (1) to elucidate the hydrogeochemical characters of groundwater within the mining area, and (2) to demonstrate how to use the different methods, specifically, statistical analysis, geochemical modeling, and the decision tree-based machine learning method for the analysis of the governing factors of groundwater geochemistry.

2. Materials and Methods
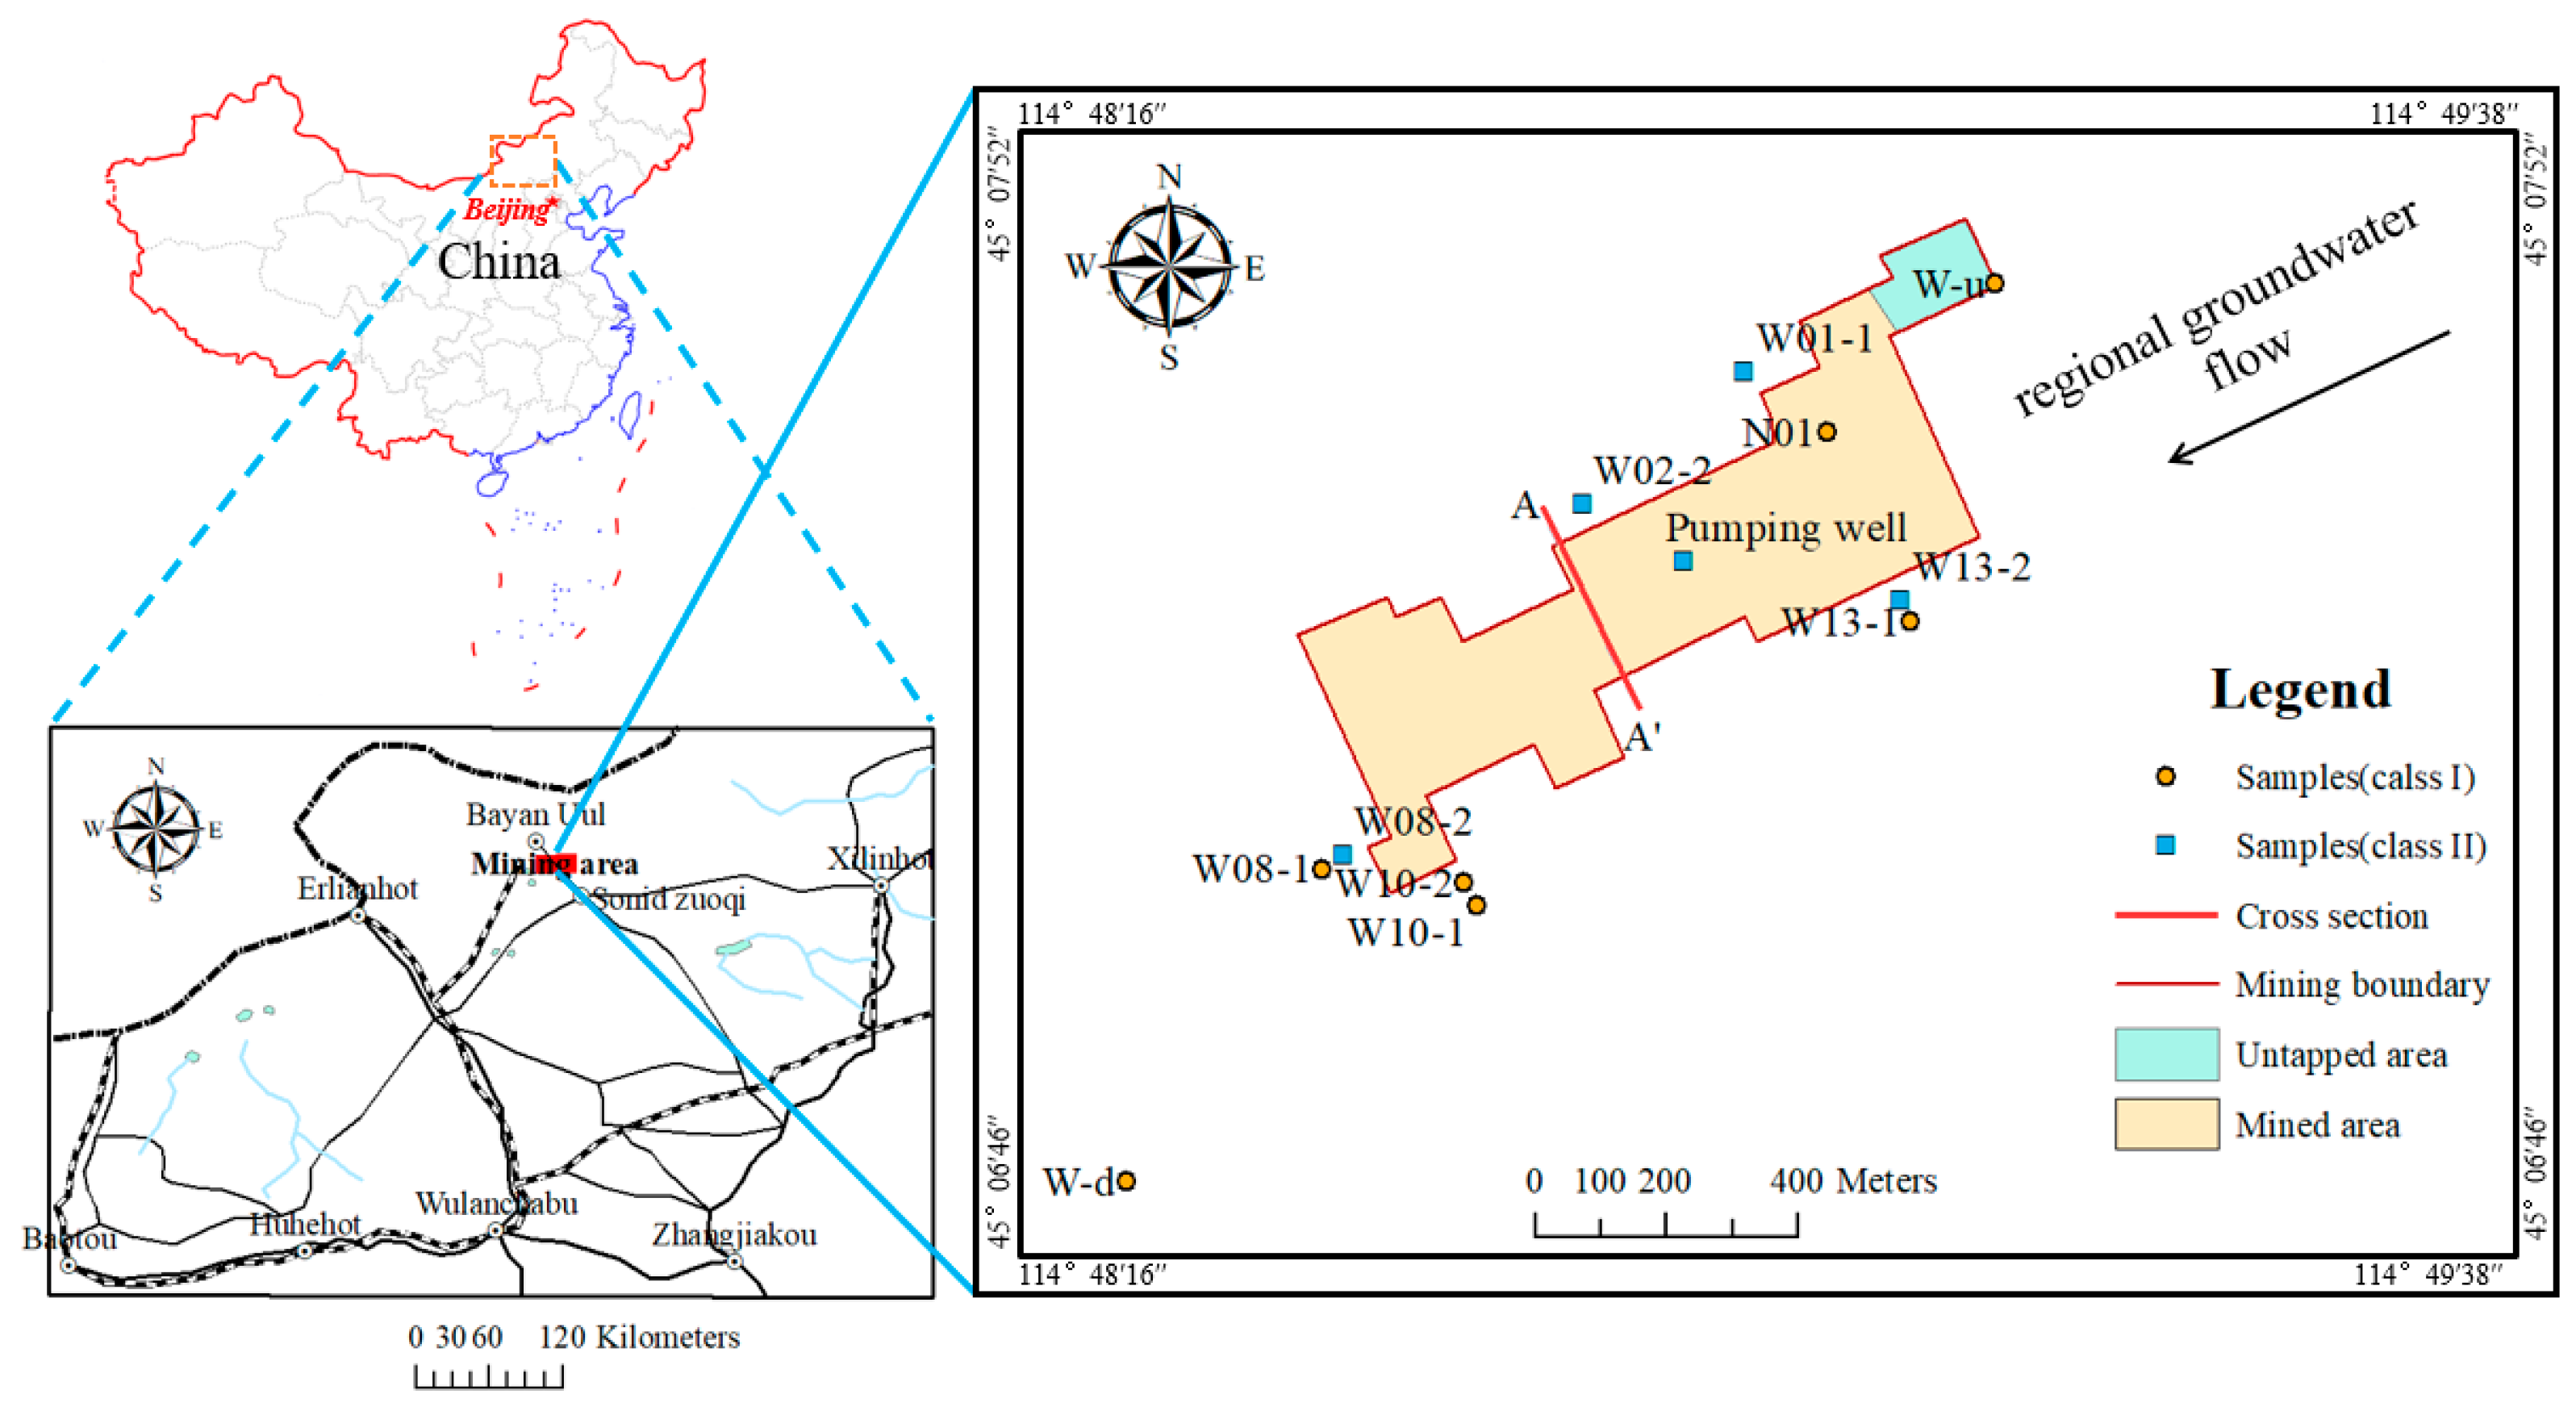
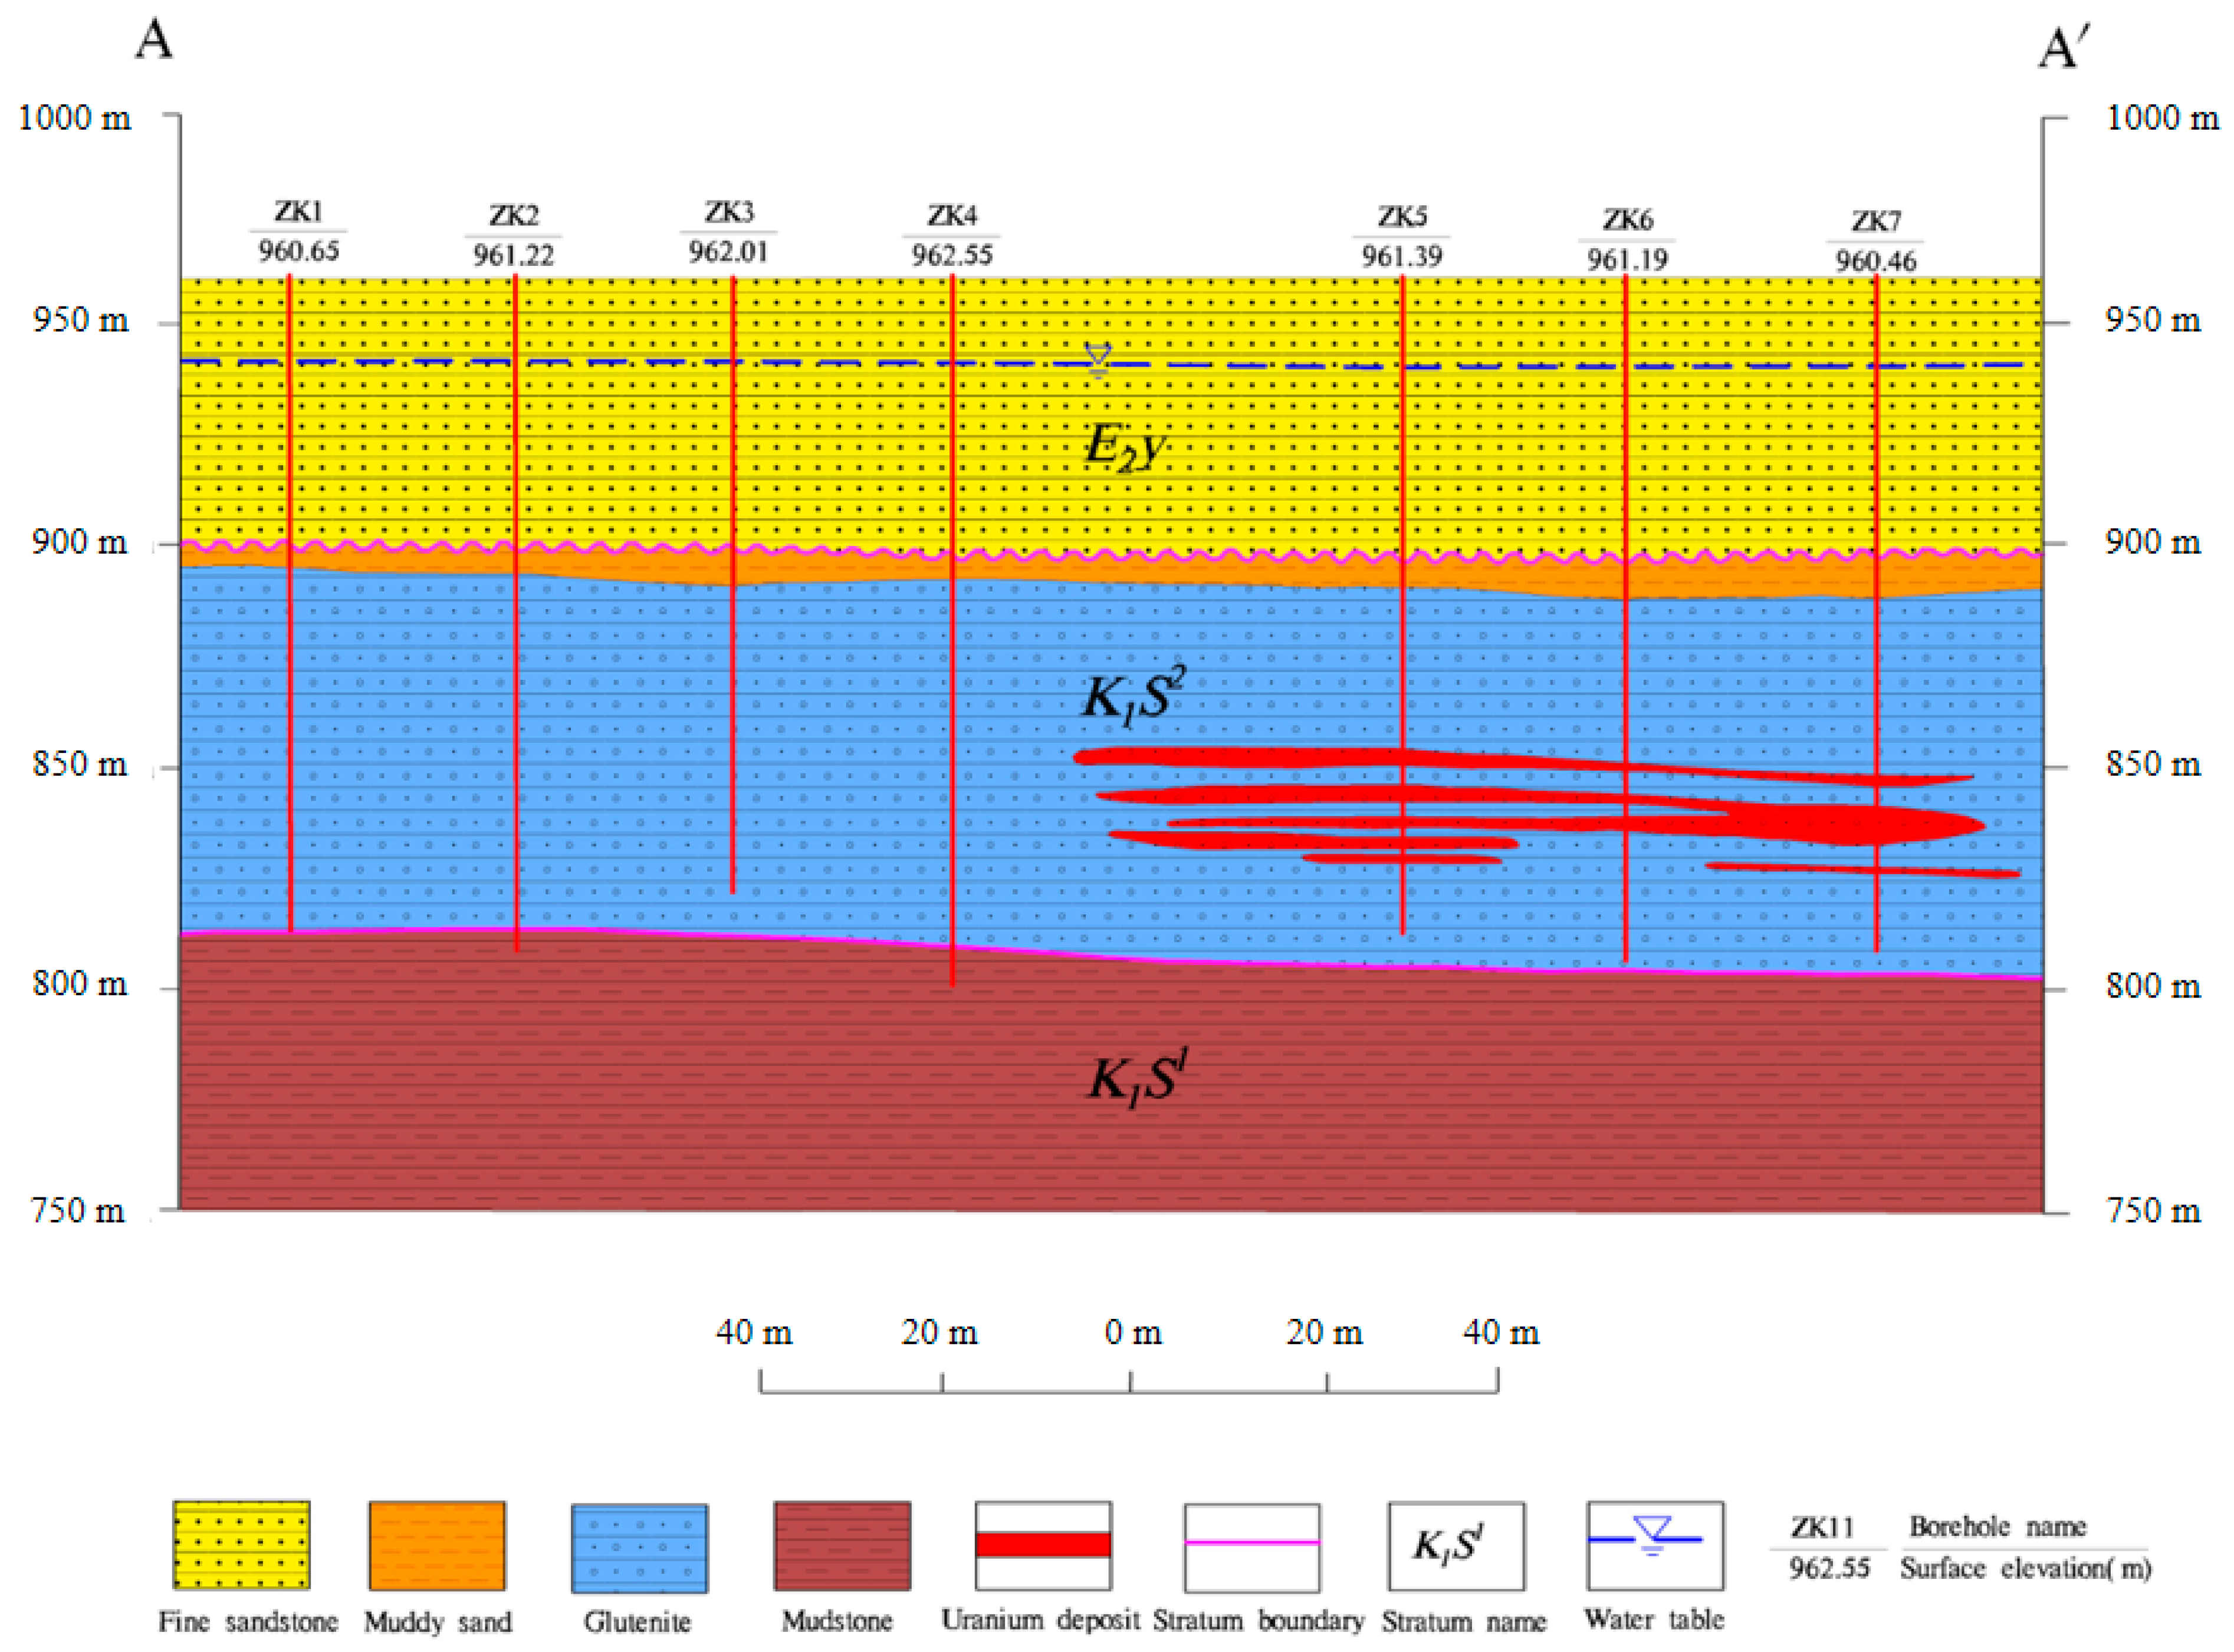
2.1. Study Area

The Bayan-Uul mining area is situated in the northern region of the Inner Mongolia Autonomous Region, approximately 30 km north of the city of Sonid Zuoqi. Figure 1 depicts a geographical overview, including the transportation infrastructure and the spatial distribution of boreholes within the mining area. The climatic conditions in this area are characterized by an annual average temperature of 4 °C, an average annual rainfall of 181 mm, and an average annual evaporation rate of 1830 mm.
The study area is characterized by two distinct geological formations in the vertical direction, namely, the Irdimanha Formation (E2y) and the Saihan Formation (K1s), both of which display a parallel unconformity relationship (Figure 2). The Saihan Formation can be further subdivided into two distinct groups: the upper section of the Saihan Formation (K1s2) and the lower section of the Saihan Formation (K1s1). The E2y is positioned atop the K1s2 layer, predominantly characterized by river and flood sedimentary deposits, encompassing sandstone, sand gravel, mud gravel, sand, mud, and rocky materials. This stratum possesses an approximate thickness of 50 m and serves as the phreatic aquifer. A confining layer forms at the uppermost boundary of the upper section of the K1s2. Notably, the primary confined aquifer is observed within the upper section of the K1s2, displaying a laterally extensive distribution. As shown in Figure 2, this aquifer is predominantly composed of sandstone and sandy conglomerate, exhibiting favorable water yield and permeability characteristics, with an estimated thickness of approximately 60 m. By contrast, the lower section of the K1s1 predominantly comprises mudstone and silty mudstone, interspersed with deposits of lignite derived from lacustrine and marsh environments. Groundwater within the mining area predominantly undergoes lateral recharge from the neighboring groundwater in the northeastern sector, with additional weaker lateral recharge observed in the northwest and southeast directions. The overall groundwater flow direction is from northeast to southwest, culminating in discharge in the southern and western sectors of the deposit.
In the in situ leaching mine, a network of observation wells has been strategically positioned in the vicinity of the mining area, with groundwater samples collected from a subset of these wells. Specifically, a total of 11 observation wells plus the pumping well were selected for sampling. Four observation wells, namely W01-1, W02-2, W08-2, W10-2, and W13-2, are located at a distance of 50 m from the mining area (Figure 1). Three wells, namely W08-1, W10-1, and W13-1, are situated at a distance of 100 m from the mining site (Figure 1). All of these eleven wells are positioned within the upper section of K1s1. With regard to well N01, it is located inside the mining area and is positioned within the E2y. Well W-d is located at a considerable distance from the mining area, and well W-u is located upstream of the mining area. These two wells are positioned within the K1s2. Notably, the leaching of uranium from the mining activities has had minimal impact on the groundwater sourced from these two wells. Consequently, these two wells can be designated as background observation points. It is important to note that, at the time of sampling, the mining operation had been in progress for a duration of four years.

2.2. Sample Collection

In order to assess the groundwater quality in the Bayan-Uul mining area, we meticulously collected 12 groundwater samples from designated observation wells and a pumping well in September 2018. The precise geographic coordinates of the sampling locations were determined using a GPS positioner. For the sampling process, we employed a sampler that could be lowered to depths ranging from 50 m to 130 m within the well bore. To ensure the integrity of the samples, we used non-contaminating plastic bottles, which were thoroughly rinsed with well water from the specific sampling point before the collection of each sample. On-site measurements were conducted for parameters such as Total Dissolved Solid (TDS) values and water temperatures using a Multiparameter Water Quality Analyzer. Subsequently, the collected samples were transported to the China Nuclear Chemometry Test Center for comprehensive analysis. The primary cations, including K+, Na+, Ca2+, Mg2+, NH4+, and Total Fe, were quantified using Inductively Coupled Plasma Optical Emission Spectrometry (ICP-OES). The primary anions, such as Cl, SO42−, and F, were determined through ion chromatography. Additionally, bicarbonate (HCO32−) analysis was carried out via titration.
To ensure the accuracy and quality of the water analyses, a charge balance error (CBE) was calculated. Specifically, water samples exhibiting a high cation concentration resulted in a positive CBE, while high anion concentration led to a negative CBE. Ion concentrations were expressed in milligrams per liter (mg/L). In accordance with previous studies, only the water samples exhibiting a CBE less than 5% were deemed acceptable for analysis [42]. All twelve samples used in this study met this requirement.

2.3. Methodology

2.3.1. Clustering Method

Multivariate statistical analyses serve as a valuable tool for extracting meaningful insights from extensive datasets concerning the hydrogeochemical composition of groundwater. In a multi-indicator evaluation system, each evaluation indicator often exhibits varying orders of magnitude and units, given the distinct nature of these indicators. Using raw data in the analysis could accentuate the influence of indicators with higher values while relatively diminishing the significance of those with lower values. Consequently, to ensure the integrity and reliability of the results, it is imperative to standardize the original data. Z-score standardization was employed for this standardization process. Initially, the mean and variance of each variable were calculated using the following equation:
x ¯ j = 1 n i = 1 n x i j , j = 1,2 , 3 , , p
s j 2 = 1 n i = 1 n x i j x ¯ j 2 , j = 1,2 , 3 , , p
where p denotes the number of parameters, and n denotes the number of groundwater samples. Then, the following transformation was performed:
z i j = x i j x ¯ j s j , i = 1,2 , 3 , , n ; j = 1,2 , 3 , , p
The standardized data z i j has a standard deviation of 1 for each variable, which can be considered dimensionally independent.
Hierarchical cluster analysis (HCA) was then employed on the standardized data to elucidate the various chemical types of water and to delve into the sources of chemical elements. In this study, IBM SPSS Statistics V22.0 (https://www.ibm.com/support/pages/spss-statistics-220-available-download) was utilized to perform the HCA with the Ward method. The idea of this method comes from an analysis of variance. If the class classification is correct, the sum of squares of deviations for similar samples should be smaller, and the sum of squares of deviations between classes should be larger.
Assuming that classes G K and G L merge into a new class G M , the sum of squares of deviations for class G K , class G L , and class G M is [43], as such:
W K = i G K x i x ¯ K T x i x ¯ K
W L = i G L x i x ¯ L T x i x ¯ L
W M = i G M x i x ¯ M T x i x ¯ M
The sum of squared deviations reflects the degree of dispersion of samples within each class. If the distance between class G K and class G L is relatively close, the sum of squares of the deviations will be smaller after merging. Otherwise, the sum of squares of the deviations will be larger. The square distance between class G K and class G L can be defined as such:
D K L 2 = W M W K W L
By sequentially selecting pairs of classes in the dataset and then calculating the D K L 2 value between the selected two classes, the two classes with the smallest increase in distance D K L 2 are determined and merged into a new class.

2.3.2. Decision Tree-Based Machine Learning Approach

The decision tree-based machine learning approach is a supervised learning technique that leverages the principles of classification to create mathematical models rooted in the attributes of data, ultimately serving the purpose of data screening and decision-making. In this study, the decision tree algorithm was used to explore the main differences between the classified clusters using the Gini Index method (CART) [44].
For dataset D , the Gini index is defined as such:
G i n i ( D ) = 1 k = 1 K C k D 2
where Gini(D) denotes the Gini index of dataset D . C k denotes the k-th (k = 1, 2, …, K) cluster from the HCA clustering results. C k and D denote the number of samples in cluster C k and dataset D , respectively.
Suppose that the data set D can be divided into D 1 and D 2 subsets based on whether parameter A is greater or less than value a (a is always selected as the median value in the data set D in this study is), that is:
D 1 = x , y D A a , D 2 = D D 1
Under this condition, the Gini index can be re-calculated as
G i n i D | A = D 1 D G i n i D 1 + D 2 D G i n i D 2
For example, if the condition is whether the concentration of SO42− (denoted as c(SO42−)) is less than 2648.5 mg/L, the 12 groundwater samples can be divided into two parts:
D 1 = s a m p l e s D c S O 4 2 2648.5   m g / L , D 2 = D D 1
Then, G i n i ( D 1 ) and G i n i ( D 2 ) can be calculated by this:
G i n i ( D 1 ) = 1 k = 1 K C k D 1 2 , G i n i ( D 2 ) = 1 k = 1 K C k D 2 2
G i n i D | c S O 4 2 2648.5   m g / L = D 1 D G i n i D 1 + D 2 D G i n i D 2
The increment of the Gini index can be calculated as this:
G i n i = G i n i D G i n i D | c S O 4 2 2648.5   m g / L
By doing this calculation for all the hydrogeochemical parameters, the optimal partition can be found according to the maximum of G i n i .
The stopping condition of the algorithm is when the number of samples in the node is less than the predetermined threshold, the Gini index of the sample set is less than the predetermined threshold, or there are no more parameters. The Python Scikit-learn package (https://scikit-learn.org/stable/index.html, accessed on 23 October 2023) was used for performing the decision tree.

2.3.3. Geochemical Modeling

The mineral saturation index is a commonly utilized metric to describe the dissolved and precipitated conditions of different minerals in groundwater. By applying chemical thermodynamics calculations, we can glean insights into the behavior of various mineral phases within groundwater, leading to a more comprehensive understanding of water–rock interactions [18,45]. In this research, these values were computed based on the following Equation (13) using PHREEQC3.0 software [46]:
S I = ln I A P / K
where I A P and K represent the ionic activity product and the equilibrium constant of the corresponding minerals, respectively. In this context, SI = 0 indicates the equilibrium state, SI > 0 represents a saturated state, and SI < 0 signifies an unsaturated state.

3. Results

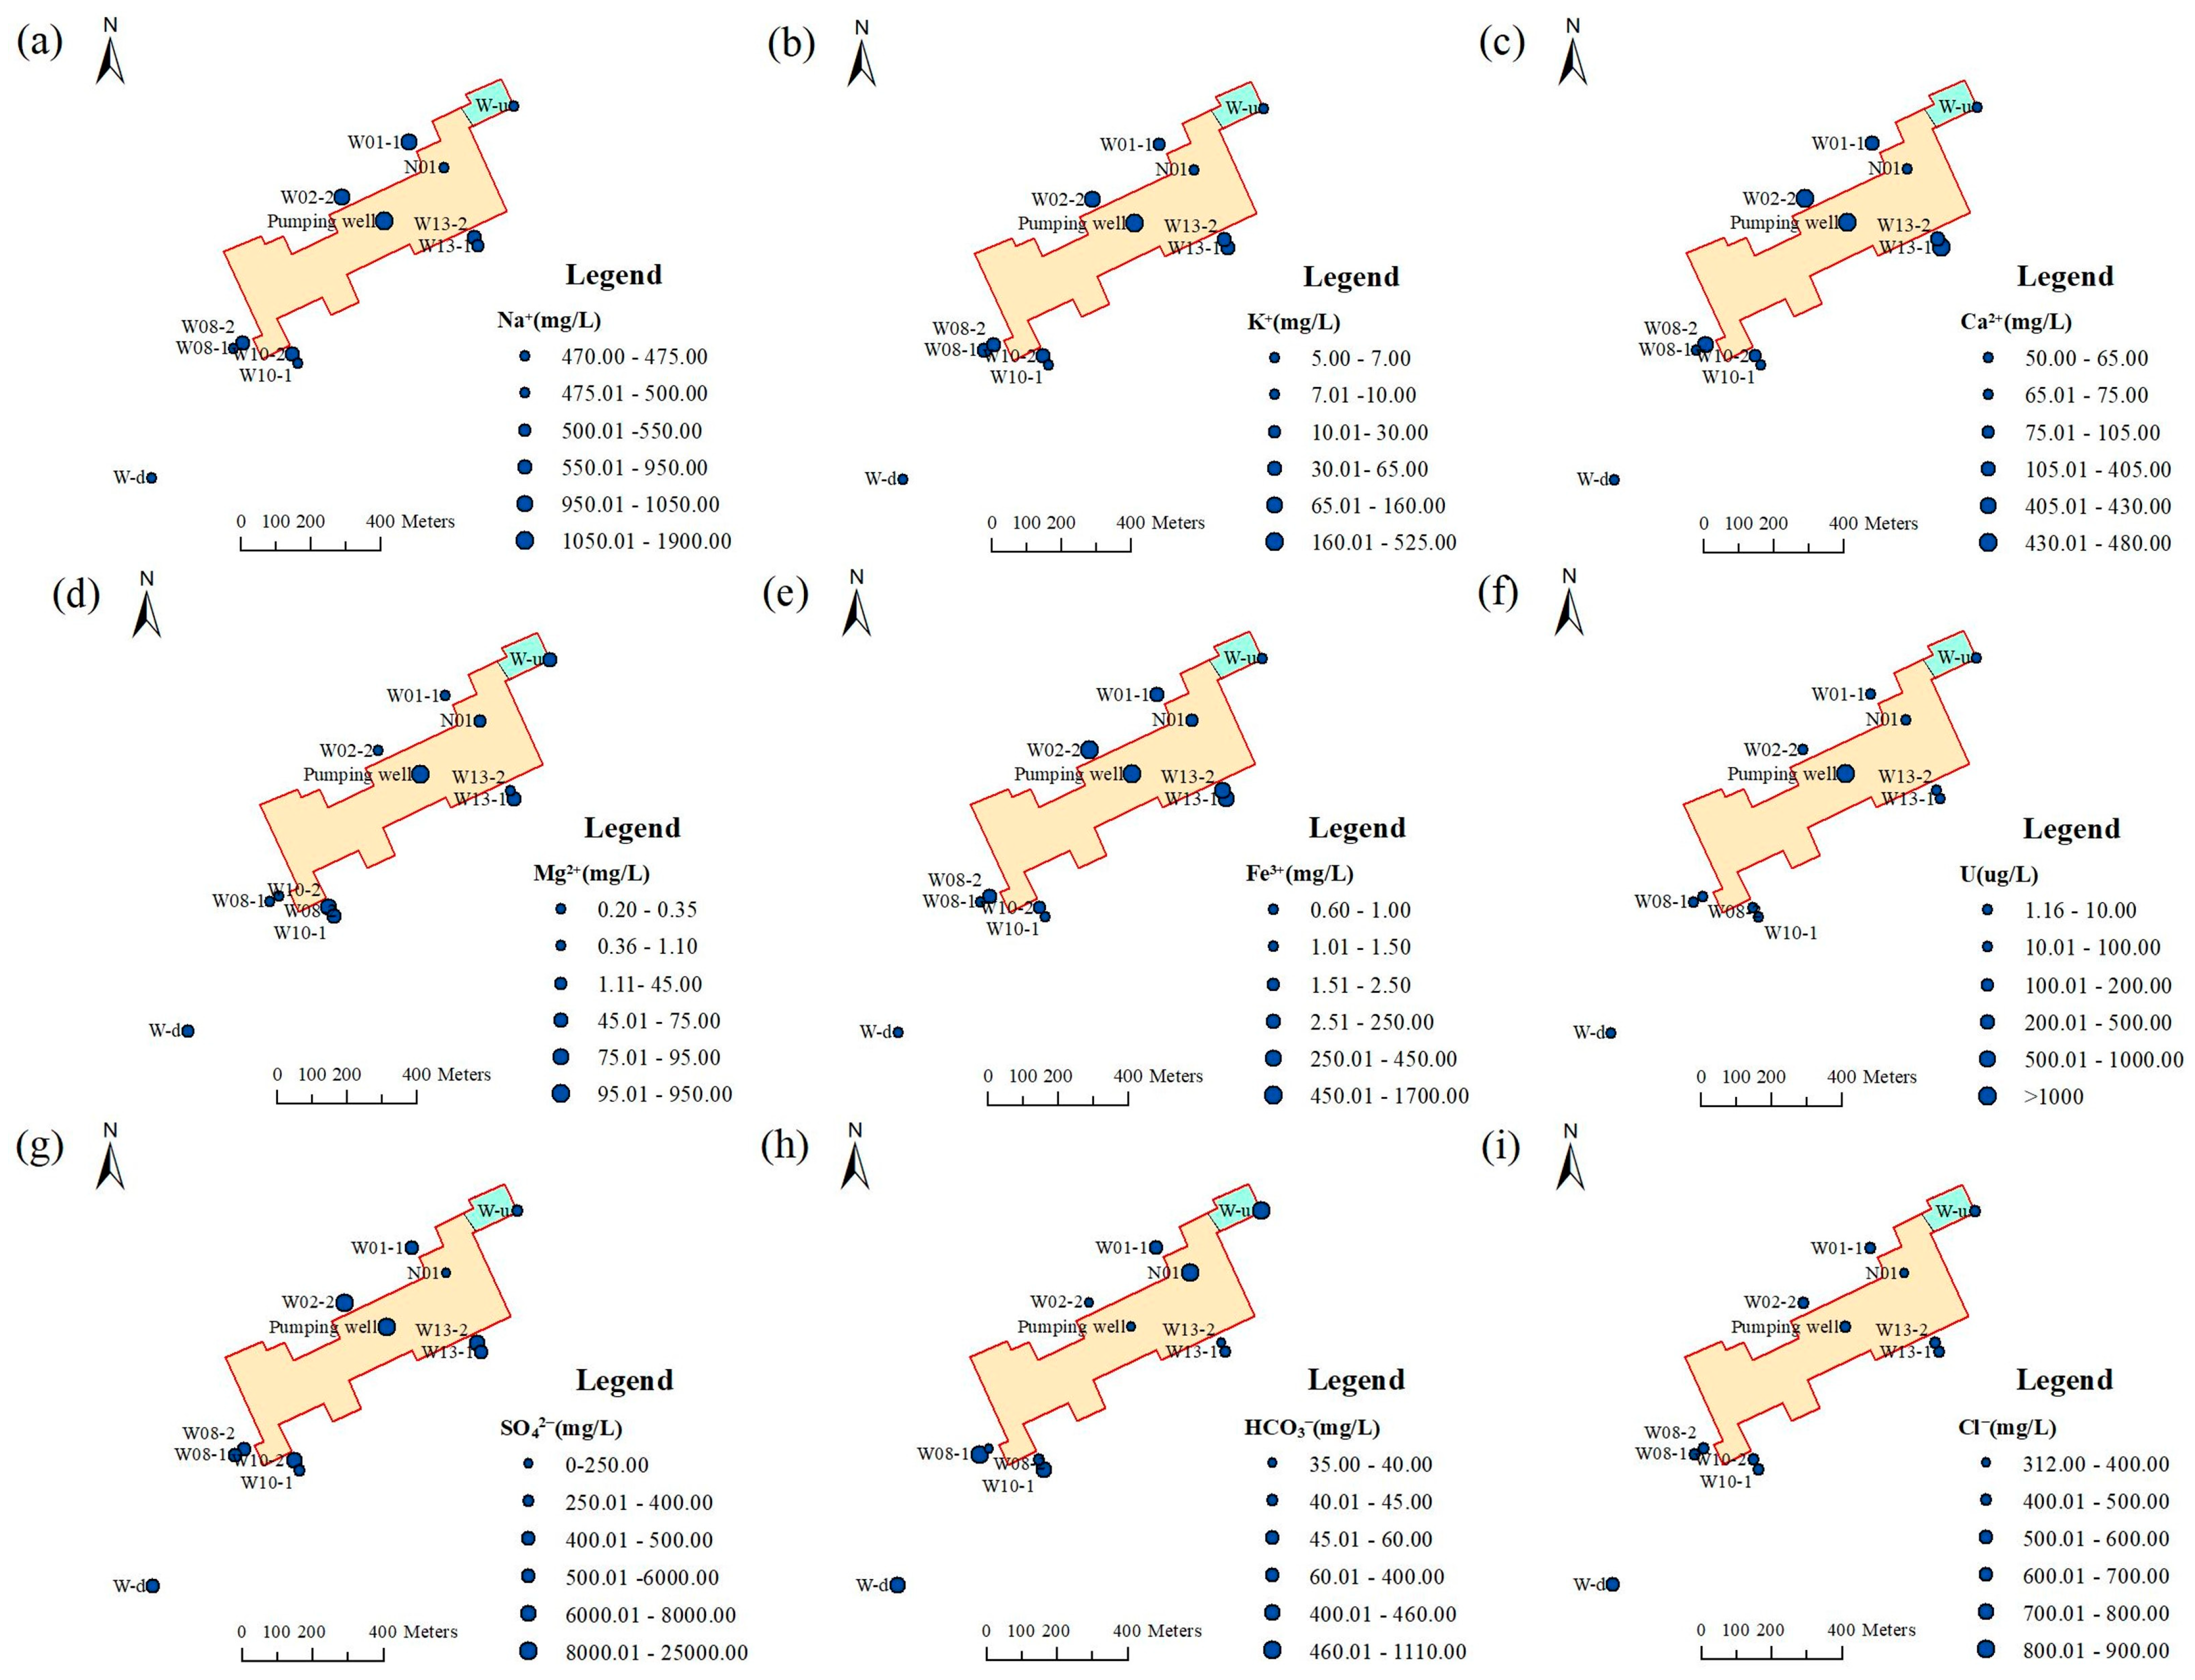
3.1. Basic Statistical Characteristics and Spatial Distributions of the Hydrochemical Parameters

The statistical characteristics of hydrogeochemical parameters are summarized in Table 1, which includes values for the minimum, maximum, average, and standard deviation. Meanwhile, the spatial distributions of the hydrogeochemical parameters are visually depicted in Figure 3. Given that the primary water usage in the study area is for domestic drinking, the major elements were compared against the Standards for Drinking Water Quality of China (2017 Edition) [47].
According to the national standards, the concentration limit for Na+ and Cl is set at 250 mg/L. However, Na+ concentrations of the groundwater in this area varied from 470 mg/L to 1060 mg/L, and Cl concentrations ranged from 312 mg/L to 536 mg/L, both exceeding the permissible limits for Class III water quality standards. K+ concentrations fluctuated between 5.55 mg/L and 162 mg/L, with an average value of 30.80 mg/L. The highest K+ concentration was observed at well W02-2. The concentrations of Ca2+ exhibited fluctuations ranging from 53.2 mg/L to 472 mg/L, with an average value of 204.84 mg/L. The highest Ca2+ concentration was reported at well W02-2. According to Figure 3a–c, it is evident that, for the majority of the sampling wells, those in proximity to the mining area exhibit higher concentrations of K+, Na+, and Ca2+. This observation suggests a close interrelation between the characteristics and evolution of the mineral composition and groundwater chemical composition of these three elements with the in situ leaching of uranium. Mg2+ concentrations spanned from 0.33 mg/L to 94.8 mg/L, with an average concentration of 36.41 mg/L. By contrast, the SO42− concentration ranged from 269 mg/L to 18,000 mg/L, with an average value of 3556.82 mg/L. As for total Fe, it is an essential element for the human body and is generally found in drinking water at levels that do not pose health risks. However, its presence can impact the taste and color of the water, affecting its overall acceptability. Elevated concentrations of iron can lead to the formation of iron deposits within the pore channels of the aquifer, potentially obstructing the aquifer and impeding its permeability. Simultaneously, the presence of iron can result in the generation of rust within the mining well. In the study area, the concentration of Fe exhibits considerable variation, ranging from 0.633 mg/L to 1530 mg/L. From Figure 3e, the highest Fe concentration was observed at sample point W02-2, while the lowest concentration was recorded at sample point W10-1. The average Fe concentration is 217.05 mg/L. The concentration of uranium exhibited fluctuations between 1.16 µg/L and 30.1 µg/L, with an average value of 12.18 µg/L. Notably, the concentration of uranium at the pumping well exceeded 1000 µg/L. As is evident from Figure 3f, uranium concentrations were generally low in all the wells, except for the notably high concentration observed in the pumping well. This discrepancy can be attributed to the predominant storage of uranium ore within the mining area. In the peripheral regions of the mining area, the uranium ore content is low, and consequently, the concentration of uranium cannot be effectively replenished. As a result, the impact of uranium on the groundwater environment outside the mining area is relatively minimal. The national standard sets the SO42− concentration limit at 250 mg/L, and this concentration significantly surpasses the permissible range for Class three water quality standards. The notably high SO42− concentration is likely attributed to the leaching solution containing H2SO4, suggesting that the groundwater in the vicinity of the mining area has indeed been influenced by the in situ leaching of uranium. Figure 3g indicates that proximity to the mining area corresponds to higher concentrations of SO42−. HCO3 concentration varied from 35 mg/L to 1110 mg/L, with an average value of 358.27 mg/L. From Figure 3d,h and other figures, the primary cations and ions in the groundwater of the study area exhibited a consistent trend of decreasing concentration from the inner areas toward the periphery, except for Mg2+ and HCO3. The Cl concentration ranged from 312 mg/L to 536 mg/L, with an average value of 440.91 mg/L. As depicted in Figure 3i, the spatial distribution appears relatively uniform. This uniformity is attributed to chloride primarily originating from the background value, with limited impact from water–rock interactions, leading to recharge or consumption.
Total Dissolved Solids (TDS) represents a critical parameter for assessing groundwater quality, as it serves as an indicator of the dissolved materials within the water. Changes in TDS are influenced and controlled by factors such as geomorphology, lithology, burial conditions, and human activities. In the confined water around the mining area, the lowest TDS content observed is 1340 mg/L, occurring at well W08-1, which falls within the brackish water range. The highest TDS concentration recorded is 25,200 mg/L, observed at well W02-2, also classified as saline water. On average, the TDS content in the study area stands at 6011.82 mg/L. Per the established water quality standards, the permissible TDS limit is set at 1000 mg/L. However, the TDS values measured at the various sampling points within the study area consistently exceed this permissible limit.

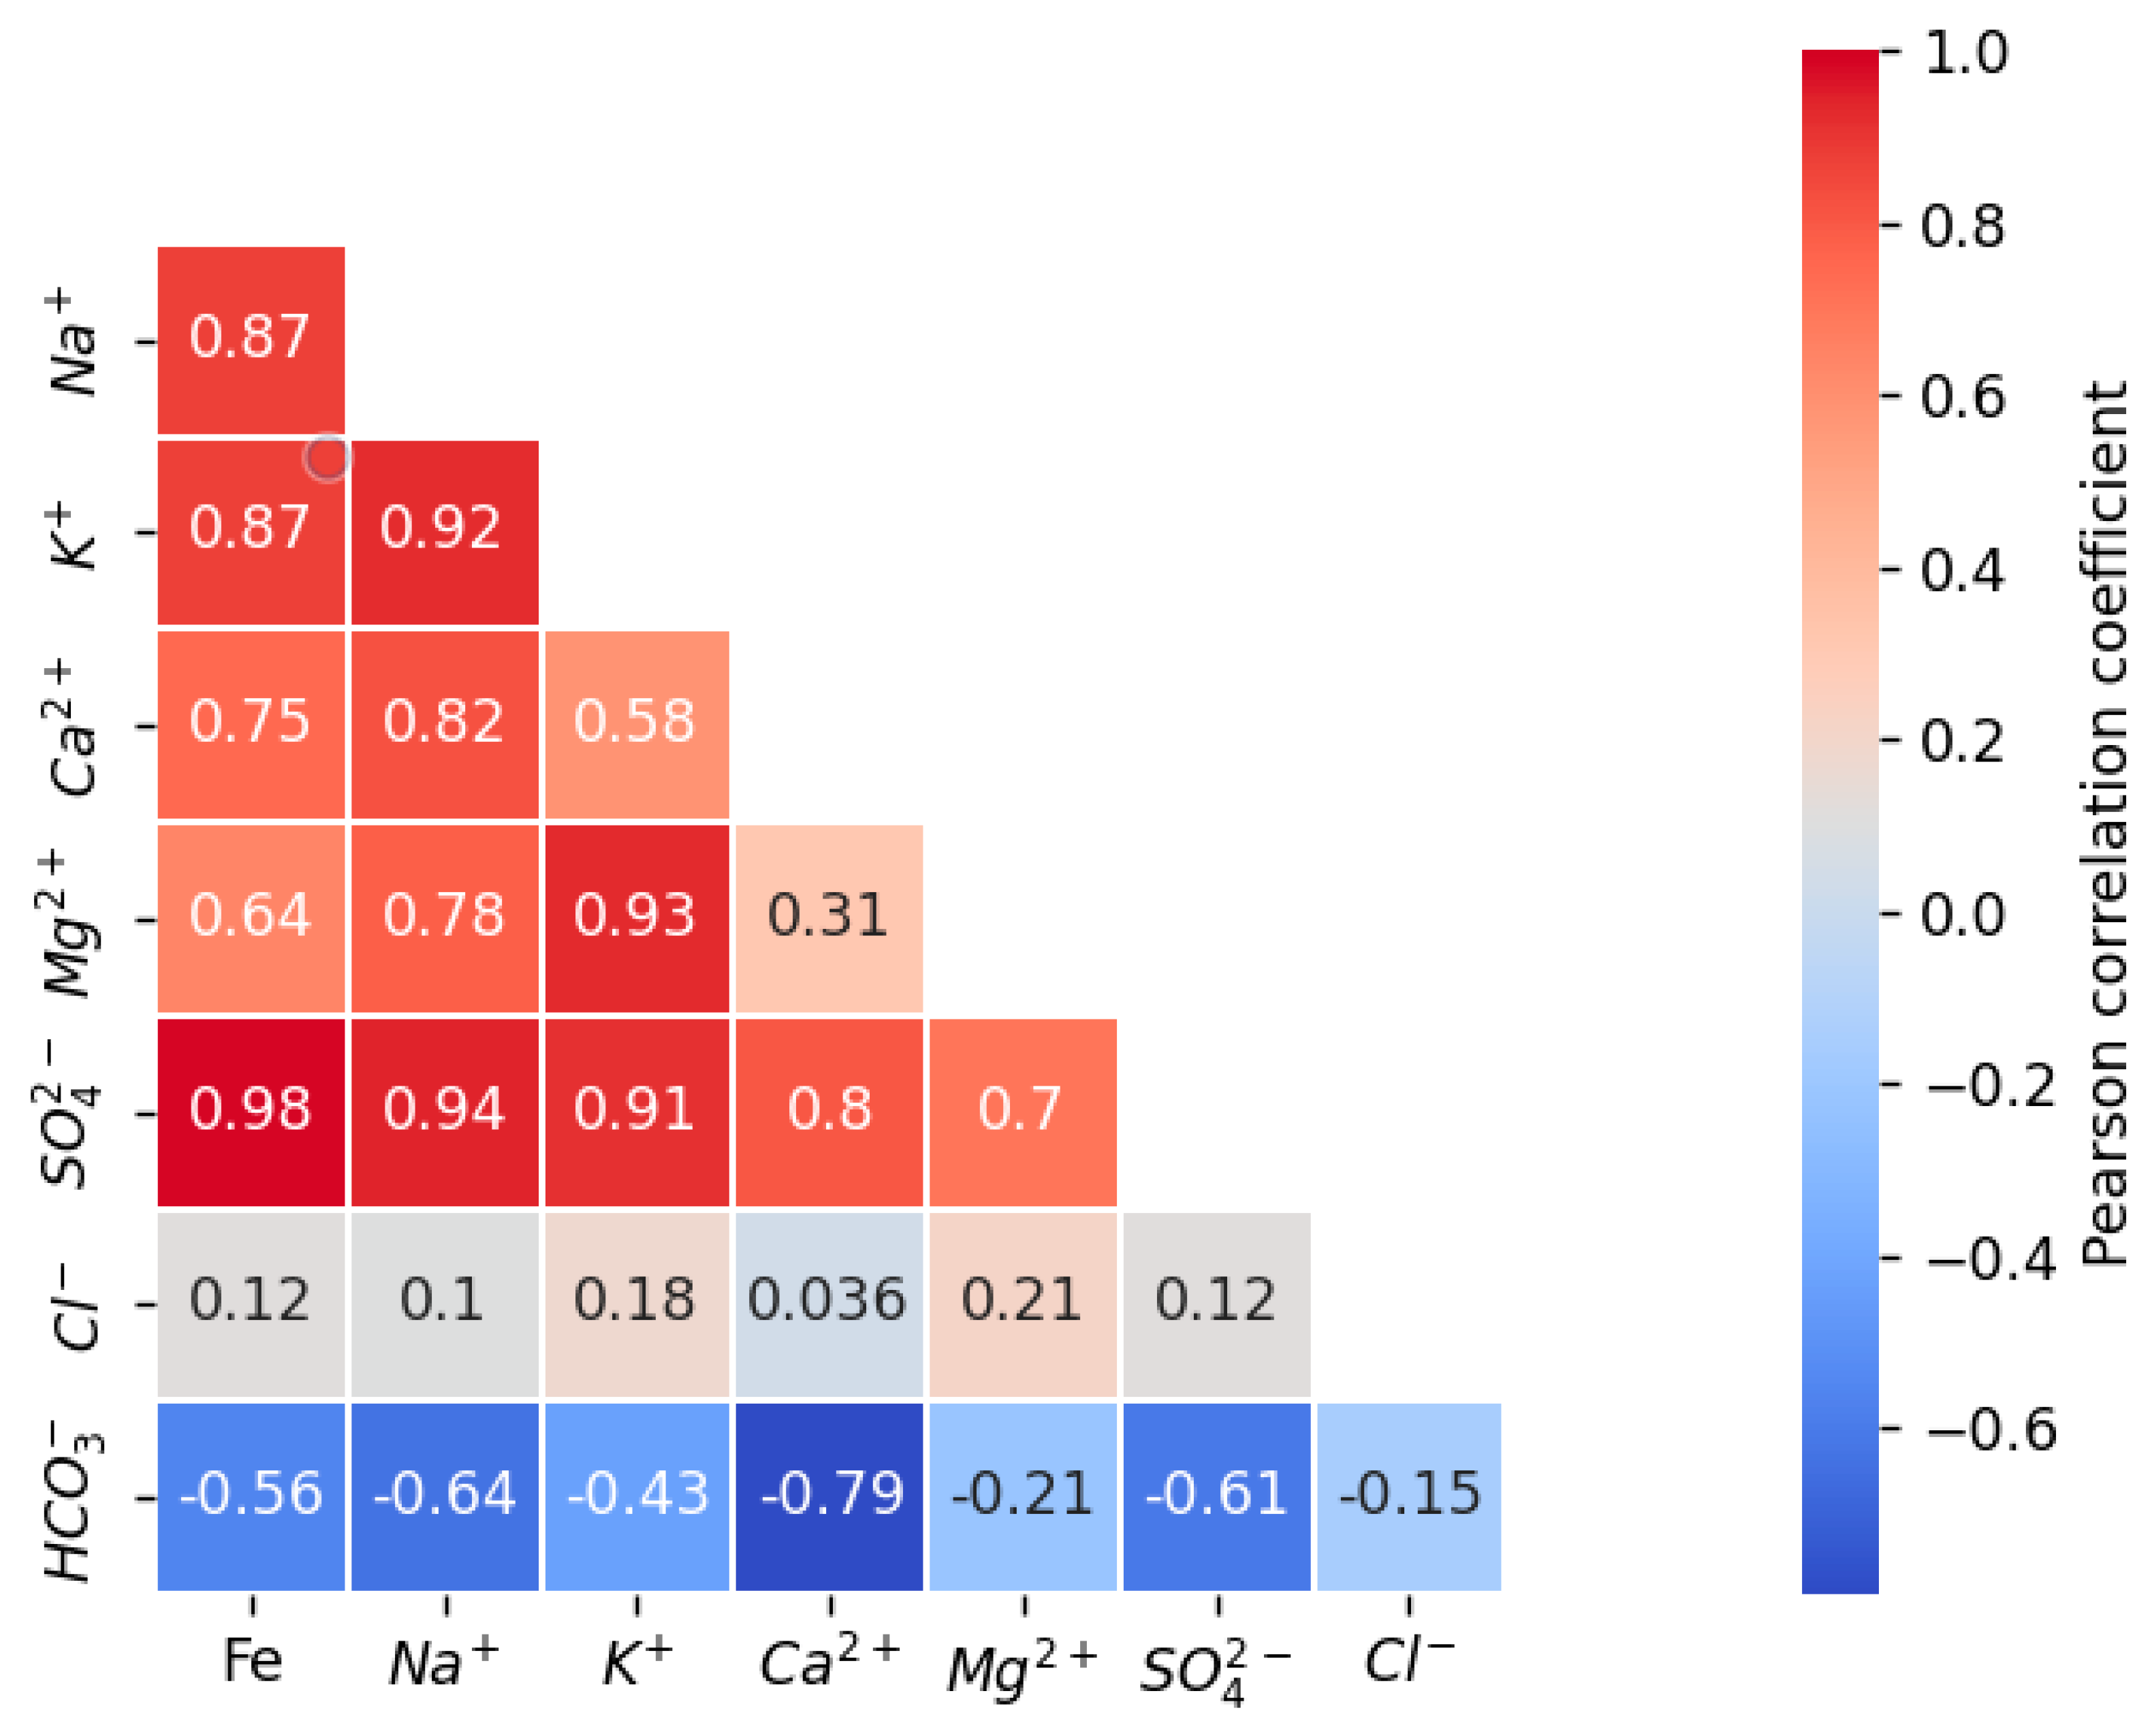
3.2. Pearson’s Correlations between Pairs of Parameters

The Pearson’s correlations that were obtained between pairs of parameters are visually presented in Figure 4. Correlation analysis revealed several noteworthy associations. For instance, the correlation between K+ content and SO42− is notably high, registering at 0.91. This strong correlation suggests that K+ likely originates from sulfuric acid injected into the ore-bearing aquifer, leading to the dissolution of minerals containing potassium. Similarly, the correlation between Na+ content and SO42− is even stronger, with a correlation coefficient of 0.94. This indicates that Na+ likely stems from the sulfuric acid injections into the ore-bearing aquifer, leading to the dissolution of minerals containing sodium. Furthermore, the correlation between Ca2+ content and SO42− is particularly high, with a correlation coefficient of 0.8, signifying that Ca2+ is likely a product of sulfuric acid injections, which dissolve minerals containing calcium. The correlation coefficient between the concentration of Fe and SO42− is strongest, which can reach 0.98. Such a high correlation coefficient indicates that the source of Fe in the sample well is mainly produced by sulfuric acid-dissolved iron minerals.
Interestingly, K+, Na+, and Ca2+ exhibit strong correlations with SO42−, but they have weaker correlations with Cl. This pattern can be attributed to the substantial injection of sulfuric acid in the mining area, which dissolves a variety of minerals within the confined aquifer. This evidence indicates that the chemical composition of water at the observation points is significantly influenced by mining activities, establishing a robust relationship between water chemistry and mining operations.

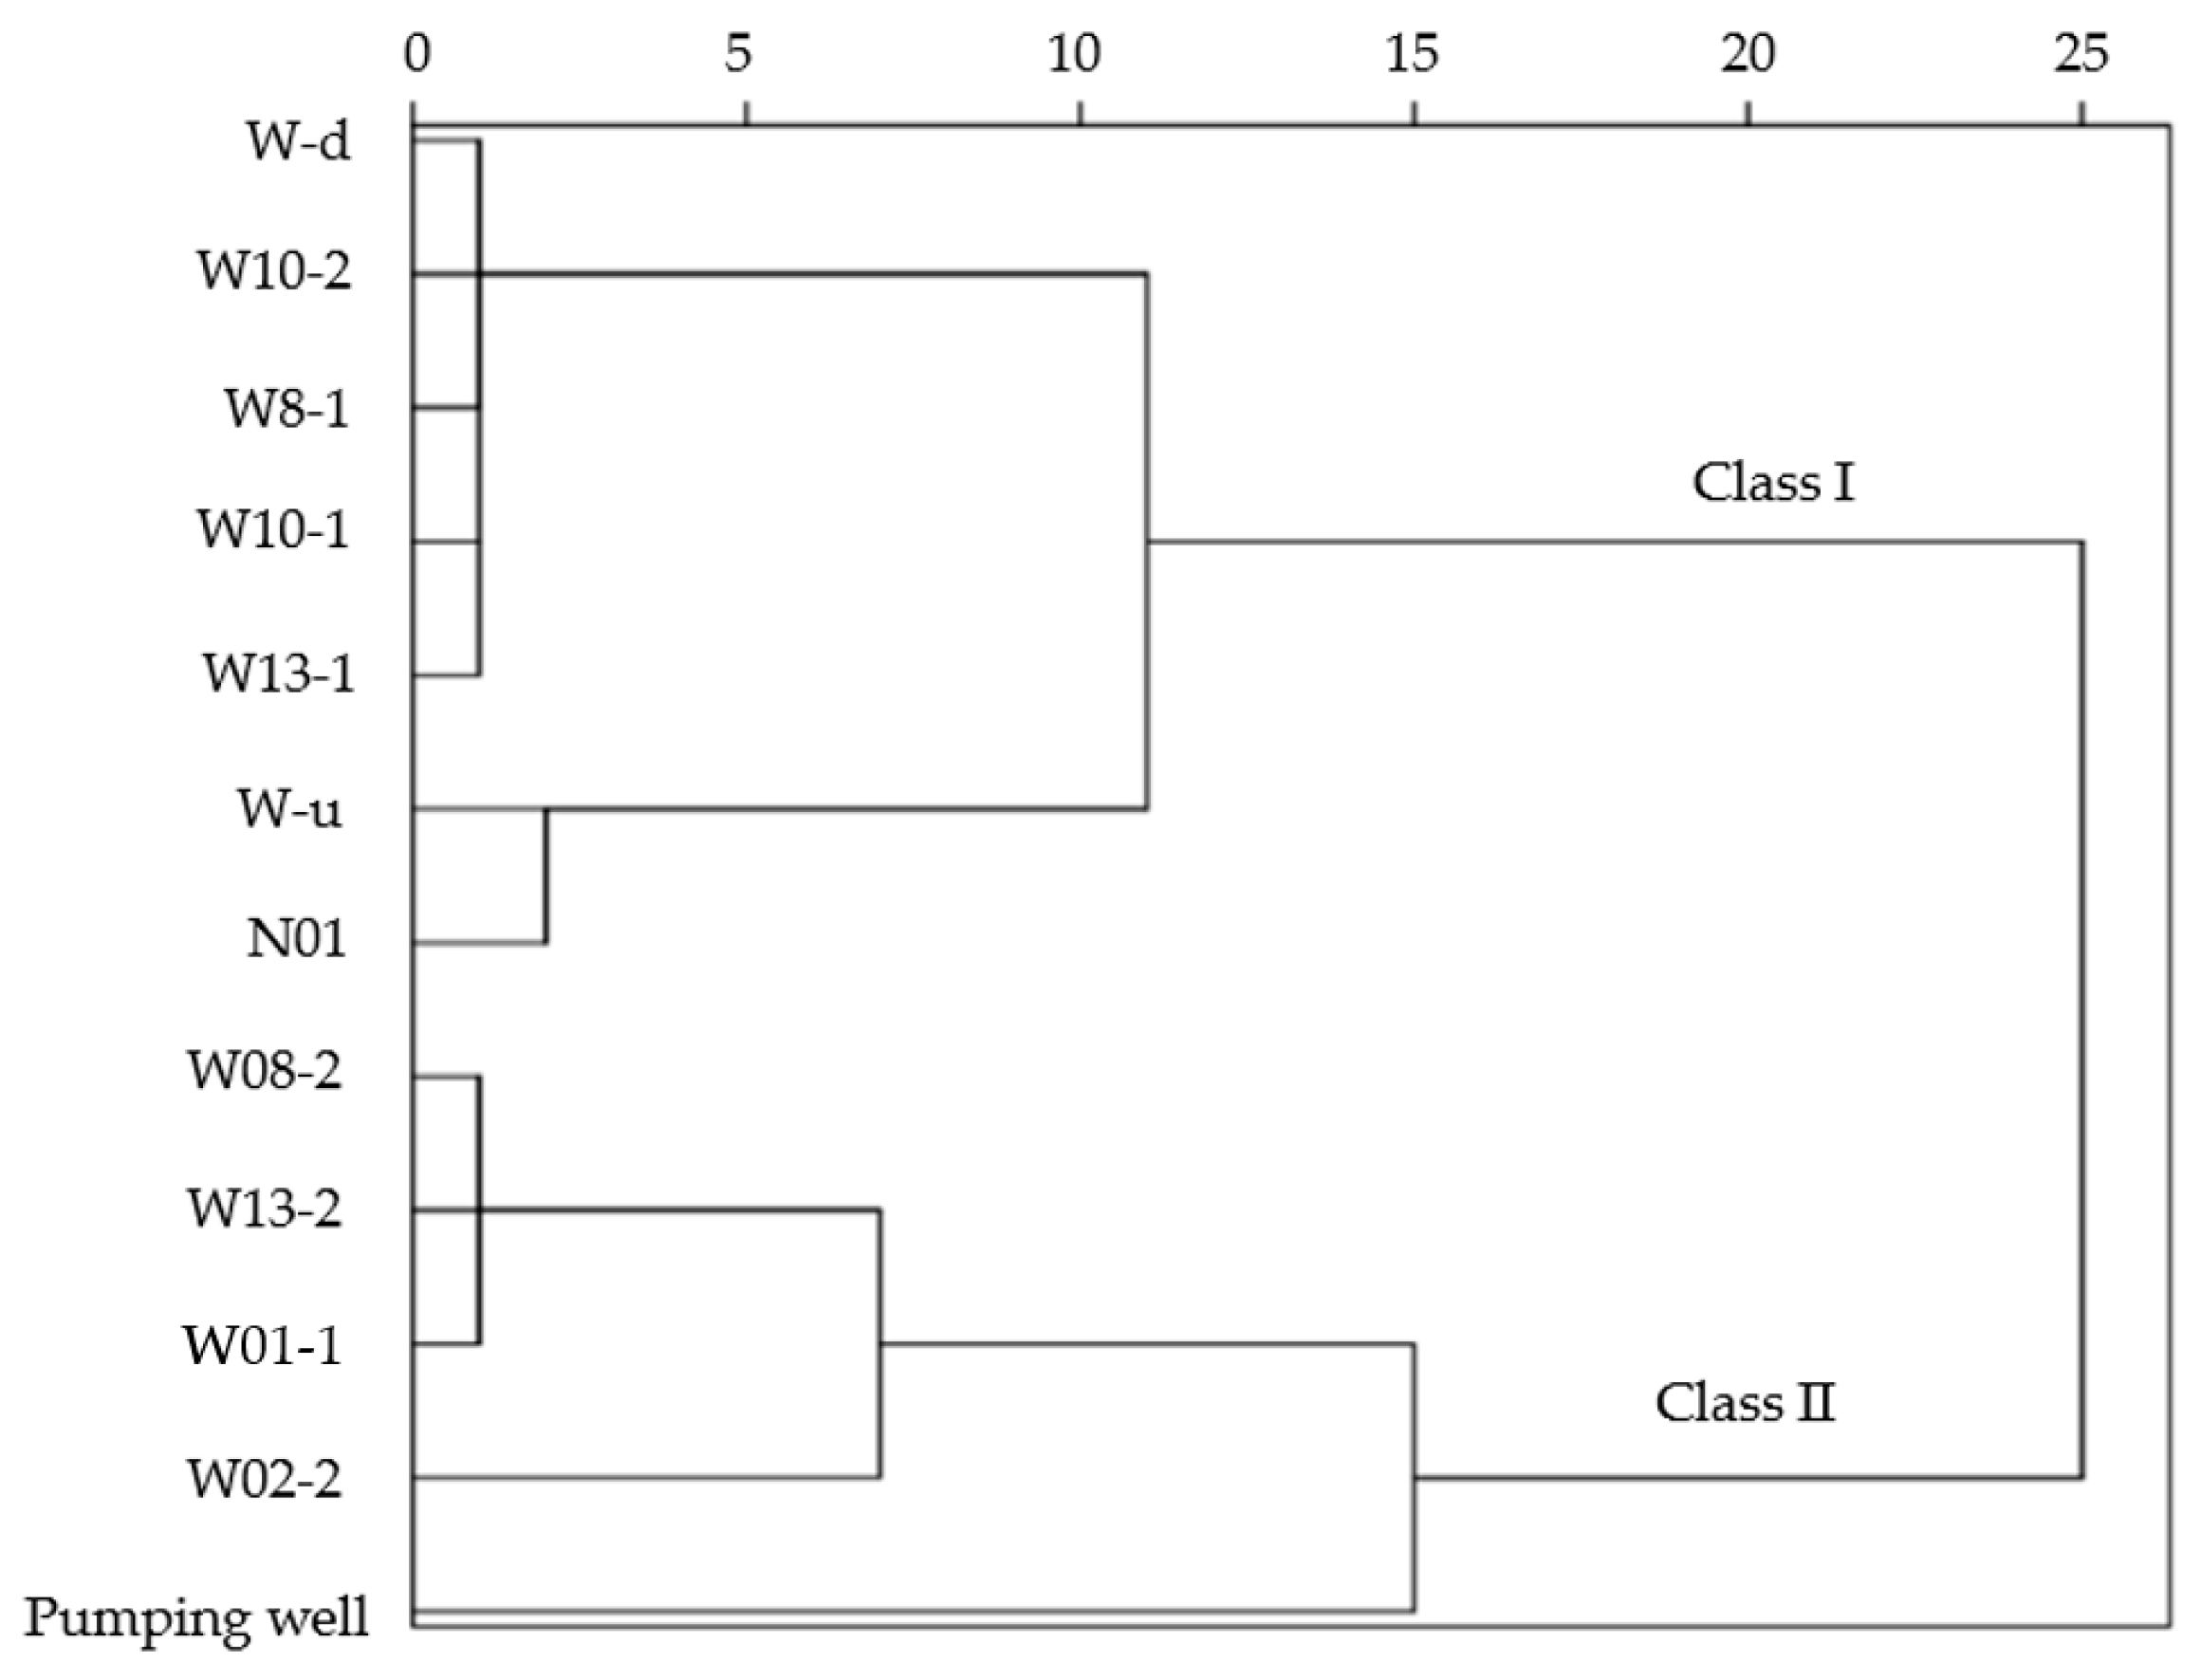
3.3. Classified Two Clusters and Their Main Differences

HCA yielded a pedigree diagram, as shown in Figure 5. This dendrogram reveals distinct groupings among the water samples, highlighting their similarities. Ultimately, all the samples are categorized into two classes: class I and class II. Specifically, cluster Class I includes the water samples of W-u, N01, W-d, W10-2, W08-1, W10-1, and W13-1. Cluster Class II contains five samples, i.e., W08-2, W13-2, W01-1, W02-2, and the pumping well.
Hierarchical Cluster Analysis (HCA) classifies the samples into two distinct classes, Class I and Class II. To understand the influence of different hydrochemical indicators on the differentiation of these categories, decision tree analysis was employed in this study. The decision tree graph presented in Figure 6 provides valuable insights into the most influential factors affecting water sample categorization. It is evident from the decision tree analysis that the foremost and most significant factor influencing water sample types is the concentration of SO42−. This high correlation with SO42− can be attributed to the substantial injection of sulfuric acid solution into the lower layers during the in situ leaching of uranium. Given the considerable volume of sulfuric acid used, the decision tree analysis results appropriately highlight this factor as the most crucial one in categorizing the water samples.
The second most influential factor is the concentration of Ca2+, which arises from the dissolution of a multitude of carbonate minerals in the geological formation. A comparison of the statistical characteristics of water sample concentrations (as seen in Table 1) shows that the Ca2+ concentration is notably higher than that of Mg2+. Hence, during the in situ leaching of uranium, the dissolution of carbonate minerals is more likely to stem from calcite. By employing a two-layer decision tree depth, all the samples can be accurately categorized. This underscores the significant impact of in situ uranium leaching on the groundwater environment near the sampling points, as indicated by the decision tree analysis.
Considering the limited size of the dataset in this study, comprising only 12 samples, it is possible that the above observations reflected by the decision tree in this study may not be reasonable. We anticipate that, with the progression of mining activities, there will be a more substantial accumulation of data, enabling future research to delve deeper into the complexities of the subject matter.

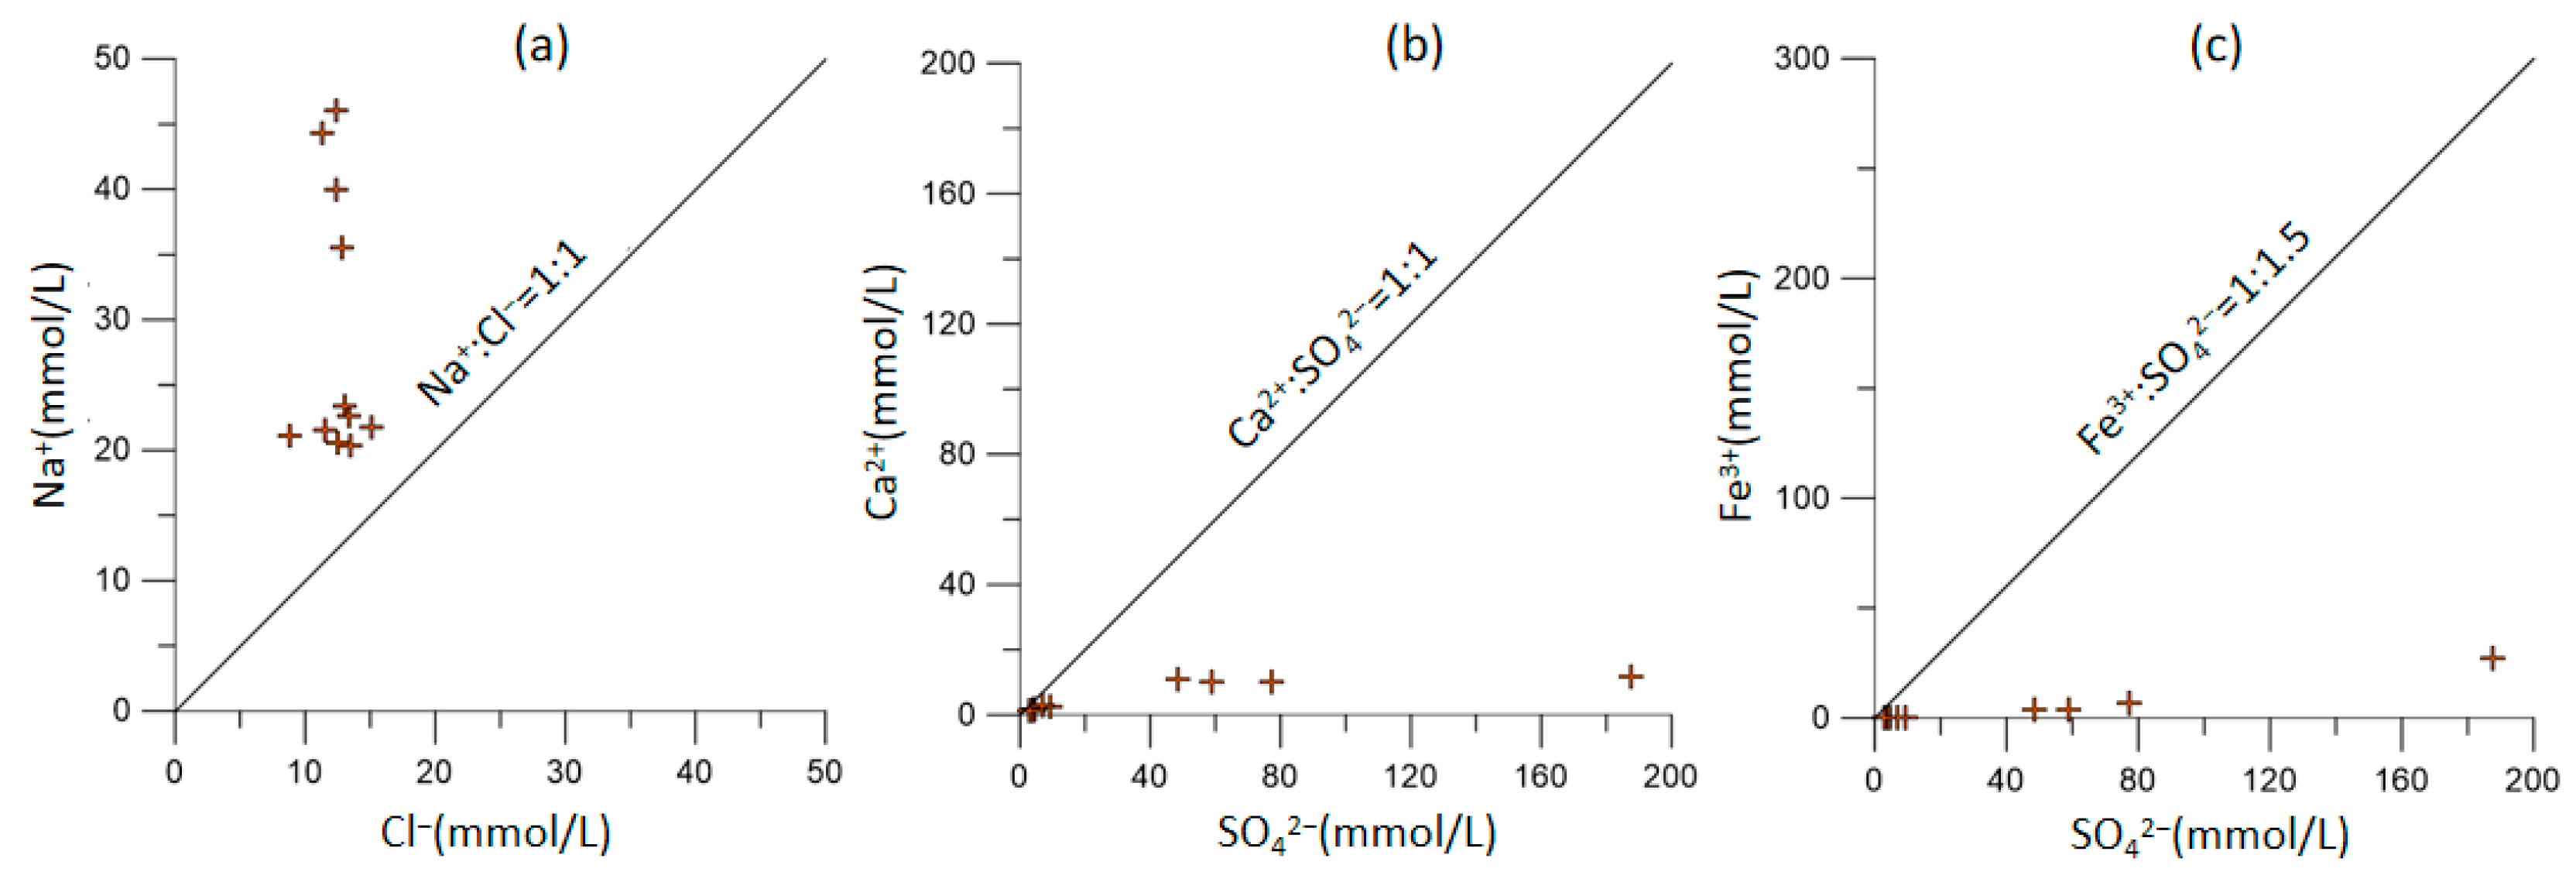
3.4. Hydrogeochemical Process Governing the Hydrogeochemistry

Water–rock interaction plays a pivotal role in shaping the chemical composition of groundwater in the research area. The correlation among the main ions sheds light on the type of water–rock interaction occurring in groundwater circulation. If the Na+ and Cl originate from halite dissolution, the mole ratio of N a + / C l is 1, as can be deduced using the following equation:
N a C l = N a + + C l
Figure 7a shows that the molecular ratio of N a + / C l in this study exceeds 1. This observation aligns with the regional geological conditions and the nature of minerals in the area. The elevated N a + / C l ratio is a strong indicator of the substantial dissolution of sodium feldspar minerals, which releases N a + ions into the groundwater, as can be deduced using the following equation:
2 N a A l S i 3 O 8 + H 2 S O 4 + 9 H 2 O 2 N a + + S O 4 2 + A l 2 S i 2 O 5 O H 4 + 4 H 4 S i O 4
Figure 7b shows that the molecular ratio of C a + / S O 4 2 . The injection of acid in the research area leads to the dissolution of minerals like dolomite and calcite. The concentration of C a 2 + in the research area is primarily a result of calcite dissolution, as can be deduced using the following equation:
C a C O 3 + H 2 S O 4 C a S O 4 + C O 2 + H 2 O
Most of the samples exhibited an excess of S O 4 2 , which can be attributed to the dissolution of sulfate. Additionally, the presence of M g 2 + is likely derived from the dissolution of dolomite, as can be deduced using the following equation:
C a M g ( C O 3 ) 2 + 2 H 2 S O 4 C a S O 4 + M g 2 + + S O 4 2 + 2 C O 2 + 2 H 2 O
In addition, a large number of silicate minerals dissolve and also produce quartz precipitation, as can be deduced using the following equation:
H 4 S i O 4 S i O 2 + 2 H 2 O
Figure 7c shows that the molecular ratio of 2 F e 3 + / S O 4 2 . There is a large number of iron elements in the water sample, mainly due to the dissolution of hematite, as can be deduced using the following equation:
F e 2 O 3 + 3 H 2 S O 4 2 F e 3 + + 3 S O 4 2 + 3 H 2 O
Figure 7 clearly illustrates that the concentration of sulfate ions ( S O 4 2 ) surpasses that of many metal cations in the groundwater samples. This striking pattern indicates that in situ uranium leaching indeed had a profound impact on the groundwater quality at the observation hole. The elevated concentration of sulfate ions is a strong indicator of the substantial influence of mining activities on the chemical composition of the groundwater in this area.

3.5. Saturation Indices of Ca- and Fe-Related Minerals

The groundwater in the mining area exhibits high levels of calcium (Ca) and iron (Fe). These minerals, with their complex dissolution and precipitation characteristics, play a significant role in altering the water quality during the mining process. Additionally, the precipitation of these minerals can potentially block the pore channels within the ore layer, thereby affecting mining efficiency. To investigate these potential impacts, the saturation indexes of various minerals, including anhydrite (CaSO4), calcite (CaCO3), dolomite (CaMg(CO3)2), gypsum (CaSO4•2H2O), Fe(OH)3, goethite (FeOOH), hematite (Fe2O3), siderite (FeCO3), and melanterite (FeSO4•7H2O), were analyzed based on the mineral characteristics of the aquifer and the chemical properties of the groundwater.
The results of this analysis reveal distinct saturation index characteristics for calcium and iron minerals. Table 2 illustrates the saturation index characteristics of calcium-containing minerals. The saturation index of calcite and dolomite can be categorized into these two groups:
In the case of the four sample points, W08-1, W10-1, W10-2, and W13-1, the saturation index of calcite is close to zero, while the saturation index of dolomite is greater than zero. This suggests a trend of stronger dissolution for calcite at these points.
Conversely, for the four sample wells, W01-1, W02-2, W08-2, and W13-2, the saturation index of both calcite and dolomite is less than zero, indicating that both minerals are in a dissolved state at these locations.
It is particularly noteworthy that a comparison of the saturation indexes between the sample wells of W08-1 and W08-2, as well as W13-1 and W13-2, reveals a gradual outward expansion of acid injection. In the inner observation well, dolomite dissolves throughout, and it gradually precipitates as the acid migrates outward and is consumed toward the outer sample well.
As for anhydrite, the saturation index for all the samples is less than zero, indicating that anhydrite is in an unsaturated state. However, the saturation index varies among the samples, with the values for W08-1, W10-1, W10-2, and W13-1 being notably lower than those for W01-1, W02-2, W08-2, and W13-2. At W08-1, W10-1, W10-2, and W13-1, where the saturation index is less than zero, gypsum is implied to be in a dissolved state. Conversely, at W01-1, W02-2, W08-2, and W13-2, where the saturation index of gypsum is greater than zero, gypsum is indicated to be in a precipitated state. These findings shed light on the dynamic interactions between minerals and groundwater in the mining area.
The saturation index of iron-bearing minerals is different from that of calcium-bearing minerals, as shown in Table 3. At sample wells W08-1, W10-1, W10-2, W08-2, and W13-2, the saturation index of iron-bearing minerals is relatively small, while at sample wells W01-1, W02-2, W08-2, and W13-2, the saturation index of iron-bearing minerals is relatively large.
The saturation index distribution of Fe(OH)3 is depicted in Table 3. Based on the calculated results, it is evident that the saturation index of Fe(OH)3 in most samples is greater than zero. This signifies that the precipitation of Fe(OH)3 is likely to occur near the mining area, potentially leading to formation blockages within the mining area. The high saturation index of Fe(OH)3 can be attributed to the elevated iron (Fe) content in the water samples from the mining area.
Among the eight wells, the maximum saturation index of Fe(OH)3 was observed at sample point W01-1, while the minimum saturation index was recorded at W10-1. It is notable that the saturation index was higher at five sample wells: W01-1, W02-2, W08-2, W13-2, and W10-2, whereas it was lower at three sample wells: W08-1, W10-2, and W13-1. This trend indicates that the closer the sample well is to the mining area, the greater the saturation index of Fe(OH)3, making it more prone to precipitation. Conversely, as the groundwater containing iron migrates to sample wells located farther from the mining area, the iron content significantly diminishes, resulting in a lower saturation index.
In the case of hematite, it is in a precipitated state in all the samples, consistent with the high iron content in the observation wells. The saturation index of hematite in the inner observation wells is higher than in the outer observation wells. This difference is due to the proximity of the inner observation wells to the mining area, where the leaching solution has a higher iron content. As the leaching solution migrates to the peripheral observation wells, the iron content decreases, leading to a lower hematite saturation index.
The saturation index distribution of goethite also suggests that the precipitation of goethite is likely near the mining area, which could cause formation blockages. This phenomenon is attributed to the high iron content in the water samples from the mining area. The saturation index of goethite in most samples is greater than zero, with values ranging between 4 and 11. As with other iron-bearing minerals, the closer the observation point is to the mining area, the greater the saturation index of goethite, making it more prone to precipitation.
As for siderite (FeCO3) and melanterite (FeSO4•7H2O), the saturation index indicates their dissolution or precipitation states at different sample points. Specifically, (1) the saturation index of siderite at the four points W08-1, W10-1, W10-2, and W13-1 is less than zero, indicating a dissolved state; and (2) conversely, at the four points W01-1, W02-2, W08-2, and W13-2, the saturation index of siderite is greater than zero, signifying a precipitated state.
The saturation index of melanterite (FeSO4•7H2O) follows a similar pattern: at the four sample wells W08-1, W10-1, W10-2, and W13-1, the saturation index is less than zero, indicating a dissolved state, while at the four sample wells W01-1, W02-2, W08-2, and W13-2, the saturation index of melanterite is greater than zero, suggesting a precipitate state.
The comparison of the saturation indces of each sampling point reveals distinct hydrochemical behaviors for iron-bearing and calcium-bearing minerals. In particular, (1) calcium-bearing minerals tend to dissolve first and then precipitate, as indicated by the saturation index patterns. This suggests that the dissolution of calcium-bearing minerals occurs near the mining area, followed by the precipitation of these minerals. The acid leaching solution used in in situ uranium leaching influenced the dissolution and precipitation of calcium-bearing minerals; and (2) most iron-bearing minerals exhibit a tendency to gradually precipitate. The patterns of saturation indices for iron-bearing minerals suggest that their precipitation is more widespread and occurs more gradually. The acid leaching solution also impacted the dissolution and precipitation of iron-bearing minerals but in a different manner compared to calcium-bearing minerals.
These findings emphasize the complex interactions between mineral dissolution and precipitation in response to the in situ uranium leaching process, highlighting the importance of understanding these processes for both water quality management and mining efficiency optimization.

4. Conclusions

This study provides a comprehensive analysis of the hydrogeochemical characteristics of groundwater in in situ uranium mining areas. Key findings and insights from the study include, as follows:
(1)
This study highlights that the concentrations of SO42− and total dissolved solids (TDS) are notably high in the groundwater samples. This suggests that the increased salinity in groundwater is primarily attributed to the dissolution of minerals, such as potassium feldspar, sodium feldspar, and calcite in the aquifer, due to the presence of sulfuric acid in the leaching solution. This confirms the significant impact of in situ uranium leaching on groundwater quality.
(2)
Correlation analysis indicates a strong positive correlation between key ions such as K+, Na+, Ca2+, and SO42−. This underscores the fact that the leaching solution injected during in situ uranium leaching, which contained substantial sulfuric acid, led to a significant dissolution of minerals and subsequent increases in the concentration of conventional metal cations in groundwater.
(3)
The clustering of water samples into two major categories reflects the differential influence of in situ uranium leaching on the surrounding groundwater environment. Samples located closer to the mining area exhibited distinct hydrogeochemical characteristics compared to those located further away. This observation indicates that the proximity to the mining area and the groundwater background flow patterns are pivotal factors influencing the groundwater’s response to uranium leaching. The outcomes of two representative path analyses further substantiate this perspective.
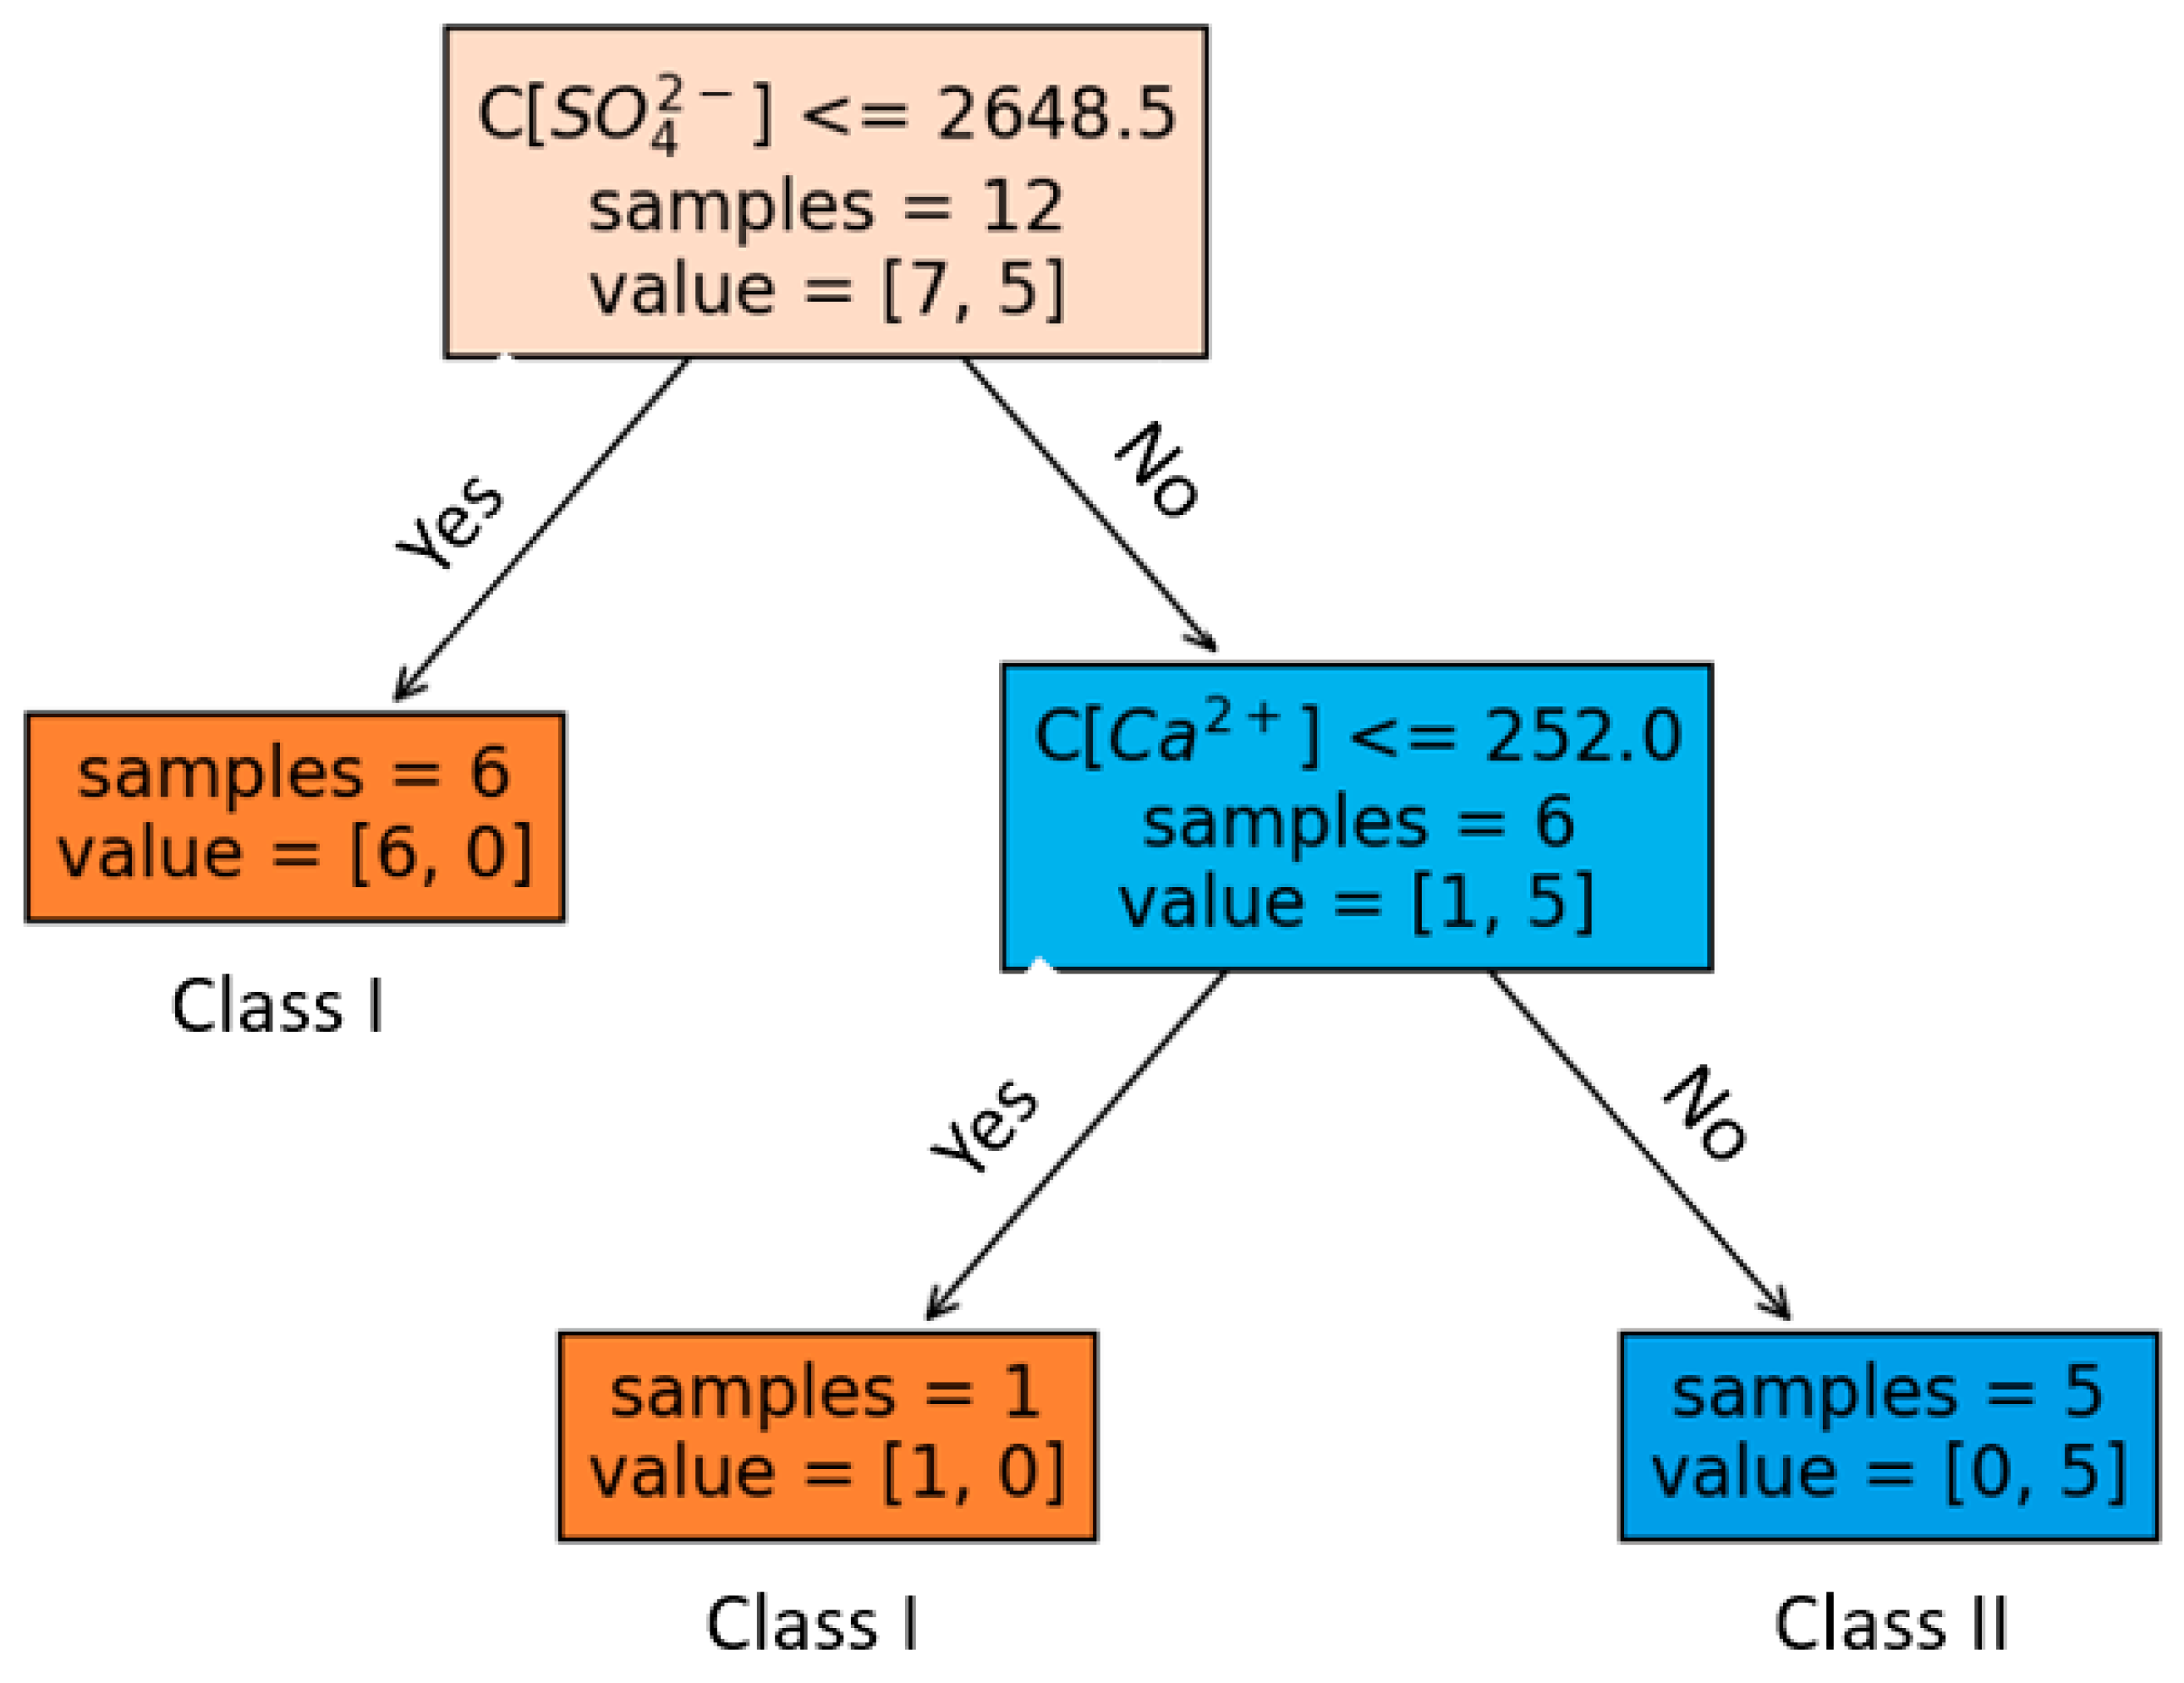
(4)
Decision tree analysis identifies SO42− as the most influential factor, followed by Ca2+. These results provide valuable insights for the classification and prediction of water samples based on their hydrogeochemical characteristics.
(5)
The study of mineral saturation indices reveals that calcium-bearing minerals tend to dissolve near the mining area and then precipitate. By contrast, iron-bearing minerals tend to precipitate more gradually. These observations indicate the complex interactions between mineral dissolution and precipitation, emphasizing the impact of in situ uranium leaching on mineral reactions in the aquifer.
In summary, this study demonstrates the significant influence of in situ uranium leaching on groundwater quality in the mining area. It also highlights the role of proximity to the mining area and geological features in controlling the impact of leaching activities. Understanding these hydrogeochemical processes is crucial for effective groundwater management and optimizing mining practices.

Author Contributions

Conceptualization, D.X. and X.Y.; methodology, D.X. and X.Y.; formal analysis, H.L.; investigation, H.L. and M.L.; data curation, H.L.; writing—original draft preparation, H.L.; writing—review and editing, M.L., T.J., D.X., X.Y., Z.T., and J.Y.; visualization, H.L. All authors have read and agreed to the published version of the manuscript.

Funding

This work was supported by NSFC project under grant u1911205, the Chemical Metallurgy research Institute under grant A60-3, the Northwest A&F University under grant 00800-Z1090122049, and the Key Laboratory of Urban Geology and Underground Space Resources Ministry of Natural Resources under grant BHKF2021Z10.

Data Availability Statement

The data used in this study are available upon reasonable request from the corresponding authors.

Acknowledgments

The authors are grateful for the contributions of three anonymous reviewers, whose inputs significantly enhanced the quality of this manuscript. The editors are also thanked for their valuable comments in improving the quality of the manuscript. This work is supported partially by the Beijing Research Institute of Chemical Engineering and Metallurgy. The authors would like to thank Jili Wen from the Beijing Research Institute of Chemical Engineering and Metallurgy for advising this work.

Conflicts of Interest

The authors declare no conflict of interest.

References

  1. Hu, Y.; Zhang, F.; Niu, Z.; Dong, Z.; Liu, G.; Gao, L. Hydro-chemical characteristics of groundwater in centralized drinking water sources and its quality assessment in northern Anhui Province. J. Univ. Sci. Technol. China 2014, 44, 913–920+925. [Google Scholar]
  2. Wu, A.; Jin, J.; Song, B. Water Safety Issues of China and Ensuring Roles of Groundwater. Acta Geol. Sin. 2016, 90, 2939–2947. [Google Scholar]
  3. Sun, C.; Chen, R.; Zhang, Z.; Li, W.; Chen, W. Temporal and spatial variation of hydrochemical characteristics of shallow groundwater in Shanxi Province. Arid. Land. Geogr. 2018, 41, 314–324. [Google Scholar]
  4. Aliewi, A.; Imseih, N.; Abdulghafour, D. Protecting the Groundwater Environment of Tulkarem City of Palestine from Industrial and Domestic Pollution. J. Environ. Prot. 2013, 04, 27–39. [Google Scholar] [CrossRef]
  5. Dhillon, M.S.; Kaur, S.; Aggarwal, R. Delineation of critical regions for mitigation of carbon emissions due to groundwater pumping in central Punjab. Groundw. Sustain. Dev. 2019, 8, 302–308. [Google Scholar] [CrossRef]
  6. Kaur, S.; Aggarwal, R.; Lal, R. Assessment and Mitigation of Greenhouse Gas Emissions from Groundwater Irrigation. Irrig. Drain. 2016, 65, 762–770. [Google Scholar] [CrossRef]
  7. Sha, C.; Wu, J.; Shen, C.; Wu, J.; Yan, Z.; Wang, M. The ecology of bacterial communities in groundwater of industrial areas: Diversity, composition, network, and assembly. Environ. Pollut. 2023, 322, 121207. [Google Scholar] [CrossRef]
  8. Nsabimana, A.; Li, P. Hydrogeochemical characterization and appraisal of groundwater quality for industrial purpose using a novel industrial water quality index (IndWQI) in the Guanzhong Basin, China. Geochemistry 2023, 83, 125922. [Google Scholar] [CrossRef]
  9. Mudd, G.M. The future of Yellowcake: A global assessment of uranium resources and mining. Sci. Total Environ. 2014, 472, 590–607. [Google Scholar] [CrossRef]
  10. Zeng, S.; Song, J.; Sun, B.; Wang, F.; Ye, W.; Shen, Y.; Li, H. Experimental and theoretical study on the seepage mechanism characteristics coupling with confining pressure. Nucl. Eng. Technol. 2023, 55, 566–574. [Google Scholar] [CrossRef]
  11. Cary, L.; Petelet-Giraud, E.; Bertrand, G.; Kloppmann, W.; Aquilina, L.; Martins, V.; Hirata, R.; Montenegro, S.; Pauwels, H.; Chatton, E.; et al. Origins and processes of groundwater salinization in the urban coastal aquifers of Recife (Pernambuco, Brazil): A multi-isotope approach. Sci. Total Environ. 2015, 530, 411–429. [Google Scholar] [CrossRef]
  12. Pittalis, D.; Carletti, A.; Ghiglieri, G.; Celico, F. The influence of hydrogeological properties, seawater intrusion and refreshening on the quality of groundwater used for irrigation in an agricultural coastal plain in North Sardinia, Italy. Environ. Earth Sci. 2016, 75, 963. [Google Scholar] [CrossRef]
  13. Ilankoon, I.M.S.K.; Tang, Y.; Ghorbani, Y.; Northey, S.; Yellishetty, M.; Deng, X.; McBride, D. The current state and future directions of percolation leaching in the Chinese mining industry: Challenges and opportunities. Miner. Eng. 2018, 125, 206–222. [Google Scholar] [CrossRef]
  14. Hague, N.; Norgate, T. The greenhouse gas footprint of in-situ leaching of uranium, gold and copper in Australia. J. Clean. Prod. 2014, 84, 382–390. [Google Scholar] [CrossRef]
  15. Islam, A.R.; Ahmed, N.; Bodrud-Doza, M.; Chu, R. Characterizing groundwater quality ranks for drinking purposes in Sylhet district, Bangladesh, using entropy method, spatial autocorrelation index, and geostatistics. Environ. Sci. Pollut. Res. Int. 2017, 24, 26350–26374. [Google Scholar] [CrossRef]
  16. Bradshaw, P.; Lett, R. Geochemical-exploration for uranium using soils. J. Geochem. Explor. 1980, 13, 305–319. [Google Scholar] [CrossRef]
  17. Li, P.; Wu, J.; Qian, H. Hydrogeochemistry and quality assessment of shallow groundwater in the southern part of the Yellow River alluvial plain (Zhongwei Section), northwest China. Earth Sci. Res. J. 2014, 18, 27–38. [Google Scholar] [CrossRef]
  18. Qian, C.; Wu, X.; Mu, W.P.; Fu, R.Z.; Zhu, G.; Wang, Z.R.; Wang, D.D. Hydrogeochemical characterization and suitability assessment of groundwater in an agro-pastoral area, Ordos Basin, NW China. Environ. Earth Sci. 2016, 75, 1356. [Google Scholar] [CrossRef]
  19. He, T.; Liu, J.; Yang, Y.; Yao, G.; Xing, Y.; Hu, P.; Wang, R.; Liang, D.; Wang, X.; Zhang, F. Tracer Test of Groundwater in In-situ Leaching Area of Bayanwula Uranium Mine in Inner Mongolia. Nonferrous Met. (Extr. Metall.) 2022, 11, 54–63. [Google Scholar]
  20. Chang, Y.X.; Tan, K.X.; Zhang, C.; Yao, Y.X.; He, C.Y.; Liu, Y. Simulation study on groundwater dynamics control of leaching range of in-situ uranium well field. J. Univ. South China (Sci. Technol.) 2020, 34, 29–36. [Google Scholar]
  21. Wang, B.; Luo, Y.; Liu, J.H.; Li, X.; Zheng, Z.H.; Chen, Q.Q.; Li, L.Y.; Wu, H.; Fan, Q.R. Ion migration in in-situ leaching (ISL) of uranium: Field trial and reactivetransport modelling. J. Hydrol. 2022, 615, 128634. [Google Scholar] [CrossRef]
  22. Biddau, R.; Cidu, R.; Lorrai, M.; Mulas, M.G. Assessing background values of chloride, sulfate and fluoride in groundwater: A geochemical-statistical approach at a regional scale. J. Geochem. Explor. 2017, 181, 243–255. [Google Scholar] [CrossRef]
  23. Huang, G.; Liu, C.; Sun, J.; Zhang, M.; Jing, J.; Li, L. A regional scale investigation on factors controlling the groundwater chemistry of various aquifers in a rapidly urbanized area: A case study of the Pearl River Delta. Sci. Total Environ. 2018, 625, 510–518. [Google Scholar] [CrossRef]
  24. Petelet-Giraud, E.; Négrel, P.; Aunay, B.; Ladouche, B.; Bailly-Comte, V.; Guerrot, C.; Flehoc, C.; Pezard, P.; Lofi, J.; Dörfliger, N. Coastal groundwater salinization: Focus on the vertical variability in a multi-layered aquifer through a multi-isotope fingerprinting (Roussillon Basin, France). Sci. Total Environ. 2016, 566, 398–415. [Google Scholar] [CrossRef]
  25. Santucci, L.; Carol, E.; Kruse, E. Identification of palaeo-seawater intrusion in groundwater using minor ions in a semi-confined aquifer of the Rio de la Plata littoral (Argentina). Sci. Total Environ. 2016, 566, 1640–1648. [Google Scholar] [CrossRef]
  26. Panaskar, D.B.; Wagh, V.M.; Muley, A.A.; Mukate, S.V.; Pawar, R.S.; Aamalawar, M.L. Evaluating groundwater suitability for the domestic, irrigation, and industrial purposes in Nanded Tehsil, Maharashtra, India, using GIS and statistics. Arab. J. Geosci. 2016, 9, 615. [Google Scholar] [CrossRef]
  27. Zhang, Y.; Xu, M.; Li, X.; Qi, J.; Zhang, Q.; Guo, J.; Yu, L.; Zhao, R. Hydrochemical Characteristics and Multivariate Statistical Analysis of Natural Water System: A Case Study in Kangding County, Southwestern China. Water 2018, 10, 80. [Google Scholar] [CrossRef]
  28. Bam, E.K.P.; Bansah, S. Groundwater chemistry and isotopes reveal vulnerability of granitic aquifer in the White Volta River watershed, West Africa. Appl. Geochem. 2020, 119, 104662. [Google Scholar] [CrossRef]
  29. Ruiz-Pico, Á.; Pérez-Cuenca, Á.; Serrano-Agila, R.; Maza-Criollo, D.; Leiva-Piedra, J.; Salazar-Campos, J. Hydrochemical characterization of groundwater in the Loja Basin (Ecuador). Appl. Geochem. 2019, 104, 1–9. [Google Scholar] [CrossRef]
  30. Argamasilla, M.; Barberá, J.A.; Andreo, B. Factors controlling groundwater salinization and hydrogeochemical processes in coastal aquifers from southern Spain. Sci. Total Environ. 2017, 580, 50–68. [Google Scholar] [CrossRef]
  31. Kim, J.H.; Kim, R.H.; Lee, J.; Cheong, T.J.; Yum, B.W.; Chang, H.W. Multivariate statistical analysis to identify the major factors governing groundwater quality in the coastal area of Kimje, South Korea. Hydrol. Process. 2005, 19, 1261–1276. [Google Scholar] [CrossRef]
  32. Luque-Espinar, J.A.; Chica-Olmo, M. Impacts of Anthropogenic Activities on Groundwater Quality in a Detritic Aquifer in SE Spain. Expo. Health 2020, 12, 681–698. [Google Scholar] [CrossRef]
  33. Wu, J.; Li, P.; Wang, D.; Ren, X.; Wei, M. Statistical and multivariate statistical techniques to trace the sources and affecting factors of groundwater pollution in a rapidly growing city on the Chinese Loess Plateau. Hum. Ecol. Risk Assess. 2020, 26, 1603–1621. [Google Scholar] [CrossRef]
  34. Barzegar, R.; Asghari Moghaddam, A.; Tziritis, E.; Adamowski, J.; Bou Nassar, J.; Noori, M.; Aalami, M.T.; Kazemian, N. Exploring the hydrogeochemical evolution of cold and thermal waters in the Sarein-Nir area, Iran using stable isotopes (δ18O and δD), geothermometry and multivariate statistical approaches. Geothermics 2020, 85, 101815. [Google Scholar] [CrossRef]
  35. Singh, C.K.; Kumar, A.; Shashtri, S.; Kumar, A.; Kumar, P.; Mallick, J. Multivariate statistical analysis and geochemical modeling for geochemical assessment of groundwater of Delhi, India. J. Geochem. Explor. 2017, 175, 59–71. [Google Scholar] [CrossRef]
  36. Kazakis, N.; Mattas, C.; Pavlou, A.; Patrikaki, O.; Voudouris, K. Multivariate statistical analysis for the assessment of groundwater quality under different hydrogeological regimes. Environ. Earth Sci. 2017, 76, 349. [Google Scholar] [CrossRef]
  37. Sappa, G.; Ergul, S.; Ferranti, F. Geochemical modeling and multivariate statistical evaluation of trace elements in arsenic contaminated groundwater systems of Viterbo Area, (Central Italy). SpringerPlus 2014, 3, 237. [Google Scholar] [CrossRef]
  38. Zhang, B.; Li, M.; Li, W.; Zhengwen, J.; Khan, U.; Wang, L.; Wang, F.-Y. Machine learning strategies for lithostratigraphic classification based on geochemical sampling data: A case study in area of Chahanwusu River, Qinghai Province, China. J. Cent. South. Univ. 2021, 28, 1422–1447. [Google Scholar] [CrossRef]
  39. Zhang, S.; Shi, Z.; Wang, G.; Yan, R.; Zhang, Z. Groundwater radon precursor anomalies identification by decision tree method. Appl. Geochem. 2020, 121, 104696. [Google Scholar] [CrossRef]
  40. Chen, W.; Wang, Z.; Wang, G.; Ning, Z.; Lian, B.; Li, S.; Tsangaratos, P.; Ilia, I.; Xue, W. Optimizing Rotation Forest-Based Decision Tree Algorithms for Groundwater Potential Mapping. Water 2023, 15, 2287. [Google Scholar] [CrossRef]
  41. Duan, H.; Deng, Z.; Deng, F.; Wang, D. Assessment of Groundwater Potential Based on Multicriteria Decision Making Model and Decision Tree Algorithms. Math. Probl. Eng. 2016, 2016, 2064575. [Google Scholar] [CrossRef]
  42. Wu, C.; Wu, X.; Qian, C.; Zhu, G. Hydrogeochemistry and groundwater quality assessment of high fluoride levels in the Yanchi endorheic region, northwest China. Appl. Geochem. 2018, 98, 404–417. [Google Scholar] [CrossRef]
  43. Zhang, J. Applied Multivariate Statistical Analysis; Tongji University Press: Shanghai, China, 2016. [Google Scholar]
  44. Li, H. Statistical Learning Method; Tsinghua University Press: Beijing, China, 2011. [Google Scholar]
  45. Jabal, M.S.A.; Abustan, I.; Rozaimy, M.R.; Al-Najar, H. Fluoride enrichment in groundwater of semi-arid urban area: Khan Younis City, southern Gaza Strip (Palestine). J. Afr. Earth Sci. 2014, 100, 259–266. [Google Scholar] [CrossRef]
  46. Parkhurst, D.L.; Appelo, C. Description of Input and Examples for PHREEQC Version 3: A Computer Program for Speciation, Batch-Reaction, One-Dimensional Transport, and Inverse Geochemical Calculations; US Geological Survey: Reston, VA, USA, 2013; pp. 2328–7055. [Google Scholar]
  47. GB/T 14848-2017; General Administration of Quality Supervision. Standard for Groundwater Quality (2017 Edition). Inspection and Quarantine of the People’s Republic of China and Standardization Administration: Beijing, China, 2017.
Figure 1. The location of the study area.
Water 15 04234 g001
Figure 2. A-A’ typical hydrogeological cross section of the study area.
Water 15 04234 g002
Figure 3. The spatial distribution of the general characteristics of (a) Na+, (b) K+, (c) Ca2+, (d) Mg2+, (e) Fe3+, (f) U, (g) SO42−, (h) HCO3, and (i) Cl. Note that well W-d is situated at a distance from the mining area in the lower-left corner.
Water 15 04234 g003
Figure 4. Pearson’s correlation between pairs of parameters.
Water 15 04234 g004
Figure 5. Hierarchical clustering pedigree diagram.
Water 15 04234 g005
Figure 6. The decision tree on the two HCA clusters of the 12 groundwater samples.
Water 15 04234 g006
Figure 7. Binary plots of the molar concentrations of (a) Na+ versus Cl, (b) Ca2+ versus SO42−, and (c) Fe3+ versus SO42−.
Water 15 04234 g007
Table 1. General characteristics of groundwater quality at observation wells of the study area. All the units are in mg/L, except for uranium (U) units, which are in ug/L.
ParameterMaxMinAverageStandard DeviationPermissible Limits *
Total Fe15300.63217.05454.770.3
Na+1060470663.82238.44200
K+1625.5530.8046.05/
Ca2+47253.2204.84177.84/
Mg2+94.800.3336.4132.35/
U30.11.1612.1810.75/
SO42−180002693556.825434.31250
HCO3111035358.27322.95/
CI536312440.9155.76250
TDS2520013406011.827258.671000
Note: * Permissible limits are taken from the Standards for Drinking Water Quality of China (2017 Edition) [47].
Table 2. Saturation index analysis of calcium minerals.
ClusterSampleSI (Anhydrite)SI (Calcite)SI (Dolomite)SI (Gypsum)
Class IW-d−1.73−1.45−3.02−1.22
W-u−0.143.15.260.33
W08-1−1.921.382.57−1.41
W10-1−1.911.382.54−1.4
W10-2−1.391.472.88−0.88
W13-1−1.451.542.76−0.96
N01−1.980.470.9−1.5
Class IIW01-1−0.390.45−1.830.11
W02-2−0.2−0.48−3.50.3
W08-2−0.40.24−2.550.11
W13-2−0.360.01−2.670.13
Table 3. Saturation index analysis of iron minerals.
ClusterSampleSI (Fe(OH)3)SI (Hematite)SI (Goethite)SI (Siderite)SI (Melanterite)
Class IW-d−1.519.33.69−0.86−5.14
W-u0.5413.465.76−16.13−23.49
W08-10.9914.286.18−11.07−18.37
W10-10.8313.956.02−11.2−18.48
W10-22.7917.97.99−8.18−15.05
W13-10.914.226.15−11.32−18.36
N010.5813.75.881.08−5.45
Class IIW01-15.2522.8410.462.37−2.5
W02-23.9120.189.132.33−1.41
W08-24.2920.869.472.22−2.42
W13-24.1320.689.382.26−2.15
Disclaimer/Publisher’s Note: The statements, opinions and data contained in all publications are solely those of the individual author(s) and contributor(s) and not of MDPI and/or the editor(s). MDPI and/or the editor(s) disclaim responsibility for any injury to people or property resulting from any ideas, methods, instructions or products referred to in the content.

