Abstract
The potential of four different neuro-fuzzy embedded meta-heuristic algorithms, particle swarm optimization, genetic algorithm, harmony search, and teaching–learning-based optimization algorithm, was investigated in this study in estimating the water quality of the Yamuna River in Delhi, India. A cross-validation approach was employed by splitting data into three equal parts, where the models were evaluated using each part. The main aim of this study was to find an accurate prediction model for estimating the water quality of the Yamuna River. It is worth noting that the hybrid neuro-fuzzy and LSSVM methods have not been previously compared for this issue. Monthly water quality parameters, total kjeldahl nitrogen, free ammonia, total coliform, water temperature, potential of hydrogen, and fecal coliform were considered as inputs to model chemical oxygen demand (COD). The performance of hybrid neuro-fuzzy models in predicting COD was compared with classical neuro-fuzzy and least square support vector machine (LSSVM) methods. The results showed higher accuracy in COD prediction when free ammonia, total kjeldahl nitrogen, and water temperature were used as inputs. Hybrid neuro-fuzzy models improved the root mean square error of the classical neuro-fuzzy model and LSSVM by 12% and 4%, respectively. The neuro-fuzzy models optimized with harmony search provided the best accuracy with the lowest root mean square error (13.659) and mean absolute error (11.272), while the particle swarm optimization and teaching–learning-based optimization showed the highest computational speed (21 and 24 min) compared to the other models.
1. Introduction
The industrialization of economics has caused serious environmental problems worldwide. This issue made the members of the United Nations agree to 17 sustainable development goals (SDGs) for growing economies and poverty reduction, while preserving the environment [1]. Conserving the oceans and seas is one of the fundamental goals of the SDGs. Rivers are one of the primary sources of water that discharge from the land to the sea, and can transfer pollution to the seas and oceans.
Water is vital for life, and the river is the major source of water for life. Therefore, river water quality (WQ) and maintaining river WQ are crucial for sustainable living on earth. They are also crucial for the sustainability of the global ecosystem. However, economic activities, industrialization, and urbanization have affected river WQ globally. This is more prominent in developing countries, due to rapid but often unplanned development. The Yamuna River, the largest tributary of India’s biggest river Ganges, is an example of such pollution. River water pollution continuously increased with increased transportation, urbanization, and industrialization. Industrial wastes, city sewerages, and agricultural runoff significantly reduced the river WQ [2,3,4,5] and disturbed the whole ecosystem, including animals and humans, especially children’s health. Monitoring the WQ of the Yamuna River is urgent to adopt protective measures and ensure ecosystem stability [6,7]. However, precise WQ monitoring is challenging for the river Yamuna due to the effect of many points and non-point pollution sources. Robust models are required to estimate WQ changes accurately, with minimum environmental inputs [8].
Chemical oxygen demand (COD) indicates the amount of oxidizable organic material in the river water and, therefore, the dissolved oxygen (DO) levels and the anaerobic conditions. A higher COD indicates a lower DO level and insufficient conditions for aquatic life. Therefore, COD is widely used to measure river WQ [9,10,11]. Numerous models have been developed for predicting river WQ. Most of these models are statistical, based on multiple linear regression, moving average, and auto-regressive moving average. Such statistical methods cannot address the nonlinearity in data; thus, they often fail to predict WQ in complex situations [12,13,14]. Recent studies indicate that ordinary and advanced artificial intelligence (AI) models are robust tools in pattern recognition, and are gaining popularity [15]. Yilma et al. [16] recommended the application of an artificial neural network (ANN) for the prediction of the river WQ index. Ahmed et al. [17] compared the performance of an adaptive neuro-Fuzzy inference system (ANFIS) and two ANNs in the prediction of river WQ. The results demonstrated that the ANFIS was capable of providing greater accuracy. Abba et al. [18] developed three AI models for the prediction of WQ. The considered models included the ANFIS, ANN, and least square support vector machine (LSSVM). The obtained results indicated that the ANFIS outperformed the other methods. Lee and Kim [19] used an ANFIS structure for the simulation of biological oxygen demand (BOD) in the Dongjin River. The results confirmed the accuracy of the developed ANFIS. Wong et al. [20] used an ANN and square support vector machine (SVM) for monsoonal river classification based on water quality. The results approved the accuracy of both the ANN and LSSVM; however, the ANN was more accurate.
Hybrid AI models, e.g., LSSVM or ANFIS with meta-heuristic algorithms, have been introduced to address the drawbacks of statistical methods [21,22,23,24]. Fadaee et al. [25] used a butterfly optimization algorithm (BOA) for training the ANFIS to predict dissolved oxygen (DO) in rivers. The results showed that the BOA is stronger than other optimization algorithms in the literature. Song et al. [26] developed a model for the prediction of WQ based on the LSSVM and sparrow search algorithm (SSA). The capability of LSSVM–SSA was confirmed in the Yangtze River. Arya Azar et al. [27] developed two hybrid algorithms for estimating the longitudinal dispersion coefficient of river pollution. The models included a hybrid of the ANFIS and SVR, with Harris hawks optimization (HHO) meta-heuristic algorithm. The results demonstrated that the HHO may increase the performance of AI models.
Around 40% of India’s populace relies on the Yamuna River for water supply. Therefore, the Yamuna River’s WQ prediction using highly accurate models is directly related to national public health and a sustainable environment. In this study, AI-based models were used for accurate prediction of the Yamuna River’s WQ. The least square support vector machine (LSSVM) model was developed using the strength of kernels, which can predict any phenomenon much more accurately than statistical models [28,29,30]. Kernel-based methods can handle the nonlinearity and non-stationary of time series and accurately predict the series [31,32,33]. The ANFIS has emerged as a powerful AI model for predicting environmental processes. It is more accurate than the classical AI models [34]. However, the ANFIS also requires tuning of its internal parameters for improved accuracy. The ANFIS uses derivative-based learning as the standard parameter learning process, which has a high probability of becoming trapped in local minima. The recent literature revealed that integrating AI models with optimization algorithms could improve their prediction performance by finding optimal control parameters. In the present study, the ANFIS was integrated with four meta-heuristic algorithms, particle swarm optimization (PSO), genetic algorithm (GA), harmony search (HS), and teaching–learning-based optimization (TLBO) to predict the Yamuna River, Delhi’s long-term WQ. Most meta-heuristic algorithms need to be initialized before starting the iterations to calculate the best answer. TLBO was chosen since it is known as one of the optimization algorithms that needs the lowest number of initial parameters. PSO, GA, and HS are famous and powerful algorithms, and their performance has been confirmed in many disciplines. The performances of hybrid ANFISs were compared with the classical ANFIS method to show the efficiency of the TLBO algorithm compared to the classical method. The heuristic ANFIS methods were also compared with the LSSVM method, which was recently applied by Kisi and Parmar [21] to investigate the accuracy of proposed neuro-fuzzy methods in estimating COD. It is worth noting that the application of LSSVM, as well as TLBO, PSO, GA, and HS meta-heuristics algorithms together with the ANFIS to model WQ variables, is a novel comparison. Since the performance of meta-heuristics depends on the particular problem, the results of this research can determine the best candidates for practical applications with the Yamuna River.
A brief overview of the study area is provided in Section 2, whereas a description of the ANFIS and meta-heuristics algorithms are provided in Section 3. Section 4 discusses the results obtained through the application of the models, and finally, Section 5 provides the main conclusions derived from the study, including limitations and recommendations.
2. Case Study
The Yamuna River is the longest and largest tributary of the Ganga, the largest river in India. After originating from the Yamunotri Glacier in the Garhwal Himalayas in northern India, it travels 1376 km before merging with the River Ganga at Allahabad. The Yamuna River contributes 40.2% of the total water of the Ganga. Nearly 70% or 57 million inhabitants of the Indian capital Delhi depend on the Yamuna River for water. The river mixes with the drainage system many times during its long travel from its origin, which causes severe pollution of its water.
The sampling site at Nizamuddin in Delhi is used to monitor the WQ of the Yamuna. The industrial waste and sewerage of the states of Haryana and Delhi affect the WQ at the sample site (Figure 1). This study used 10-year monthly average COD data (January 1999–April 2009) collected by the Central Pollution Control Board (www.cpcb.nic.in, accessed on 1 July 2020). A basic statistical summary of the data is provided in Table 1. WQ parameters of free ammonia (AMM), total kjeldahl nitrogen (TKN), water temperature (WT), total coliform (TC), fecal coliform (FC), and potential of hydrogen (PH) were recorded at the sample site. Table 2 provides the Pearson’s correlations between the WQ parameters and COD for all of the data sets. It is clear from the table that the COD is highly positively correlated with the river water parameters AMM, TKN, TC, and FC, while it has negative correlations with the pH and WT parameters. The mean values of the river water parameters for the studied period are 7.47225 mg/L, 65.05833 mg/L, 15.42467 mg/L, 20.498 mg/L, 25.68517 mg/L, 39,941,063 mg/L, and 5,084,043 mg/L for the pH, COD, AMM, TKM, WT, TC, and FC, respectively.
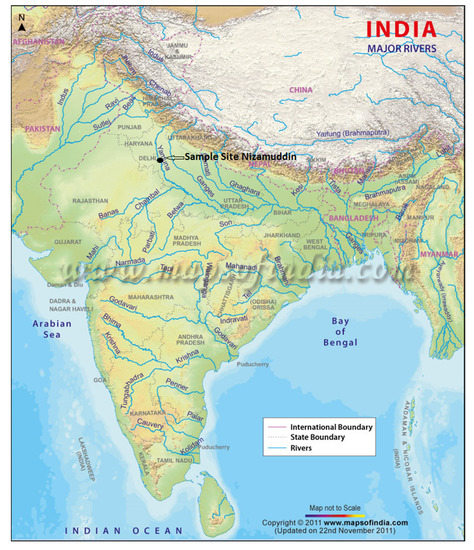
Figure 1.
Sampling site at Nizamuddin in Delhi.

Table 1.
The monthly statistics of COD at the sampling site in Delhi during different periods (Kisi and Parmar, [21]).
Table 2.
Pearson’s correlations between water quality parameters and COD.
The WQ parameters were used as inputs to develop the COD prediction in different scenarios. The effect of the parameters was analyzed in these scenarios. Cross-validation was used to assess the model performance, where the available data (120 monthly values) were split into three equal parts, M1, M2, and M3, as shown in Table 3. Thus, the models were evaluated for three different data sets. The period of each training and test is provided in Table 3, where M1 indicates model 1, and vice versa. The data of the clusters were divided into two main parts, including the training and the testing data sets. The models were optimized using the training part, and the testing data sets were used for evaluating the accuracy of the predictions. About 15% of the training data were randomly separated during the optimization process to prevent overfitting. In cluster M1, the models were trained using data from 1999 January to 2005 August (80 monthly values), and were tested using data from 2005 September to 2009 December (40 monthly values). The other periods can be observed in Table 3.
Table 3.
The training and test data sets used in the study (Kisi and Parmar, [21]).
3. Methods
3.1. Least Square Support Vector Machine
The SVMs were constructed based on the statistical learning theory and the structural risk minimization principle. These make the SVMs sufficiently capable of not becoming trapped in local minima. However, reaching out to an accurate SVM model was challenging due to its requirement of solving a set of nonlinear quadratic equations. In this respect, Suykens et al. [35] introduced a simpler form of the SVM known as the least square support vector machine (LSSVM). LSSVM employs a set of linear equations to train models. Similarly to the SVMs, the LSSVMs models are based on kernel methods, which can accurately estimate hydrological phenomena during training and testing [21].
3.2. Adaptive Neuro-Fuzzy Inference System
The adaptive neuro-Fuzzy inference system (ANFIS) is a robust data-driven model that integrates a feed-forward artificial neural network (ANN) and fuzzy inference system (FIS) to simulate complex problems. In the ANFIS, the Sugeno-type FIS part is utilized to process the input information using different numbers and membership functions (MFs). For the adjustment of the fuzzy logic parameters, an adaptive learning algorithm that integrates the least square and ANN training algorithm (gradient descent) is utilized. Information about the theoretical and practical usage of the ANFIS can be found in several pertinent sources [36,37].
3.3. The Hybrid Procedure of ANFIS and Meta-Heuristic Algorithms
In the ANFIS, MF parameters, such as the center and the width in Gaussian MFs, should be optimized. In the standard version of the ANFIS, the amalgamation of gradient descent (CD) and least square estimator (LSE) optimizes the parameters. Instead of using the CD-LSE algorithm, the ANFIS structure can be merged with meta-heuristic algorithms. It has been reported in some previous studies that merging meta-heuristic algorithms improves the model accuracy in solving complex hydrological problems [38,39,40].
This study assessed the skill of the ANFIS model merged with four meta-heuristic algorithms, particle swarm optimization (PSO), genetic algorithm (GA), harmony search (HS), and teaching–learning-based optimization (TLBO), and compared their performance with the standalone ANFIS model. The performance was compared in optimizing the Gaussian MF parameters for the inputs and linear MF parameters for the output of the ANFIS. Figure 2 shows a flowchart of the developed integration of the ANFIS with meta-heuristic algorithms. A brief description of the algorithms is as follows.
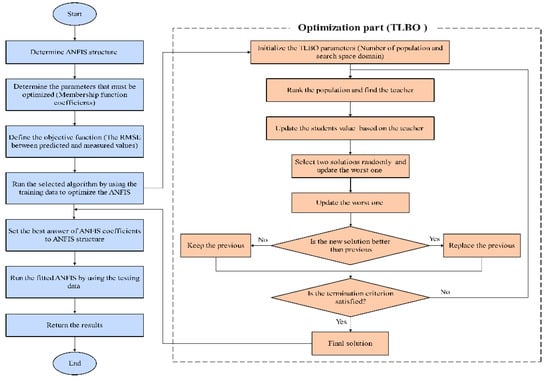
Figure 2.
Flowchart of integrated ANFIS with TLBO.
3.3.1. Particle Swarm Optimization
Particle swarm optimization (PSO) is considered a population-based evolutionary optimization algorithm that can be applied to decision-making functions. Its creation was inspired by the sociological and biological behavior of animals in groups (e.g., flocks of birds). In PSO, each potential solution (swarm) represents the particle of a population. Particles follow the optimal particle (global best; Gbest) through a multi-dimensional search space with keeping the memory of their own previous best personal solution (Pbest). In this regard, each particle updates its position and velocity vector according to the values of Pbest and Gbest [41,42].
3.3.2. Genetic Algorithm
Genetic algorithm (GA) is a search technique that is widely employed to solve optimization issues. It is a particular kind of evolutionary algorithm that makes use of concepts from evolutionary biology including natural selection and genetic drift. GAs use Darwinian principles of natural selection to arrive at the best possible formula for making a prediction or modifying a pattern. They work well with regression-based forecasting methods. It mimics the way natural selection works to solve problems. Some of the inputs derive solutions via genetic selection, which are then evaluated as candidates using the fitness function. The process is iterated until the termination condition is fulfilled. In general, GA is an iteration-based algorithm which finds the solution through a random process [43,44,45].
3.3.3. Harmony Search
Harmony search (HS) is one of the newest and simplest meta-heuristic methods that mimics an orchestra’s harmonic behavior of searching for the optimal feasible solution. In other words, finding an optimal solution for a complex problem resembles playing music. The HS has recently become a popular optimization algorithm due to its applicability for discrete and continuous optimization problems, its few mathematical calculations, simple concept, few parameters, and easy running. Furthermore, compared to other meta-heuristic methods, it has fewer mathematical requirements, and has been widely adapted for solving different engineering issues through simply changing the parameters and operators. Another advantage of this method over the GA is that it uses all the available solutions in its memory, which yields higher flexibility in searching the solution spaces [46,47,48].
3.3.4. Teaching–Learning-Based Optimization Algorithm
The teaching–learning-based optimization algorithm (TLBO), proposed by Rao [49], was designed based on principles of learning and teaching, where the teacher plays an essential role in the class, and can raise students’ levels and the average level of the class through a good speech and communication style. Generally, an individual with a better value and higher level compared to others is determined to be a teacher who shares his/her knowledge with others. The TLBO algorithm comprises two optimization phases, the teacher and learning phases.
In the teacher phase, the average class level is raised to the teacher level; thus, the student’s level changes in this phase. The teacher phase is followed by the learning phase, where the students can learn from and influence each other to improve students’ levels [50,51,52].
4. Application of the Methods
Four meta-heuristic algorithms, PSO, GA, HS, and TLBO, were applied to improve the skill of the classic ANFIS in estimating river water chemical oxygen demand (COD) from six water quality (WQ) parameters, free ammonia (AMM), total kjeldahl nitrogen (TKN), water temperature (WT), total coliform (TC), fecal coliform (FC), and potential of hydrogen (PH). Meta-heuristic algorithms were integrated with theANFIS to improve its performance. The improvement was measured by comparing the hybrid ANFIS model with the classical ANFIS and least square support vector machine (LSSVM) models. The following input combinations were attempted, following the previous study of Kisi and Parmar [13,15]:
- AMM, TKN, and WT;
- AMM, TKN, WT, and TC;
- AMM, TKN, WT, TC, and FC;
- AMM, TKN, WT, TC, FC, and PH.
The parameter values of the meta-heuristic algorithms are provided in Table 4. These values were selected based on recommendations from the literature [53,54], and trial and error. The models’ performance was evaluated using root mean square error (RMSE), correlation coefficient (R2), mean absolute error (MAE), and peak percent threshold statistics (PPTS), as described in Equations (1)–(4), following the study of [15]:
where N is the sample size; CODi,o and CODi,e are the measured and modelled COD, respectively; and in which u and l are higher and lower bounds in %, respectively; Ei denotes the relative error of the ith data. PPTS(l,u) indicates the mean absolute relative error in modeling COD varying between the top u% and l% data.
Table 4.
The parameter values of the four meta-heuristic algorithms used in this study.
5. Results and Discussion
Table 5 presents the performance of the applied methods in modeling Chemical Oxygen Demand (COD) using three inputs, free ammonia (AMM), total kjeldahl nitrogen (TKN), and water temperature (WT). Average statistics of the test results are also provided in Table 5. It shows that the ANFIS with meta-heuristic algorithms performed better than the least square support vector machine (LSSVM). As expected, merging the neuro-fuzzy method and the new algorithms remarkably enhanced the predictivity of the classical ANFIS method. Among the hybrid ANFIS methods, the ANFIS–HS provided the best RMSE (14.024 mg/L), MAE (11.033 mg/L), and the best PPTS criterion estimates. The ANFIS–HS decreased the RMSE of the classical ANFIS and LSSVM from 16.261 mg/L and 15.093 mg/L to 14.024 mg/L, with percentages of 13.75 and 7.08, respectively.
Table 5.
Comparison of models’ performance with AMM, TKN, and WT as inputs.
The RMSE, R2, MAE, and PPTS statistics of the different neuro-fuzzy methods and LSSVM are shown in Table 6 for input combination (ii) (AMM, TKN, WT, and total coliform, TC). Here also, the methods showed the best and worst predictivity for the M2 and M1 data sets. Training the ANFIS with meta-heuristic algorithms improved its accuracy, similarly to the previous input combination. Hybrid ANFIS methods, except ANFIS–PSO, outperformed the LSSVM, while ANFIS–PSO showed similar performance. Among the hybrid methods, ANFIS–TLBO and ANFIS–HS showed the best performance. However, the PPTS 5%, PPTS 10%, and PPTS 20% values of ANFIS–TLBO were lower than ANFIS–HS, which indicates that TLBO acted slightly better than HS. The RMSE of the ANFIS and LSSVM methods reduced from 16.722 mg/L and 15.177 mg/L to 14.565 mg/L, or by 13% and 4% using the ANFIS–TLBO and ANFIS–HS methods, respectively. The addition of TC as input could not improve the accuracy of the applied models.
Table 6.
Comparison of the applied models with AMM, TKN, WT, and TC as inputs.
Table 7 and Table 8 show the test results of the applied methods for input combinations (iii) and (iv), respectively. The results showed that all hybrid ANFIS methods provided a higher skill than the classical ANFIS and LSSVM algorithms in modelling COD. For input combination (iii), the ANFIS–HS provided the best accuracy in terms of various comparison statistics. This method increased the RMSE of the classical ANFIS and LSSVM methods by 7% and 6%, respectively. For input combination (iv), the ANFIS–TLBO showed the best performance in RMSE, while the ANFIS–HS showed slightly lower PPTS than the ANFIS–TLBO. The RMSE of the ANFIS and LSSVM methods reduced from 16.451 mg/L and 15.987 mg/L to 15.158 mg/L, or by 8% and 5%, respectively, using the ANFIS–TLBO. The results indicate that COD estimation accuracy did not increase by including fecal coliform (FC) and potential of hydrogen (PH) as inputs.
Table 7.
Comparison of the applied models with AMM, TKN, WT, TC, and FC as inputs.
Table 8.
Comparison of the models’ performance with all variables as inputs.
The computational times of the applied hybrid methods are reported in Table 9 for comparison. The computer’s properties were an Intel CPU, Core i7, 8 GB RAM. The total average computational time (in minutes) provided in the table shows that ANFIS–HS predicted the COD in the lowest time during calibration, while the ANFIS–GA was the slowest method. The ANFIS–PSO and ANFIS–TLBO also showed high computational speed compared to the ANFIS–GA method. This clearly indicates the superiority of the PSO and TLBO algorithms over GA.
Table 9.
Computational time (min) in predicting COD by the applied hybrid methods.
The observed and model estimated CODs for the input combinations (i), (ii), (iii), and (iv) are illustrated in Figure 2, Figure 3, Figure 4 and Figure 5, respectively. The figures indicate less scattered estimates by the hybrid ANFIS methods than the ANFIS and LSSVM methods. It is worth noting that the R2 values were compatible with the model accuracy in some cases, as it indicated a linear relationship between the observed and model estimations. However, R2 = 1 does not indicate that the model exactly estimated all target values. This can also be observed in Table 5, Table 6, Table 7 and Table 8, in which correlation was incompatible with the RMSE and/or MAE. In such cases, the RMSE and/or MAE statistics should be considered as the main criterion to determine the best model. The hybrid models were more successful in modelling peak values than the ANFIS and LSSVM, as confirmed by the PPTS statistics in Table 5, Table 6, Table 7 and Table 8. It can also be observed that the ANFIS–HS model with input combination (i) and the M2 data set provided more precise results with smaller values of the RMSE (13.358 mg/L) and mean MAE (10.324 mg/L). It is also visible from Figure 3, Figure 4, Figure 5 and Figure 6 that all of the models could not estimate the extreme COD values. The main reason for this was that limited data involving extreme values prevented the models from learning the extreme phenomena appropriately. Figure 7 visually compares the RMSE and MAE of the best models using bar charts. This graph also shows the superior accuracy of hybrid ANFIS models over the single ANFIS and LSSVM. A Taylor’s diagram of the models for the M2 data set and input combination (i) is illustrated in Figure 8. It shows that the hybrid ANFIS models were slightly more accurate than the ANFIS.
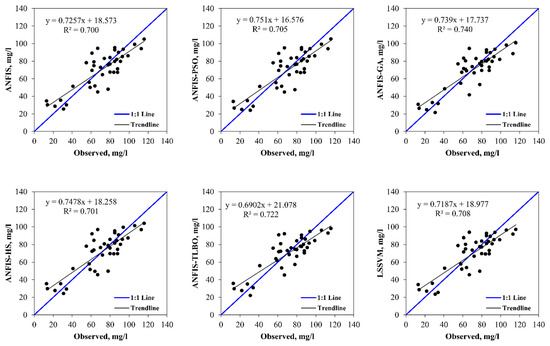
Figure 3.
The observed and model-estimated CODs for the M2 data set with AMM, TKN, and WT as inputs.
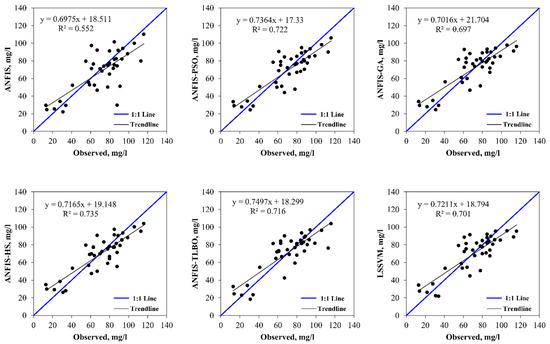
Figure 4.
The observed and model-estimated CODs for the M2 data set with AMM, TKN, WT, and TC as inputs.
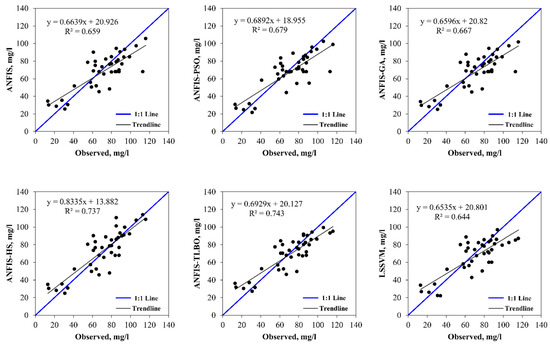
Figure 5.
The observed and model-estimated CODs for the M2 data set with AMM, TKN, WT, TC, and as inputs.
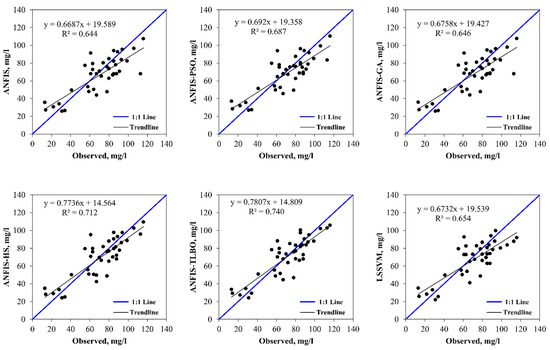
Figure 6.
The observed and model-estimated CODs for the M2 data set with all variables as input.
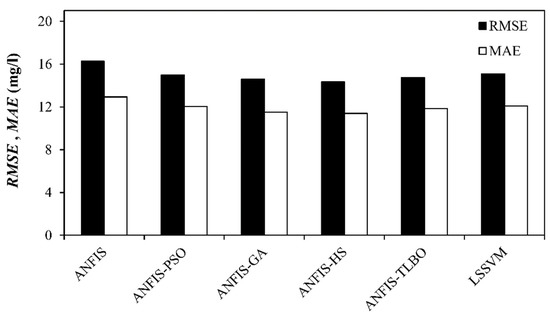
Figure 7.
Visual comparison of model performance for the best input combination and data set.
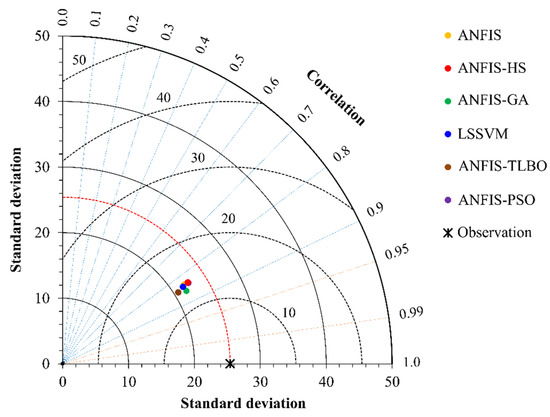
Figure 8.
Taylor diagram of the predicted COD by ANFIS-based and LSSVM models using best input combination and data set during testing phase.
6. Discussion
The potential of four hybrid ANFIS methods was investigated in this study in estimating the chemical oxygen demand COD of the Yamuna River in Delhi, India, using monthly water quality parameters, total kjeldahl nitrogen, free ammonia, total coliform, water temperature, potential of hydrogen, and fecal coliform as inputs to the models. The outcomes of the implemented methods were compared with those of Kisi and Parmar [21].
The tables and figures revealed that the first input combination (AMM, TKN, and WT) provided the best accuracy in modelling COD, as reported in the previous study [21]. Bhardwaj and Parmar [55] reported that COD has high positive correlations with AMM (0.823) and TKN (0.741), and a negative correlation with WT (−0.273). Kora et al. [56] found no correlation between COD with TC and FC at Hussain Sagar Lake, Hyderabad, India. Kagalou et al. [57] studied the interrelationships between increased bacterial concentrations in near-bottom samples and an increase in TC and FC counts after precipitation. Evidence supports the idea that bacteria rely more on the source of pollution than the total organic load, indicating weak or negative relationships between bacteriological indices and BOD and COD levels.
It was observed from Table 4 that the best accuracy of the methods for the M2 data set, while the M1 data set resulted in the worst accuracy. This may be because of a different data range of M1 compared to M2 and M3 (see Table 1), which caused difficulties for the applied models in data extrapolation, as stated by Kisi and Parmar [21]. In addition, the training data were more skewed (Csx = −0.64 and −0.24 for M2 and M3, respectively) than the test data (Csx = −0.08) in this case.
The results showed that the accuracy of the models considerably fluctuated for these inputs. For example, the adaptive neuro-fuzzy inference system (ANFIS) showed an RMSE of 13.770 mg/L for M2, while it yielded 17.874 and 17.139 mg/L for M1 and M3, respectively. This indicates that the testing methods with only one data set may mislead the modeler about model performance. Therefore, cross-validation is very necessary for a robust evaluation of the methods.
Liu et al. [58] predicted COD using dynamic kernel extreme learning machine (DKELM) method, and compared it using partial least squares, ELM, dynamic ELM, and kernel ELM. The best model (DKELM) provided an R2 of 0.7585 in the test stage. Sharafati et al. [59] used ada boost regression, gradient boost regression, and random forest regression for the prediction of COD; the highest correlation (R = 0.751) was found with the gradient boost regression. In the present study, the ANFIS–GA produced an R2 = 0.740 (or R = 0.860), which is acceptable compared to that of previous studies.
The main limitation of the present study is the use of limited data. That data interval was monthly, and the available data period was very short. In order to justify the models’ robustness and/or generalization capability, more data from different regions should be applied. It was clearly seen from the scatterplots that the hybrid methods could detect the extreme values well, and this can be explained by the limited number of training examples, especially for the COD extremes.
7. Conclusions
In the present study, the potential of four meta-heuristic-algorithm-integrated adaptive neuro-fuzzy inference system (ANFIS) models in estimating river water chemical oxygen demand (COD) was explored. The ability of hybrid neuro-fuzzy methods was investigated for different combinations of water quality (WQ) parameters, free ammonia (AMM), total kjeldahl nitrogen (TKN), water temperature (WT), total coliform (TC), fecal coliform (FC), and potential of hydrogen (PH) as inputs. Various input combinations were used by applying a cross-validation method, and the results were compared with the classical ANFIS and least square support vector machine (LSSVM) methods. The ANFIS comprising AMM, TKN, and WT input parameters provided the best accuracy in estimating monthly COD. The analysis outcomes revealed that employing meta-heuristic algorithms improved the accuracy of the classical ANFIS, and generally outperformed the LSSVM method in modelling COD. The ANFIS with harmony search algorithm provided the best COD estimates in terms of accuracy and computational time. The applications produced considerable fluctuations in estimations for the implemented models for three different data sets; this suggested the necessity of using cross-validation for better assessment of the applied methods.
The outcomes of this study led us to recommend the use of the hybrid neuro-fuzzy model tuned with harmony search algorithm for estimating the water quality of the Yamuna River, India. The results can be helpful for authorities and decision makers in managing water pollution in this region. The hybrid model developed in this study can be used to model COD, a vital WQ index, from AMM, TKN, and WT. The case study selected in the current study is important for India, as the selected river is the water source for 40% of the country’s population. Measuring COD requires sample preparation and chemical pre-treatment, which are time-consuming and labor-intensive. The models developed in this study can be employed for estimating COD amounts at critical points of the river, which can be helpful for monitoring and controlling industrial and sewerage effects.
The developed models could not be generalized because only data from one site were available to assess them; this can be carried out in future studies using more data from other regions. The implemented methods can be applicable for other sites, but they require enough data and training. The models implemented by this study can be compared with other advanced methods, such as hybrid artificial neural networks, extreme learning machine, and deep learning models, in future studies using daily or monthly water quality data for longer durations.
Author Contributions
Conceptualization: R.M.A., O.K. and K.S.P.; formal analysis: M.Z.-K. and A.M.-M.; validation: O.K. and R.M.A.; supervision: O.K. and R.M.A.; writing—original draft: M.Z.-K., O.K., A.M.-M., K.S.P., O.K. and R.M.A.; visualization: M.Z.-K. and A.M.-M.; investigation: M.Z.-K., O.K., A.M.-M., K.S.P., O.K. and R.M.A.; writing—review and editing: O.K. and S.S. All authors have read and agreed to the published version of the manuscript.
Funding
This research received no external funding.
Institutional Review Board Statement
Not applicable.
Informed Consent Statement
Not applicable.
Data Availability Statement
The data presented in this study will be available upon an interesting request from the corresponding author.
Conflicts of Interest
There are no conflict of interest in this study.
References
- A/RES/70/1; United Nations General Assembly. United Nations: New York, NY, USA, 2015. Available online: https://www.un.org/en/development/desa/population/migration/generalassembly/docs/globalcopact/A_RES_70_1_E.pdf (accessed on 2 June 2020).
- Shah, M.I.; Alaloul, W.S.; Alqahtani, A.; Aldrees, A.; Musarat, M.A.; Javed, M.F. Predictive Modeling Approach for Surface Water Quality: Development and Comparison of Machine Learning Models. Sustainability 2021, 13, 7515. [Google Scholar] [CrossRef]
- Soni, K.; Parmar, K.S.; Agarwal, S. Modeling of Air Pollution in Residential and Industrial Sites by Integrating Statistical and Daubechies Wavelet (Level 5) Analysis. Model. Earth Syst. Environ. 2017, 3, 1187–1198. [Google Scholar] [CrossRef]
- Akoto, O.; Adiyiah, J. Chemical analysis of drinking water from some communities in the Brong A hafo region. Int. J. Environ. Sci. Technol. 2007, 4, 211–214. [Google Scholar] [CrossRef]
- Alam, M.J.B.; Muyen, Z.; Islam, M.R.; Islam, S.; Mamun, M. Water quality parameters along rivers. Int. J. Environ. Sci. Technol. 2007, 4, 159–167. [Google Scholar] [CrossRef]
- APHA. Standard Methods for Examination of Water and Waste Water; American Public Health Association: Washington, DC, USA, 1995. [Google Scholar]
- WHO. International Standards for Drinking Water; World Health Organization: Geneva, Switzerland, 1971. [Google Scholar]
- Rodríguez, R.; Pastorini, M.; Etcheverry, L.; Chreties, C.; Fossati, M.; Castro, A.; Gorgoglione, A. Water-Quality Data Imputation with a High Percentage of Missing Values: A Machine Learning Approach. Sustainability 2021, 13, 6318. [Google Scholar] [CrossRef]
- Dong, Q.; Wang, Y.; Li, P. Ultifractal behavior of an air pollutant time series and the relevance to the predictability. Environ. Pollut. 2017, 222, 444–457. [Google Scholar] [CrossRef]
- Bhardwaj, R.; Parmar, K.S. Water quality index and fractal dimension analysis of water Parameters. Int. J. Environ. Sci. Technol. 2013, 10, 151–164. [Google Scholar]
- Wong, Y.J.; Shimizu, Y.; He, K.; Nik Sulaiman, N.M. Comparison among different ASEAN water quality indices for the assessment of the spatial variation of surface water quality in the Selangor river basin, Malaysia. Environ. Monit. Assess. 2020, 192, 644. [Google Scholar] [CrossRef]
- Singh, S.; Parmar, K.S.; Kumar, J. Soft computing model coupled with statistical models to estimate future of stock market. Neural Comput. Appl. 2021, 33, 7629–7647. [Google Scholar] [CrossRef]
- Li, X.; Peng, L.; Yao, X.; Cui, S.; Hu, Y.; You, C.; Chi, T. Long short-term memory neural network for air pollutant concentration predictions: Method development and evaluation. Environ. Pollut. 2017, 231, 997–1004. [Google Scholar] [CrossRef]
- Li, Y.; Jiang, P.; She, Q.; Lin, G. Research on air pollutant concentration prediction method based on self-adaptive neuro-fuzzy weighted extreme learning machine. Environ. Pollut. 2018, 241, 1115–1127. [Google Scholar] [CrossRef] [PubMed]
- Sharma, P.; Said, Z.; Kumar, A.; Nižetić, S.; Pandey, A.; Hoang, A.T.; Huang, Z.; Afzal, A.; Li, C.; Le, A.T.; et al. Recent Advances in Machine Learning Research for Nanofluid-Based Heat Transfer in Renewable Energy System. Energy Fuels 2022, 36, 6626–6658. [Google Scholar] [CrossRef]
- Yilma, M.; Kiflie, Z.; Windsperger, A.; Gessese, N. Application of artificial neural network in water quality index prediction: A case study in Little Akaki River, Addis Ababa, Ethiopia. Model. Earth Syst. Environ. 2018, 4, 175–187. [Google Scholar] [CrossRef]
- Ahmed, A.N.; Othman, F.B.; Afan, H.A.; Ibrahim, R.K.; Fai, C.M.; Hossain, M.S.; Ehteram, M.; Elshafie, A. Machine learning methods for better water quality prediction. J. Hydrol. 2019, 578, 124084. [Google Scholar] [CrossRef]
- Abba, S.I.; Pham, Q.B.; Saini, G.; Linh, N.T.T.; Ahmed, A.N.; Mohajane, M.; Khaledian, M.; Abdulkadir, R.A.; Bach, Q.V. Implementation of data intelligence models coupled with ensemble machine learning for prediction of water quality index. Environ. Sci. Pollut. Res. 2020, 27, 41524–41539. [Google Scholar] [CrossRef]
- Lee, E.; Kim, T. Predicting BOD under Various Hydrological Conditions in the Dongjin River Basin Using Physics-Based and Data-Driven Models. Water 2021, 13, 1383. [Google Scholar] [CrossRef]
- Wong, Y.J.; Shimizu, Y.; Kamiya, A.; Maneechot, L.; Bharambe, K.P.; Fong, C.S.; Sulaiman, N.M.N. Application of artificial intelligence methods for monsoonal river classification in Selangor river basin, Malaysia. Environ. Monit. Assess. 2021, 193, 438. [Google Scholar] [CrossRef]
- Kisi, O.; Parmar, K.S. Application of least square support vector machine and multivariate adaptive regression spline models in long term prediction of river water pollution. J. Hydrol. 2016, 534, 104–112. [Google Scholar] [CrossRef]
- Adnan, R.M.; Liang, Z.; Trajkovic, S.; Zounemat-Kermani, M.; Li, B.; Kisi, O. Daily streamflow prediction using optimally pruned extreme learning machine. J. Hydrol. 2019, 577, 123981. [Google Scholar] [CrossRef]
- Cheng, M.Y.; Cao, M.T. Evolutionary multivariate adaptive regression splines for estimating shear strength in reinforced-concrete deep beams. Eng. Appl. Artif. Intell. 2014, 28, 86–96. [Google Scholar] [CrossRef]
- Alizamir, M.; Kisi, O.; Adnan, R.M.; Kuriqi, A. Modelling reference evapotranspiration by combining neuro-fuzzy and evolutionary strategies. Acta Geophys. 2020, 68, 1113–1126. [Google Scholar] [CrossRef]
- Fadaee, M.; Amin Mahdavi-Meymand, A.; Zounemat-Kermani, M. Seasonal Short-Term Prediction of Dissolved Oxygen in Rivers via Nature-Inspired Algorithms. CLEAN—Soil Air Water 2020, 48, 1900300. [Google Scholar] [CrossRef]
- Song, C.; Yao, L.; Hua, C.; Ni, Q. A water quality prediction model based on variational mode decomposition and the least squares support vector machine optimized by the sparrow search algorithm (VMD-SSA-LSSVM) of the Yangtze River, China. Environ. Monit. Assess. 2021, 193, 363. [Google Scholar] [CrossRef]
- Arya Azar, N.; Milan, S.G.; Kayhomayoon, Z. The prediction of longitudinal dispersion coefficient in natural streams using LS-SVM and ANFIS optimized by Harris hawk optimization algorithm. J. Contam. Hydrol. 2021, 240, 103781. [Google Scholar] [CrossRef]
- Maheshwaran, R.; Khosa, R. Long term forecasting of groundwater levels with evidence of non-stationary and nonlinear characteristics. Comput. Geosci. 2013, 52, 422–436. [Google Scholar] [CrossRef]
- Emadi, A.; Zamanzad-Ghavidel, S.; Fazeli, S.; Zarei, S.; Rashid-Niaghi, A. Multivariate modeling of pan evaporation in monthly temporal resolution using a hybrid evolutionary data-driven method (case study: Urmia Lake and Gavkhouni basins). Environ. Monit. Assess. 2021, 193, 355. [Google Scholar] [CrossRef]
- Ikram, R.M.A.; Dai, H.L.; Ewees, A.A.; Shiri, J.; Kisi, O.; Zounemat-Kermani, M. Application of improved version of multi verse optimizer algorithm for modeling solar radiation. Energy Rep. 2022, 8, 12063–12080. [Google Scholar]
- Adnan, R.M.; Mostafa, R.R.; Islam, A.R.M.T.; Gorgij, A.D.; Kuriqi, A.; Kisi, O. Improving Drought Modeling Using HybridRandom Vector Functional Link Methods. Water 2021, 13, 3379. [Google Scholar] [CrossRef]
- Sapankevych, N.I.; Sankar, R. Time series prediction using support vector machines: A survey. Comput. Intell. Mag. IEEE 2009, 4, 24–38. [Google Scholar] [CrossRef]
- Shamir, E.; Megdal, S.B.; Carrillo, C.; Castro, C.L.; Chang, H.; Chief, K.; Corkhill, F.E.; Georgakakos, S.E.K.P.; Nelson, K.M.; Prietto, J. Climate change and water resources management in the Upper Santa Cruz River, Arizona. J. Hydrol. 2015, 521, 18–33. [Google Scholar] [CrossRef]
- Shoorehdeli, M.A.; Teshnehlab, M.; Sedigh, A.K.; Khanesar, M.A. Identification using ANFIS with intelligent hybrid stable learning algorithm approaches and stability analysis of training methods. Appl. Soft Comput. 2009, 9, 833–850. [Google Scholar] [CrossRef]
- Suykens, J.A.; De Brabanter, J.; Lukas, L.; Vandewalle, J. Weighted least squares support vector machines: Robustness and sparse approximation. Neurocomputing 2002, 48, 85–105. [Google Scholar] [CrossRef]
- Jang, J.S. ANFIS: Adaptive-network-based fuzzy inference system. IEEE Trans. Syst. Man Cybern. 1993, 23, 665–685. [Google Scholar] [CrossRef]
- Kisi, O.; Shiri, J.; Karimi, S.; Adnan, R.M. Three different adaptive neuro fuzzy computing techniques for forecasting long-period daily streamflows. In Big Data in Engineering Applications; Springer: Singapore, 2018; pp. 303–321. [Google Scholar]
- Kumar, V.; Yadav, S.M. Optimization of Reservoir Operation with a New Approach in Evolutionary Computation Using TLBO Algorithm and Jaya Algorithm. Water Resour. Manag. 2018, 32, 4375–4391. [Google Scholar] [CrossRef]
- Ikram, R.M.A.; Mostafa, R.R.; Chen, Z.; Islam, A.R.M.T.; Kisi, O.; Kuriqi, A.; Zounemat-Kermani, M. Advanced Hybrid Metaheuristic Machine Learning Models Application for Reference Crop Evapotranspiration Prediction. Agronomy 2023, 13, 98. [Google Scholar] [CrossRef]
- Adnan, R.M.; Mostafa, R.R.; Elbeltagi, A.; Yaseen, Z.M.; Shahid, S.; Kisi, O. Development of new machine learning model for streamflow prediction: Case studies in Pakistan. Stoch. Environ. Res. Risk Assess. 2022, 36, 999–1033. [Google Scholar] [CrossRef]
- Poli, R. Analysis of the publications on the applications of particle swarm optimization. J. Artif. Evol. Appl. 2008, 2008, 685175. [Google Scholar]
- Chaganti, R.; Mourade, A.; Ravi, V.; Vemprala, N.; Dua, A.; Bhushan, B. A Particle Swarm Optimization and Deep Learning Approach for Intrusion Detection System in Internet of Medical Things. Sustainability 2022, 14, 12828. [Google Scholar] [CrossRef]
- Dai, L.; Lu, H.; Hua, D.; Liu, X.; Chen, H.; Glowacz, A.; Królczyk, G.; Li, Z. A Novel Production Scheduling Approach Based on Improved Hybrid Genetic Algorithm. Sustainability 2022, 14, 11747. [Google Scholar] [CrossRef]
- Mirjalili, S. Genetic algorithm. In Evolutionary Algorithms and Neural Networks; Springer: Berlin/Heidelberg, Germany, 2019; pp. 43–55. [Google Scholar]
- Katoch, S.; Chauhan, S.S.; Kumar, V. A review on genetic algorithm: Past, present, and future. Multimed. Tools Appl. 2021, 80, 8091–8126. [Google Scholar] [CrossRef]
- Manjarres, D.; Landa-Torres, I.; Gil-Lopez, S.; Del Ser, J.; Bilbao, M.N.; Salcedo-Sanz, S.; Geem, Z.W. A survey on applications of the harmony search algorithm. Eng. Appl. Artif. Intell. 2013, 26, 1818–1831. [Google Scholar] [CrossRef]
- Ocak, A.; Nigdeli, S.M.; Bekdaş, G.; Kim, S.; Geem, Z.W. Optimization of Seismic Base Isolation System Using Adaptive Harmony Search Algorithm. Sustainability 2022, 14, 7456. [Google Scholar] [CrossRef]
- Abualigah, L.; Diabat, A.; Geem, Z.W. A comprehensive survey of the harmony search algorithm in clustering applications. Appl. Sci. 2020, 10, 3827. [Google Scholar] [CrossRef]
- Rao, R.V.; Savsani, V.J.; Vakharia, D.P. Teaching–learning-based optimization: A novel method for constrained mechanical design optimization problems. Comput.-Aided Des. 2011, 43, 303–315. [Google Scholar] [CrossRef]
- Sahu, R.K.; Shaw, B.; Nayak, J.R. Short/medium term solar power forecasting of Chhattisgarh state of India using modified TLBO optimized ELM. Eng. Sci. Technol. Int. J. 2021, 24, 1180–1200. [Google Scholar] [CrossRef]
- Almutairi, K.; Algarni, S.; Alqahtani, T.; Moayedi, H.; Mosavi, A. A TLBO-Tuned Neural Processor for Predicting Heating Load in Residential Buildings. Sustainability 2022, 14, 5924. [Google Scholar] [CrossRef]
- Gao, N.; Zhang, Z.; Tang, L.; Hou, H.; Chen, K. Optimal design of broadband quasi-perfect sound absorption of composite hybrid porous metamaterial using TLBO algorithm. Appl. Acoust. 2021, 183, 108296. [Google Scholar] [CrossRef]
- Adnan, R.M.; Yuan, X.; Kisi, O.; Adnan, M.; Mehmood, A. Stream Flow Forecasting of Poorly Gauged MountainousWatershed by Least Square Support Vector Machine, Fuzzy Genetic Algorithm and M5 Model Tree Using Climatic Data from Nearby Station. Water Resour. Manag. 2018, 32, 4469–4486. [Google Scholar] [CrossRef]
- Ikram, R.M.A.; Hazarika, B.B.; Gupta, D.; Heddam, S.; Kisi, O. Streamflow prediction in mountainous region using new machine learning and data preprocessing methods: A case study. Neural Comput. Appl. 2022, 1–18. [Google Scholar] [CrossRef]
- Bhardwaj, R.; Parmar, K.S. Wavelet and statistical analysis of river water quality parameters. Appl. Math. Comput. 2013, 219, 10172–10182. [Google Scholar]
- Kora, A.J.; Rastogi, L.; Kumar, S.J.; Jagatap, B.N. Physico-chemical and bacteriological screening of Hussain Sagar lake: An urban wetland. Water Sci. 2017, 31, 24–33. [Google Scholar] [CrossRef]
- Kagalou, I.; Tsimarakis, G.; Bezirtzoglou, E. Inter-relationships between bacteriological and chemical variations in Lake Pamvotis-Greece. Microb. Ecol. Health Dis. 2002, 14, 37–41. [Google Scholar]
- Sharafati, A.; Asadollah, S.B.H.S.; Hosseinzadeh, M. The potential of new ensemble machine learning models for effluent quality parameters prediction and related uncertainty. Process Saf. Environ. Prot. 2020, 140, 68–78. [Google Scholar] [CrossRef]
- Liu, H.; Zhang, Y.; Zhang, H. Prediction of effluent quality in papermaking wastewater treatment processes using dynamic kernel-based extreme learning machine. Process Biochem. 2020, 97, 72–79. [Google Scholar] [CrossRef]


Disclaimer/Publisher’s Note: The statements, opinions and data contained in all publications are solely those of the individual author(s) and contributor(s) and not of MDPI and/or the editor(s). MDPI and/or the editor(s) disclaim responsibility for any injury to people or property resulting from any ideas, methods, instructions or products referred to in the content. |
© 2023 by the authors. Licensee MDPI, Basel, Switzerland. This article is an open access article distributed under the terms and conditions of the Creative Commons Attribution (CC BY) license (https://creativecommons.org/licenses/by/4.0/).