Article

Nature-Based Solutions for the Restoration of Groundwater Level and Groundwater-Dependent Ecosystems in a Typical Inland Region in China

1
Institute of Hydrogeology and Environmental Geology, Chinese Academy of Geological Sciences, 268 Zhonghua North Street, Shijiazhuang 050061, China
2
Key Laboratory of Groundwater Sciences and Engineering, Ministry of Natural Resources, 268 Zhonghua North Street, Shijiazhuang 050061, China
3
Airborne Survey and Remote Sensing Center of Nuclear Industry, Shijiazhuang 050002, China
*
Authors to whom correspondence should be addressed.
Water 2024, 16(1), 33; https://doi.org/10.3390/w16010033
Submission received: 7 November 2023 / Revised: 17 December 2023 / Accepted: 19 December 2023 / Published: 21 December 2023

Abstract

:
The rapid drop in groundwater level and the degradation of groundwater-dependent ecosystems (GDEs) has led to serious imbalances in the development of the socio-ecological system (SES) in Minqin Oasis, northwest China. In this study, the interactions between the elements of the SES were analyzed, and the effects of the implementation of nature-based solutions (NbS) and the resilience of the SES were assessed using the methods of linear trend analysis, correlation, and fuzzy comprehensive evaluation. The results showed that: (i) the most important contributing factor to the increase in groundwater depth (GLD) and the degradation of GDEs was the continuous groundwater extraction for the irrigation of farmland; and (ii) the natural vegetation began to be degraded when the GLD surpassed 5 m; (iii) the initial goal of NbS was achieved, the increase in GLD has been curbed, and the vegetation and the wetland area of Qingtu lake have begun to be restored. The SES resilience index increased by a factor of 1.82 from 2009 to 2017; however, it was still below 0.6, and thus the NbS should be continued in the future. This study provides a reference for the sustainable development of the SES in other similar areas under various environmental challenges.

1. Introduction

The crises currently facing the world are constantly escalating, and the interactions between humans and the environment continue to deteriorate, suggesting that humans and other life on Earth may be approaching a catastrophic tipping point [1]. Global issues such as climate change, food shortages, groundwater depletion, and loss of biodiversity pose significant challenges to social and ecological systems on which humans rely for survival. In response, human beings urgently need innovative solutions to these problems, and to reconsider the relationship between humans and nature. It is time to shift from the disorderly utilization of natural resources to respecting nature, cooperating with nature, and maximizing the power of nature. Thus, the concepts and methods of Nature-based Solutions (NbS) are emerging [2,3,4,5,6,7,8].
NbS is a new concept that has arisen during the past two decades, and there are currently multiple definitions and interpretations of the term [9,10]. In the fifth session of the United Nations Environment Assembly of the United Nations Environment Programme, NbS was defined as “actions to protect, conserve, restore, sustainably use and manage natural or modified terrestrial, freshwater, coastal and marine ecosystems, which address social, economic, and environmental challenges effectively and adaptively, while simultaneously providing human well-being, ecosystem services and resilience and biodiversity benefits” [11]. Many such NbS initiatives, including ecological restoration and protection, holistic management, groundwater recharge, and blue-green infrastructure practices, involve multiple methods of cooperating with nature to achieve social benefits. These methods are being implemented globally, especially in rural communities and among people in low- and middle-income countries [12,13]. Although NbS may provide more productive and cost-effective remedies than conventional techniques, monitoring and assessment methods for implementing these solutions are not documented across multiple scales and resources; how NbS practices can be transformed into the direct application of management activities remains an open question.
The Shiyang River Basin (SRB) is a typical inland arid basin in northwest China. Minqin Oasis, located downstream of the SRB, was once one of the seventeen poverty-stricken counties in Gansu Province that accounted for 40% of the “Silk Road Economic Belt” in China. The area has a dry climate with scarce water resources. Groundwater is the main water source for maintaining local socio-economic development, agriculture, and the oasis environment. Since 1970, continuous groundwater exploitation in the SRB has led to the transformation of the downstream Minqin Oasis into a pure pumping-well irrigation area, and there has been a rapid decline in the groundwater level [14,15]. By 2007, the groundwater depth (GLD) in Minqin Oasis was generally between 20 and 40 m, far lower than the ecologically suitable GLD for surface vegetation [16,17]. Thus, the vegetation ecology in the oasis–desert ecotone (ODE) was severely degraded. Sandstorms were frequent, and the wetland area of the terminal lake (Qingtu Lake) was significantly reduced. Due to the intrusion of sandstorms from the northwest Badain Jaran Desert, there has been extensive sand intrusion and human retreat in the oasis. Faced with the serious imbalance of the socio-ecological system (SES) in Minqin Oasis, the Chinese government proposed a series of NbS, called the Comprehensive Administration Project of the SRB (CASRB). This program aimed to restore the groundwater level (GL) and vegetation of the Minqin Oasis in the lower SRB, and in the meantime lift the county out of poverty by increasing the per-capita income of the residents, ultimately achieving sustainable development of the SES. With regard to the effect of the CASRB, the recovery of the GL [16,18] and the ecological functions of the groundwater [17,19] have been investigated by some researchers. However, there are few reports on the evaluation of this NbS from the perspective of the sustainable development of regional SES.
Therefore, the objectives of this study were: (1) to analyze the changes in hydro-climatic elements, land use and land cover, and the normalized difference vegetation index (NDVI) in the oasis–desert ecotone (ODE) during the past several decades; (2) to investigate the close interactions among the elements of the SES both in agroecological area and natural ecological area; (3) to reveal the effects of the CASRB on the restoration of the groundwater and groundwater-dependent ecosystems (GDEs) by primary indicators; and (4) to assess the changes in the resilience of the SES in the post-CASRB period by using the fuzzy comprehensive evaluation method based on the above interaction analysis and the selected indicators. This study can enrich the theory and practice of NbS in combination of irrigation oasis and natural oasis in arid regions, and provide decision-making references for the sustainable development, planning, and management of the SES in the SRB under various environmental challenges.

2. Materials and Methods

2.1. Study Area

The SRB is located in the central part of Gansu Province and the eastern edge of the Hexi Corridor; it forms one of the three arid inland basins in China. The upper reaches of the SRB are in the Qilian Mountain, and the middle reaches comprise the Wuwei sub-basin, with Liangzhou County as the capital. The main study area of Minqin Oasis is in the downstream area of the SRB (Figure 1). In its natural state, runoff flows into Minqin after being consumed in the middle sub-basin, then flows through the Caiqi section located upstream of Hongyashan Reservoir. Minqin Oasis is located between longitude 101°49′41″ E–104°12′10″ E and latitude 38°3′45″ N–39°27′37″ N [20]. Due to being sandwiched between the northwest Badain Jaran Desert and the southeast Tengger Desert, the ecology of Minqin Oasis is a vital natural barrier that prevents the two deserts from converging. It has a typical continental arid desert climate, with an average annual temperature of 7.8 °C, an average annual precipitation of 116.5 mm, and an average annual evaporation of 2308 mm during 1971–2010 [21]. The irrigation areas in Minqin Oasis mainly consist of the Dam, Quanshan, and Lake irrigation areas (Figure 1). In 2017, the GLD in Minqin Oasis was generally between 20 and 30 m in the irrigation area and was generally less than 10 m in the Qingtu Lake area [17]. The natural vegetation in the oasis–desert ecotone (ODE) of Minqin Oasis is largely temperate desert (arid desert) vegetation dominated by arid and super-arid shrubs and semi-shrubs. The main shrub species include Tamarix spp., Nitraria spp., Kalidium foliatum, Haloxylon ammodendron, Artemisia arenaria and Reaumuria soongorica. Arbors include Populus gansuensis, Populus euphratica, Angustifolia elaeagnus and Salix matsudana. Herbs include Achnatherum splendens, Phragmites australis, Bassia dasyphylla, Sophora alopecuroides, and Agriophyllum squarrosum [16,17,22,23].

2.2. Data

In this study, the meteorological data were collected from the National Meteorological Administration, and the runoff and water supply data were collected from the Wuwei Water Affairs Authority. The GLD data were collected from the Institute of Hydrogeological Engineering Geology, Gansu Provincial Bureau of Geology and Mineral Exploration and Development. There were 46 observation wells for phreatic aquifers. The wells were mostly distributed in irrigation areas (Figure 1). The time series for these data were monthly during 1980–2017. The land-use and land-cover data of 1985, 2008, and 2017 were derived from the thematic mapper (TM), enhanced thematic mapper (ETM), and operational land imager (OLI) data obtained by the US Landsat satellite-5, the US Landsat satellite-7, and the US Landsat satellite-8. The annual mean normalized difference vegetation index (NDVI) for 2000–2017 were also obtained from the Landsat satellites. The area of the Qingtu Lake wetland for 2009–2017 was obtained from both the Landsat satellites and the China Gaofen-1 satellite and Gaofen-2 satellite due to that the high resolution of Gaofen satellites has great advantage in the interpretation of small areas. The image map data were derived by atmospheric correction, geometric correction, image fusion, image stitching, and band calculation [24]. The species richness data and corresponding GLD were from the natural vegetation quadrat survey, in which the species richness is defined as the number of species within a quadrat. The per-capita income data of Minqin County during 2009–2017 were obtained from the Statistical Yearbook of Wuwei City.

2.3. Methods

2.3.1. Mathematical Statistics Method

The mathematical statistics method studies the regularity of the inter-relationships between the sample and the population, as well as the regularity of the inter-relationships among various related factors. A linear trend analysis and a correlation analysis was applied in this study.
  • Linear trend analysis
Linear trend analysis is a highly general and therefore very flexible data-analytic system that can be used for studying specific quantitative relationships between variables [25]. It is normally used to establish mathematical models that reflect the specific quantitative relationships between geographic elements, namely regression models [26]. The form of the relationship is not constrained; it may be univariate or multivariate. In this study, a univariate linear regression model was used to examine the variation rates of the air temperature, precipitation, runoff, the GLD of each observation well, and the wetland area of Qingtu lake. The least squares estimation was used for the parameter estimation [26].
2.
Correlation analysis
Correlation analysis is a statistical analysis method that investigates the relationship between two or more random variables of equal status. The general meaning of the concept is that knowledge with regard to one of the variables carries information about the other variable [27]. It is the process of describing the degree of closeness between objective things and expressing it with appropriate statistical indicators [26]. A correlation analysis was used to analyze the relationships between the elements of the SES in this study.

2.3.2. GLD—Natural Vegetation Quadrat Joint Survey

The GLD—natural vegetation ecology quadrat joint survey was adapted from previously published guidelines [28] while considering the actual distribution of the groundwater-dependent vegetation communities in the SRB. Therefore, this survey added GLD measurements near each vegetation quadrat. If no groundwater observation well was available near the vegetation quadrat, the investigators would dig a simple groundwater measuring well on site, and GLD was measured once the groundwater level had stabilized. The survey was conducted in August and September 2018. The procedure used in the joint survey is described in Liu et al. [17].

2.3.3. Fuzzy Comprehensive Evaluation Method

The fuzzy comprehensive evaluation method was used to assess the resilience of the SES during the post-CASRB period of Minqin Oasis. The theory was introduced as follows [26,29].
For two finite sets, U = U 1 , U 2 , ,   U m and V = V 1 , V 2 , ,   V m , where U represents a set of indicators based on which comprehensive evaluation is performed and V is a set of judgments, a fuzzy comprehensive evaluation is a fuzzy transformation process as follows:
B = A R
In Equation (1), A is a fuzzy subset of U, and the evaluation result B is a fuzzy subset of V. A = a 1 , a 2 , ,   a m , 0 b j 1 , where a i is the degree of membership of U to A. a i represents the relative importance (weight) of the indicator U i among all of the evaluation indicators, and also represents the ability of U i to determine the grade, satisfying i = 1 m a i = 1. b j is the degree of membership of grade V j to B, representing a comprehensive evaluation result.
The fuzzy transformation matrix is:
R = [ r 11 , r 12 , r 1 n r 21 , r 22 , r 2 n r m 1 , r m 2 , r m n ] ,
where r i j is the degree of membership of grade V j for U i , and thus, the ith row R i = ( r i 1 , r i 2 , , r i n ) in the matrix R represents the evaluation results of U i .
In this study, the indicators used for comprehensive evaluation were determined based on the factors influencing the sustainable development of SES in Minqin. The evaluation procedure involved the following steps: (1) selection of the resilience indicators of the SES, (2) determination of grading values and the corresponding rating scores, (3) determination of the weight for each resilience indicator, and (4) composite evaluation index calculation of the resilience of SES.

3. Results

3.1. Changes in Elements of Climate, Water Resources, and Ecology

3.1.1. Variations in Natural Hydro-Climatic Elements

Annual air temperature in Minqin showed a significant upward trend under global warming. The rate of increase was 0.4 °C/10a during 1956–2017 (Figure 2a). Temporally, the air temperature increased slowly during 1956–1986, then rose significantly after 1987, and the rising trend reached a new level in 1998. Annual precipitation showed a nonsignificant increase rate of 2.8 mm/10a (Figure 2b). Temporally, precipitation decreased in the 1960s, then increased in the 1970s, and then decreased again from the 1980s, finally increasing since 1994. Pan evaporation (E601) showed a nonsignificant increase rate of 9.8 mm/10a (Figure 2c). The runoff at the mountain pass in the upper SRB showed no clear trend. However, the runoff had a high flow rate before 1970, then entered a normal flow period during the next two decades before experiencing a low flow period in the 1990s. The runoff has increased since 2003 (Figure 2d). This was in accordance with the conclusion that the largest tributary of the Shiyang River entered a wet period in 2003 by Song et al. [30]. The natural runoff at the Caiqi section would eventually flow into the Minqin sub-basin after being consumed in the middle SRB. There was a significant decreasing trend with the rate of 81 million cubic meters of water per decade (Figure 2d).

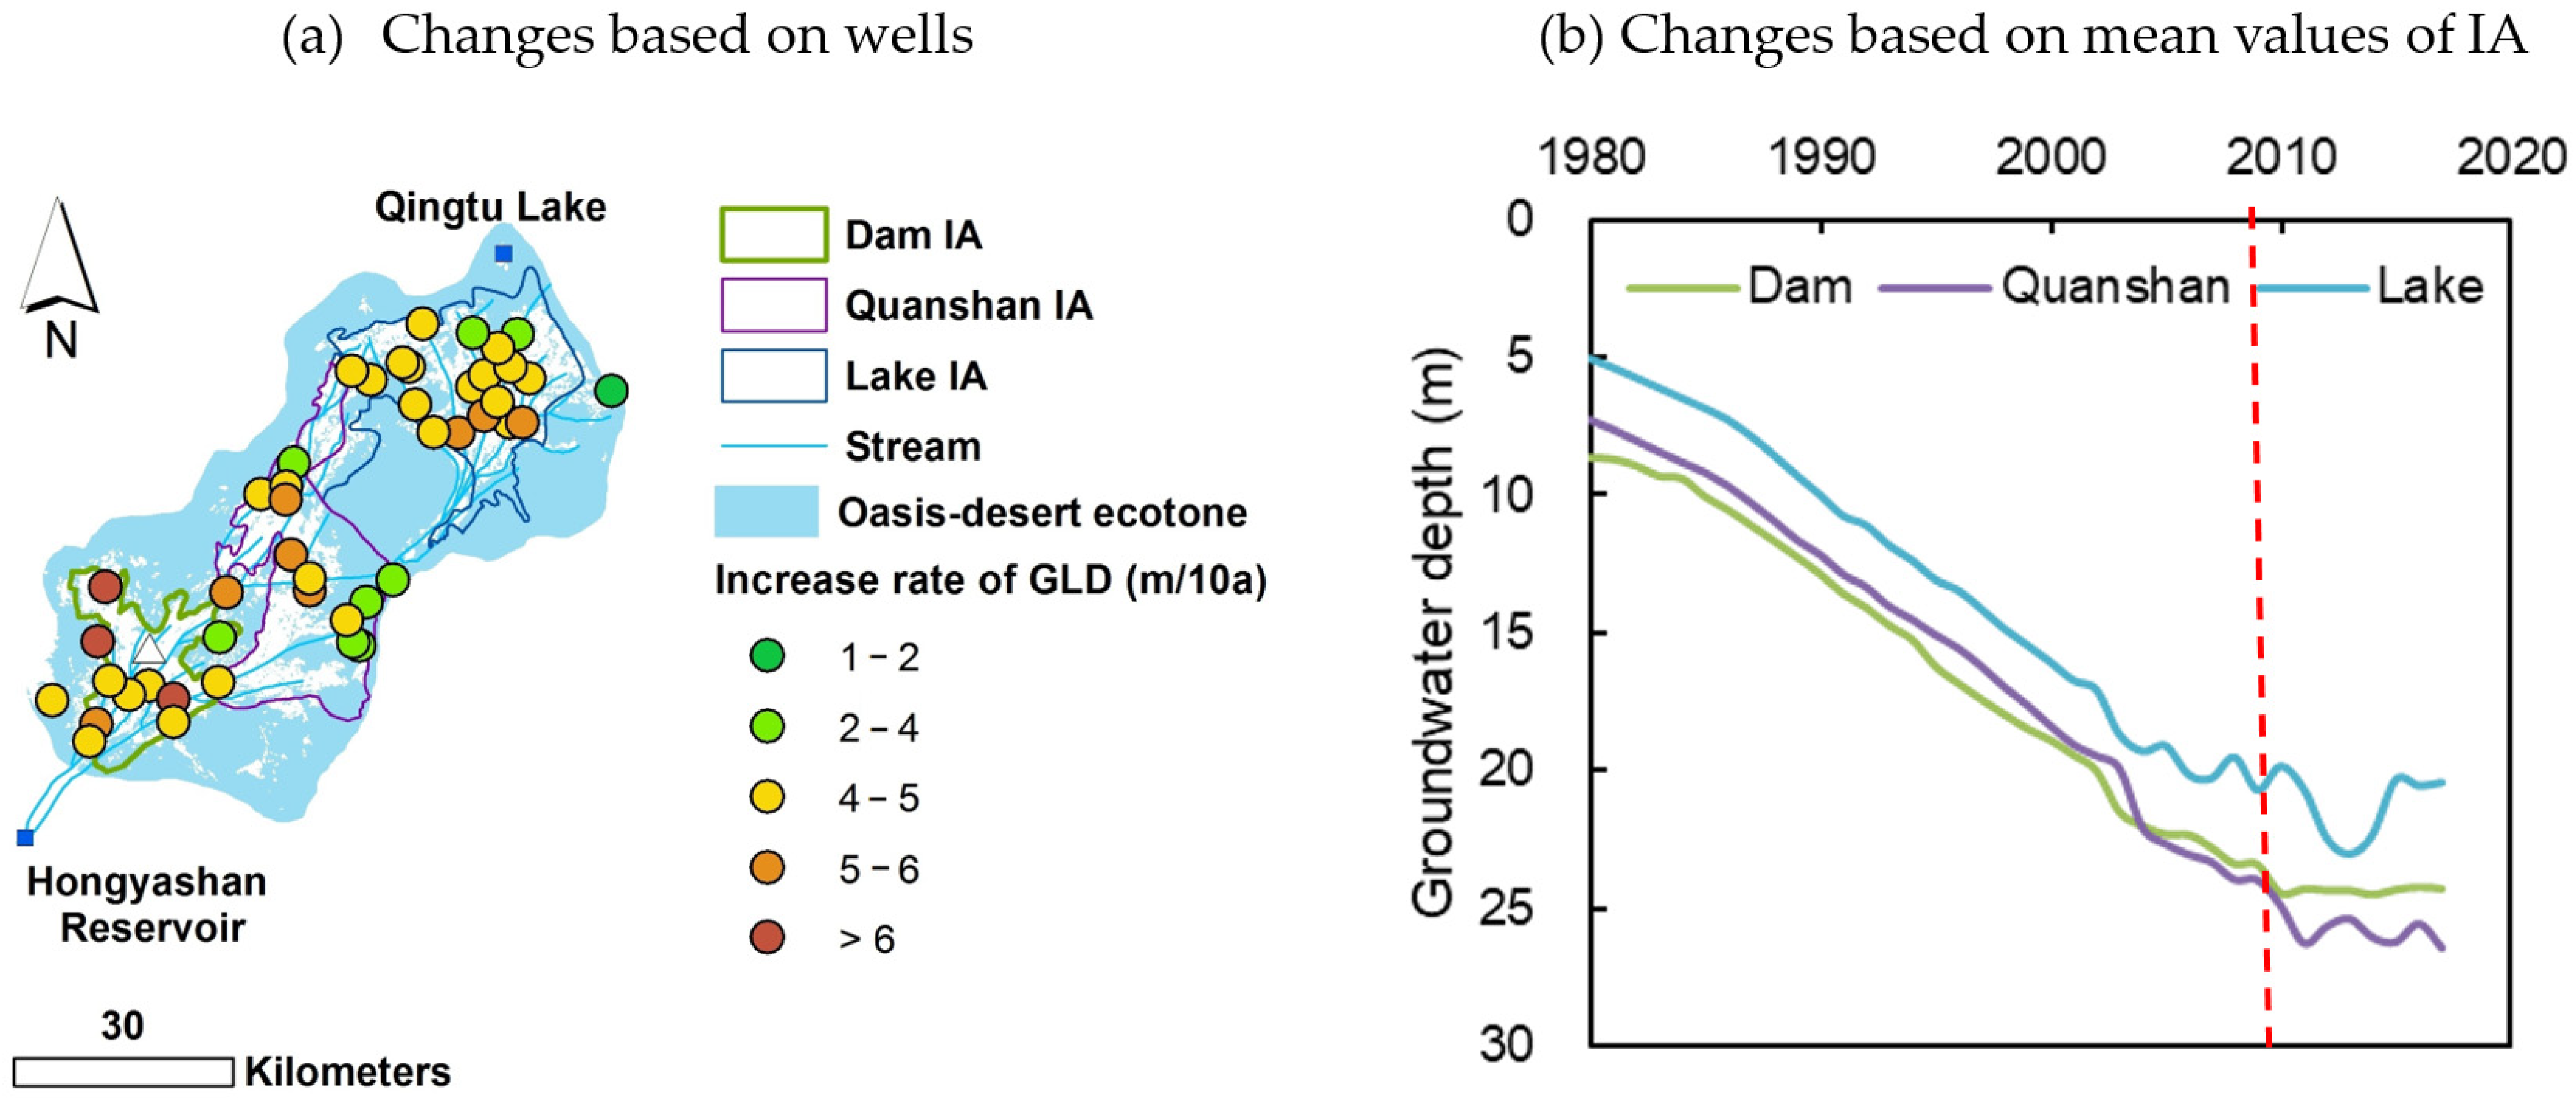
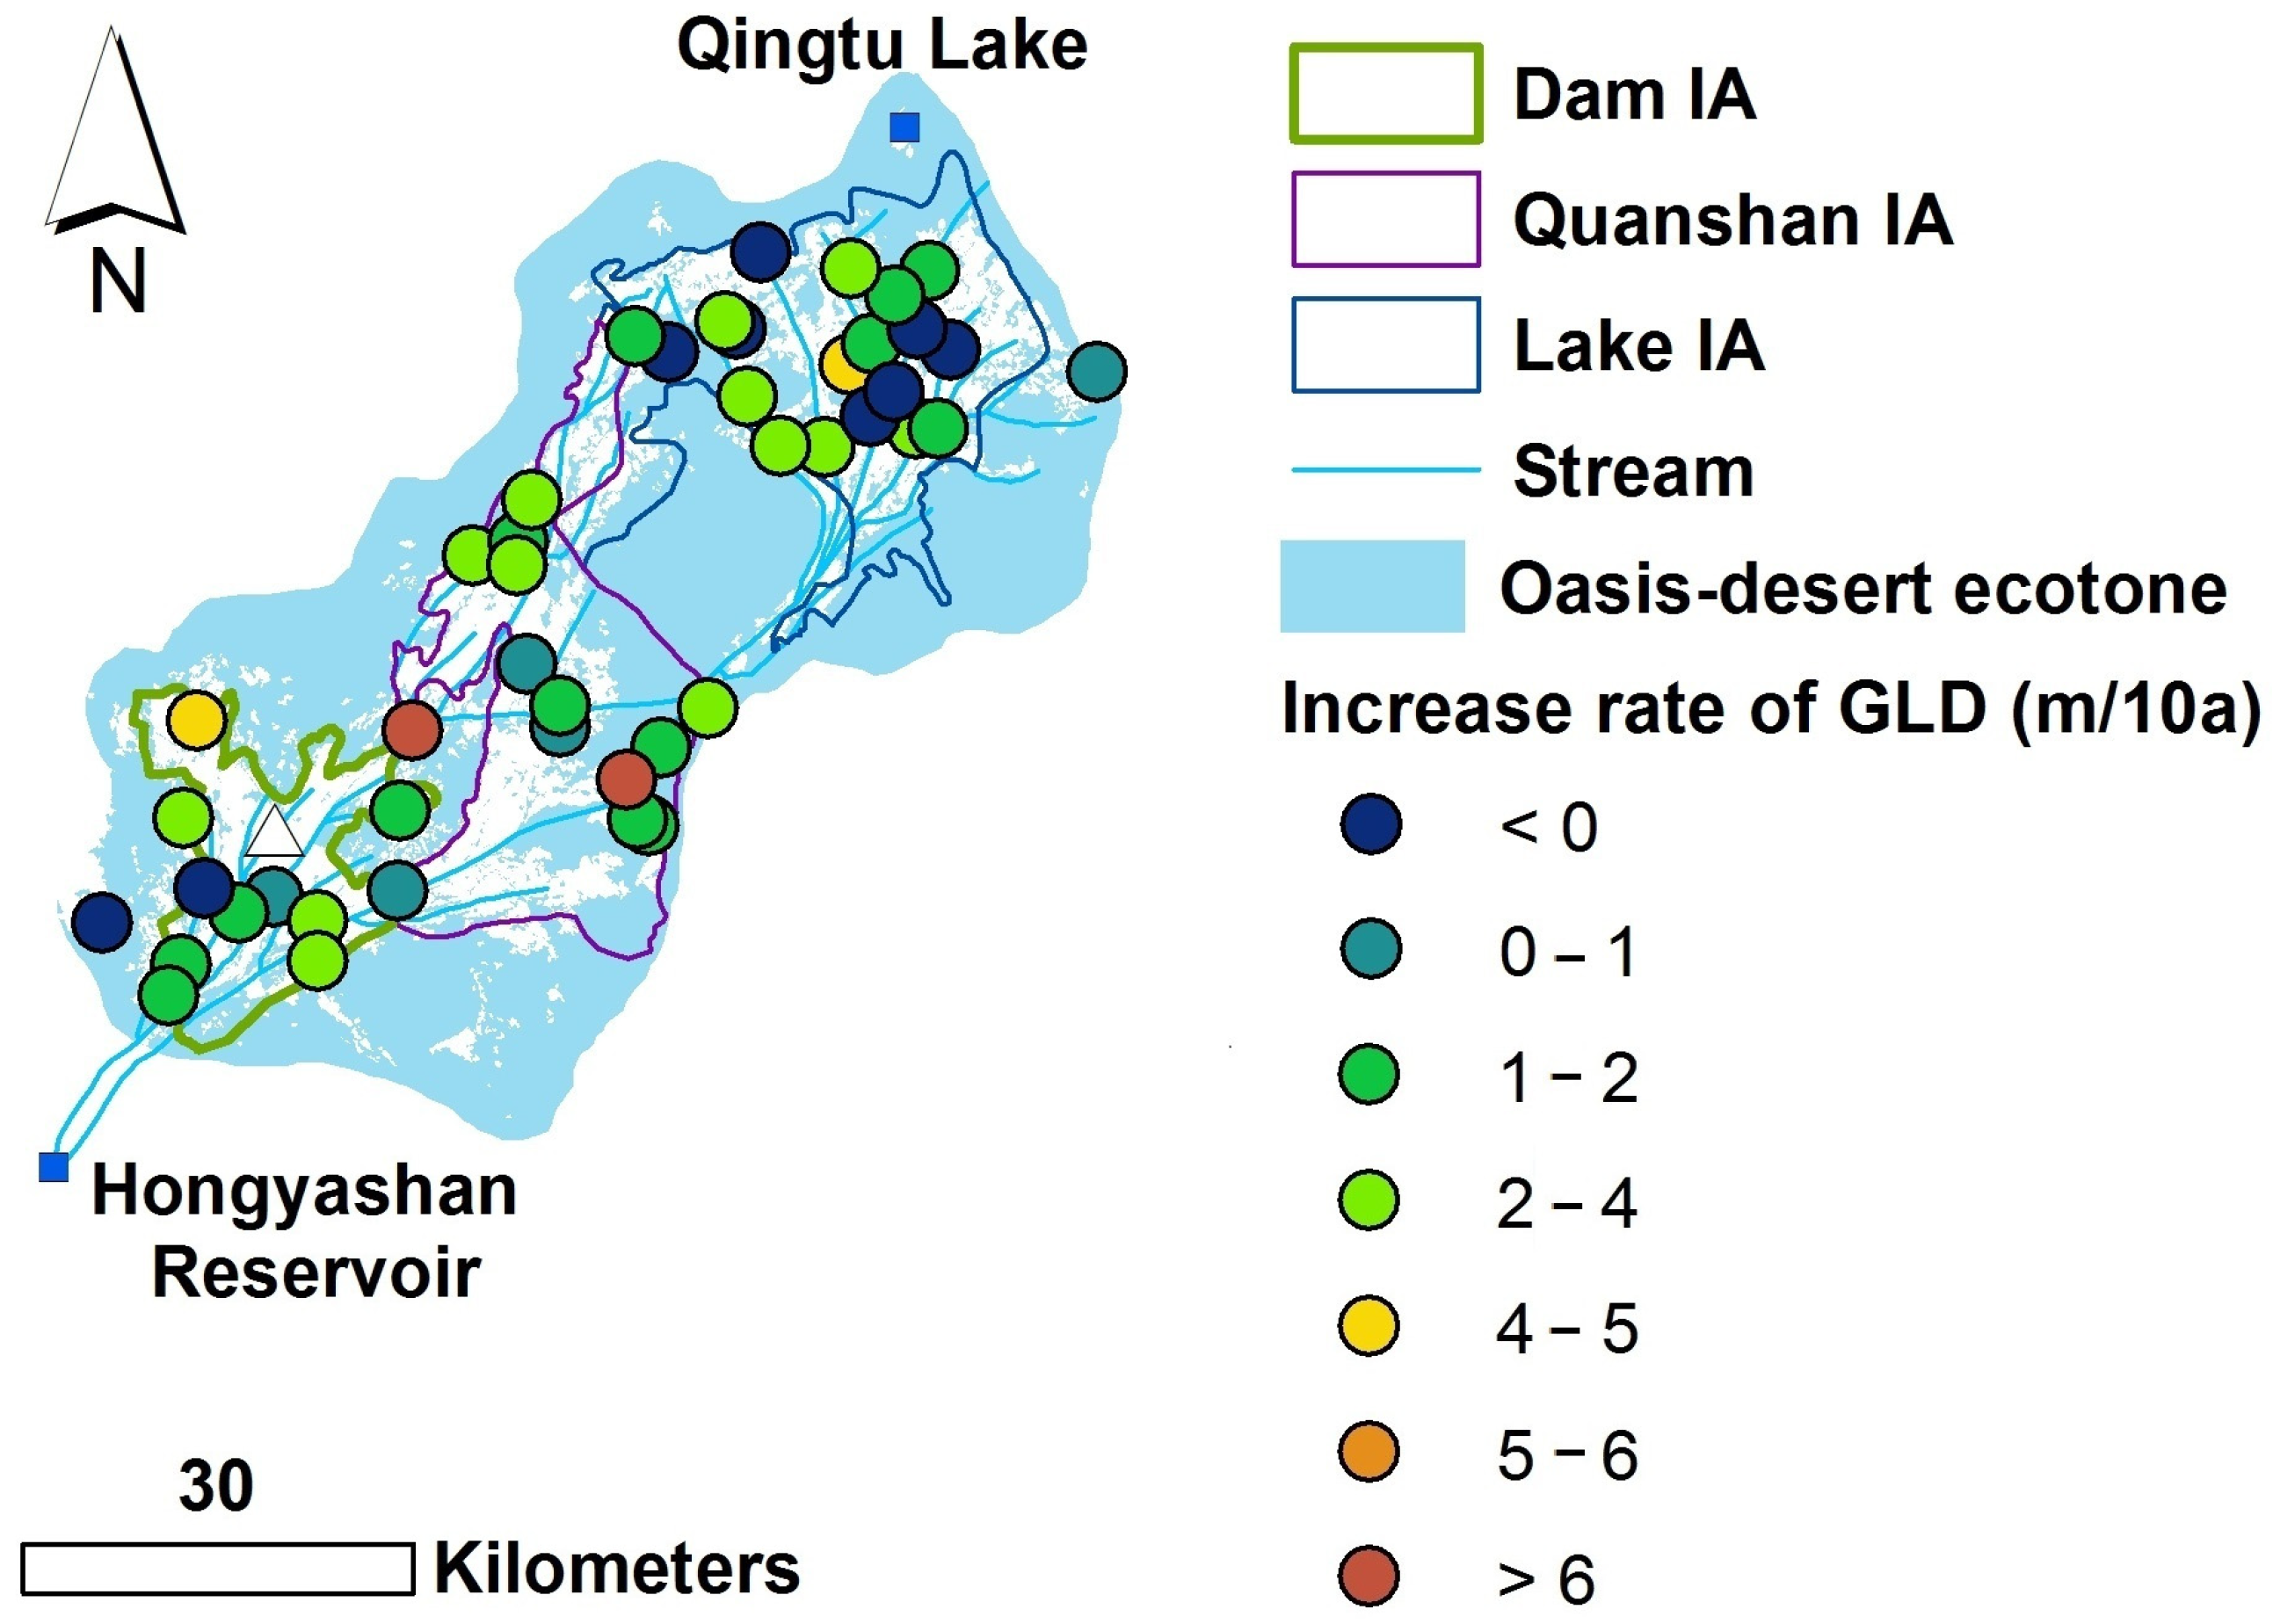
3.1.2. Changes in Groundwater Depth

GLD increased dramatically during 1980–2017 (Figure 3). The trend of the GLD at all of the observation wells was significant at the 0.05 level. The increase rates of the GLD of the wells were mostly between 4 m/10a and 6 m/10a, and the rates were greater in the center of the irrigation areas, while becoming less in the lake irrigation area and the eastern peripheral areas of Minqin Oasis (Figure 3a). On the irrigation area scale, the increase rate was larger in the Dam and Quanshan irrigation areas, while being relatively smaller in the lake irrigation area (Figure 3b). Temporally, the change in the GLD experienced two periods (Figure 3b); i.e., the rapid increasing period before the implementation of the CASRB, and a stable or recovery trend from then on, was due to the initial effect of the implementation of CASRB.

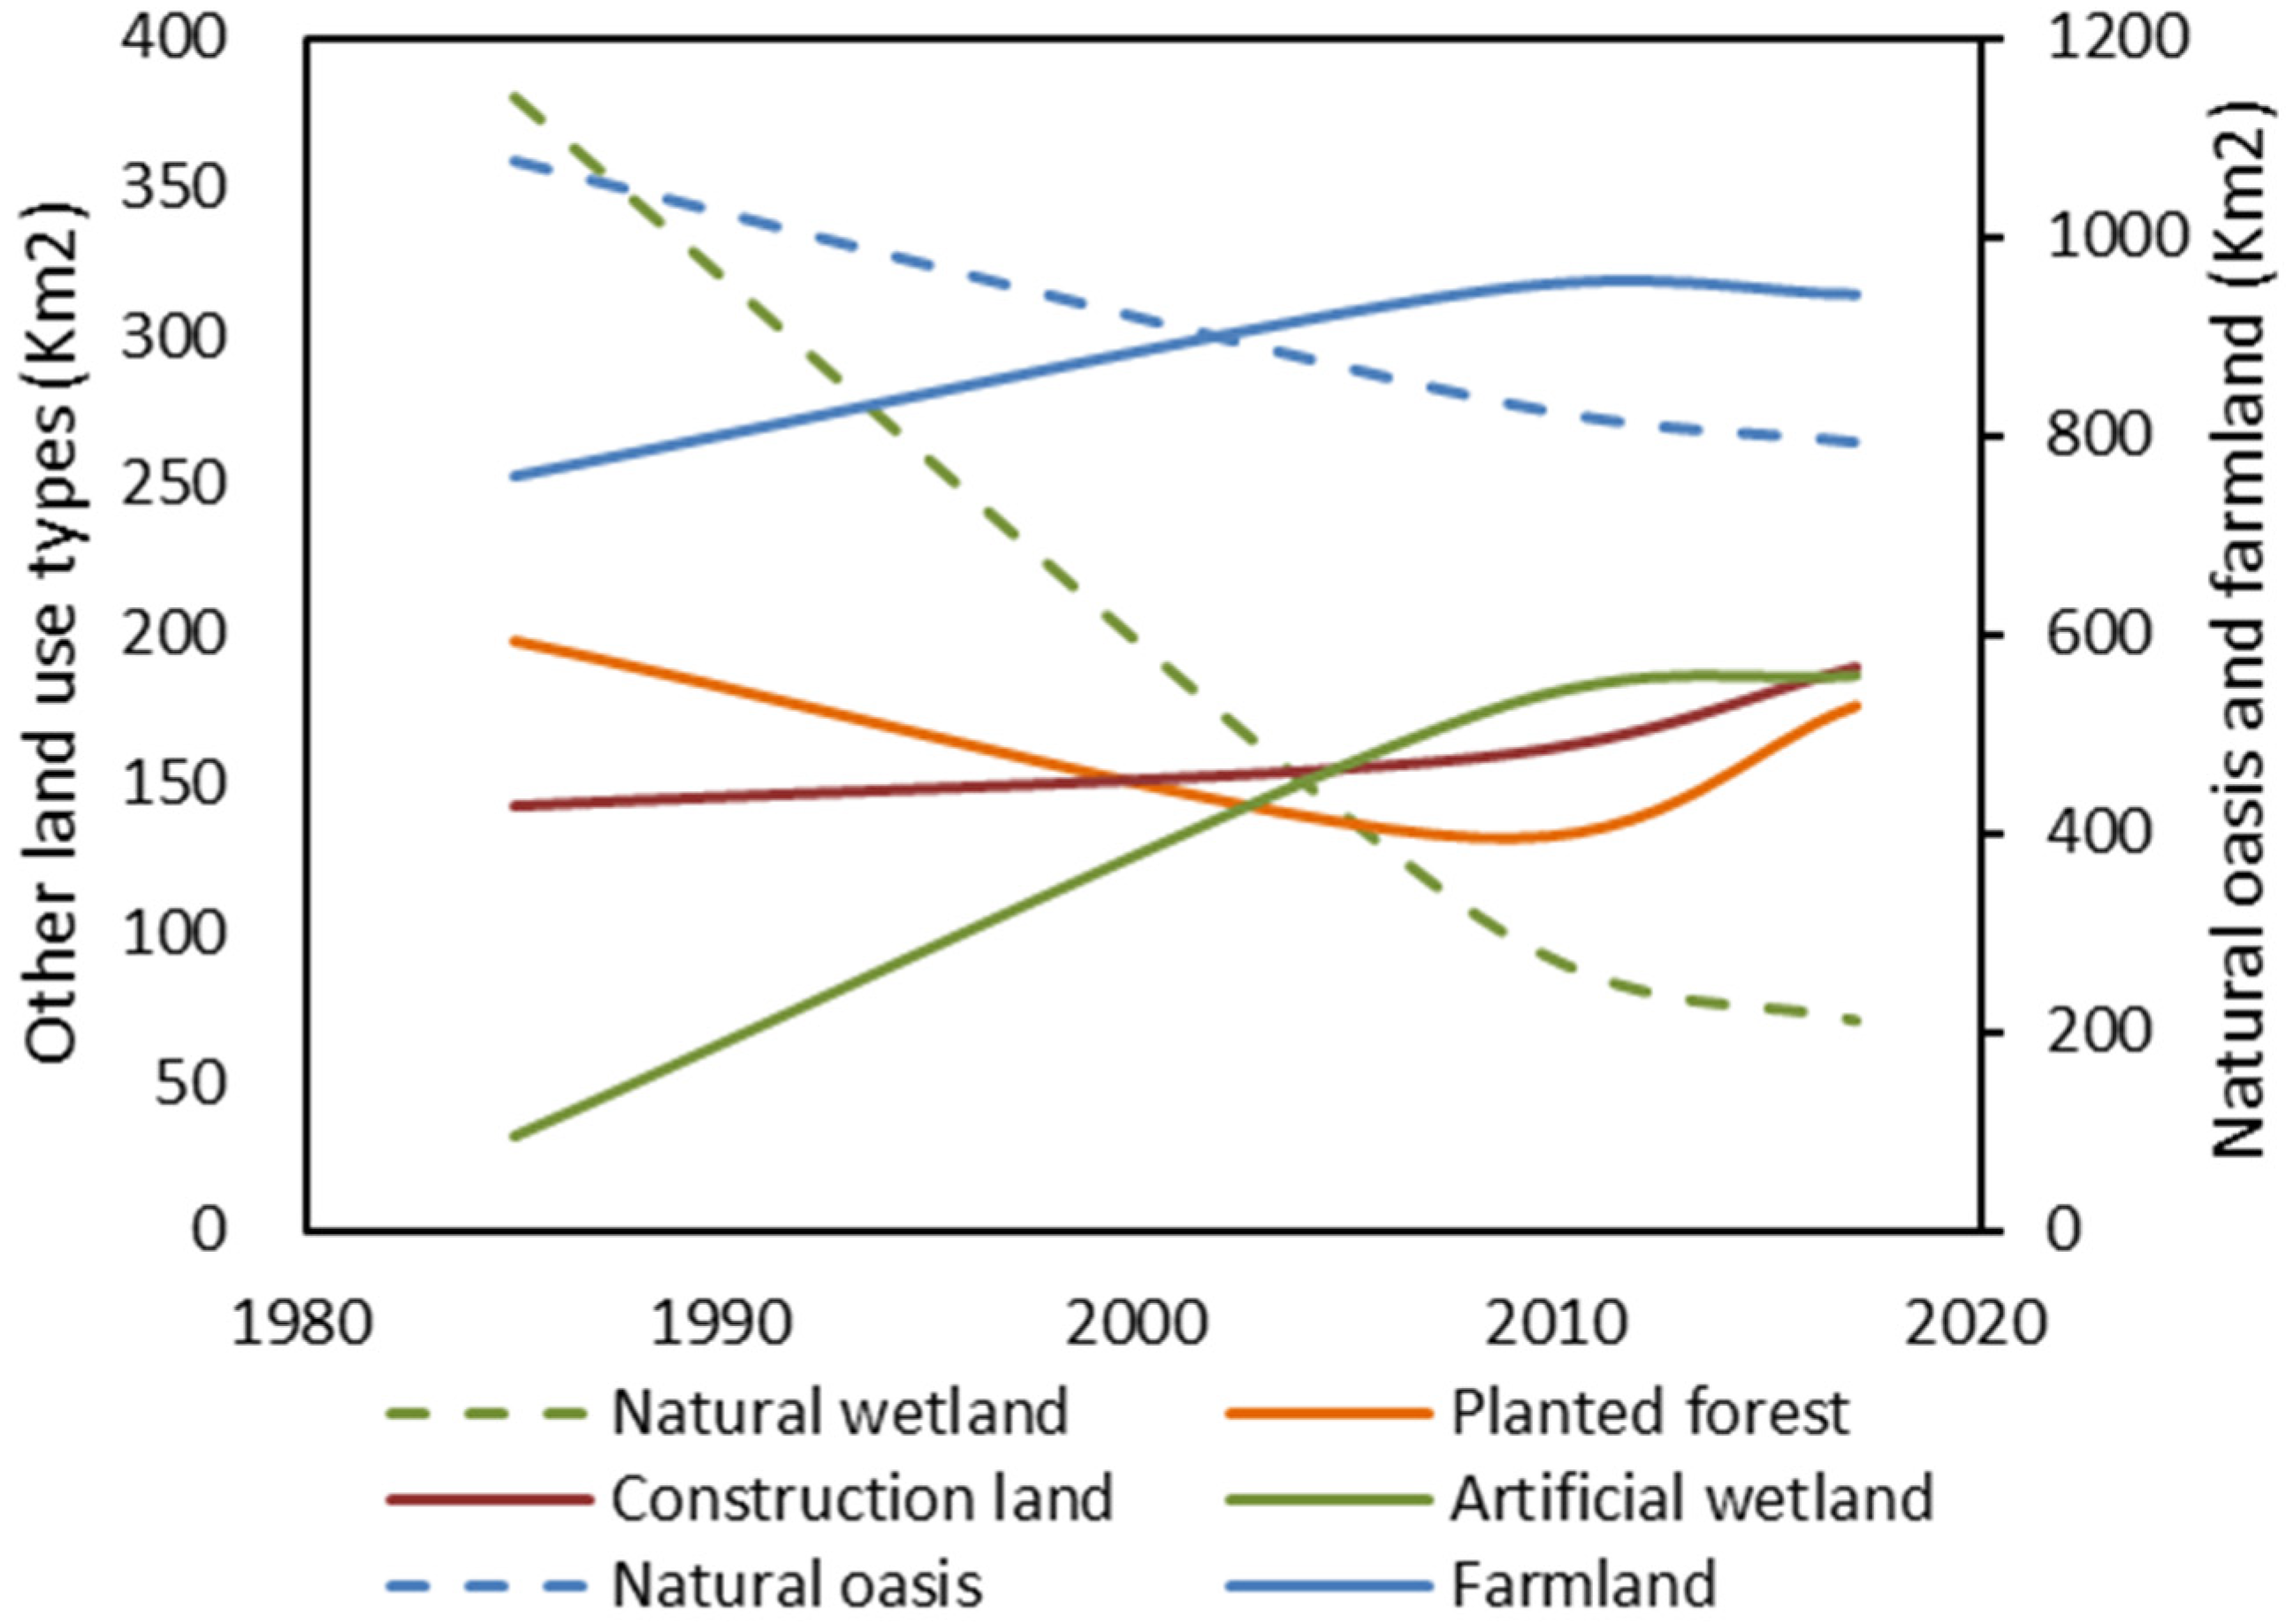
3.1.3. Changes in Land Use and Land Cover (LULC)

The area of the natural oasis and the natural wetland showed decreasing trends from 1985 to 2017. The area of the natural oasis in 2017 was just 78% of that in 1985, and the area of the natural wetland in 2017 was just 18.5% of that in 2017 (Figure 4). Temporally, the decreasing trend became milder after 2008. In the meantime, the area of the artificial oasis, including the farmland and the artificial wetland, increased dramatically until 2008, when the trend leveled off (Figure 4). The farmland expanded by a factor of 1.25 from 1985 to 2008; after which the area was stable from 2008 to the present. The area of the artificial wetland was 5.8 times that in 1985. Furthermore, the area of planted forest (including arbors, shrubs, and grasses) showed an initial decreasing trend before 2008, and then an increasing trend from 2008 (Figure 4). There was also a turning-point year in the land-use type at around 2008, the year after the implementation of the CASRB. The construction land has always shown an increasing trend (Figure 4).

3.1.4. Changes in NDVI in Oasis–Desert Ecotone

The annual regional mean value of NDVI was between 0.07 and 0.10 during 2000–2011 (Figure 5). This indicated that there was almost no vegetation growth in large areas of the oasis–desert ecotone, and most of the area experienced desertification. From 2011 to 2017, the annual mean NDVI of natural vegetation increased from 0.09 to 0.21, reflecting an improvement in vegetation growth. This was due to the artificial afforestation implemented by the CASRB to prevent the desertification [16] and the restoration of the groundwater ecological function in the areas with a shallow groundwater depth [17].

3.2. Interactions among the Elements of Social and Ecological Systems

3.2.1. Farmland–Groundwater Abstraction–Groundwater Depth–Natural Oasis

With the dry climate and the shortage of surface water, the SRB is a region whose socio-economic development, especially regarding agricultural production, was primarily supported by groundwater irrigation. Therefore, the interactions between the land-use type and the groundwater extraction in Minqin Oasis were analyzed based on the data before 2008, when the CASRB had not been fully implemented. The results showed that the area of farmland had a high positive correlation with the groundwater extraction; when the area of the farmland increased, the groundwater abstraction increased (Figure 6b). This finding indicated that groundwater was extracted primarily for agricultural irrigation. Furthermore, the GLD had a strong correlation with the accumulated groundwater extracted during the period of overexploitation. Every increase of 10 million cubic meters of water extracted from the aquifer would lead to a 3 cm decline in the GL (Figure 6d). Eventually, the GL declined beyond the level where most of the surface vegetation could reach, thereby leading to a shrinkage of the natural oasis (Figure 6c). Every increase of 1000 square kilometers of farmland would lead to a decrease of 957 square kilometers of natural oasis (Figure 6a). This indicated that the expansion of the irrigated farmland was the dominant factor to the significant decline in GL and the degradation of the groundwater-dependent vegetation in Minqin Oasis.
The accumulated groundwater extraction instead of annual groundwater extraction was adopted when analyzing the interactions with the GLD. The reasons were as follows. When the groundwater is over-extracted for a long period, this has a direct and accumulated impact on the GL due to the low rate of the aquifer recharge. In other words, the gap between the extraction and the input continuously increased, and thus the GL declined.

3.2.2. The Relationship of Groundwater to the Main Vegetation Indicators

An ecologically suitable GLD was estimated by analyzing the relationship between GLD with the NDVI of the natural vegetation in the ODE during 2000–2017. The results showed that in 94% of the years considered, the GLD corresponding to the maximum value of NDVI ranged from 2.2 to 3.7 m, and the mean GLD corresponding to the peak value of NDVI was 3.0 m (Figure 7a). After the GLD had increased more than 5.0 m, the value of NDVI was generally less than 0.1 (except for several years the vegetation was planted since 2012), and there was no significant correlation between the GLD and NDVI. When the GLD was less than 5 m, the two indicators were significantly negatively correlated, with a correlation coefficient (r) reaching 0.85 (Figure 7c) [17]. This was in agreement with the results of Cao et al. [16]. Furthermore, an ecological survey of vegetation quadrats and groundwater was conducted, and the results indicated that the species richness reached a maximum at a GLD of about 3 m. That is to say, with the GLD increased from 1 m to 3 m, species richness increased, peaking at approximately 3 m at 10 species; and then slowly become less as the GLD increased greater than 3 m (Figure 7b) [17]. Due to the sparse vegetation in the northwest desert area, vegetation development was only considered when the NDVI value of vegetation is greater than a certain value, such as in Ejina Banner Oasis, where the index was bounded by 0.08 [31]. Therefore, when the GLD exceeded 10 m, there was almost no vegetation, and the transient vegetation growth was influenced more by individual rainfall events and shallow soil moisture [16,17]. In addition, the close relationship between the GLD and vegetation was only observed for soil salinity below 5 g/kg. Our research work demonstrated that soil salinity may also be a restrictive factor for the growth and development of vegetation. The vegetation coverage began to decrease when the soil salinity was greater than 5 g/kg, and when this reached 20 g/kg, the vegetation nearly disappeared and desertification occurred [32].
All in all, under arid climate conditions and without irrigation, there can be no agriculture. The rapid increases in the population, farmland area, and intense agricultural irrigation activities have led to the excessive use of groundwater resources. These disorganized ways of utilizing water and land resources were the direct cause of the significant increase in GLD and the main reason for the degradation and shrinkage of natural vegetation in the ODE. This seriously restricted the sustainable development of SES in SRB. The ODE plays an important role in the stability of the oasis and the control of desertification, despite it being a key ecological sensitivity zone. Therefore, it is extremely important to protect and restore the ecosystem in ODE.

4. Discussion

4.1. The Effects of the Nature-Based Solutions

Based on the concept of NbS, the local government adopted a series of measures to protect and restore the groundwater resources and the GDEs in Minqin Oasis. This effort was called the CASRB and was launched in 2007. The concrete measures primarily consisted of increasing the surface water supply through water transfer projects, decreasing groundwater mining by locking the pumping wells, and formation of water user associations, planting natural vegetation instead of crops, enhancing industrial water-saving technologies, and the adjustment of the agricultural planting structure by planting low-water-consuming crops [18,33]. These measures, combining the recovery of GLD with the afforestation project, aim to gradually restore the natural ecological function of the groundwater resources and eventually promote the resilience of the SES.
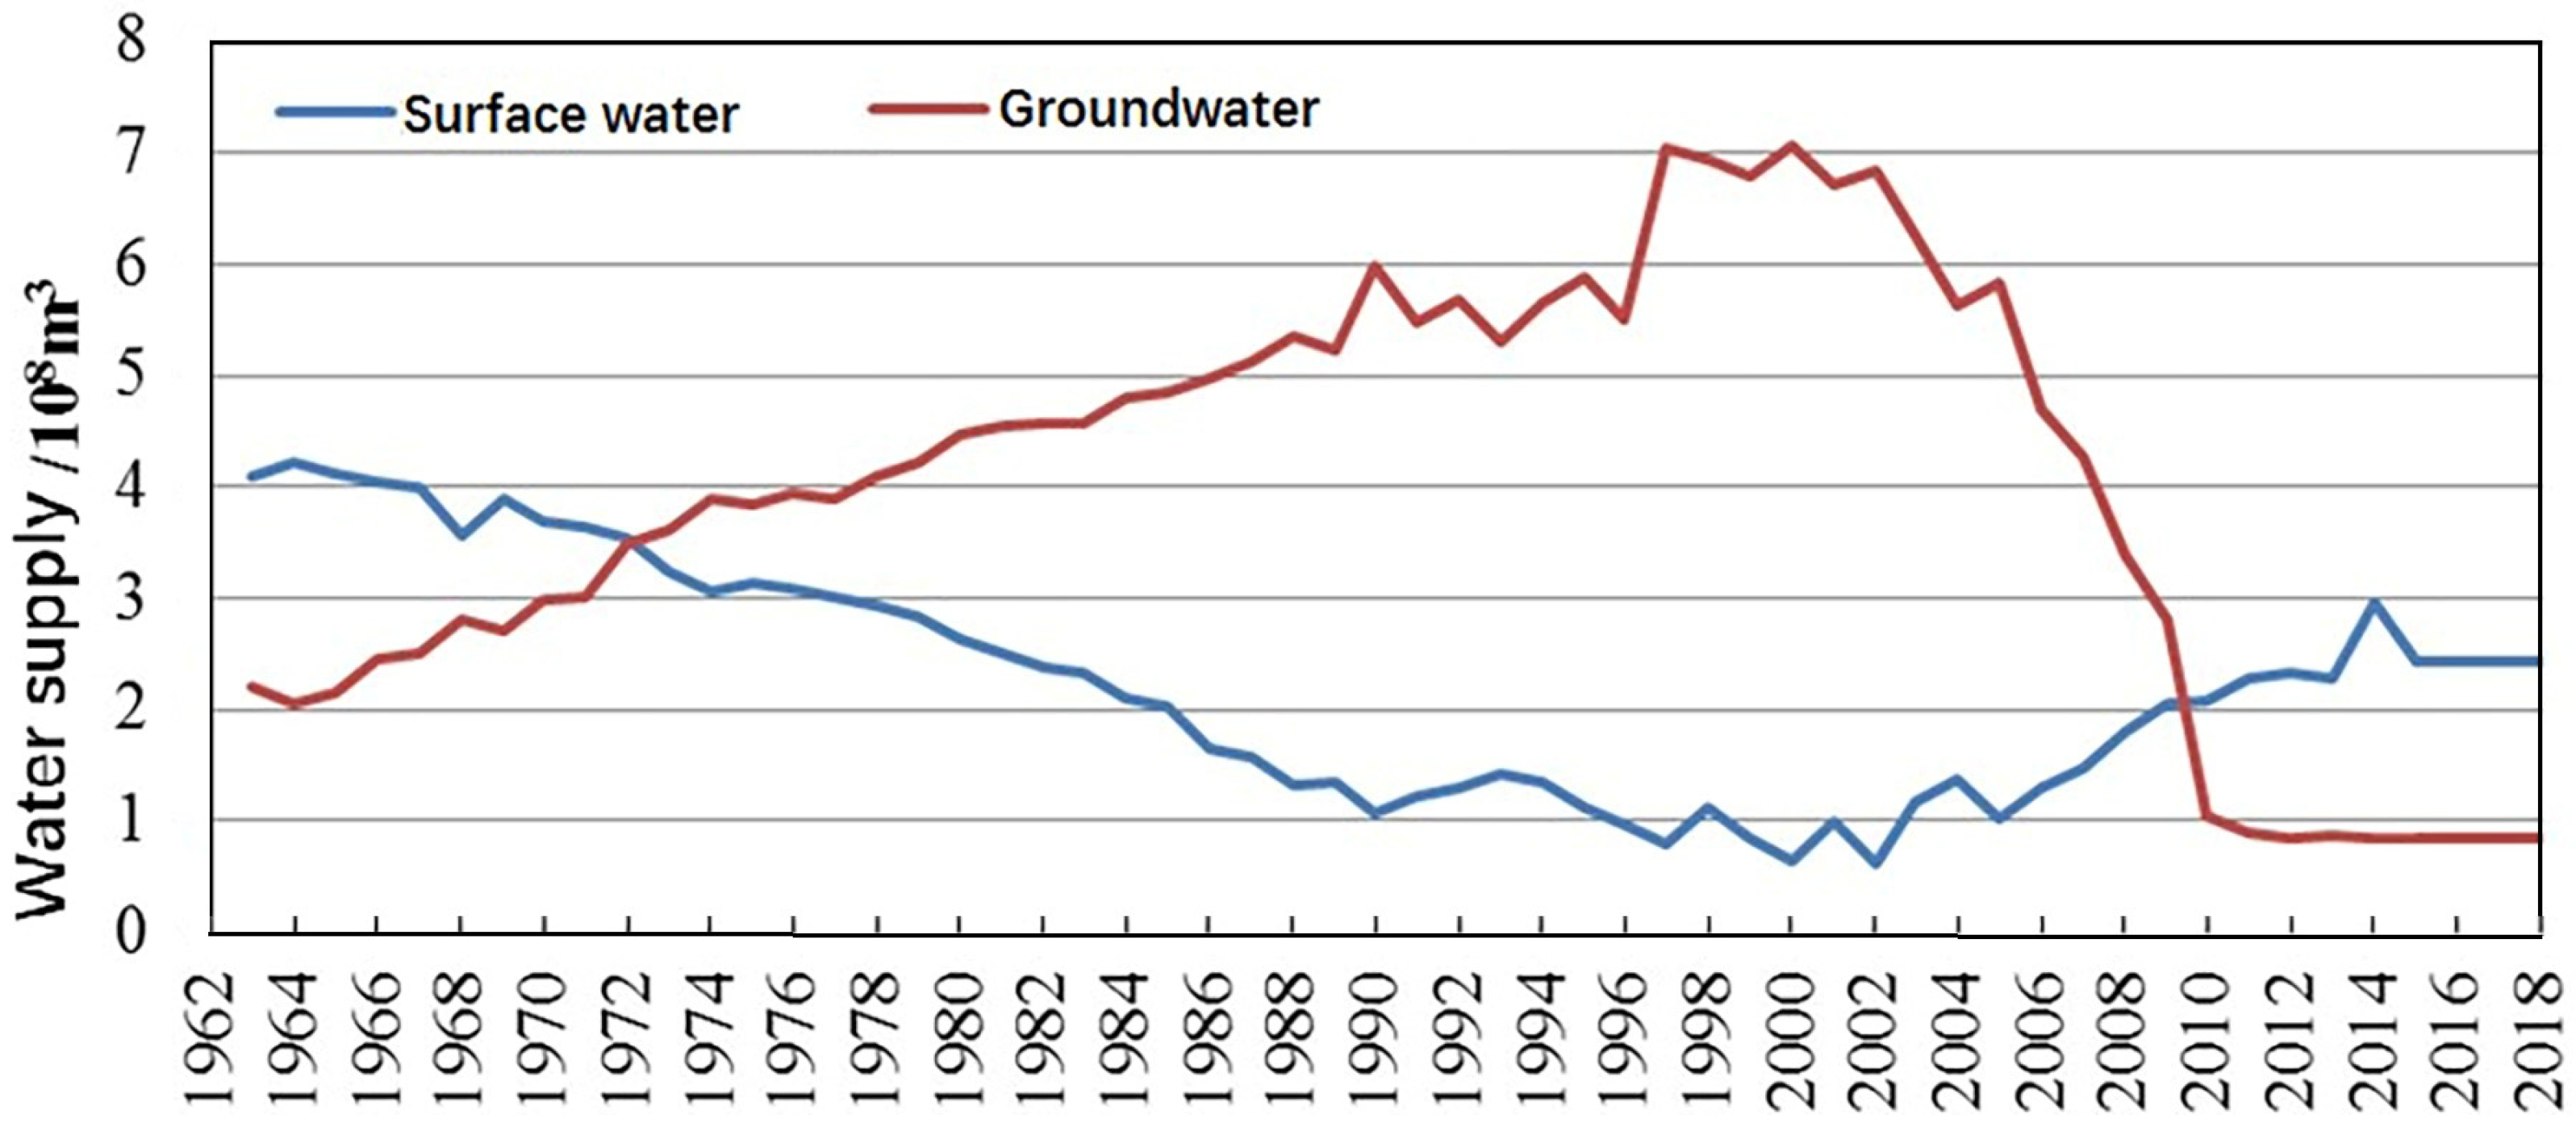
  • The proportions of surface water and groundwater to total water supply amounts
Water transfer projects have greatly increased the amount of surface water entering Minqin Oasis. The effort primarily involved two water transfer projects [18,34]. The first was the Jingdian Project Phase II that diverted water from the Yellow River starting in 2001; the second was diverting water from the Xiying River—a tributary of the Shiyang River—that began in 2006. With the additional water supply from the two water diversion projects, the amount of water diverted continued to increase, and the cross-sectional flow at Caiqi station showed a significant increasing trend [34]. In 2019, the cross-sectional flow reached 401 million m3, almost the same as that in the 1970s (Figure 2b), of which 208 million m3 was the amount of diverted water.
In addition to the measures for reducing groundwater extraction, the consumption of groundwater for agriculture continued to decrease. The proportion of the water supply used for agriculture gradually became less than 90% [34]. The groundwater exploitation has gradually decreased and stabilized. Since 2009, the groundwater extraction has been constantly below 110 million m3. Analysis on the statistical data from the Wuwei Water Authority illustrated that the water supply composition of Minqin has been transformed from primarily emphasizing on groundwater before 2009 to emphasizing on both surface water and groundwater (Figure 8).
2.
Groundwater level recovery
By increasing the surface water supply and reducing groundwater exploitation, as well as implementing other water-saving policies and technologies, the GL has shown a recovery trend since 2009 compared to the previous period (Figure 3 and Figure 9). The increasing rate of the GLD became less, from mostly between 4 m/10a and 6 m/10a (Figure 3a) to less than 4 m/10a (Figure 9), especially in the lake irrigation area, where the GLD of parts of the observation wells began to show a negative change trend. The CASRB thus has had a remarkable effect on the prevention of increased GLD.
3.
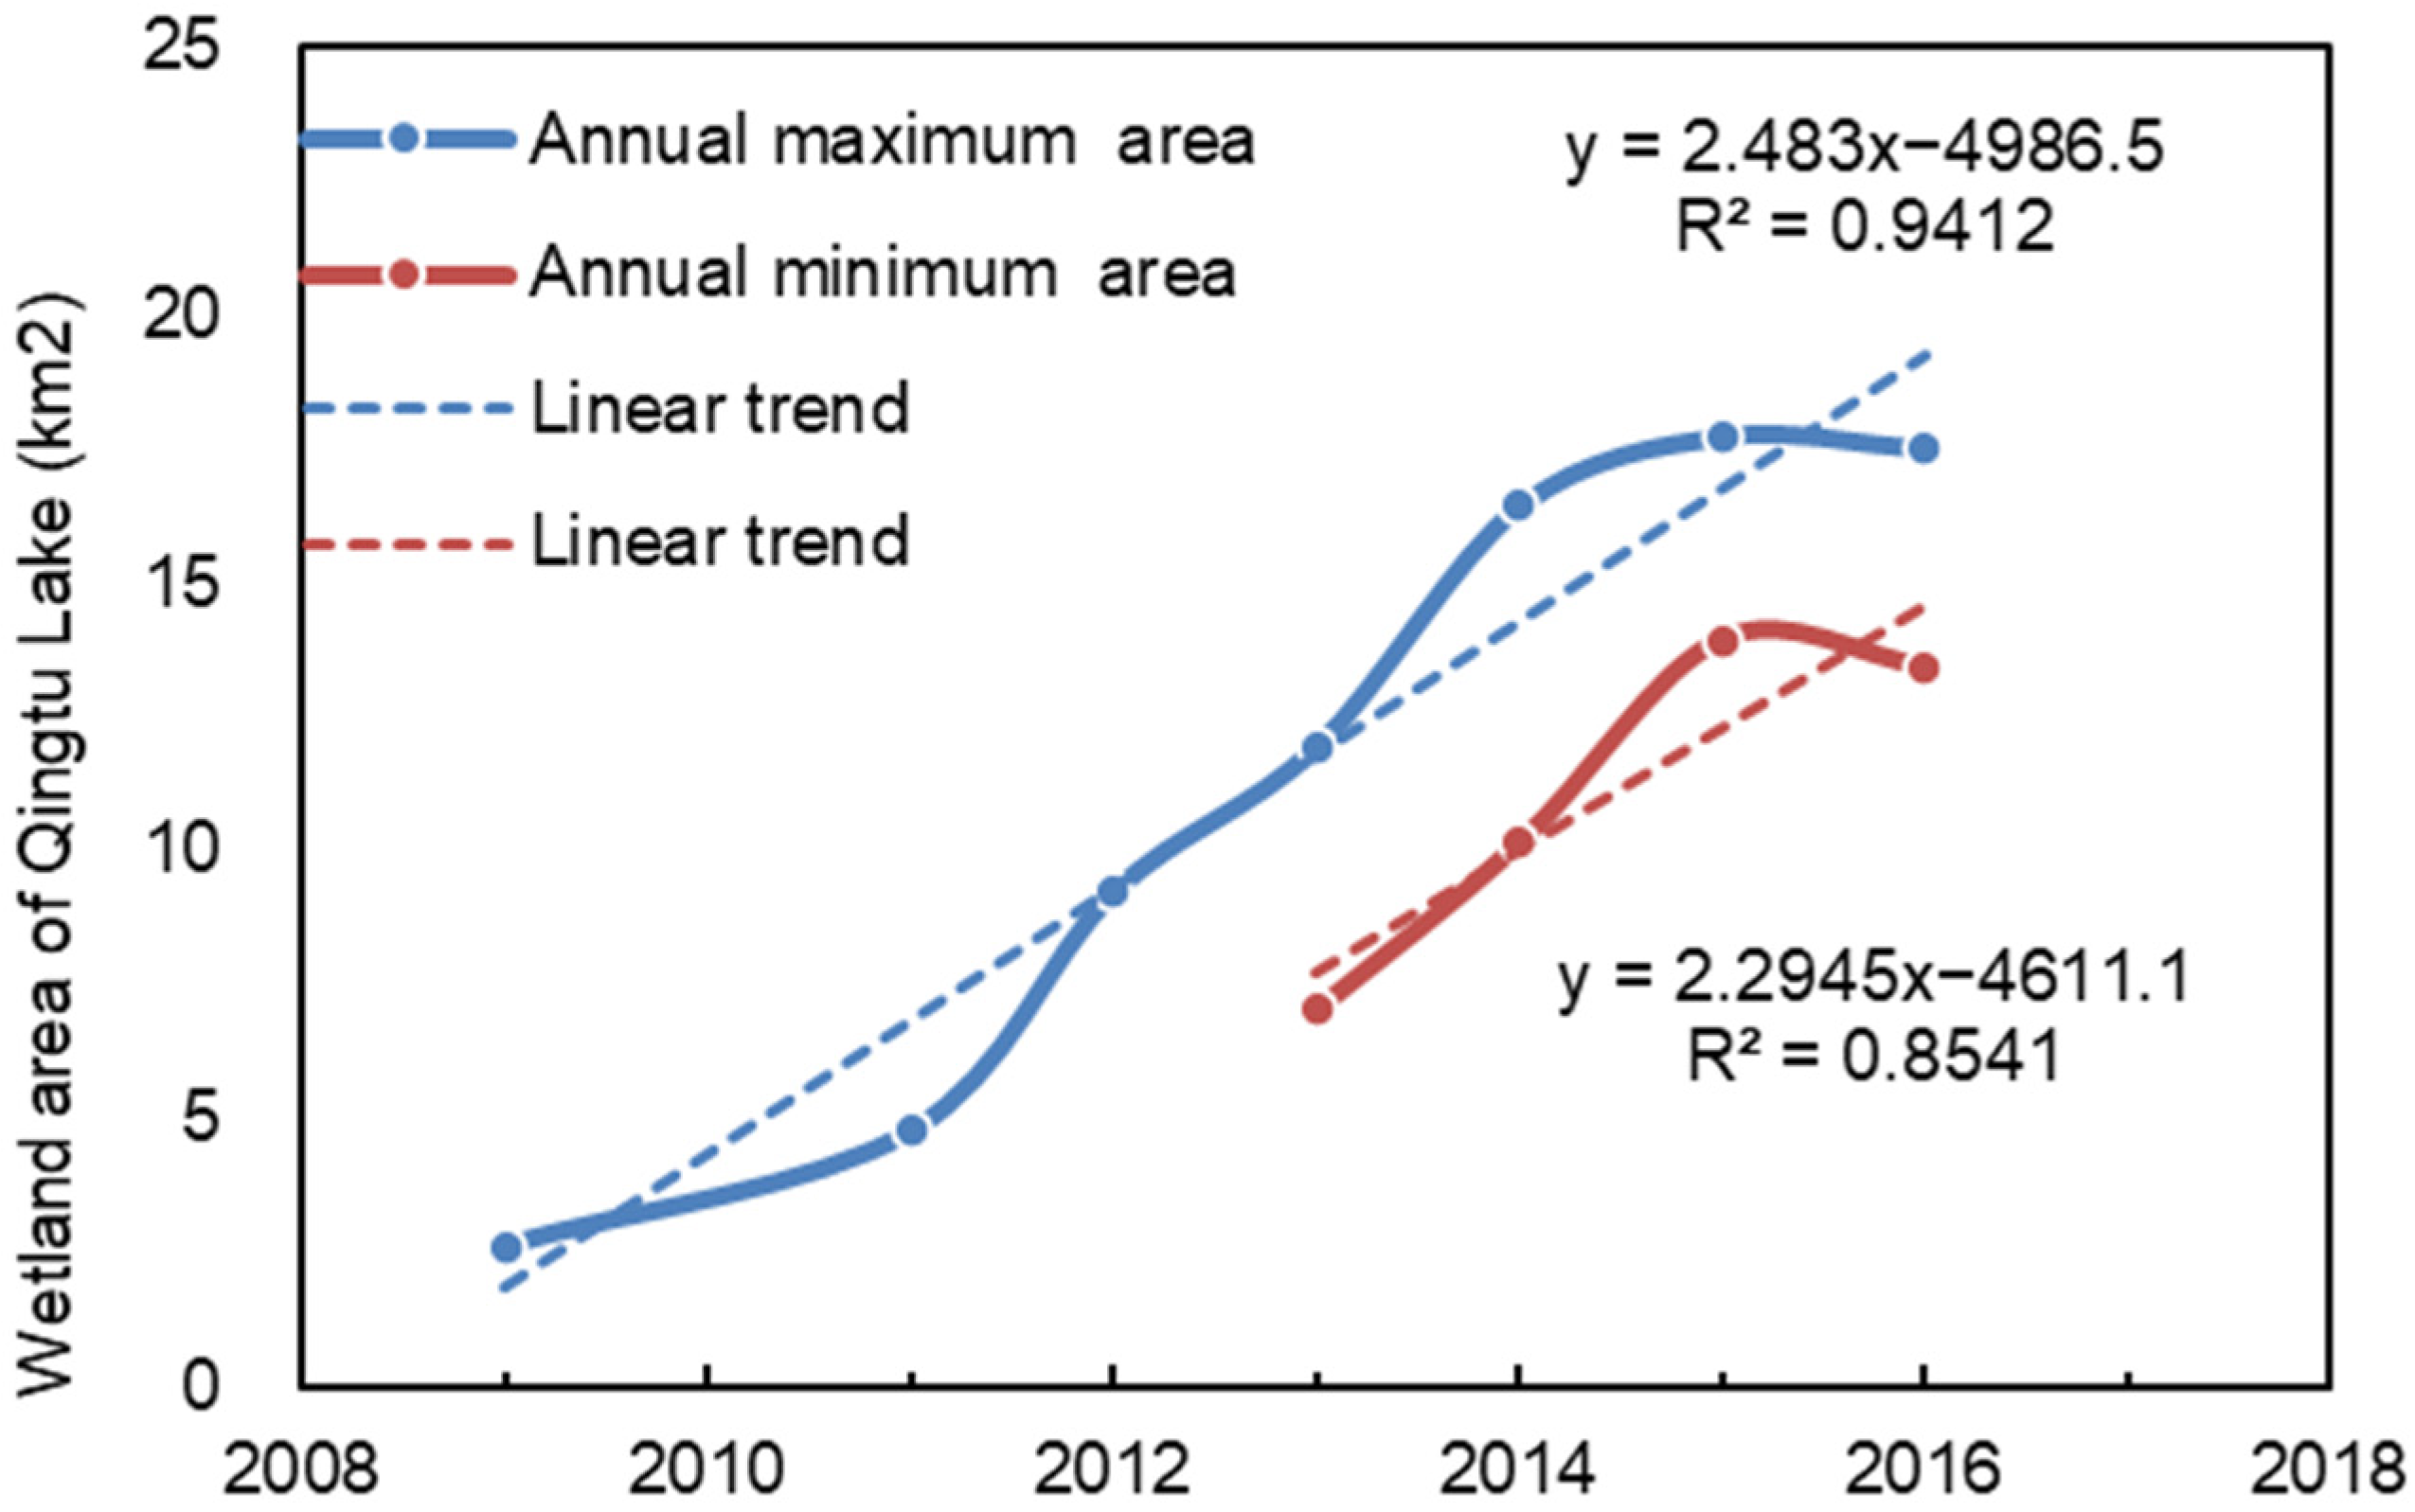
Wetland area of Qingtu Lake
In addition to carrying out the above solutions, 280 million cubic meters of water was directly added to the Qingtu Lake from the Hongyashan Reservoir from 2010 to 2019 [34]; this greatly increased the area of Qingtu Lake (Figure 10) and the surrounding vegetation. The increasing rate of the Qingtu Lake was about 2.48 km2 per year (Figure 10). The addition also played a role in the rise of the GL around Qingtu Lake in the downstream area [19,35].
4.
Vegetation ecology in the oasis–desert ecotone
From 2009 to 2017, the annual mean NDVI of natural vegetation gradually increased from 0.09 to 0.21 [34]. This demonstrated the effects of the implementation of the CRSRB on the improvement in vegetation ecology of the ODE. Currently, the areas with increasing NDVI are distributed in the eastern and southeastern peripheral areas of Minqin Oasis, the western part of Minqin Oasis, and the areas around Qingtu Lake. The increasing rate of the annual mean NDVI in these areas reached 0.1–0.3/10a [16]. Combined with the GLD of these areas and the correlation between the GLD and NDVI, we also found that the improvement of the vegetation in the western part of Minqin Oasis where the GLD was still about 20–30 m, was largely attributed to the afforestation project; the improvement of the vegetation in the lake irrigation area and the peripheral areas of the oasis were attributed to both the recovery of the GLD and the afforestation project. Under these interventions, the ecological function of the groundwater was gradually restored.
5.
Lifting residents out of poverty
Based on the NbS of the CASRB, and in accordance with the requirements of high efficiency, new modes, new varieties, and new technologies, the Minqin County government continued to adjust the agricultural structure and resolutely prohibited the planting of high-water-consuming crops such as onions and corn. The county has vigorously developed efficient water-saving agriculture, agricultural practices, green organic agriculture, and ecological circular agriculture as well as the creation of a variety of characteristic vegetable- and fruit-based products. The agricultural water production has increased from 2.66 yuan/m3 in 2005 to 21.7 yuan/m3 in 2020, and the per capita disposable income of farmers in the rural area has increased from 3869 yuan in 2007 to 15,466 yuan in 2020. These measures have successfully eliminated the farmers’ poverty and achieved solutions for the sustainable utilization of water resources, ecological protection, and increased income for farmers.

4.2. Comprehensive Evaluation of the Resilience of the Socio-Ecological System

The composite evaluation index of the SES resilience during 2009–2017 was calculated by the fuzzy comprehensive assessment method. The steps were as follows.
  • Selection of the resilience indicators of the SES
There are various resilience indicators of the SES. Since the main issues regarding the sustainable development of the SES in Minqin were the drop in GL, the degradation of GDEs, and the poverty of the residents, the NDVI, the wetland area of the Qingtu, the per-capita income, the GLD, and its change rate were selected as the indicators to assess the resilience of the SES (Table 1). The units of the indicators are shown in Table 1.
2.
Determination of grading values and the corresponding rating score
According to the theory of fuzzy mathematics, the values of the above-selected indicators were divided into three levels of rating score, i.e., V1, V2, and V3. Among these, V1 indicates that the resilience of the SES is relatively strong; V3 indicates that the resilience of the SES is close to the minimum value. V2 is between V1 and V3, indicating a medium level of resilience. To quantitatively reflect the resilience of the SES, V1, V2, and V3 were scored between 0 and 1 (Table 1). The composite index (CI) of the SES was calculated using the Equation (1), in which a is the CI; b is the weight of each indicator, and α is the rating score. The thresholds of indicators corresponding to V1, V2, and V3 were determined by the following method. That of NDVI was determined based on the analysis of changes detailed above and by previous studies on the desert vegetation [17,31,32]. The thresholds of the wetland area were determined by the maximum, mean, and minimum values during the evaluation period. The thresholds of per-capita income were determined according to the maximum, mean, and minimum values for Wuwei City. The thresholds of GLD were determined according to the interactions between the GLD and vegetation, as in Liu et al. [17]. The thresholds for the change rate were determined by the increasing or decreasing trends of the GLD due to the fact that a decreasing trend is favorable for the restoration of groundwater and its dependent ecology.
j = 1 3 b j k α j / j = 1 3 b j k
3.
Determination of the weight for each resilience indicator
The indicators were classified into three categories, i.e., the ecology, the socio-economy, and the groundwater resources (Table 2). Combining the principles of analytic hierarchy processes and expert scoring methods, the relative weights of NDVI, wetland area, per-capita income, GLD, and the change rate of GLD were finally adjusted to 0.198, 0.132, 0.340, 0.198, and 0.132.
4.
Composite evaluation index of the resilience of SES
Changes in the composite index of the SES (Vc) during 2009–2017 were shown in Figure 11. The results illustrated that Vc in most of the years was below 0.6, indicating a relatively low resilience of the SES. However, the Vc showed an increasing trend, especially increasing significantly from 2011 to 2017, the second stage of the CASRB. The value in 2017 was 1.73 times that in 2011. In the meantime, V3 showed a decreasing tendency, while V1 had an increasing tendency. This illustrated the dramatic effects of the CASRB. Temporally, the increase in the CI was initially attributed more to the increase in V2, and in turn to more to V1. This process suggested that the resilience of SES was gradually stronger after the implementation of the CASRB. Among the three rating levels, V2 still accounted for most of the current state, being almost twice that of V1. Therefore, the resilience of the SES in Minqin Oasis could still be enhanced.

4.3. Recommendations and Measures

Based on the above analysis, we conclude that the implementation of the CASRB has had a positive effect on the resilience of the SES of Minqin Oasis. The GLD reached a relatively balanced status, the ecological environment has been on a path of restoration, and residents of Minqin County have been comprehensively lifted out of poverty. However, the overall GLD in the Minqin Oasis is still very large, especially in the western part of Minqin, where the current GLD is 20–40 m. The artificially planted Haloxylon ammodendron grows poorly in dry years and is still insufficient to withstand the intrusion of the Badain Jilin Desert. Therefore, it is necessary to continue to strengthen this comprehensive governance. Furthermore, the authors recommended that in the later stages of the CASRB, different measures need to be taken for different regions within the oasis.
(1)
The ODE is a natural vegetation protection region. The critical GLD of soil salinization (2 m) and the critical vegetation-degradation value of groundwater ecological function (5 m) are recommended as GLD thresholds [17,34]. In the near future (i.e., by the year 2035), the main goal is to restore the ecological functioning of groundwater and prohibit its overexploitation. In the long term (after 2035), attention should be paid to controlling the GLD less than 2 m to avoid salt desertification. Artificial afforestation should be suited to local conditions, and shrub and grass planting projects should conform to the local climate and environment, selecting drought- and salt-tolerant plant species.
(2)
In agroecosystem regions, groundwater should be extracted rationally. Multiple factors such as the amount of groundwater recharge, the soil salinization threshold of the GLD, and the influence of groundwater mining on the surrounding natural ecology should be comprehensively considered. The GLD values of 2 m and 10 m are recommended as the minimum and maximum thresholds, and the amount of groundwater extraction could be determined according to these GLD thresholds. Therefore, the near future goal of the agroecosystem region is food security. The local government should reasonably determine the scale of agricultural land and irrigate the farmland by the joint regulation of surface water and groundwater. In the long term, attention should be paid to controlling the GLD greater than 2 m to avoid causing secondary salinization of the soil and affecting the quality and yield of crop.
(3)
In the urban ecological security guarantee region, the safety guarantee of underground buildings is the primary task. The local government should reasonably determine the maximum GLD threshold and appropriately extract groundwater by holistically coordinating regional water level changes. The authors recommend the minimum and maximum thresholds as 10 m and 15–20 m, respectively, due to the conclusion that a high GL would lead to the instability of underground buildings.

5. Conclusions

(1)
The natural runoff flowing into Minqin Oasis decreased significantly at a rate of 81 million cubic meters per decade. Combined with the expansion of irrigated farmland in Minqin Oasis, GLD increased dramatically, and the natural vegetation ecology of the ODE was seriously degraded. There was a strong correlation between each couple factor among the four factors on the causal chain; i.e., expansion of farmland–increase in groundwater abstraction amount–increase in GLD–degradation of natural ecosystem.
(2)
Since the implementation of the NbS in 2007, the dropping trend of GL has been curbed, the natural vegetation of the ODE has been partially restored, the wetland area of Qingtu Lake has increased, and people’s income has also increased. The SES resilience index has increased by a factor of 1.82 from 2009 to 2017, but it was still below 0.6, and the GLD has not reached the ecologically suitable depth.
(3)
To continually improve the resilience of the SES of Minqin Oasis, the idea of harmonious coexistence between humans and nature should continue to be adhered to in the later comprehensive treatment of the SRB, and the implementation of the CASRB should focus on comprehensive management, systematic management, and zoning management to promote the integrated protection and restoration of mountains, rivers, forests, fields, lakes, grass, and sand.

Author Contributions

Conceptualization, Z.N. and M.L.; methodology, M.L., Z.N. and L.C.; software, M.L., L.W. and H.L.; validation, L.W. and L.C.; formal analysis, M.L.; investigation, M.L., L.C. and L.W.; resources, M.L., L.W., L.C. and H.L.; data curation, L.W. and L.C.; writing—original draft preparation, M.L.; writing—review and editing, Z.N. and L.C.; supervision, Z.N.; project administration, Z.N.; funding acquisition, M.L. and Z.N. All authors have read and agreed to the published version of the manuscript.

Funding

This research was funded by the National Natural Science Foundation of China [No. 41902262]; the Innovation Capability Enhancement Plan of Hebei Province [No. 225A4204D], and the Geological Survey Project of China [No. DD20230432].

Data Availability Statement

The data presented in this study are available on request from the corresponding author.

Acknowledgments

We thank Wang Jinzhe, Wang Qian, Cui Haohao, et al. in our team for their help in the joint investigation of groundwater and ecological quadrat. We also thank the three anonymous reviewers for spending time on reviewing our manuscript and providing us with a list of constructive comments.

Conflicts of Interest

The authors declare no conflict of interest.

References

  1. Intergovernmental Panel on Climate Change. Global Warming of 1.5 °C; Cambridge University Press: Cambridge, UK; New York, NY, USA, 2018. [Google Scholar]
  2. World Bank. Biodiversity, Climate Change, and Adaptation: Nature-Based Solutions from the World Bank Portfolio; World Bank: Washington, DC, USA, 2008. [Google Scholar]
  3. Cohen-Shacham, E.; Walters, G.; Maginnis, S.; Janzen, C. Nature-Based Solutions to Address Global Societal Challenges; IUCN: Gland, Switzerland, 2016. [Google Scholar]
  4. Cohen-Shacham, E.; Andrade, A.; Dalton, J.; Dudley, N.; Jones, M.; Kumar, C.; Maginnis, S.; Maynard, S.; Nelson, C.; Renaud, F.; et al. Core principles for successfully implementing and upscaling Nature-based Solutions. Environ. Sci. Policy 2019, 98, 20–29. [Google Scholar] [CrossRef]
  5. United Nations Development Programme. Human Development and Planetary Health: The Role of Nature-Based Solutions; United Nations: San Francisco, CA, USA, 2019; Available online: https://hdr.undp.org/content/human-development-and-planetary-healththe-role-nature-based-solutions (accessed on 16 September 2023).
  6. International Union for Conservation of Nature. Guidance for Using the IUCN Global Standard for Nature-Based Solutions: A User-friendly Framework for the Verification, Design and Scaling up of Nature-Based Solutions, 1st ed.; International Union for Conservation of Nature: Gland, Switzerland, 2020. [Google Scholar]
  7. European Environment Agency; Castellari, S.; Zandersen, M.; Davis, M.; Veerkamp, C.; Förster, J.; Marttunen, M.; Mysiak, J.; Vandewalle, M.; Medri, S.; et al. Nature-Based Solutions in Europe Policy, Knowledge and Practice For Climate Change Adaptation and Disaster Risk Reduction; Publications Office of the European Union, LU: Luxembourg, 2021. [Google Scholar]
  8. Pérez-Cirera, V.; Cornelius, S.; Zapata, J. Powering Nature: Creating the Conditions to Enable Nature-Based Solutions; WWF: Gland, Switzerland, 2021; Available online: https://lp.panda.org/powering-nature-report (accessed on 16 September 2023).
  9. European Union. Towards an EU Research and Innovation Policy Agenda for Nature-based Solutions & Renaturing Cities. 2015. Available online: https://publications.europa.eu/en/publication-detail/-/publication/fb117980-d5aa-46df-8edc-af367cddc202 (accessed on 16 September 2023).
  10. International Union for Conservation of Nature. Call for Wetland Decade under the UN Decade on Ecosystem Restoration (2021–2030). 2019. Available online: https://www.iucn.org/news/water/201903/call-wetland-decade-under-un-decade-ecosystem-restoration-2021–2030 (accessed on 16 September 2023).
  11. United Nations. Nature-based Solutions for Supporting Sustainable Development, Resolution 5 of United Nations Environment Assembly Adopted on 2 March 2022, 2022 Retrieved on 5 June 2022. Available online: https://wedocs.unep.org/bitstream/handle/20.500.11822/39864/NATURE-BASED%20SOLUTIONS%20FOR%20SUPPORTING%20SUSTAINABLE%20DEVELOPMENT.%20English.pdf?sequence=1&isAllowed=y (accessed on 16 September 2023).
  12. Mehta, D.; Pandey, R.; Gupta, A.K.; Juhola, S. Nature-based Solutions in Hindu Kush Himalayas: IUCN Global Standard Based Synthesis. Ecol. Indic. 2023, 154, 110875. [Google Scholar] [CrossRef]
  13. Yu, R.; Mu, Q. Implementation progress of NbS in China: A Global Comparative Review. NbS 2023, 4, 100075. [Google Scholar]
  14. Fan, X. The Characteristics of Groundwater Resources and the Environmental Problems Caused by Development of Water Resource, the Arid Area in the Northwest of China. Hydrol. Eng. Geol. 1990, 1, 3–7, 12–16. (In Chinese) [Google Scholar]
  15. Ding, H.; Wang, G.; Huang, X. Runoff Reduction into Hongyashan Reservoir and Analysis on Water Resources Crisis of Minqin Oasis. J. Des. Res. 2003, 23, 84–89. [Google Scholar]
  16. Cao, L.; Nie, Z.; Liu, M.; Wang, L.; Wang, J.; Wang, Q. Changes in Natural Vegetation Growth and Groundwater Depth and Their Relationship in the Minqin Oasis in the Shiyang River Basin. Hydro. Eng. Geol. 2020, 47, 25–33. (In Chinese) [Google Scholar]
  17. Liu, M.; Nie, Z.; Cao, L.; Wang, L.; Lu, H.; Wang, Z.; Zhu, P. Comprehensive Evaluation on the Ecological Function of Groundwater in the Shiyang River Watershed. J. Ground. Sci. Eng. 2021, 9, 326–340. [Google Scholar] [CrossRef]
  18. Hao, Y.; Xie, Y.; Ma, J.; Zhang, W. The Critical Role of Local Policy Effects in Arid Watershed Groundwater Resources Sustainability: A Case Study in the Minqin Oasis, China. Sci. Total Environ. 2017, 601–602, 1084–1096. [Google Scholar] [CrossRef]
  19. Huang, F.; Chunyu, X.; Zhang, D.; Chen, X.; Ochoa, C.G. A Framework to Assess the Impact of Ecological Water Conveyance on Groundwater-Dependent Terrestrial Ecosystems in Arid Inland River Basins. Sci. Total Environ. 2020, 709, 136155. [Google Scholar] [CrossRef]
  20. Zhang, Z.; Yang, X.; Li, H.; Li, W.; Yan, H.; Shi, F. Application of A Novel Hybrid Method for Spatiotemporal Data Imputation: A Case Study of the Minqin County Groundwater Level. J. Hydrol. 2017, 553, 384–397. [Google Scholar] [CrossRef]
  21. Wang, X.; Chen, X.; Ding, Q.; Zhao, X.; Wang, X.; Ma, Z.; Lian, J. Vegetation and Soil Environmental Factor Characteristics, and Their Relationship at Different Desertification Stages: A Case Study in the Minqin Desert-Oasis Ecotone. Acta Ecolo Sinica 2018, 38, 1569–1580, (In Chinese with English abstract). [Google Scholar]
  22. Zhang, Y.; Chang, Z. Study on the Dynamic Vegetation Degeneration in the Minqin Desert Area. Arid Zone Res. 2008, 25, 16–21, (In Chinese with English abstract). [Google Scholar] [CrossRef]
  23. Liu, H.; Liu, S.; Li, Y.; Yang, Z.; Li, Y.; Zhang, Y.; Guo, C.; Liu, S. Response of Riparian Vegetation to the Change of Groundwater Level at Middle and Lower Reaches of the Shiyang River. Arid Zone Res. 2012, 29, 335–341, (In Chinese with English abstract). [Google Scholar]
  24. Lu, H.; Nie, Z.; Liu, M.; Feng, B.; Cheng, X.; Wang, J.; Wang, Q.; Cui, H.; Fan, F. Research on Land Cover Changes in Shiyang River Basin in Recent 50 Years Based on RS and GIS. Geogr. Res. 2020, 29, 8, (In Chinese with English abstract). [Google Scholar]
  25. Hess, A.; Iyer, H.; Malm, W. Linear Trend Analysis: A Comparison of Methods. Atmos. Environ. 2001, 35, 5211–5222. [Google Scholar] [CrossRef]
  26. Xu, J. Mathematical Methods in Modern Geography, 2nd ed.; Higher Education Press: Beijing, China, 2002; pp. 305–335. [Google Scholar]
  27. Cohen, P.; Cohen, P.; West, S.G.; Aiken, L.S. Applied Multiple Regression/Correlation Analysis for the Behavioral Sciences, 2nd ed.; Psychology Press: London, UK, 1983. [Google Scholar] [CrossRef]
  28. Fang, J.; Wang, X.; Shen, Z.; Tang, Z.; He, J.; Yu, D.; Jiang, Y. Methods and Protocols for Plant Community Inventory. Biodi. Sci. 2009, 17, 533–548. (In Chinese) [Google Scholar]
  29. Lou, S. Fuzzy Mathematics; Science Press: Beijing, China, 1983. [Google Scholar]
  30. Song, S.; Nie, Z.; Geng, X.; Shen, X.; Wang, Z.; Zhu, P. Response of Runoff to Climate Change in the Area of Runoff Yield in Upstream Shiyang River Basin, Northwest China: A Case Study of the Xiying River. J. Groundw. Sci. Eng. 2023, 11, 89–96. [Google Scholar] [CrossRef]
  31. Jin, X. Quantitative Relationship Between the Desert Vegetation and Groundwater Depth in Ejina Oasis, the Heihe River Basin. Earth Sci. Front. 2010, 17, 181–186, (In Chinese with English abstract). [Google Scholar]
  32. Cao, L.; Nie, Z.; Liu, M.; Wang, L.; Wang, Q. The Ecological Relationship of Groundwater–Soil–Vegetation in the Oasis–Desert Transition Zone of the Shiyang River Basin. Water 2021, 13, 1642. [Google Scholar] [CrossRef]
  33. Chen, L.; Feng, Q. Geostatistical Analysis of Temporal and Spatial Variations in Groundwater Levels and Quality in the Minqin Oasis, Northwest China. Environ. Earth Sci. 2013, 70, 1367–1378. [Google Scholar] [CrossRef]
  34. Nie, Z.; Liu, M.; Liu, P. Acceptance Report of the Research and Demonstration of Rational Exploitation and Utilization of Groundwater Resources and the Protection of Its Ecological Function in the Shiyang River Basin; Ministry of Science and Technology of the People’s Republic of China: Beijing, China, 2021.
  35. Gu, J.; Guo, P.; Huang, G. Achieving the Objective of Ecological Planning for Arid Inland River Basin Under Uncertainty Based on Ecological Risk Assessment. Stoch. Environ. Res. Risk Assess. 2016, 30, 1485–1501. [Google Scholar] [CrossRef]
Figure 1. Study area (IA: irrigation area).
Water 16 00033 g001
Figure 2. Variations in climatic elements in Minqin and runoff at the mountain-pass. (The dotted line represented ‘Observed’; the grey solid line represented the linear trend; the black solid line represented 5-points moving).
Water 16 00033 g002
Figure 3. Changes in the groundwater depth in the irrigation areas of Minqin Oasis during 1980–2017 (GLD: groundwater depth; IA: irrigation area; the red dotted line represented the turning point year).
Water 16 00033 g003
Figure 4. Changes in land-use types in Minqin Oasis (other land use types represent planted forest, construction land, artificial wetland, natural wetland, and farmland).
Water 16 00033 g004
Figure 5. Annual regional mean NDVI value in the Minqin Oasis–desert ecotone [16] (the red dotted line represented the turning point year).
Water 16 00033 g005
Figure 6. Interactions among the farmland–groundwater abstraction–groundwater depth–natural oasis. ((a): represented the correlation between areas of farmland and natural oasis; (b): represented that of farmland area and the groundwater abstraction; (c): represented that of groundwater depth and area of natural oasis; (d): represented that of groundwater depth and groundwater abstraction).
Water 16 00033 g006
Figure 7. The relationship of groundwater depth with NDVI and species richness in the Minqin Oasis–desert ecotone [17]. ((a): the annual relationship between groundwater depth and NDVI based on grid; (b): the relationship between groundwater depth and species richness based on survey of vegetation quadrats; (c): the relationship between annual regional mean groundwater depth and NDVI in Qingtu Lake area).
Water 16 00033 g007
Figure 8. Changes in proportions of water supply amounts in Minqin Oasis.
Water 16 00033 g008
Figure 9. Change rate of the groundwater depth during 2009–2017.
Water 16 00033 g009
Figure 10. Changes in the wetland area of Qingtu Lake.
Water 16 00033 g010
Figure 11. Changes in the composite index of the resilience of the socio-ecological system.
Water 16 00033 g011
Table 1. Rating criteria of the resilience indicators of socio-ecological system.
IndicatorsV1V2V3
NDVI0.50 0.15 0.08
Area of the Qingtu wetland (km2)17.73 11.46 2.63
Per-capita income (Yuan/person)31,128 19,110 9160
GLD (m)3.0 5.0 10.0
Change rate of GLD (%)−5.00.0 5.0
Rating score0.95 0.50 0.05
Table 2. Weights of the indicators.
ClassificationWeightsIndicatorsWeights
Ecology0.33NDVI0.6
Area of the Qingtu wetland (km2)0.4
Socio-economy0.33Per-capita income (yuan/person)1.0
Groundwater0.34GLD (m)0.6
Relative rate of GLD (%)0.4
Disclaimer/Publisher’s Note: The statements, opinions and data contained in all publications are solely those of the individual author(s) and contributor(s) and not of MDPI and/or the editor(s). MDPI and/or the editor(s) disclaim responsibility for any injury to people or property resulting from any ideas, methods, instructions or products referred to in the content.

