Abstract
Traditional univariate drought indices may not be sufficient to reflect comprehensive information on drought. Therefore, this paper proposes a new composite drought index that can comprehensively characterize meteorological and hydrological drought. In this study, the new drought index was established by combining the standardized precipitation index (SPI) and the standardized baseflow index (SBI) for the Jiaojiang River Basin (JRB) using the copula function. The prediction model was established by training random forests on past data, and the driving force behind the combined drought index was explored through the LIME algorithm. The results show that the established composite drought index combines the advantages of SPI and SBI in drought forecasting. The monthly and annual droughts in the JRB showed an increasing trend from 1991 to 2020, but the temporal characteristics of the changes in each subregion were different. The accuracies of the trained random forest model for heavy drought in Baizhiao (BZA) and Shaduan (SD) stations were 83% and 88%, respectively. Furthermore, the Local Interpretable Model-Agnostic Explanations (LIME) interpretation identified the essential precipitation, baseflow, and evapotranspiration features that affect drought. This study provides reliable and valid multivariate indicators for drought monitoring and can be applied to drought prediction in other regions.
1. Introduction
As a global problem, drought poses a significant challenge to the development of human societies. With the increase in global warming, the frequency of extreme weather events worldwide has increased, which has led to a gradual increase in the frequency and scope of droughts, posing a severe threat to agricultural production, economic development, and social stability. Although China has a vast area and many rivers, its uneven spatial distribution makes it a drought-prone country. According to statistics, the economic losses caused by meteorological disasters account for about 50% of all natural disasters, and the losses caused by droughts account for more than 50% of meteorological disasters [1]. To better understand and measure the characteristics of drought, scholars have adopted a variety of drought indices, such as meteorological and hydrological indices, to assess and compare droughts objectively. These drought indices not only help to measure the intensity, duration, and frequency of drought occurrence but also provide a more comprehensive assessment of its impacts on different areas and the degree of damage. Through the comprehensive analysis of different indicators, scholars can more accurately grasp the characteristics of drought and its impact on human society, which provides an important basis for formulating strategies and measures to deal with drought.
Researchers have constructed different drought evaluation indices for different types of droughts (meteorological drought, hydrological drought, agricultural drought, socio-economic drought). For example, the Standardized Precipitation Evapotranspiration Index (SPEI) [2] describes meteorological droughts, and the Standardized Streamflow Index (SSI) [3] investigates hydrological droughts. However, because of the differences in drought-inducing variables, a single drought index cannot comprehensively evaluate agricultural, meteorological, hydrological, and socio-economic aspects [4,5,6]. Creating a comprehensive drought index that includes multiple drought elements is necessary. Waseem et al. [7] proposed a new multivariate drought evaluation method using entropy-weighted Euclidean distance to create a composite drought index. Also, Huang et al. [8] combined SPI and SSI and constructed another composite drought index using the entropy weighting method in 2015. In addition, Liu et al. [9] proposed a comprehensive composite drought index by applying the principal component analysis (PCA) method, which combined precipitation, evapotranspiration, soil moisture, streamflow, and other hydrometeorological factors.
However, comprehensive drought indicators based on the assignment and fuzzy synthesis methods have a certain subjective tendency when assigning weights, which cannot process the data objectively and cause errors. The PCA method cannot reflect the nonlinear relationship among the relevant variables. The copula function is a kind of joint distribution that can construct the marginal distribution as an arbitrary distribution, which can effectively describe the correlation among variables and has a wide range of applications in hydrology and water resources [10,11,12,13,14,15]. Azhdari et al. [16] constructed three composite hydrometeorological indices, including JDHMI-CCA, JDHMI-PCA, and JDHMI-copula, using typical correlation analysis (CCA), principal component analysis (PCA), and copula-based methods, and explored the mechanism of linear and nonlinear methods in drought status assessment. Wang et al. [17] established a new meteorological and hydrological drought index (MSDIP) using streamflow and precipitation as indicators. However, factors such as precipitation intensity and duration can affect rapid changes in streamflow, making it relatively unstable. Baseflow is more stable than streamflow derived by long-term groundwater recharge, which is usually less affected by short-term meteorological changes [18]. Odongo et al. [19] selected possible wet and dry conditions in a study area based on SPI and SSI according to a weighted similarity metric. The essential baseflow characteristics to replenish river flow during dry periods, SBI instead of SSI, can better respond to hydrologic drought characteristics. Bazrkar and Chu [20] improved hydrological drought identification by developing a new standardized base flow index. Meresa et al. [21] explored the relationship between hydrological and meteorological drought and watershed characteristics. They used the SPI, SPEI, SRI, and SBI to study drought propagation under meteorological to hydrological drought conditions in nine selected catchment areas of the Awash Basin in Ethiopia. Kwak et al. [22] used the SBI to consider the dry and wet conditions of a dam and its storage capacity. In addition, many studies [23,24,25] have demonstrated that baseflow can be used as a hydrological characteristic factor to characterize hydrological drought conditions in a watershed. Therefore, this study constructs a comprehensive index based on the copula function by constructing a joint distribution function with precipitation and baseflow as marginal distributions. The SPI is used to characterize meteorological droughts and the SBI is used to characterize hydrological droughts so that the index can comprehensively characterize the joint features of meteorological droughts and hydrological droughts and improve the accuracy and applicability of the composite drought index.
Meanwhile, with the development of computer intelligence technology, machine learning models have been applied to many fields, and the high accuracy of such models has been proven. In meteorological and hydrological drought forecasting, the use of machine learning models to construct regional meteorological and hydrological drought forecasting models has made some progress. Compared with the traditional statistical regression methods, Support Vector Machine (SVM) [26], Back Propagation Neural Network (BPNN) [27], eXtreme Gradient Boosting (XGBoost) [28], random forest (RF) [29,30], and other machine learning algorithms have significant advantages in processing large-scale and multi-source remote sensing data and have been gradually used in meteorological and hydrological forecasting. For example, Elbeltagi et al. [31] investigated the prediction accuracy of SPI-based RF, Random Tree (RT), and Gaussian Process Regression (GPR-PUK kernel) models for forecasting meteorological droughts in semi-arid regions. Lotfirad et al. [32] used an RF model to demonstrate that the prediction accuracy of the SPI and SPEI can be improved by increasing the time scale. It was also demonstrated that the SPEI is more capable than the SPI in drought prediction. Zheng et al. [33] evaluated the predictive performance of random forest models combined with artificial intelligence on a test set of four stocks using optimal parameters. RF models are heavily used in several areas, such as hydrologic forecasting, finance, and the environment. It is a more mature forecasting model. In this paper, using the RF model to forecast regional drought ensures the accuracy of the prediction results and the significance of each drought-affecting variable, as explained by the subsequent LIME interpretation.
Therefore, the main objectives of this study are (1) to calculate the SPI and the SBI based on the optimal marginal distribution function using precipitation and baseflow data; (2) to introduce a new copula-based comprehensive drought index, which combines the advantages of the SPI and the SBI and can simultaneously reflect both meteorological and hydrological drought; (3) to assess the drought in the Jiaojiang River Basin (JRB) from 1991 to 2020 based on drought indices; and (4) to predict future droughts using a random forest model and to develop a complex machine learning algorithm for the prediction of droughts using the Local Interpretable Model-Agnostic Explanations (LIME) algorithm to interpret the results of making complex machine learning model predictions.
2. Materials and Methods
2.1. Study Area and Dataset
2.1.1. Study Area
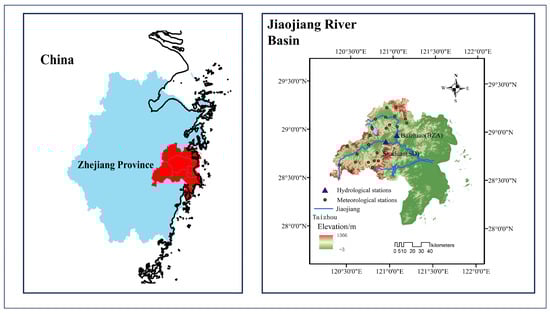
The Jiaojiang River Basin (JRB) is one of the eight important river basins in Zhejiang Province. The JRB is located on the central coast of Zhejiang Province between 120°17′6′′ and 121°41′00′′ east longitude and 28°32′2′′ and 29°20′29′′ north latitude, with a watershed area of 6603 km2 (Figure 1). The topography of the JRB slopes from west to east. The west–central and northern Zhongshan Mountains are rolling, the coastal plain is embedded with low hills, and the river channels are densely scattered.
2.1.2. Datasets
Twenty-two meteorological datasets and two hydrological datasets of observation records in the JRB were obtained from the National Climate Center of the National Meteorological Administration of China (Figure 1). The records cover hydrologic information from 1991 to 2020. In this study, the JRB was divided into two sub-basins for analysis, including the Yong’an Creek Basin (Shaduan station) and the Shifeng Creek Basin (Baizhiao station).
2.2. Methods
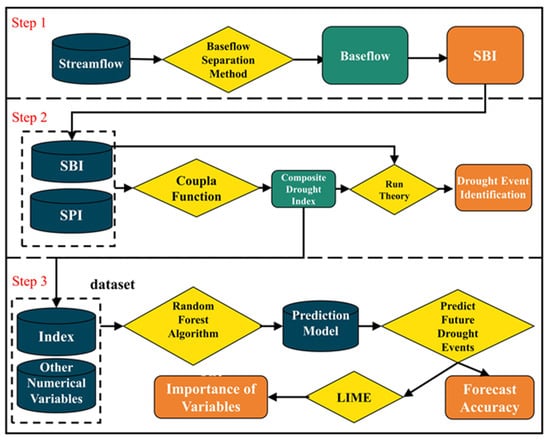
The SPI (meteorological drought) and the SBI (hydrological drought) were selected to construct a composite drought index using the Frank copula function to characterize meteorological and hydrological drought. A random forest model was trained on the data from 1991 to 2010 for the Shaduan (SD) and Baizhiao (BZA) stations to predict the composite drought index from 2010 to 2021. Finally, the LIME algorithm was used to analyze the composite drought index prediction results and interpret the importance of each input factor. The characteristics of meteorological droughts transformed into hydrological droughts were investigated. A flow chart of the methods used in this study is shown in Figure 2.
2.2.1. Drought Index
The SPI was chosen as the meteorological drought index, which can quantitatively characterize regional drought at different time scales [34]. The SPI considers that precipitation obeys a skewed distribution and normalizes precipitation, which is a good prospect for application [35,36]. The specific computational steps of the SPI are as follows:
where and are scale and shape parameters, respectively. and are estimated by the linear method of moments. is used to fit the cumulative precipitation series for a given time scale.
The cumulative probability of the precipitation sequence x is:
The standard normalization was performed as follows:
The final SPI value was obtained as follows:
where , and when , , . When ,.
The standardized baseflow index (SBI) was selected as the hydrological drought index. The baseflow was selected from the digital filtering method of the Chapman Maxwell (CM) [37] method for baseflow separation, which effectively solves the uncertainty problem of baseflow when surface streamflow stops flowing. The calculation formula is:
where is the base flow rate at the moment, mm; is the base flow rate at the moment, mm; is the streamflow flow rate at the moment, mm; i is the time step, d; and is the receding water constant. The value can be obtained through a receding water analysis. Usually, the empirical value is set to 0.925, as obtained by Nathan and McMahon [38] based on the characterization of six watersheds in Germany and used for baseflow partitioning. Considering the uncertainty in the empirical recession constants when applied to other watersheds, estimating the recession constant values using the CM filtering method can reduce the uncertainty in baseflow separation and thus improve accuracy. In this study, we used the automated baseflow identification method developed by Cheng et al. [39] to compute the receding water constants of watersheds and perform baseflow separation.
The SBI calculation method is similar to the SRI computation since the baseflow value is acquired after the filtering method processes the streamflow data. The baseflow is utilized in place of the streamflow to perform normalization calculations, and the baseflow probability distribution type is chosen and standardized. The drought index is then split into two categories, as indicated in Table 1.

2.2.2. Run Theory
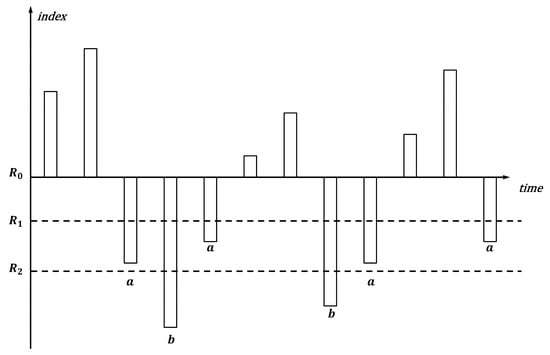
In this study, we choose the run theory [40] for the initial judgment of the drought index time series, rejecting and fusing three-step identification to extract drought features. The three thresholds set are . The specific steps are as follows: (1) Initial identification when the drought index is less than , then the initial judgment of the month for drought is made, as shown in Figure 3a. (2) Elimination of non-droughts, when the drought index of a month is between and , and only this month reaches this standard, it is recognized that the month is non-drought and is to be eliminated, as shown in Figure 3b.
2.2.3. Theory of Two-Dimensional Copula Functions
The copula function is an important statistical tool for describing the distributional relationships of multidimensional random variables. It is mainly used to model the joint distribution function of random variables, which separates the marginal distribution from dependence and makes the model more flexible. There are various types of copula functions, and the common ones include Gaussian copula [41], t-distribution copula [42], Clayton copula [43], and Frank copula [44]. Each type of copula corresponds to a different dependence structure, so choosing an appropriate copula function is crucial for accurately describing the dependence among variables. Among them, the Frank copula function has a simple structure. It can be used to describe the symmetric correlation structure, which applies to both positive and negative correlations and has no limitation on the degree of correlation, and the variation in the upper and lower tails of the correlations is not apparent [45]. Many drought studies have used the Frank copula function [46,47,48]. Therefore, this study chooses the Frank copula connecting function to construct the joint distribution of precipitation and baseflow.
According to Sklar’s theorem, let F and G be the marginal distribution functions of the random variables x and y, respectively, and H be the joint distribution function, then have copula function C such that:
If F and G are continuous, then C is unique.
The function was first proposed by Frank in 1979, and its expression is:
The generated meta is as follows:
where and are the marginal cumulative probabilities of the two variables, respectively, and is a parameter. It can be obtained from the Kendal rank correlation coefficient :
The first-order Debye function expression is:
2.2.4. Establishment of A Composite Drought Index
The precipitation and baseflow of the BZA and SD stations in the JRB are random variables X and Y, respectively. Through the Pearson correlation coefficient method, the correlation coefficients of precipitation and streamflow in each region were calculated to be 0.7884 and 0.7506, which have solid correlations and can be used to construct the joint distribution function. Where X and Y represent a particular value of precipitation and baseflow in the plain and sandy section of Pak Chi, assuming that the corresponding marginal distributions of the two random variables are F(x) and G(y), their joint distribution P can be expressed by the cumulative joint probability p and copula function C as:
Thus, the composite drought index is obtained from the joint distribution function:
where is the standard normal distribution.
Since meteorological droughts begin and end relatively quickly (because of a lack of precipitation), hydrological droughts (because of insufficient streamflow) begin and end with some delay in response to meteorological droughts. It is often the case that a meteorological drought has already ended, and a hydrological drought has just begun. This situation makes it difficult for decision-makers to formulate timely, rational, and effective response strategies. The composite drought index (CDI) is a composite index that characterizes both meteorological and hydrological droughts. It combines baseflow and precipitation data to capture drought onset, the severity of drought conditions, and drought duration. In this study, a similar approach to the SPI classification was used to categorize the drought classes of the CDI, as shown in Table 1.
The CDI is particularly effective because it considers meteorological and hydrological factors. Meteorological droughts are characterized by below-average precipitation, while hydrological droughts are characterized by below-average surface water and groundwater levels. The CDI captures both factors and comprehensively describes drought conditions. The CDI is an essential tool for drought monitoring and management. Identifying different levels of drought severity can help policymakers and water managers make informed decisions on water allocation and conservation measures. In addition, the CDI can be used to track changes in drought conditions over time, thus providing early warning of potential drought emergencies. Overall, the CDI represents a significant advance in drought monitoring and management. It captures meteorological and hydrological factors to provide a comprehensive picture of drought conditions and is a composite of meteorological and hydrological indices [49].
2.2.5. Linear Regression Estimator
The linear regression method is used to estimate the slope. A positive slope value indicates an increasing trend, while a negative value indicates a decreasing trend. The linear regression line can be computed as follows:
where x and y are the explanatory variable and the dependent variable, respectively, while a and b are the slope and intercept, respectively.
2.2.6. Mann–Kendall Trend Test
Most previous studies have assumed that sample data are serially independent. However, it is known that some hydrometeorological time series, such as water quality and flow or rainfall time series, may exhibit serial correlation. In such cases, serial correlation affects the ability of the Mann–Kendall (MK) [50] test to assess the significance of a trend because Mann–Kendall and Theil–Sen cannot consider the AR (1) process for the time series.
The nonparametric MK test is the most widely used time series trend detection method. If the total amount of data in the time series is denoted by N, the statistic S can be calculated:
If the total amount of data in the time series is denoted by N, then the statistic is as follows:
A positive (negative) value of S indicates an upward (downward) trend. S is considered to be normally distributed when N8, and its mean and variance can be computed as follows:
where indicates the amount of data in the th tied group. Finally, the standardized test statistics Z can be computed as follows:
A positive value of Z indicates an increasing trend, while a negative value indicates a decreasing trend. In this study, trends were tested with a significance level of = 0.05. The null hypothesis of no trend was rejected if the absolute value of Z was more significant than 1.96.
2.2.7. Random Forest
A random forest (RF) method was used to predict future drought conditions in the JRB, based on an algorithm that Breiman proposed [51]. The method constructs a decision tree for each sample by randomly selecting subsamples from the original sample multiple times in a relaxed manner [52,53]. Then, the prediction results of multiple decision trees are combined by averaging or voting to determine the final prediction result. Elbeltagi et al. [31] predicted the accuracy of meteorological drought in semi-arid regions using the standardized precipitation index (SPI) based on random forest (RF), random tree (RT), and Gaussian process regression (GPR-PUK kernel) models. Zarei et al. [54] compared the ability of six more commonly used drought indices in agricultural drought assessment using the RF algorithm.
The composite drought index in this study was predicted using a typology to make predictions for different levels of drought. In categorical analytics research, the complex black-box nature makes it difficult for researchers to make sense of data insights and model decisions [55]. Therefore, this study employs the LIME algorithm to interpret the predicted results using LIME (Figure 4). Data storytelling, as a practical process with an explanatory purpose, can help storytelling audiences understand the context and reasons for generating model predictions, enabling an immersive user experience and deep cognitive data. Introducing interpretability techniques into the data storytelling process can enhance the explanatory effect of data stories, which can assist in decision-making.
Interpretable machine learning techniques offer a fresh approach to locating the data story reversal point in the context of classification model prediction outcomes. Using interpretable machine learning techniques, we may identify the critical components in the decision-making process and better understand how a model makes a particular prediction. This enables us to pinpoint pivotal moments within the data narrative, representing significant characteristics or patterns that lead the algorithm to alter its forecasts.
3. Results
3.1. Comprehensive Hydrometeorological Drought Characteristics
3.1.1. Establishment of Composite Index and Analysis of Its Trends
According to the streamflow of the BZA and SD hydrological stations in the JRB from 1991 to 2020, the baseflow of the two stations was divided according to Equation (5). Figure 5 shows that the fluctuation intensities in the baseflow after the division of the two places are significantly reduced compared with the streamflow, indicating that the baseflow is more stable than the streamflow, which is in line with the needs of this paper. Subsequently, the SBI indices of the two sections were calculated based on the divided torrent data. First, the hydrological drought index (SBI) and meteorological drought index (SPI) were computed in this study. Then, a novel drought index based on copula was suggested, capable of capturing both hydrological and meteorological drought. After that, the superiority of the composite drought index was confirmed by contrasting the SPI, SBI, and CDI on a monthly scale. The Frank copula parameter values for the BZA and SD basins were determined to be 5.5160 and 4.1631, respectively.
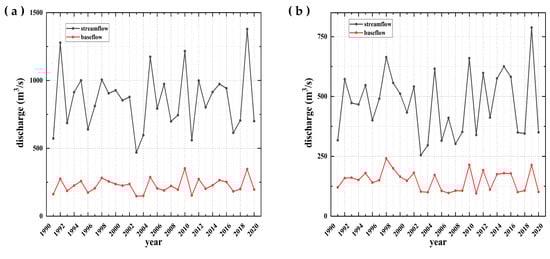
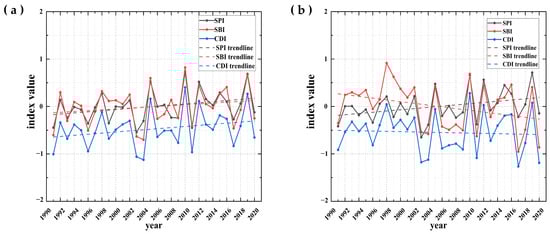
Figure 6 shows the SPI, SBI, and CDI of the JRB at the annual scale from 1991 to 2021. The results of the linear fit for the CDI, SPI, and SBI on the annual scale are shown in Figure 6. The results of the MK test are shown in Table 2. It can be found that the results of the MK test are the same as those of the linear fitting, which proves the accuracy of the trend change. The Pearson correlation coefficients of the composite drought index with the SPI and SBI values passed the 95% confidence test, which indicates that the newly constructed composite drought index has some reliability [56]. Figure 6 shows that the aridity in the BZA area decreases year by year, but the aridity in the SD area increases year by year. According to Figure 6, the fluctuation shapes of the CDI, SPI, and SBI are similar, and when the SPI and SBI decrease, the CDI decreases at the same time, and when the SPI and SBI increase, the CDI increases at the same time, which indicates that the new CDI has very high accuracy and reliability in recognizing the two kinds of droughts, namely, meteorological drought (SPI) and hydrological drought (SBI). The trend line in Figure 6 indicates that when the SPI and SBI rise simultaneously, the CDI likewise rises simultaneously. Similarly, the CDI falls when the SPI rises and the SBI falls, but its slope is much smaller than the SBI. This indicates that the new CDI combines the two types of drought indices rather than considering them as one single drought index, which can be used to recognize drought more comprehensively.
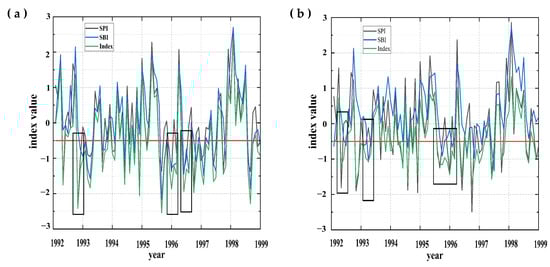
To make a more visual comparison, we intercepted the changes in the monthly SPI, SBI, and CDI (1992–1998), as shown in Figure 7. Some differences in the three indices can be observed when zooming in on the abscissa. From the inter-annual variation in the index in Figure 7, it can be seen that droughts occurred more frequently and at higher drought levels from 1992 to about 1998, and the same was valid from 1999 to about 2020. The droughts captured by the drought index in this study are temporally consistent with the droughts that historically occurred in the JRB [57], which suggests that the newly constructed drought index has some accuracy. The CDI based on the Frank copula function constructed in this paper has the advantages of reliability, sensitivity, and comprehensiveness. It can identify droughts more comprehensively and issue early warnings, supporting drought detection and prevention.
3.1.2. Mechanisms Underlying the Propagation of Meteorological Drought to Hydrological Drought
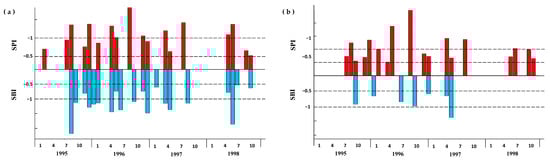
The three thresholds are following the three-threshold approach of the tour theory for a drought index time series for the first judgment, culling, and fusion of the three-step identification and extraction of drought characteristics. Figure 8 displays the outcomes from 1995 to 1998. Concurrently, the tour theory was employed to better comprehend the modifications in meteorological and hydrological drought attributes following their dissemination. This aided in the identification of hydrological and meteorological drought occurrences, the extraction of drought intensity and ephemeral features, and the analysis of the outcomes. The results showed that the duration of meteorological and hydrological drought in the BZA station, as evaluated by the SPI and SBI, was 77 and 97 times, respectively. The meteorological droughts and hydrological droughts in the SD station were 74 and 83 times, respectively. According to the CDI results, the drought duration in the two stations was 150 and 150 times, respectively. Accordingly, the accuracy of the composite drought index in the two stations was 75.3% and 73.3%, respectively. Additionally, it may be inferred that hydrological droughts in the SD and BZA regions occurred one month and 0.7 months behind meteorological droughts.
3.2. Future Drought Prediction and Important Factor Identification
3.2.1. Drought Forecasting Performance
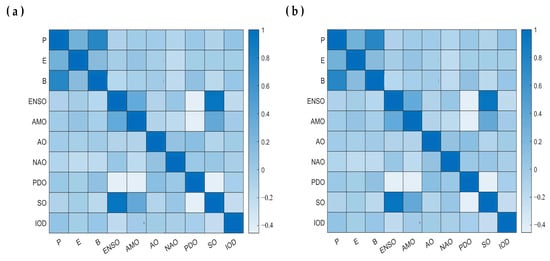
This study was based on the precipitation, baseflow, evaporation, El Niño Southern Oscillation (ENSO), Atlantic Multidecadal Oscillation (AMO), Arctic Oscillation (AO), North Atlantic Oscillation (NAO), Pacific Decadal Oscillation (PDO), Southern Oscillation (SO), Indian Ocean Dipole (IOD), and composite drought index (CDI) at the BZA and SD stations in the JRB during the period of 1991–2010. The composite drought index was also predicted for 2011–2020. The results of the correlation calculation among the numerical variables of the random forest model are shown in Figure 9. The correlation between the SO and ENSO indices was more significant than 0.9 at the BZA and SD stations. The correlation between the ENSO index and the other numerical variables was greater than that of the SO index. The accuracy of the exercise results is shown in Table 3. Based on the results, it can be seen that the trained model has vital prediction accuracy for no drought and heavy drought, but the prediction accuracy for normal drought still needs to be strengthened.
3.2.2. Important Factor Identification
The inversion point identification algorithm and implementation scheme proposed in this paper apply to the subtype prediction results. For example, in drought forecasting, the data values are compared with the thresholds of −0.5 and −1. An area has no drought when the prediction result is more than −0.5. An area is in a normal drought when the result is more than −1 and less than −0.5. When the prediction value is less than −1, an area is in a heavy drought or above. This meets the needs of drought forecasting and supports the inversion point identification algorithm for validating data storytelling.
The algorithm model was trained using various information characteristics such as precipitation, baseflow, evapotranspiration, and the ENSO, AMO, AO, NAO, PDO, SO, and IOD indices. The LIME algorithm model was then utilized to predict the classification of drought, and the results were fed back to the decision maker for decision-making on drought conditions. The classification results were characterized as “index −0.5” (no drought), “−1 ≤ index < −0.5” (normal drought), and “index < −1” (heavy drought and above).
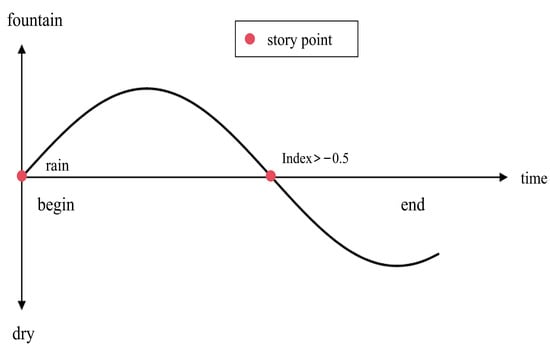
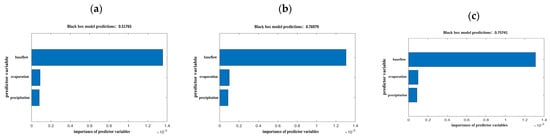
Drought occurs in an area when the index is less than −0.5, which indicates a reversal of the need for change and indicates that the characteristics of the value may alter the outcomes. When the composite regional drought index is less than −0.5, the features of the value can be altered. Each time a variable’s properties change inside the tale’s structure, this can be considered data storytelling in the story point narrative. Figure 10 shows this process. In the development stage of data storytelling, which runs from story point to , the narrative progressively builds to a climax as one or more crucial feature variables are changed. Based on the LIME algorithm, data storytelling interpretation can be characterized in the following ways, as shown in Figure 10. The decision maker continuously looks for the reversal moment, or the point in the story where the predictions made by the model are overturned by altering the values of one or more features with higher weights. This is performed using the LIME method to output the feature weights for each prediction. Figure 11 displays the characteristic weights for every predicted outcome. Precipitation, baseflow, and evaporation are the fundamental eigenvalues influencing the impact of a drought.
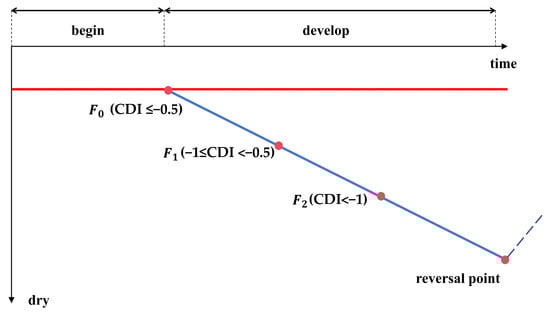
Figure 10.
Inversion point identification and process as oriented by LIME algorithm interpretation. The red line is the drought judgment line, and the blue line is the drought process line.
4. Discussion
Many new drought indices have been developed in past studies to monitor drought [58,59,60]. However, no comprehensive drought index is based on the copula function that combines the SPI and SBI to construct a comprehensive drought index that simultaneously characterizes meteorological and hydrological droughts. On this basis, a comprehensive drought index based on the Frank copula is proposed to characterize JRB droughts comprehensively. The trend line in Figure 6 reveals that the meteorological drought in the sand section has decreased yearly, but the hydrological drought has increased yearly. The reason for this phenomenon may be the faulty management of reservoirs because of the intensification of extreme climate change caused by global warming. As shown in Figure 7, the composite drought index can monitor the occurrence of meteorological drought, hydrological drought, or both. In general, the onset of a drought is usually due to a persistent lack of rainfall, so the SPI index is susceptible to capturing the onset of a drought. There is a delay in the response of hydrological droughts to meteorological droughts because of complex sink-producing processes, so the SBI effectively identifies the duration and end of droughts.
As shown in the first black rectangular boxes in Figure 7a,b, the moments when the CDI and SPI values are less than −0.5 (considered to be the beginning of the drought) are earlier relative to the SPI, which suggests that the CDI was comparable to the SPI in its ability to capture the beginning of the drought. In addition, the composite drought index appears to be similar to the SBI in terms of its capacity to detect the end of drought because the times at which the CDI and the SBI are more significant than −0.5 (the point at which the drought is deemed to be over) occur later than the SPI. This is because the SPI was mainly based on meteorological drought characteristics, which develop suddenly and rapidly. The SBI was based on hydrological drought characteristics, with considerable delays and longer durations. The third black rectangles in Figure 7a,b show that the CDI can include both the beginning and the end of a drought, as captured by the SPI and the SBI. The CDI captures the beginning of the SPI and the duration of the SBI during drought events. Furthermore, as demonstrated by the variations in the three indices in the second black rectangular boxes in Figure 7a,b, the CDI accurately depicted the beginning of the drought in both cases when only a hydrological drought occurred and when no meteorological drought occurred. These findings offer compelling evidence that the composite drought index, which incorporates data on streamflow and precipitation, can accurately and sensitively identify the beginning, middle, and end of a drought.
Therefore, we believe that the proposed composite index has practical applications. Once the CDI detects a drought, practitioners, watershed managers, or agencies should remain vigilant in warning and preventing possible droughts. In addition, the CDI was significantly correlated with the SPI and the SBI (p < 0.05), indicating that the CDI has good reliability. In addition, Hao and AghaKouchak [61] also compared the new composite drought index with the SPI and the standardized soil moisture index by analyzing the drought onset and propagation time they captured. They verified that the copula-based composite drought index is reliable and has effective drought early warning capability. In Figure 7, the green line representing the composite drought index is slightly lower than the other lines, indicating that the conditions captured by the composite drought index are more severe than those captured by the single-factor drought index. Without accurate forecasts, people prefer predicted drought levels to be higher than actual levels, which is more conducive to drought planning.
The number of hydrologic droughts at BZA is significantly higher than at SD, as shown in Figure 8. This may be because the SD station controls 75% of the watershed, whereas the BZA station controls only 40%. In addition, a random forest model was trained on precipitation, baseflow, evapotranspiration, and the ENSO, AMO, AO, NAO, PDO, SO, and IOD indices, which had a more accurate accuracy for no drought and heavy drought conditions. The LIME model was then used to interpret the predictions of the random forest to identify the leading causes of drought in the JRB region. The results showed that precipitation, baseflow, and evapotranspiration most significantly impact the JRB regional drought. This is consistent with the fact that precipitation, baseflow, and evapotranspiration are all determinants of drought in each region and that the JRB is a large and stable watershed, so it is less affected by factors such as ESNO, AMO, AO, NAO, PDO, SO, and IOD.
There are some shortcomings in this study including the following: (1) only meteorological and hydrological droughts are considered, and agricultural and socio-economic droughts are excluded; (2) we validated the applicability of the Frank copula function in the JRB but failed to establish a generalized method for constructing a composite drought index; (3) there is still a need to improve the prediction accuracy of the random forest model trained in this paper for predicting mild droughts compared to other scenarios; and (4) we did not categorize the situation after a moderate drought, resulting in a lack of research on the composite drought index for extreme drought situations. Furthermore, the propagation mechanism from meteorological drought to hydrological drought was only considered on the time scale. Therefore, the spatial propagation mechanism will be further studied.
5. Conclusions
This study constructs a new comprehensive drought index based on the copula function according to precipitation and baseflow, which can better characterize meteorological and hydrological droughts. The random forest algorithm was used to predict drought, and the LIME algorithm was used to explain the importance of predictors. The following conclusions were obtained:
(1) The CDI can comprehensively characterize meteorological and hydrological droughts, providing reliable and powerful support for monitoring, prevention, control, and forecasting.
(2) From 1991 to 2020, the monthly and annual droughts in the BZA area of the JRB region showed a decreasing trend, and the monthly and annual droughts in the SD area showed an increasing trend. The subregions have different time-varying characteristics. Most droughts occurred in the fall and winter, with mean CDI values of −0.447 and −0.548 at the BZA and SD stations, respectively.
(3) The random forest model training results were accurate for no drought and heavy drought, with average validation accuracies greater than 0.8 at the BZA and SD stations. The LIME interpretation was used to find out the most important values of the characteristics of drought impacts, such as precipitation, baseflow, and evaporation.
Author Contributions
Conceptualization, H.Z.; methodology, W.L. and C.Y.; software, F.W. and F.D.; validation, Y.L.; formal analysis H.N.; investigation, S.H.; resources, H.N. and Y.D.; data curation, J.Y. and Y.C.; writing—original draft preparation H.Z.; writing—review and editing, S.H. All authors have read and agreed to the published version of the manuscript.
Funding
This research was funded by the Zhejiang Provincial Water Resources Department Science and Technology Program, grant number RC2201 and RB2002; Huzhou Science and Technology Plan Project, grant number 2023GZ64; the Natural Science Foundation of Zhejiang Province, grant number LZJWY22E090007; and the Scientific Research Fund of Zhejiang Provincial Education Department, grant number Y202352492.
Data Availability Statement
The data presented in this study are available on request from the corresponding author. The data are not publicly available due to [data are being used in another ongoing research].
Acknowledgments
Thanks to the Zhejiang Provincial Hydrological Management Center for providing the necessary hydrological and meteorological data for our research.
Conflicts of Interest
Author Yao Liu was employed by the company Zhejiang Environmental Technology Co., Ltd. The remaining authors declare that the research was conducted in the absence of any commercial or financial relationships that could be construed as a potential conflict of interest.
References
- Ayantobo, O.O.; Li, Y.; Song, S.; Javed, T.; Yao, N. Probabilistic modelling of drought events in China via 2-dimensional joint Copula. J. Hydrol. 2018, 559, 373–391. [Google Scholar] [CrossRef]
- Oloruntade, A.J.; Mohammad, T.A.; Ghazali, A.H.; Wayayok, A. Analysis of meteorological and hydrological droughts in the Niger-South Basin, Nigeria. Glob. Planet. Chang. 2017, 155, 225–233. [Google Scholar] [CrossRef]
- Marcos-Garcia, P.; Lopez-Nicolas, A.; Pulido-Velazquez, M. Combined use of relative drought indices to analyze climate change impact on meteorological and hydrological droughts in a Mediterranean basin. J. Hydrol. 2017, 554, 292–305. [Google Scholar] [CrossRef]
- Salvadori, G.; De Michele, C. Multivariate real-time assessment of droughts via copula-based multi-site Hazard Trajectories and Fans. J. Hydrol. 2015, 526, 101–115. [Google Scholar] [CrossRef]
- Azam, M.; Maeng, S.J.; Kim, H.S.; Lee, S.W.; Lee, J.E. Spatial and temporal trend analysis of precipitation and drought in South Korea. Water 2018, 10, 765. [Google Scholar] [CrossRef]
- Huang, S.; Huang, Q.; Chang, J.; Zhu, Y.; Leng, G.; Xing, L. Drought structure based on a nonparametric multivariate standardized drought index across the Yellow River basin, China. J. Hydrol. 2015, 530, 127–136. [Google Scholar] [CrossRef]
- Waseem, M.; Ajmal, M.; Kim, T.W. Development of a new composite drought index for multivariate drought assessment. J. Hydrol. 2015, 527, 30–37. [Google Scholar] [CrossRef]
- Huang, S.; Chang, J.; Leng, G.; Huang, Q. Integrated index for drought assessment based on variable fuzzy set theory: A case study in the Yellow River basin, China. J. Hydrol. 2015, 527, 608–618. [Google Scholar] [CrossRef]
- Liu, Y.; Zhu, Y.; Ren, L.; Yong, B.; Singh, V.P.; Yuan, F.; Jiang, S.; Yang, X. On the mechanisms of two composite methods for construction of multivariate drought indices. Sci. Total Environ. 2019, 647, 981–991. [Google Scholar] [CrossRef]
- Kao, S.C.; Govindaraju, R.S. A copula-based joint deficit index for droughts. J. Hydrol. 2010, 380, 121–134. [Google Scholar] [CrossRef]
- Lee, T.; Modarres, R.; Ouarda, T.B. Data-based analysis of bivariate copula tail dependence for drought duration and severity. Hydrol. Process. 2013, 27, 1454–1463. [Google Scholar] [CrossRef]
- Maeng, S.J.; Azam, M.; San Kim, H.; Hwang, J.H. Analysis of changes in spatio-temporal patterns of drought across South Korea. Water 2017, 9, 679. [Google Scholar] [CrossRef]
- Van de Vyver, H.; Van den Bergh, J. The Gaussian copula model for the joint deficit index for droughts. J. Hydrol. 2018, 561, 987–999. [Google Scholar] [CrossRef]
- Meimandi, J.B.; Bazrafshan, O.; Esmaeilpour, Y.; Zamani, H.; Shekari, M. Risk assessment of meteo-groundwater drought using copula approach in the arid region. Stochastic Environ. Res. Risk Assess. 2024, 38, 1523–1540. [Google Scholar] [CrossRef]
- Bazrafshan, O.; Zamani, H.; Mozaffari, E.; Azhdari, Z.; Shekari, M. Trivariate risk analysis of meteorological drought in Iran under climate change scenarios. Meteorol. Atmos. Phys. 2023, 135, 52. [Google Scholar] [CrossRef]
- Azhdari, Z.; Bazrafshan, O.; Zamani, H.; Shekari, M.; Singh, V.P. Hydrometeorological drought risk assessment using linear and nonlinear multivariate methods. Phys. Chem. Earth, Parts A/B/C. 2021, 123, 103046. [Google Scholar] [CrossRef]
- Wang, F.; Wang, Z.; Yang, H.; Di, D.; Zhao, Y.; Liang, Q. A new copula-based standardized precipitation evapotranspiration streamflow index for drought monitoring. J. Hydrol. 2020, 585, 124793. [Google Scholar] [CrossRef]
- Chen, H.; Huang, S.; Xu, Y.-P.; Teegavarapu, R.S.V.; Guo, Y.; Nie, H.; Xie, H. Using baseflow ensembles for hydrologic hysteresis characterization in humid basins of Southeastern China. Water Resour. Res. 2024, 60, e2023WR036195. [Google Scholar] [CrossRef]
- Odongo, R.A.; De Moel, H.; Van Loon, A.F. Propagation from meteorological to hydrological drought in the Horn of Africa using both standardized and threshold-based indices. Nat. Hazards Earth Syst. Sci. 2023, 23, 2365–2386. [Google Scholar] [CrossRef]
- Bazrkar, M.H.; Chu, X. New standardized base flow index for identification of hydrologic drought in the Red river of the North Basin. Nat. Hazards Rev. 2020, 21, 05020011. [Google Scholar] [CrossRef]
- Meresa, H.; Zhang, Y.; Tian, J.; Faiz, M. Understanding the role of catchment and climate characteristics in the propagation of meteorological to hydrological drought. J. Hydrol. 2023, 617, 128967. [Google Scholar] [CrossRef]
- Kwak, J.; Joo, H.; Jung, J.; Lee, J.; Kim, S.; Kim, H.S. A case study: Bivariate drought identification on the Andong dam, South Korea. Stoch. Environ. Res. Risk Assess. 2021, 35, 549–560. [Google Scholar] [CrossRef]
- Clancy, K.A. Standardized Baseflow Drought Index Comparison to SPEI in High Baseflow Streams. J. Water Resour. Protect. 2023, 15, 557–580. [Google Scholar] [CrossRef]
- Porhemmat, J.; Altafi Dadgar, M. Analysis of hydrological drought indices in Alpine Zagros Mountains of Iran. Arab. J. Geosci. 2023, 16, 594. [Google Scholar] [CrossRef]
- Lee, S.; Ajami, H. Comprehensive assessment of baseflow responses to long-term meteorological droughts across the United States. J. Hydrol. 2023, 626, 130256. [Google Scholar] [CrossRef]
- Wang, H.; Li, G.; Wang, Z. Fast SVM classifier for large-scale classification problems. Inform. Sci. 2023, 642, 119136. [Google Scholar] [CrossRef]
- Chen, L.; Wu, T.; Wang, Z.; Lin, X.; Cai, Y. A novel hybrid BPNN model based on adaptive evolutionary Artificial Bee Colony Algorithm for water quality index prediction. Ecol. Indic. 2023, 146, 109882. [Google Scholar] [CrossRef]
- Piraei, R.; Afzali, S.H.; Niazkar, M. Assessment of XGBoost to estimate total sediment loads in rivers. Water Resour. Manag. 2023, 37, 5289–5306. [Google Scholar] [CrossRef]
- Danandeh Mehr, A. A gene-random forest model for meteorological drought prediction. Pure Appl. Geophys. 2023, 180, 2927–2937. [Google Scholar] [CrossRef]
- Hu, J.; Szymczak, S. A review on longitudinal data analysis with random forest. Brief. Bioinf. 2023, 24, bbad002. [Google Scholar] [CrossRef]
- Elbeltagi, A.; Pande, C.B.; Kumar, M.; Tolche, A.D.; Singh, S.K.; Kumar, A.; Vishwakarma, D.K. Prediction of meteorological drought and standardized precipitation index based on the random forest (RF), random tree (RT), and Gaussian process regression (GPR) models. Environ. Sci. Pollut. Res. 2023, 30, 43183–43202. [Google Scholar] [CrossRef]
- Lotfirad, M.; Esmaeili-Gisavandani, H.; Adib, A. Drought monitoring and prediction using SPI, SPEI, and random forest model in various climates of Iran. J. Water Clim. Chang. 2022, 13, 383–406. [Google Scholar] [CrossRef]
- Zheng, J.; Xin, D.; Cheng, Q.; Tian, M.; Yang, L. The Random Forest Model for Analyzing and Forecasting the US Stock Market in the Context of Smart Finance. arXiv 2024. [Google Scholar] [CrossRef]
- McKee, T.B.; Doesken, N.J.; Kleist, J. The relationship of drought frequency and duration to time scales. In Proceedings of the 8th Conference on Applied Climatology, Anaheim, CA, USA, 17–22 January 1993; Volume 17, pp. 179–183. [Google Scholar]
- Vicente-Serrano, S.M.; Beguería, S.; López-Moreno, J.I. A multiscalar drought index sensitive to global warming: The standardized precipitation evapotranspiration index. J. Clim. 2010, 23, 1696–1718. [Google Scholar] [CrossRef]
- Alam, N.M.; Sharma, G.C.; Moreira, E.; Jana, C.; Mishra, P.K.; Sharma, N.K.; Mandal, D. Evaluation of drought using SPEI drought class transitions and loglinear models for different agro-ecological regions of India. Phys. Chem. Earth Parts A/B/C 2017, 100, 31–43. [Google Scholar] [CrossRef]
- Aryal, S.K.; Zhang, Y.; Chiew, F. Enhanced low flow prediction for water and environmental management. J. Hydrol. 2020, 584, 124658. [Google Scholar] [CrossRef]
- Nathan, R.J.; McMahon, T.A. Evaluation of automated techniques for base flow and recession analyses. Water Resour. Res. 1990, 26, 465–473. [Google Scholar] [CrossRef]
- Cheng, L.; Zhang, L.; Brutsaert, W. Automated selection of pure base flows from regular daily streamflow data: Objective algorithm. J. Hydrol. Eng. 2016, 21, 6016008. [Google Scholar] [CrossRef]
- Wang, L.; Zhang, X.; Wang, S.; Salahou, M.K.; Fang, Y. Analysis and application of drought characteristics based on theory of runs and copulas in Yunnan, Southwest China. Int. J. Environ. Res. Public Health 2020, 17, 654. [Google Scholar] [CrossRef]
- Eckert, C.; Hohberger, J. Addressing endogeneity without instrumental variables: An evaluation of the gaussian copula approach for management research. J. Manag. 2023, 49, 460–495. [Google Scholar] [CrossRef]
- Lin, L.; Zhou, X.; Gao, T.; Zhu, Z.; Qing, Y.; Liao, W.; Lin, W. Herb pairs containing Curcumae Rhizoma (Ezhu): A review of bio-active constituents, compatibility effects and t-copula function analysis. J. Ethnopharmacol. 2023, 319, 17199. [Google Scholar] [CrossRef] [PubMed]
- Poonia, N.; Azad, S. A New Statistical Distribution Derived from a Clayton Copula for Modeling Bivariate Processes. J. Hydrometeorol. 2023, 4, 659–678. [Google Scholar] [CrossRef]
- Huang, S.; Li, Q.; Shu, Z.; Chan, P.W. Copula-based joint distribution analysis of wind speed and wind direction: Wind energy development for Hong Kong. Wind Energy 2023, 6, 900–922. [Google Scholar] [CrossRef]
- Dewick, P.R.; Liu, S. Copula modelling to analyse financial data. J. Risk Financ. Manag. 2022, 5, 104. [Google Scholar] [CrossRef]
- Wang, J.; Rong, G.; Li, K.; Zhang, J. Analysis of Drought Characteristics in Northern Shaanxi Based on Copula Function. Water 2021, 13, 1445. [Google Scholar] [CrossRef]
- Won, J.; Choi, J.; Lee, O.; Kim, S. Copula-based Joint Drought Index using SPI and EDDI and its application to climate change. Sci. Total Environ. 2020, 744, 140701. [Google Scholar] [CrossRef] [PubMed]
- Huang, K.; Fan, Y.R. Parameter uncertainty and sensitivity evaluation of copula-based multivariate hydroclimatic risk assessment. J. Environ. Inform. 2021, 2, 38. [Google Scholar] [CrossRef]
- Salimi, H.; Asadi, E.; Darbandi, S. Meteorological and hydrological drought monitoring using several drought indices. Appl. Water Sci. 2021, 11, 11. [Google Scholar] [CrossRef]
- Chen, H.; Teegavarapu, R.S.V. Spatial and temporal variabilities in baseflow characteristics across the continental USA. Theor. Appl. Climatol. 2021, 143, 1615–1629. [Google Scholar] [CrossRef]
- Breiman, L. Random forests. Mach. Learn. 2001, 45, 5–32. [Google Scholar] [CrossRef]
- Dikshit, A.; Pradhan, B.; Alamri, A.M. Short-Term Spatio-Temporal Drought Forecasting Using Random Forests Model at New South Wales, Australia. Appl. Sci. 2020, 10, 4254. [Google Scholar] [CrossRef]
- Ruiz-Aĺvarez, M.; Gomariz-Castillo, F.; Alonso-Sarría, F. Evapotranspiration Response to Climate Change in Semi-Arid Areas: Using Random Forest as Multi-Model Ensemble Method. Water 2021, 13, 222. [Google Scholar] [CrossRef]
- Zarei, A.R.; Mahmoudi, M.R.; Moghimi, M.M. Determining the most appropriate drought index using the random forest algorithm with an emphasis on agricultural drought. Nat. Hazards 2023, 115, 923–946. [Google Scholar] [CrossRef]
- Garreau, D.; Luxburg, U. Explaining the explainer: A first theoretical analysis of LIME. In Proceedings of the International Conference on Artificial Intelligence and Statistics, Virtually, 26–28 August 2020; pp. 1287–1296. [Google Scholar]
- Jebli, I.; Belouadha, F.Z.; Kabbaj, M.I.; Tilioua, A. Prediction of solar energy guided by pearson correlation using machine learning. Energy 2021, 224, 120109. [Google Scholar] [CrossRef]
- Chen, H.; Huang, S.; Xu, Y.P.; Teegavarapu, R.S.; Guo, Y.; Nie, H.; Xie, H.; Zhang, L. River ecological flow early warning forecasting using baseflow separation and machine learning in the Jiaojiang River Basin, Southeast China. Sci. Total Environ. 2023, 882, 163571. [Google Scholar] [CrossRef] [PubMed]
- Bageshree, K.; Abhishek; Kinouchi, T. A Multivariate Drought Index for Seasonal Agriculture Drought Classification in Semiarid Regions. Remote Sens. 2022, 14, 3891. [Google Scholar] [CrossRef]
- Guo, Y.; Huang, S.; Huang, Q.; Wang, H.; Wang, L.; Fang, W. Copulas-based bivariate socio-economic drought dynamic risk assessment in a changing environment. J. Hydrol. 2019, 575, 1052–1064. [Google Scholar] [CrossRef]
- Herrera-Estrada, J.E.; Satoh, Y.; Sheffield, J. Spatiotemporal dynamics of global drought. Geophys. Res. Lett. 2017, 44, 2254–2263. [Google Scholar] [CrossRef]
- Hao, Z.; AghaKouchak, A. Multivariate standardized drought index: A parametric multi-index model. Adv. Water Resour. 2013, 57, 12–18. [Google Scholar] [CrossRef]
Disclaimer/Publisher’s Note: The statements, opinions and data contained in all publications are solely those of the individual author(s) and contributor(s) and not of MDPI and/or the editor(s). MDPI and/or the editor(s) disclaim responsibility for any injury to people or property resulting from any ideas, methods, instructions or products referred to in the content. |
© 2024 by the authors. Licensee MDPI, Basel, Switzerland. This article is an open access article distributed under the terms and conditions of the Creative Commons Attribution (CC BY) license (https://creativecommons.org/licenses/by/4.0/).