Article

Research on the Flow Characteristics of Power-Law Fluids in Self-Priming Sewage Pumps

by
Xukan Li
1,
Shuihua Zheng
2,3,
Zhenghao Shao
2,
Mingjie Xu
2,
Yiliang Li
2,
Qing Huang
2,
Min Chai
2 and
Zenan Sun
2,*
1
Zhejiang Zheneng Aerospace Hydrogen Energy Technology, Co., Ltd., Hangzhou 310014, China
2
Institute of Process Equipment and Control Engineering, College of Mechanical Engineering, Zhejiang University of Technology, Hangzhou 310014, China
3
Taizhou Key Laboratory of Advanced Manufacturing Technology, Taizhou Institude, Zhejiang University of Technology, Taizhou 318014, China
*
Author to whom correspondence should be addressed.
Water 2024, 16(11), 1526; https://doi.org/10.3390/w16111526
Submission received: 11 April 2024 / Revised: 7 May 2024 / Accepted: 16 May 2024 / Published: 26 May 2024
(This article belongs to the Special Issue Hydrodynamics in Pumping and Hydropower Systems)

Abstract

:
To conduct a more in-depth study of the flow mechanism of power-law fluids within sewage pumps, this paper focuses on self-priming sewage pumps, with typical power-law fluid (Carboxymethyl Cellulose, CMC) as the conveying medium. The constitutive equations for sewage and typical power-law fluid (CMC solution) were established using the power-law model. Through numerical calculation methods, the non-steady flow field inside the pump of different concentration power-law fluids was analyzed from various aspects such as velocity, pressure, vorticity, and wall shear stress. The pressure pulsations at key locations in the pump flow field were monitored and analyzed. At the rated flow rate, when the concentration of CMC solution increased from 0.5% to 2.0%, the channel pressure and tongue pressure decreased by 16.5% and 3.5%, respectively. This indicates that the pressure on the impeller blades, within the flow passages, and at the tongue of the volute all decrease with the increase in concentration of CMC solution. This may alter the fluid flow pattern, leading to more vortex motion and shear deformation, while also reducing the pump’s pressure boosting capability, thereby affecting the pump’s performance stability. It can be inferred from quantitative comparisons that changes in rheological properties had a significant impact on the flow characteristics of sewage pumps. This paper reveals that some flow characteristics of power-law fluids in sewage pumps, providing a theoretical and reference basis for the performance optimization and flow mechanism research of sewage pumps.

1. Introduction

Sewage pumps are hydraulic machines extensively utilized in drainage projects, including urban sewage and industrial wastewater systems. The conveyed sewage typically presents complex rheological properties akin to power-law fluids. These rheological characteristics play a pivotal role in influencing the internal flow dynamics of sewage pumps, consequently impacting their service life and operational efficiency significantly. Self-priming sewage pumps are widely employed for transporting both industrial and domestic wastewater. Such wastewater often comprises heterogeneous multiphase flows with rheological properties differing from those of clear water, frequently demonstrating traits of non-Newtonian fluids. Furthermore, sewage and wastewater originating from various scenarios and industries frequently contain substantial amounts of chemically soluble substances and organic materials. This results in more pronounced non-Newtonian effects within the fluid, exacerbating the complexity of the system [1,2].
To enhance the performance of sewage pumps, numerous scholars have conducted in-depth research. Moloshnyi et al. [3] studied the influence of operation time on the performance of sewage pumps. The real geometric parameters of sewage pumps under different operating times were reflected using three-dimensional optical scanning, and the results were validated through numerical simulations and experimental methods. Consequently, the impact of impeller wear on sewage pump performance curve variations was derived. Chen et al. [4] asserted that the ability of single-blade centrifugal pumps to transport large-volume solid impurities is a necessary condition for achieving high-performance sewage pumps. Six impellers with different inlet blade angles were designed for numerical simulation and research was conducted, obtaining the optimal inlet angle of the blades, which provided a theoretical basis for improving the performance of single-blade centrifugal pumps. Zhou et al. [5] suggested that the reflux holes of self-priming centrifugal pumps have a significant impact on pump performance. To study the specific influencing mechanism, four groups of reflux holes with different areas were arranged for transient numerical simulation. Eventually, it was found that within a certain range, as the area of the reflux holes decreased, the performance of self-priming centrifugal pumps improved. Wu et al. [6] focused on improving the performance of sewage pumps by concentrating on the impeller. Based on the same impeller meridian shape, five blade models with different blade profiles were designed, followed by numerical simulation studies on the five groups of models. By applying entropy production theory, the mechanism of energy loss was revealed, and it was concluded that under different flow velocities, the scheme with a distribution curve of concave blade angles exhibited the best hydraulic performance. The results confirmed the feasibility of improving hydraulic performance by optimizing the blade profile of sewage pumps. Li et al. [7] utilized Computational Fluid Dynamics (CFD) numerical simulation technology to conduct numerical simulations and experimental verifications of gas–liquid two-phase flow and impeller structure under different operating conditions of centrifugal pumps. During the research process, the structural parameters of the impeller were studied, and the optimal combination of the number of impeller blades, blade wrap angle, and blade installation angle was obtained through simulation, providing a theoretical basis for the erosion resistance of centrifugal pumps. Gu et al. [8] applied biomimicry to design non-smooth sawtooth structures on the suction surface of the blades, thereby reducing the cavitation area and cavitation damage of centrifugal pumps. Kudo [9] conducted fiber blockage tests inside visible pumps and recorded the flow state of fibers inside the pump, revealing the blocking mechanism inside the pump. Imasaka et al. [10] studied the movement of foreign objects inside the pump using numerical simulation and Particle Image Velocimetry (PIV) motion capture methods. In the numerical simulation, the Discrete Element Method (DEM) was used to model fiber foreign objects in the pump, and the simulation results were compared and verified to confirm the reliability of this modeling method. Deng et al. [11] used the Computational Fluid Dynamics-Discrete Element Method (CFD-DEM) co-simulation method to elucidate the solid–liquid two-phase flow state of multi-stage centrifugal pumps under conditions of constant particle concentration and different particle sizes. Through numerical simulation, it was found that particles in the range of 10~30 mm could better ensure the reflow performance of the pump.
Given the ubiquity of non-Newtonian fluids and the significant differences in rheological properties between non-Newtonian and Newtonian fluids, it is essential to conduct research on the flow mechanisms of non-Newtonian fluids in many situations. Non-Newtonian fluids refer to liquids where the shear stress is not linearly proportional to the shear rate. Extensive studies on sewage have shown that sewage is a non-Newtonian fluid and exhibits characteristics of power-law fluids [12,13,14].
In pump research, more and more scholars are beginning to pay attention to the rheological properties of non-Newtonian fluids and their influence on pump bodies and flow mechanisms. Rituraj et al. [15] introduced modeling techniques for external gear pumps operating with non-Newtonian fluids, applying, for the first time, the HYGESim simulation tool developed by the research team over the past decade to simulate non-Newtonian fluids. They compared the flow characteristics of fluids with different viscosities in gear pumps through numerical simulations and experimental results. Sun et al. [16] conducted a comparative study of carboxymethyl cellulose (CMC) and viscous Newtonian fluids in axial flow pumps. Through numerical simulation, it was found that the shear-thinning characteristics of CMC solution led to an increase in tip leakage flow velocity and a sharp decrease in friction loss. Valdes et al. [17] conducted a detailed analysis of the flow characteristics of multi-stage Electric Submersible Pumps (ESP) in handling shear-thinning non-Newtonian fluids. In this paper, the authors tested water, two different viscosities of oil, and two different non-Newtonian fluids (0.5% and 1% CMC aqueous solutions). It was found that the tested non-Newtonian CMC fluids performed better in the head than the two oils, and the performance of ESP did not deteriorate rapidly as with viscous oils. Mrinal et al. [18] conducted experimental analysis on centrifugal pumps transporting non-Newtonian fluids (mainly slurry). The non-Newtonian fluid used in the experiment was composed of bentonite powder, water, and Na2CO3 in certain proportions. Head and efficiency were predicted using a Polynomial Regression (PR) model, with the error controlled within the ranges of 3.137% and 5.096%, respectively.
In conclusion, research on various types of non-Newtonian fluids underscores the considerable influence of rheological properties on fluid flow dynamics. Sewage pumps, typical hydraulic machines prevalent in diverse and often challenging environments, handle fluids exhibiting a spectrum of characteristics, frequently showcasing non-Newtonian behavior. However, current research on sewage pumps mainly focuses on improving anti-clogging and anti-entanglement performance, with relatively little emphasis on studying the transported fluid medium within sewage pumps. Most studies treat sewage as a Newtonian fluid, without fully understanding the flow characteristics and influencing mechanisms of non-Newtonian fluids inside sewage pumps. The complex rheological properties may significantly affect the internal flow field of sewage pumps, leading to adverse effects such as shortened service life and reduced operational efficiency. Therefore, considering the rheological properties of the fluid as a factor in sewage pump-related research can provide more accurate research results and valuable insights into the performance and mechanisms of sewage pumps.
This paper conducted a study on the unsteady flow of power-law fluids with different concentrations inside sewage pumps, summarizing certain variations in the unsteady flow of power-law fluids within the pump. These findings serve as a reference for obtaining a more accurate understanding of the complex flow mechanisms inside sewage pumps and for optimizing the design of sewage pumps.

2. Establishment of the Constitutive Equation for Power-Law Fluids

For sewage pumps, the conveyed sewage is also a type of power-law fluid with complex rheological properties. These complex rheological properties will significantly affect the flow field inside the pump, making the rheological characteristics of the fluid inside the pump one of the key focuses of this paper.
Carboxymethyl cellulose (CMC) is an organic compound derived from cellulose through carboxymethylation. Its aqueous solution exhibits thickening, film-forming, adhesive, moisture retention, colloid protection, emulsifying, and suspending properties. CMC finds wide applications in industries such as petroleum, food, pharmaceuticals, textiles, and papermaking, and is one of the most important cellulose ethers. Due to its excellent thickening effect and rheological properties characteristic of power-law fluids, CMC solution is often used by many scholars to characterize specific power-law fluids in real-life scenarios. Sewage serves as a good representation of CMC solution, and there are many instances where scholars have applied it. For example, Valdes et al. [17] and Nguyen and Lai [19] have used CMC solution to study the flow characteristics of water pumps.
The rheological properties of CMC solution were determined using the Anton Paar MCR302 Advanced Rheometer. Figure 1 shows the four groups of CMC solution samples to be tested, and Figure 2 shows the Anton Paar MCR302 Advanced Rotational Rheometer. Rheological data for CMC solutions with concentrations of 0.5%, 1.0%, 1.5%, and 2.0% were measured using the rheometer and are shown in Figure 3. Due to the measurement principle of the rheometer, the data sampling points are evenly distributed on a logarithmic scale of the abscissa. It can be noted that different concentrations of CMC solutions exhibit significant differences in viscosity at low shear rates. However, when the shear rate exceeds 0.1/s, the differences become extremely small. Therefore, by converting the viscosity coordinates into a logarithmic scale, the differences in viscosity of CMC solutions at higher shear rates can be observed. From the double logarithmic coordinate data plot, it is evident that the viscosity of CMC solutions is positively correlated with the solution concentration, and the trend of viscosity variation with shear rate is also very similar for different concentrations of CMC solutions.
Combining the widely used power-law model in the non-Newtonian viscosity model [20,21], the constitutive equations for CMC solutions with concentrations of 0.5%, 1.0%, 1.5%, and 2.0% were constructed. The specific equations are as follows:
μ = k   γ ˙ n 1 ,
μ 0.5 = 0.05570 γ ˙ - 1.01162 ,
μ 1.0 = 0.08925 γ ˙ - 1.04289 ,
μ 1.5 = 0.21271 γ ˙ - 0.9743 ,
μ 2.0 = 0.29959 γ ˙ - 0.99001 ,
In the equations, Equation (1) represents the expression of the power-law model, μ represents dynamic viscosity, Pa·s; γ ˙ represents shear rate, 1/s; k represents consistency coefficient, and Pa·sn; n represents the flow behavior index.

3. Numerical Computation Methods and Settings for Sewage Pumps

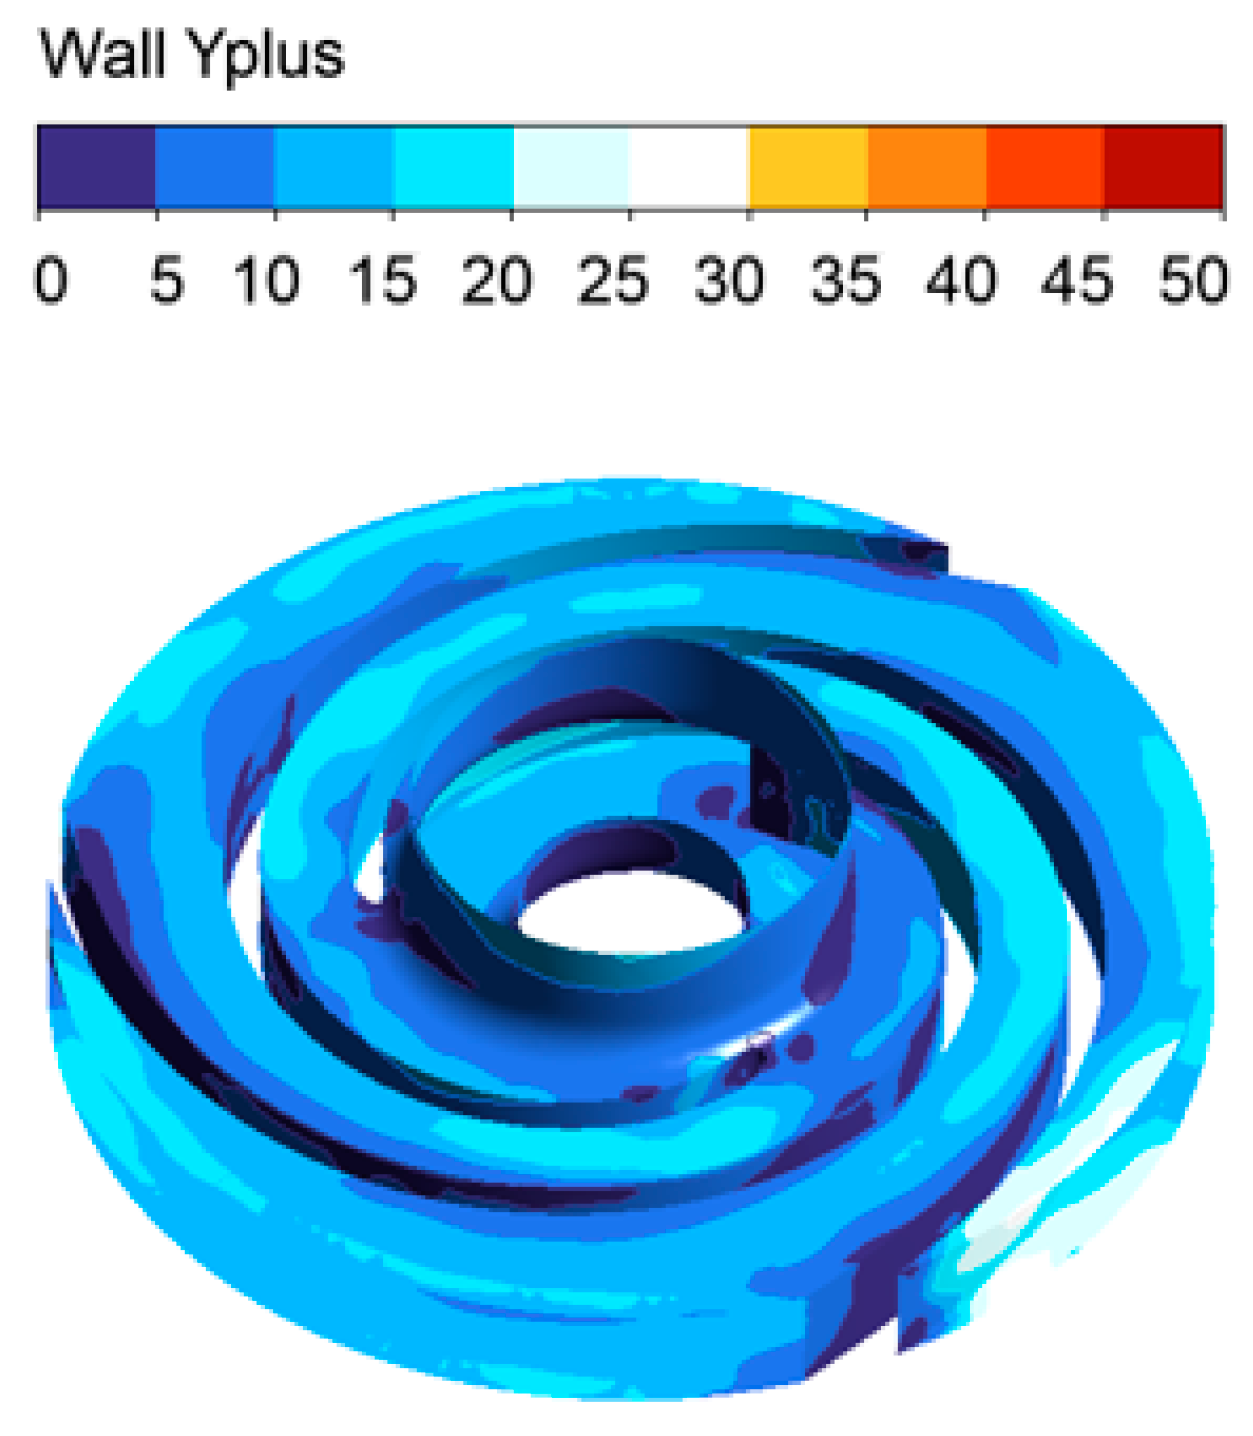
3.1. Fluid Domain and Mesh

The main basic parameters of the sewage pump studied in this paper are listed in Table 1. Figure 4 shows the decomposition diagram of the pump’s fluid domain in three dimensions. In order to simulate the internal flow field of the sewage pump more realistically, detailed modeling of all flow fields inside the sewage pump was carried out. The inlet and outlet pipes were appropriately extended to stabilize the flow field.
The fluid domain was meshed using ICEM, and structured grids were employed for numerical computations in all fluid domains in this paper. To balance computational accuracy and resource usage, seven grid partitioning schemes were devised. Under the same boundary condition settings, complete simulations were conducted for these seven different schemes.
In most numerical simulation studies of centrifugal pumps, the quality of the grid is validated using head or efficiency. However, sometimes the difference between head and efficiency is small. Therefore, this paper used a more intuitive metric, the mean square error (MSE), to assess grid quality [17,22]. Additionally, the computational resources required for simulation were recorded. MSE and computational time were used as criteria for selecting grid schemes. The specific formula for calculating MSE is as follows:
MSE = i H EXP i - H CFD i H EXP i 2 4 ,
In the equation, H E X P i represents the experimental head, m; and   H C F D i represents the simulated head, m.
Figure 5 illustrates the relationship between the number of grid cells, MSE of the head, and computational resources. When the number of grid cells exceeds 2.1 million, the change rate of MSE of the head is less than 3%, indicating that the grid scheme at this point has little impact on the computational results. At the same time, in order to save computational resources and time, the grid scheme with the least required computational core hours when MSE is less than 3% was selected. As shown in Figure 5, the most suitable grid scheme is the one with 2.1 million grid cells. The final grids used for simulation are shown in Figure 6, where all grid cells are structured and all wall surfaces are treated with a refined boundary layer.
In turbulence studies, the flow within the turbulent boundary layer is crucial. In CFD simulations, the accuracy of turbulent boundary layer calculations is often determined by the grid height near the wall, typically evaluated using the non-dimensional wall distance y+. Figure 7 shows the distribution of y+ on the walls in the impeller region. In the Figure, y+ at all impeller wall surfaces is less than 30, meeting the requirements for turbulent model calculations [23].

3.2. Boundary Condition Settings

This paper employed ANSYS Fluent 2022R1 software for numerical computations. The fluid medium was modeled using a non-Newtonian power-law model with customized editing. The inlet boundary condition was set as velocity inlet, while the outlet was set as pressure outlet. For steady-state simulations, the SST k-ω turbulence model was chosen, with a convergence criterion of less than 10−5 for all residuals. The converged results from the steady-state simulation were used as the initial flow field for transient simulations. For transient simulations, the Scale Adaptive Simulation (SAS) turbulence model was selected. This model is more efficient in capturing vortex structures in complex flow fields compared to RANS, while being more computationally economical than LES and DNS [23,24]. The impeller rotated for a duration of 1° at the rated speed, which was 9.921 × 10⁻⁵ s. The total duration required for 15 revolutions was set as the total simulation time, resulting in a total of 5400 time steps. Table 2 presents the specific settings of boundary conditions, turbulence models, and other parameters.

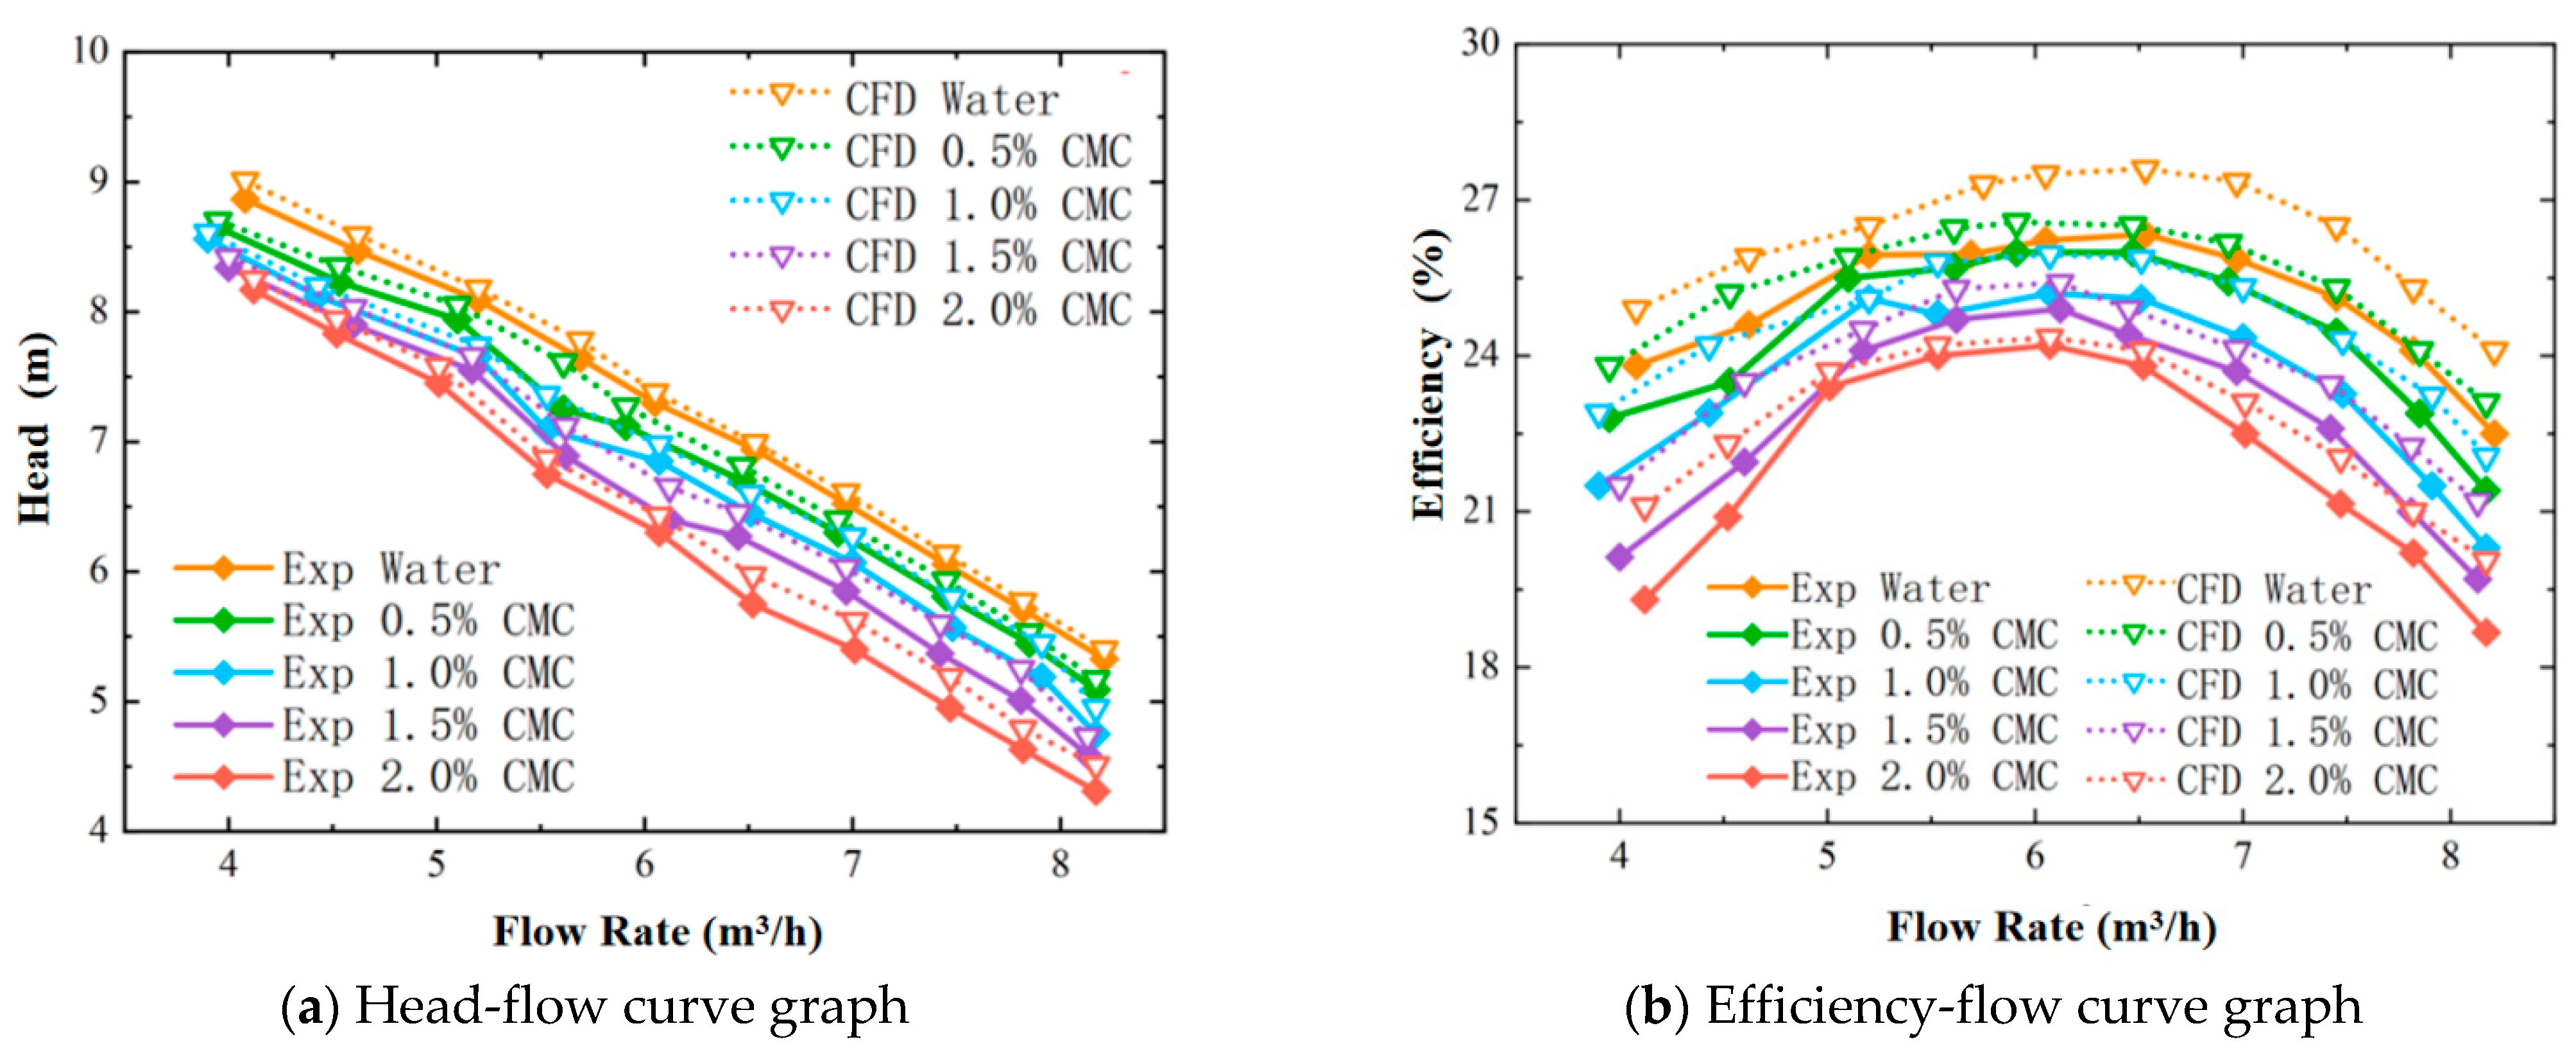
3.3. Numerical Computation Method Validation

This paper conducted external characteristic tests and simulation calculations for 10 different flow conditions of the test pump. Figure 8 shows the transparent pump used in the experiment, while Figure 9a depicts a schematic diagram of the experimental setup, and Figure 9b shows a photograph of the experimental setup. The inlet and outlet of the test rig are equipped with gate valves and pressure sensors. The gate valve at the outlet is used to adjust the flow rate during the experiment. Pressure sensors installed at the inlet and outlet provide pressure readings, allowing for the calculation of the head of the test pump. Additionally, the distribution box is connected to the motor and control computer, enabling control of the motor speed and measurement of the motor power for the efficiency calculations of the test pump.
In this experiment, the design flow rate of the pump is 6.5 m3/h, and all data were measured at the rated speed of 1680 rpm. Flow control is achieved by adjusting the gate valve in the outlet pipeline. Inlet pressure, outlet pressure, and flow rate data at different flow rates are obtained from pressure sensors and flow meters at the inlet and outlet. The head and efficiency curves are then calculated based on the motor output power at different flow rates. Since this study investigates CMC solutions of different concentrations, which exhibit varying rheological properties compared to water, the pump performance may vary. Therefore, characteristic tests were also conducted for CMC solutions of different concentrations. Finally, the experiment measured the inlet and outlet pressure values of pure water and 0.5% to 2.0% CMC solutions at flow rates ranging from 4.0 ± 0.1 m3/h to 8.2 ± 0.1 m3/h to calculate the head and efficiency curves for the five groups of test fluids within this flow rate range.
Based on the measured and simulated data, the numerical values of head and efficiency were calculated for each flow condition, resulting in a comparison shown in Figure 10a,b. From the figure, it is noted that the simulated results of head and efficiency are higher than the experimental results. The experimental errors arise from factors such as mechanical losses, friction losses, and motor efficiency losses. However, the experimental and simulated results remain very close, with errors within 5%. This indicates that the numerical simulation method used in this paper is accurate and effective.

4. Results Analysis

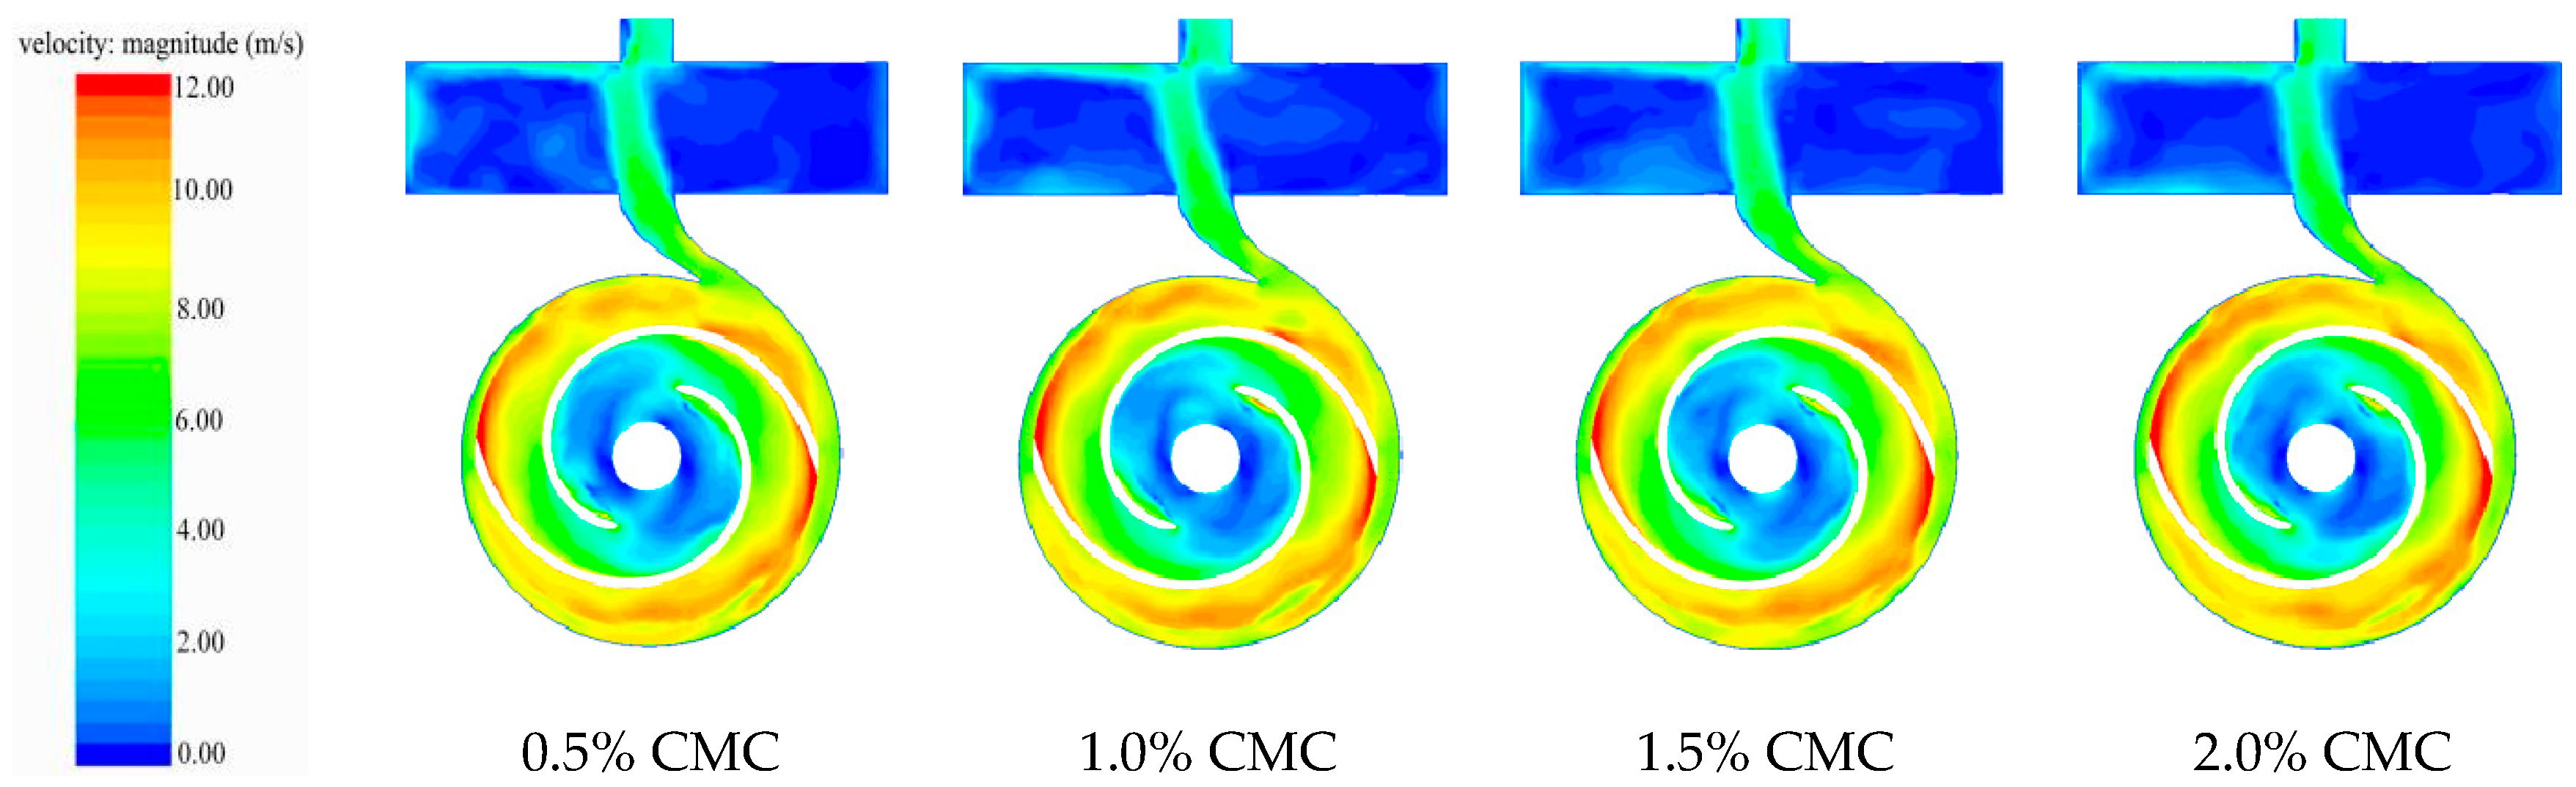
4.1. Velocity Analysis

Figure 11 shows velocity contour maps obtained from simulations of the pump using different concentrations of CMC solution as the medium. From the Figure, it is evident that with the high-speed rotation of the impeller, significant high-speed wake flows are generated. The flow near the blade tip approaches the peripheral velocity of the impeller’s outer edge. The areas with lower velocities in the impeller domain are located from the inlet of the impeller to the leading edge of the blade.

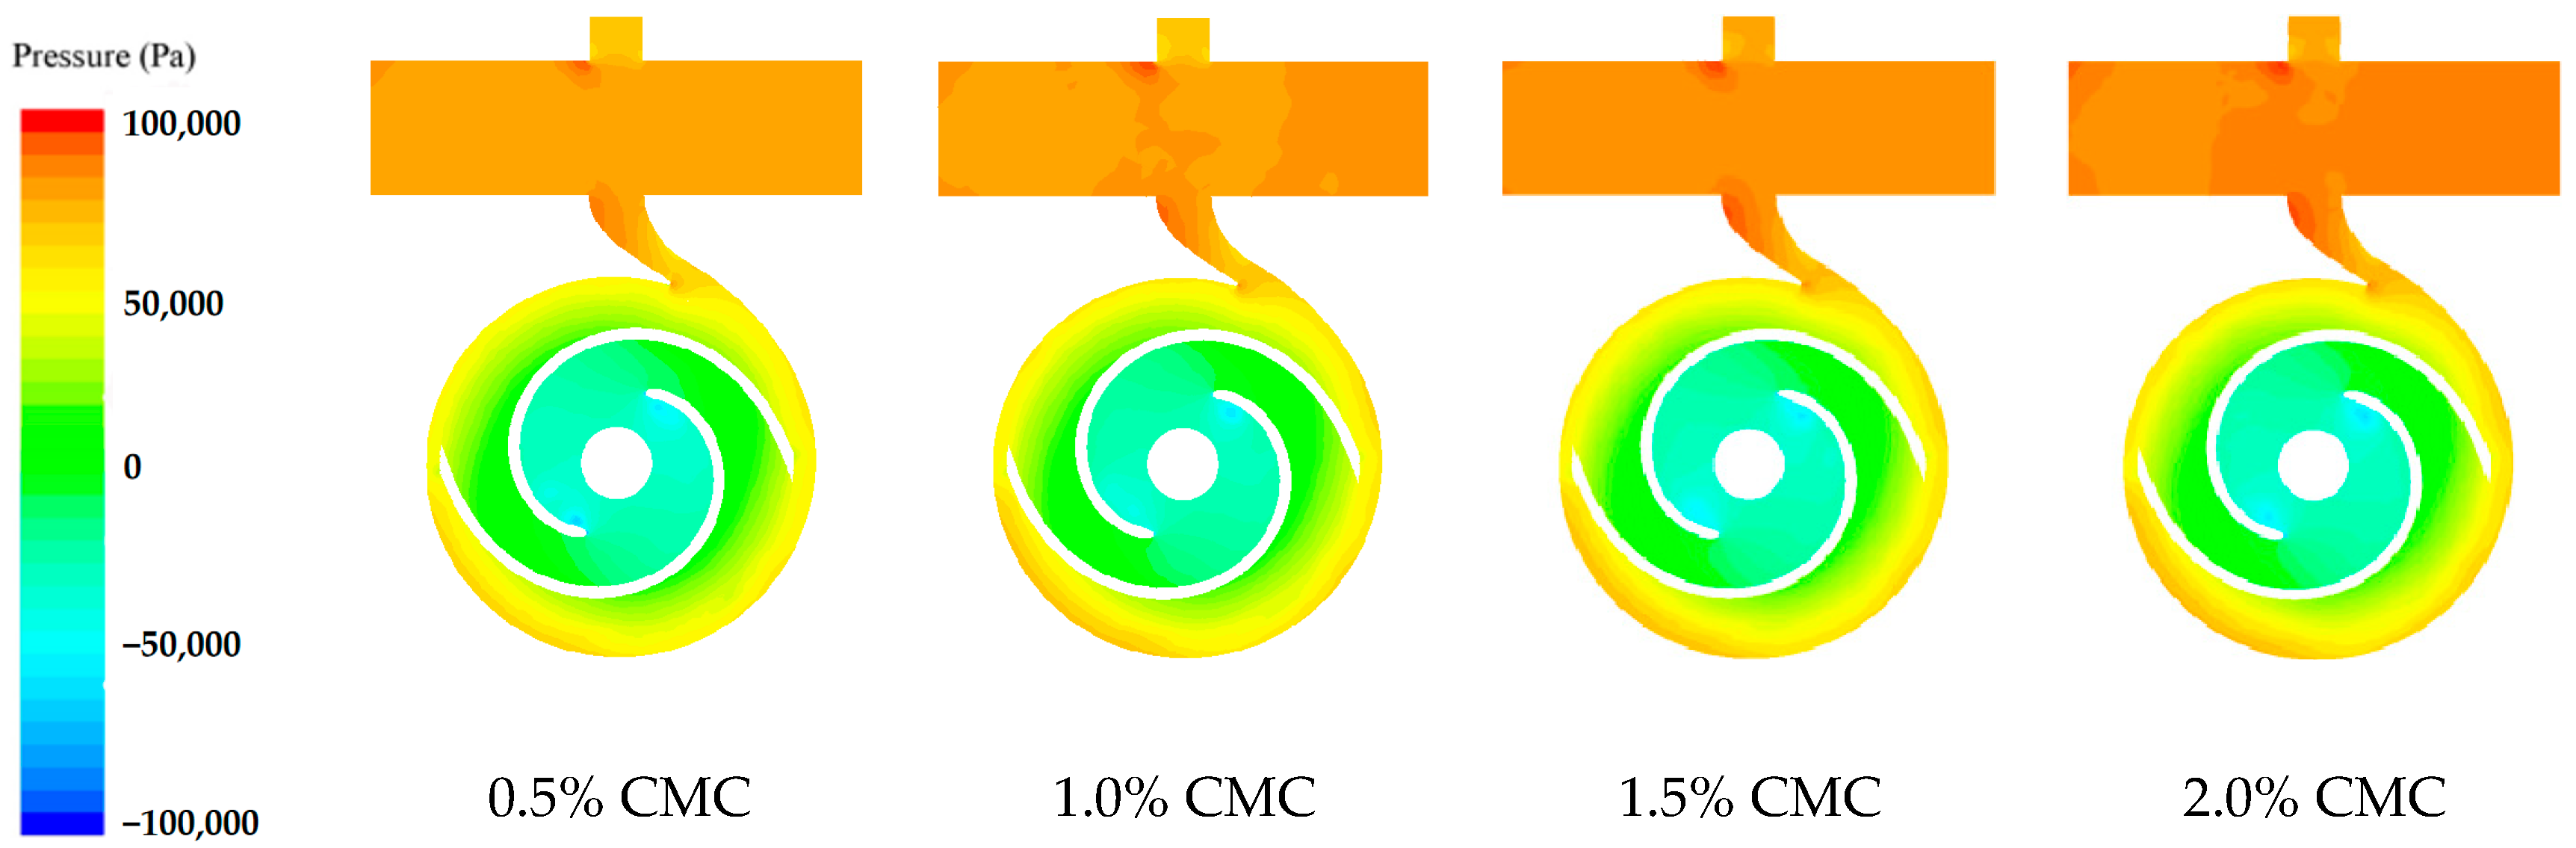
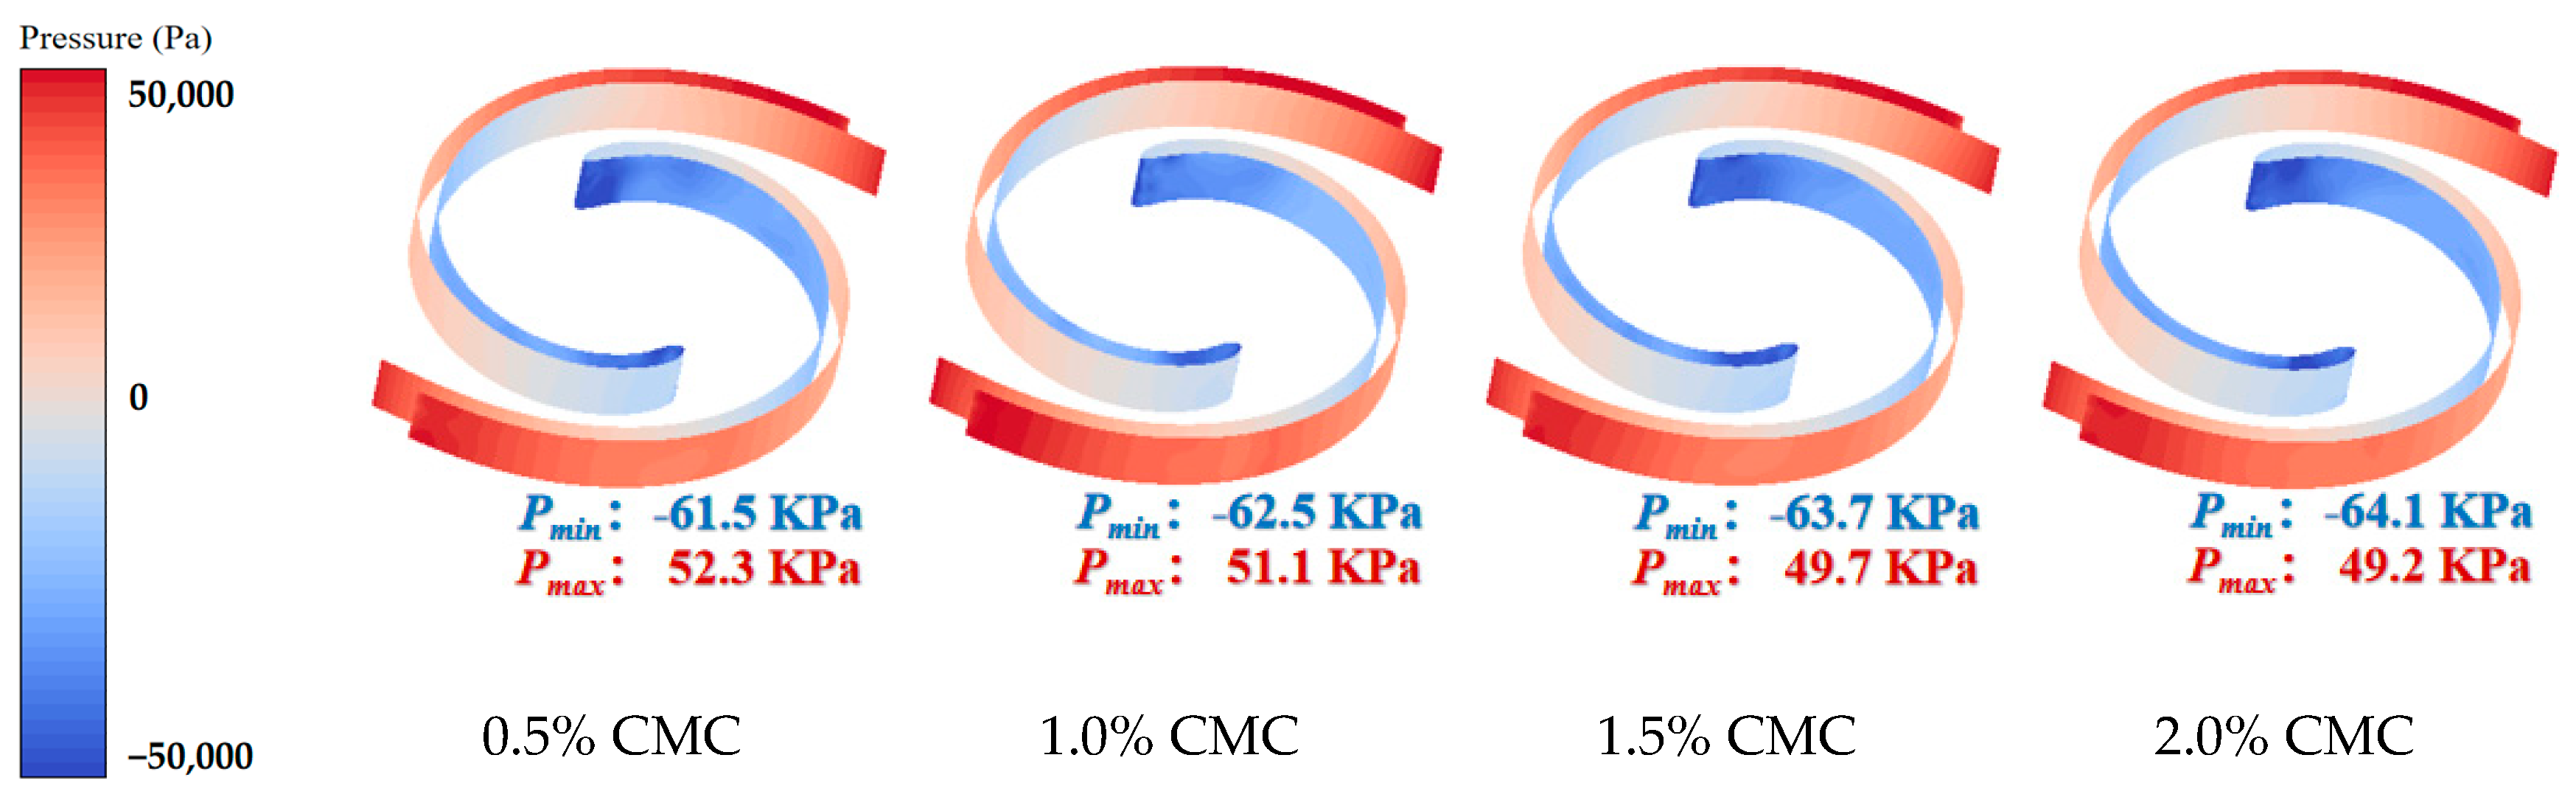
4.2. Pressure Analysis

Figure 12 depicts pressure contour maps obtained from simulations of the pump using different concentrations of CMC solution as the medium. Analysis reveals that the impeller and volute regions are areas of lower pressure, while the gas–liquid separation chamber is characterized by higher pressure. Examining the pressure distribution at the gas–liquid separation chamber and the rotating flow region, it is observed that the area with the highest pressure, the gas–liquid separation chamber, corresponds to the region with lower velocity. Conversely, the impeller and volute regions, with lower pressure, coincide with areas of higher velocity. However, upon individual analysis of the impeller and volute regions, it is found that the pressure distribution trend bears some similarity to the velocity distribution, exhibiting a staggered distribution along the radial distance.
Figure 13 depicts the pressure effects of different concentrations of CMC on the impeller of the test pump. By comparing the variations in maximum and minimum pressures on the impeller, it is analyzed that both Pmin and Pmax decrease to a certain extent as the concentration increases.

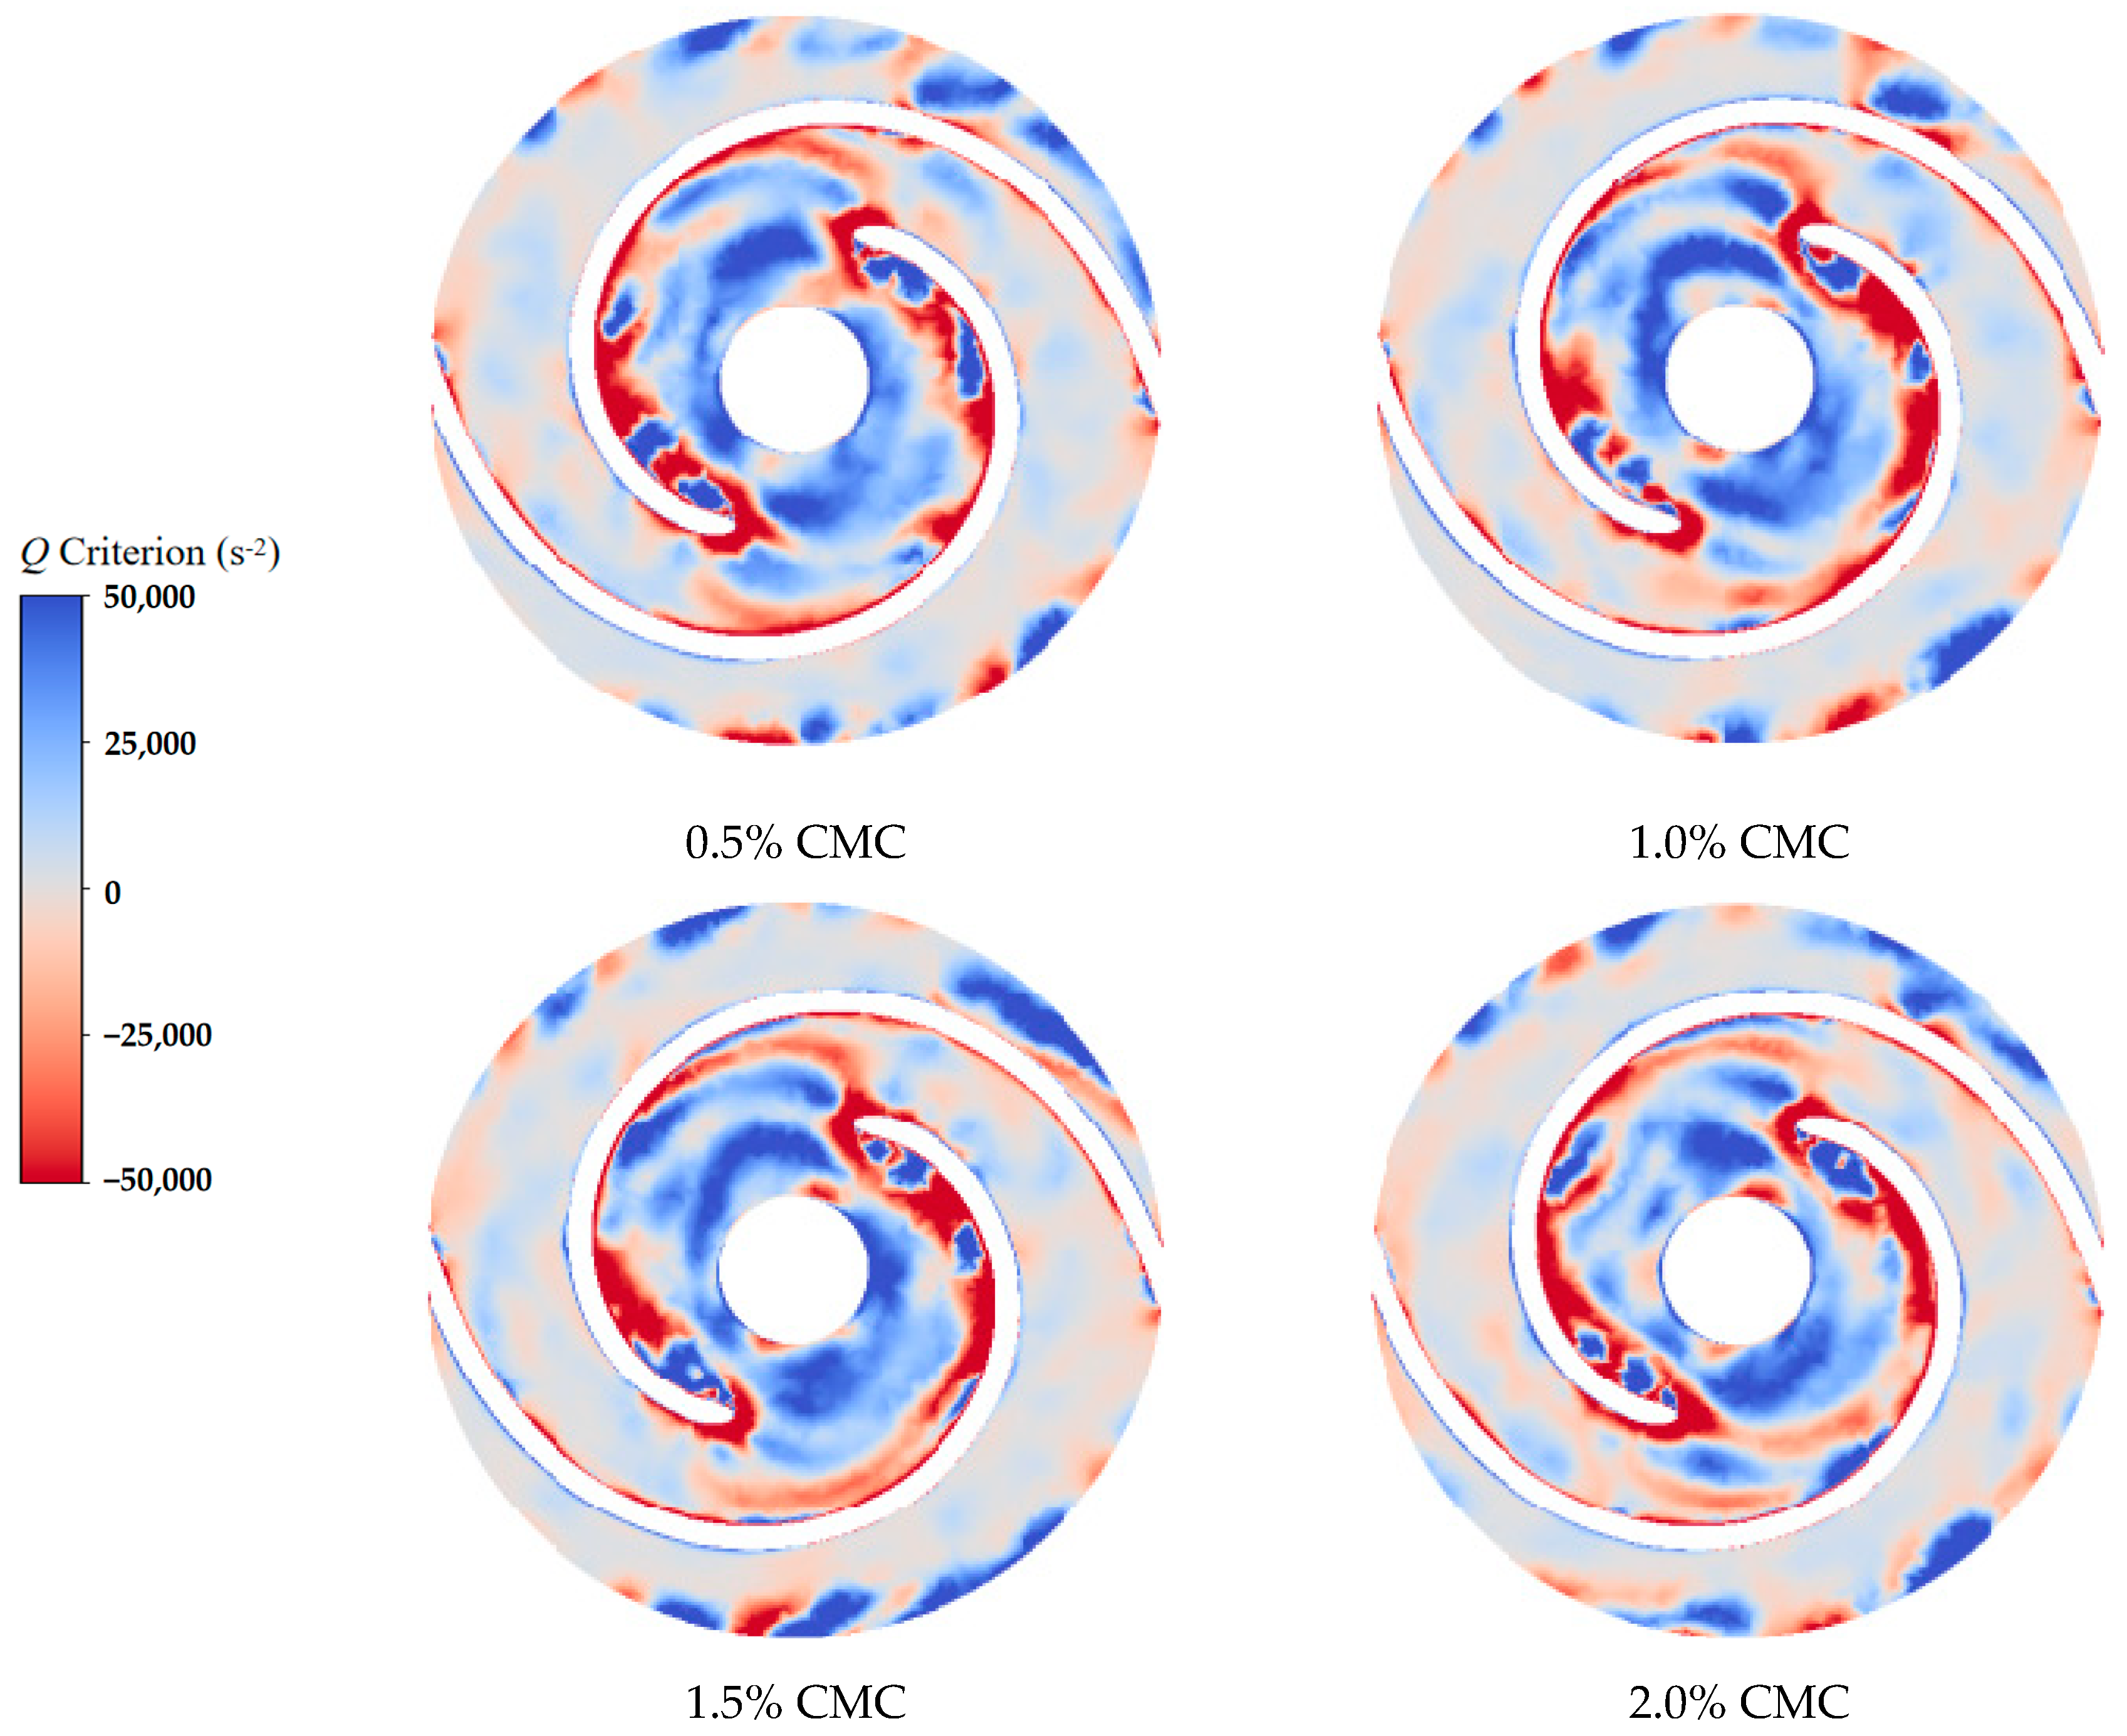
4.3. Vortex Structure and Vorticity Analysis

This paper employs the traditional Q-criterion to identify the vortex structure inside the impeller. The Q criterion is a vortex identification method based on the eigenvalues of the velocity gradient tensor. The velocity gradient tensor describes the variations in velocity within the flow field, while the Q criterion determines the position and strength of the vortices by calculating the sum of squares of the velocity gradient tensor. The Q criterion is based on the second moment invariant of the velocity gradient tensor, and is defined by the following formula:
Q = 1 2 B F 2 A F 2 ,
In the equation, A   a n d   B , respectively represent the two symmetric parts of the velocity gradient tensor;   F 2 denotes the Frobenius Norm of the matrix.
Figure 14 depicts the vortex structure simulation of the test pump under rated flow conditions using different concentrations of CMC solution as the medium. The vortex structure is identified using the Q criterion, with a threshold set at 0.004. Comparing the distribution of vortices under different concentration conditions, it is observed that the simulation with 0.5% CMC solution shows the least vortex distribution. As the concentration increases, vortices become more concentrated at the inlet of the impeller. Moreover, when the concentration exceeds 1.5%, a small number of vortices appear in the volute region, and vortices are also generated at the reflux hole locations. Overall, vortices mainly concentrate at the entrance of the impeller blades and wear-rings region, where lower velocities lead to the occurrence of stall vortices.
Figure 15 illustrates the vorticity distribution in the impeller region of the pump when simulating with CMC solutions of different concentrations. The vorticity calculation in this figure follows the Q criterion, dividing vorticity into positive and negative values, where positive values represent vortices rotating in the positive direction, and negative values represent vortices rotating in the negative direction. From Figure 15, it can be observed that vortices of different directions are mainly distributed within the impeller of the pump. Positive vortices are concentrated mainly at the edge of the impeller, near the junction with the volute casing. Conversely, negative vortices are predominantly concentrated at the leading edge of the blade suction side. These negative vortices exhibit significant vorticity, indicating a high degree of turbulence in this region. Additionally, upon closer inspection, it can be noted that this area contains a mixture of positive and negative vortices, contributing to the complex flow patterns. Furthermore, this area corresponds to the regions of high velocity observed in the velocity analysis and regions of high negative pressure observed in the pressure analysis. It can be inferred that the generation of vortices within the pump is influenced by the viscosity of the fluid, with an increase in viscosity leading to more numerous and intense vortices within the pump.

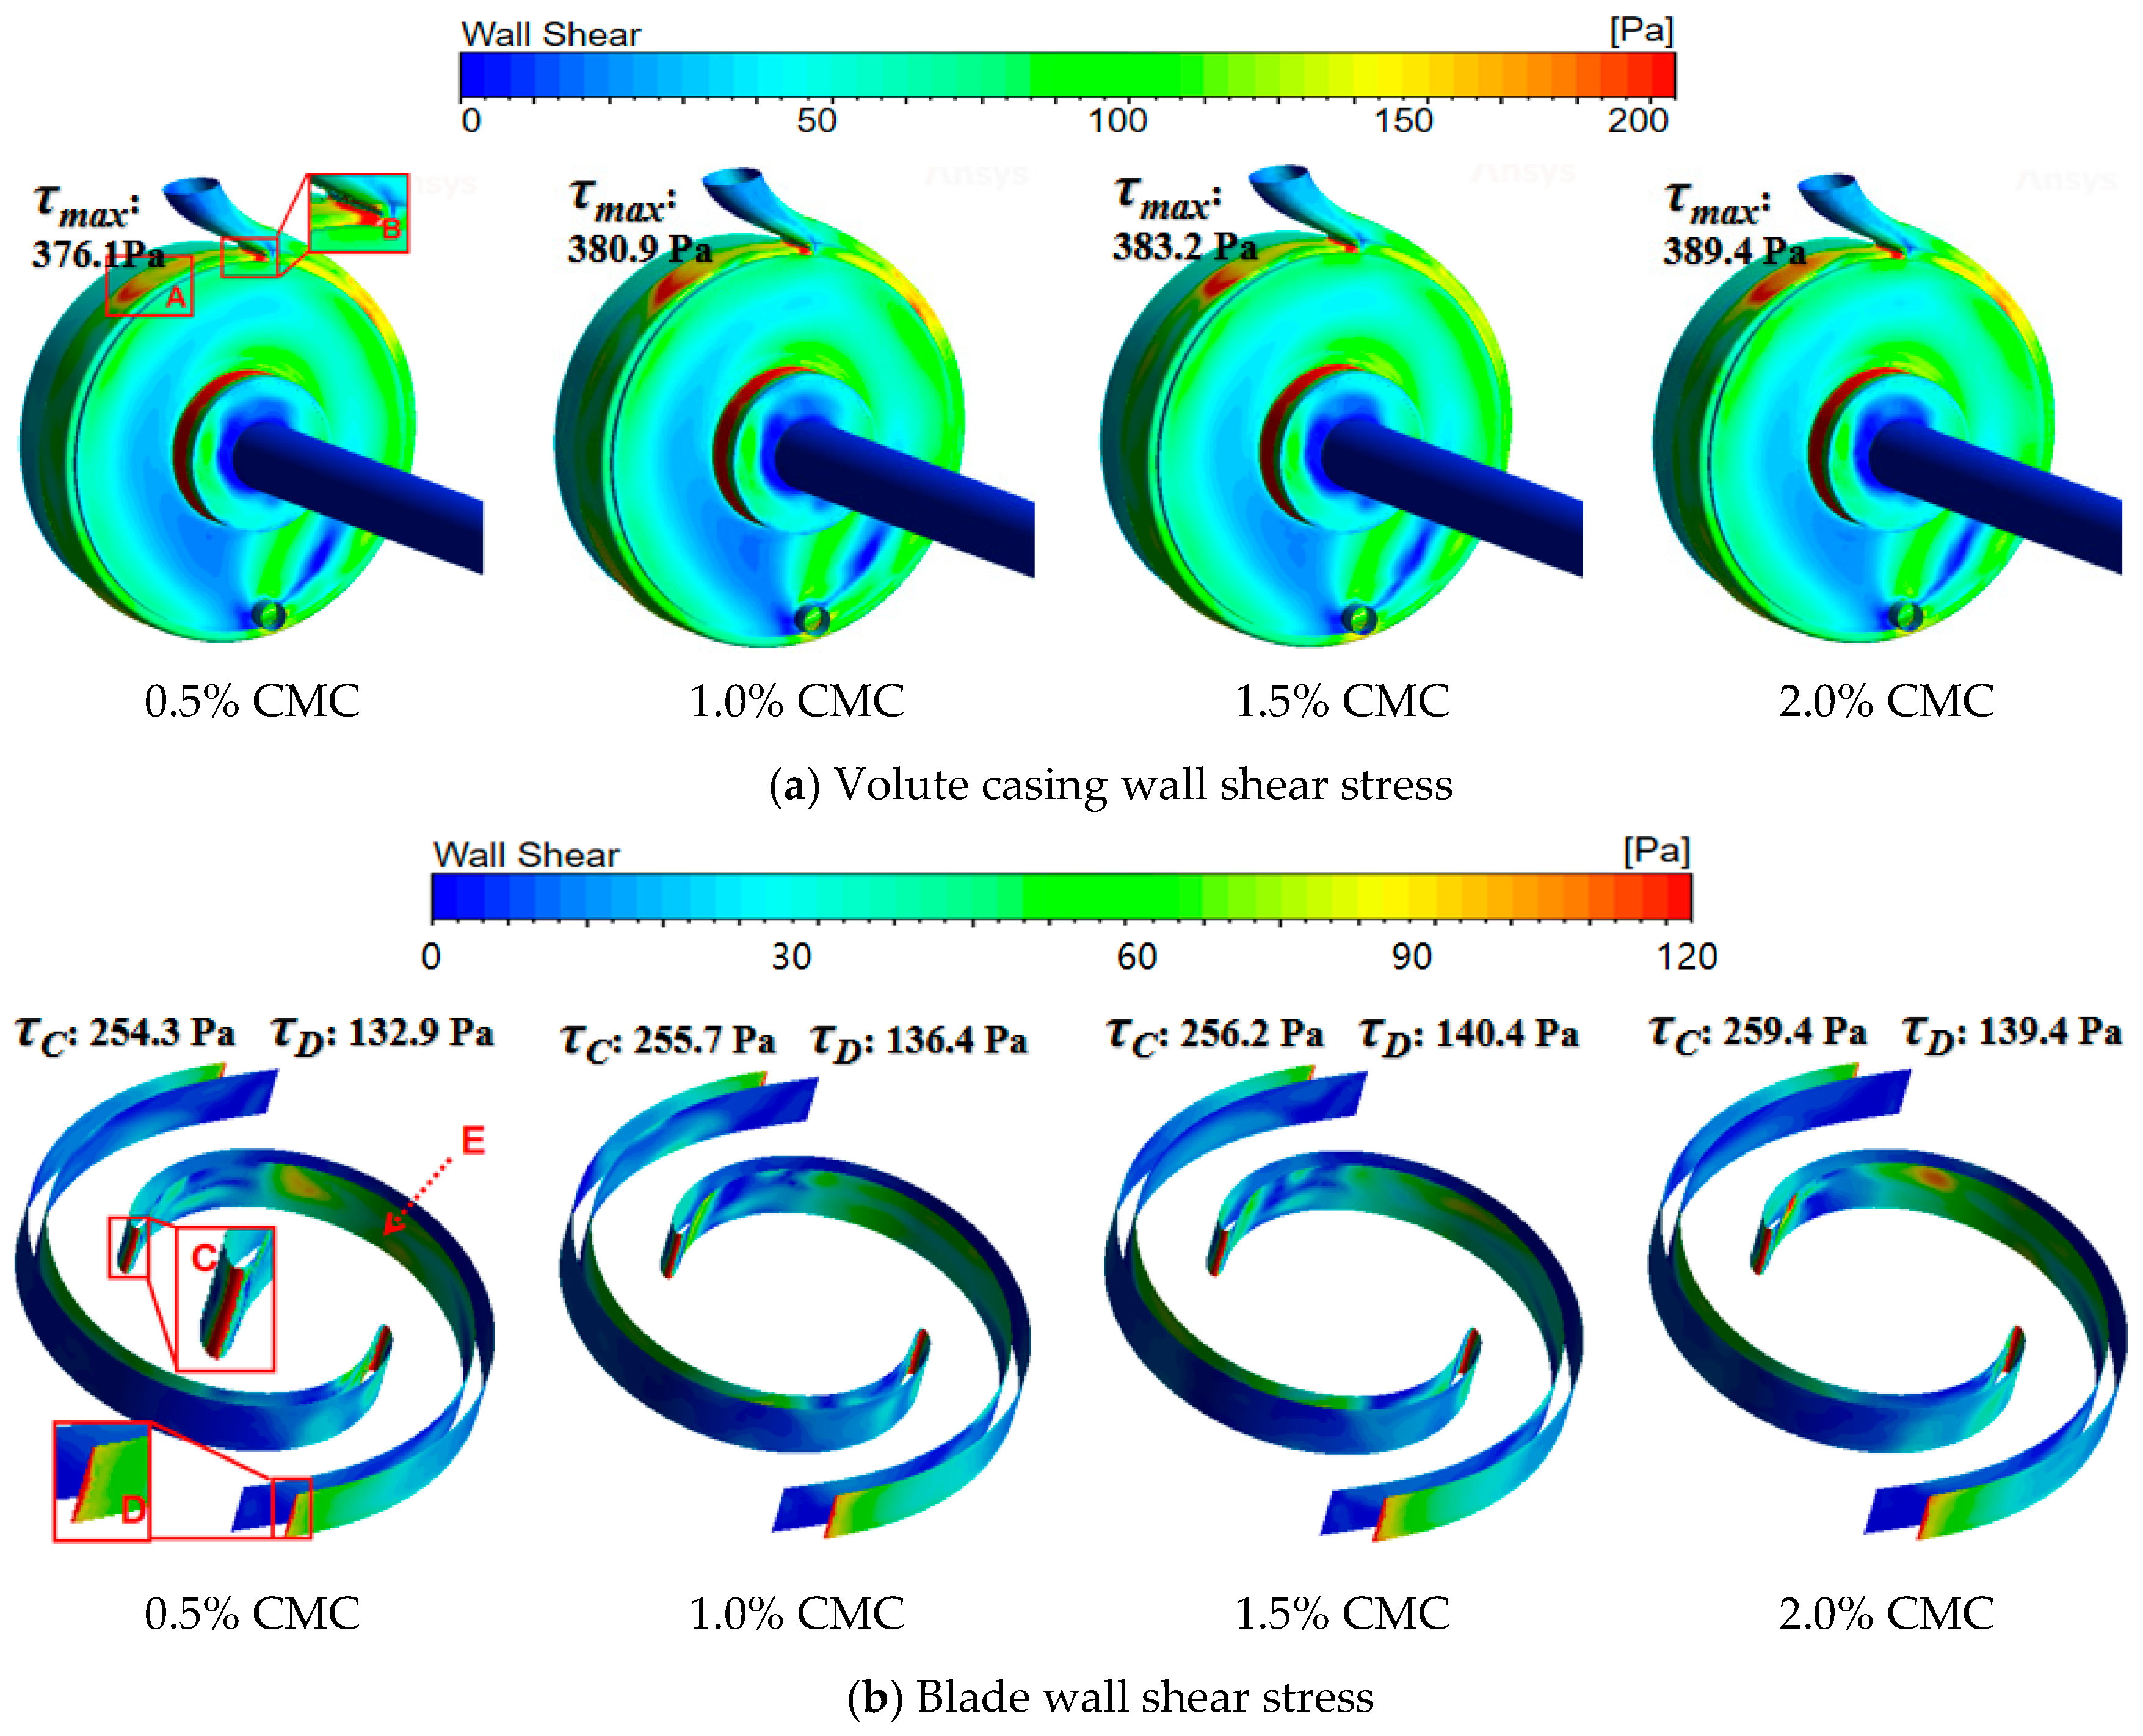
4.4. Wall Shear Stress Analysis

Figure 16 depicts the distribution of wall shear stress on the volute casing and the impeller blades during the simulation process. Firstly, from the shear stress distribution on the volute casing surface shown in Figure 16a, it can be observed that the areas with high shear stress on the volute casing surface are on both sides of the volute outlet and at the tongue position, as indicated by points A and B in the Figure. By examining point A under simulations of different concentrations of CMC solution, it can be noted that with the increasing concentration of CMC solution, along with the increase in viscosity, the shear stress at point A also shows a certain increasing trend. By contrasting the shear stress at point B on the volute tongue, it is evident that with the concentration increasing, the shear stress at point B also slightly increases. Observing the entire front chamber surface of the volute, it can be seen that the circumferential wall surface at the outer edge of the volute experiences higher shear stress, while the shear stress at the middle portion is relatively lower. Furthermore, with the increasing concentration of CMC solution, the shear stress at these middle portions begins to slightly decrease. Additionally, at the bottom of the volute front chamber, due to the presence of the reflux hole, the flow becomes more complex inside the volute, especially above the reflux hole, where the shear stress significantly increases. Moreover, on both sides of the high shear stress region above the reflux hole, there are also areas with extremely low shear stress.
Observing the wall shear stress distribution on the impeller blades as shown in Figure 16b, it is evident that the locations with the highest wall shear stress are at the leading edge C and the blade tip D of the impeller. At position C, the significant force exerted by the fluid during impeller rotation increases the wall shear stress at this location. Meanwhile, position D is where the circumferential velocity of the impeller is maximum, resulting in relatively high wall shear stress at this point. Comparing the distribution of wall shear stress on the pressure side and suction side of the blades, it is noted that areas of high wall shear stress on the pressure side are located at the leading edge and the blade tip at the trailing edge, while on the suction side, relatively higher wall shear stress is observed in the midsection of the blade, as indicated by point E in the figure. Furthermore, upon examining the results for different concentrations of CMC solutions, it is observed that with an increase in concentration, the wall shear stress at point E slightly increases. Additionally, comparing the wall shear stress at the leading edge and blade tip τC and τD, it can be observed that with an increase in CMC concentration, there is a slight increase in wall shear stress at these locations.

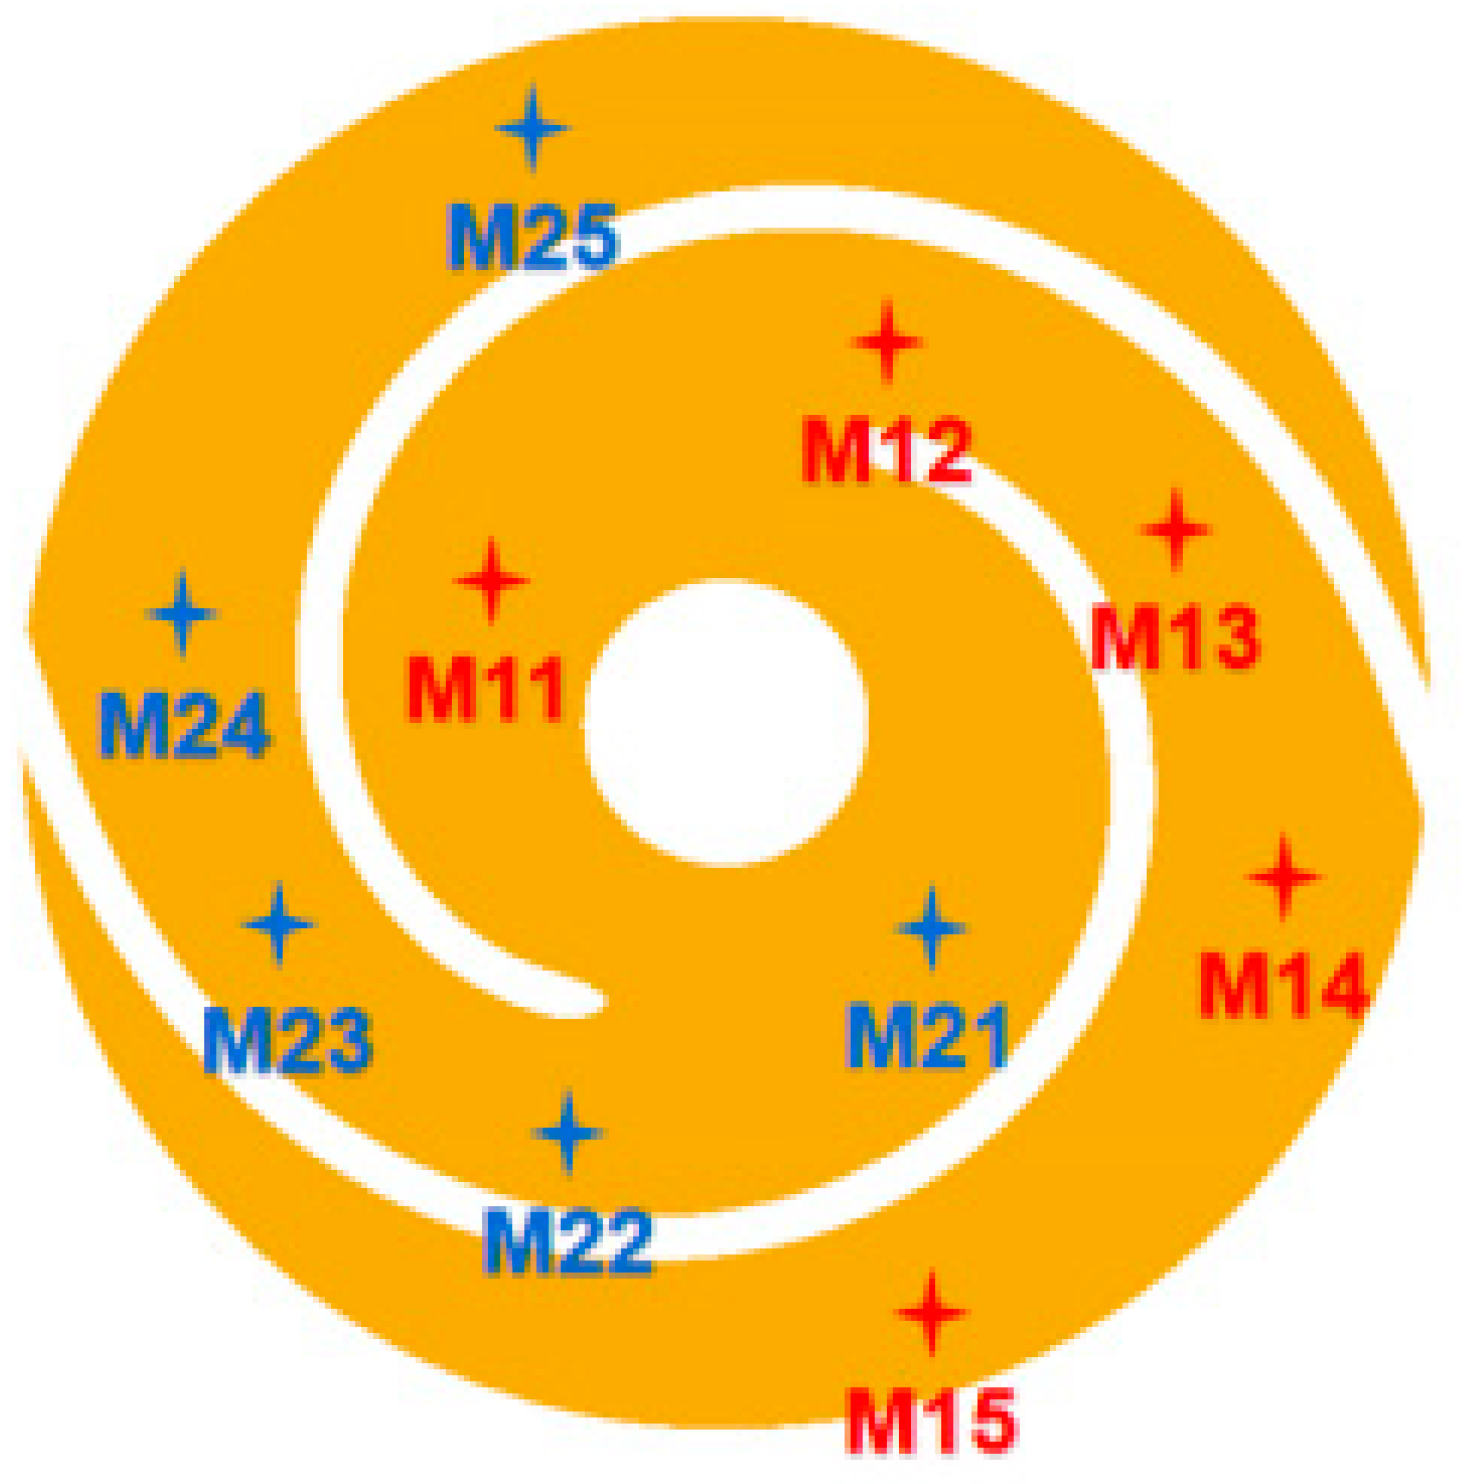
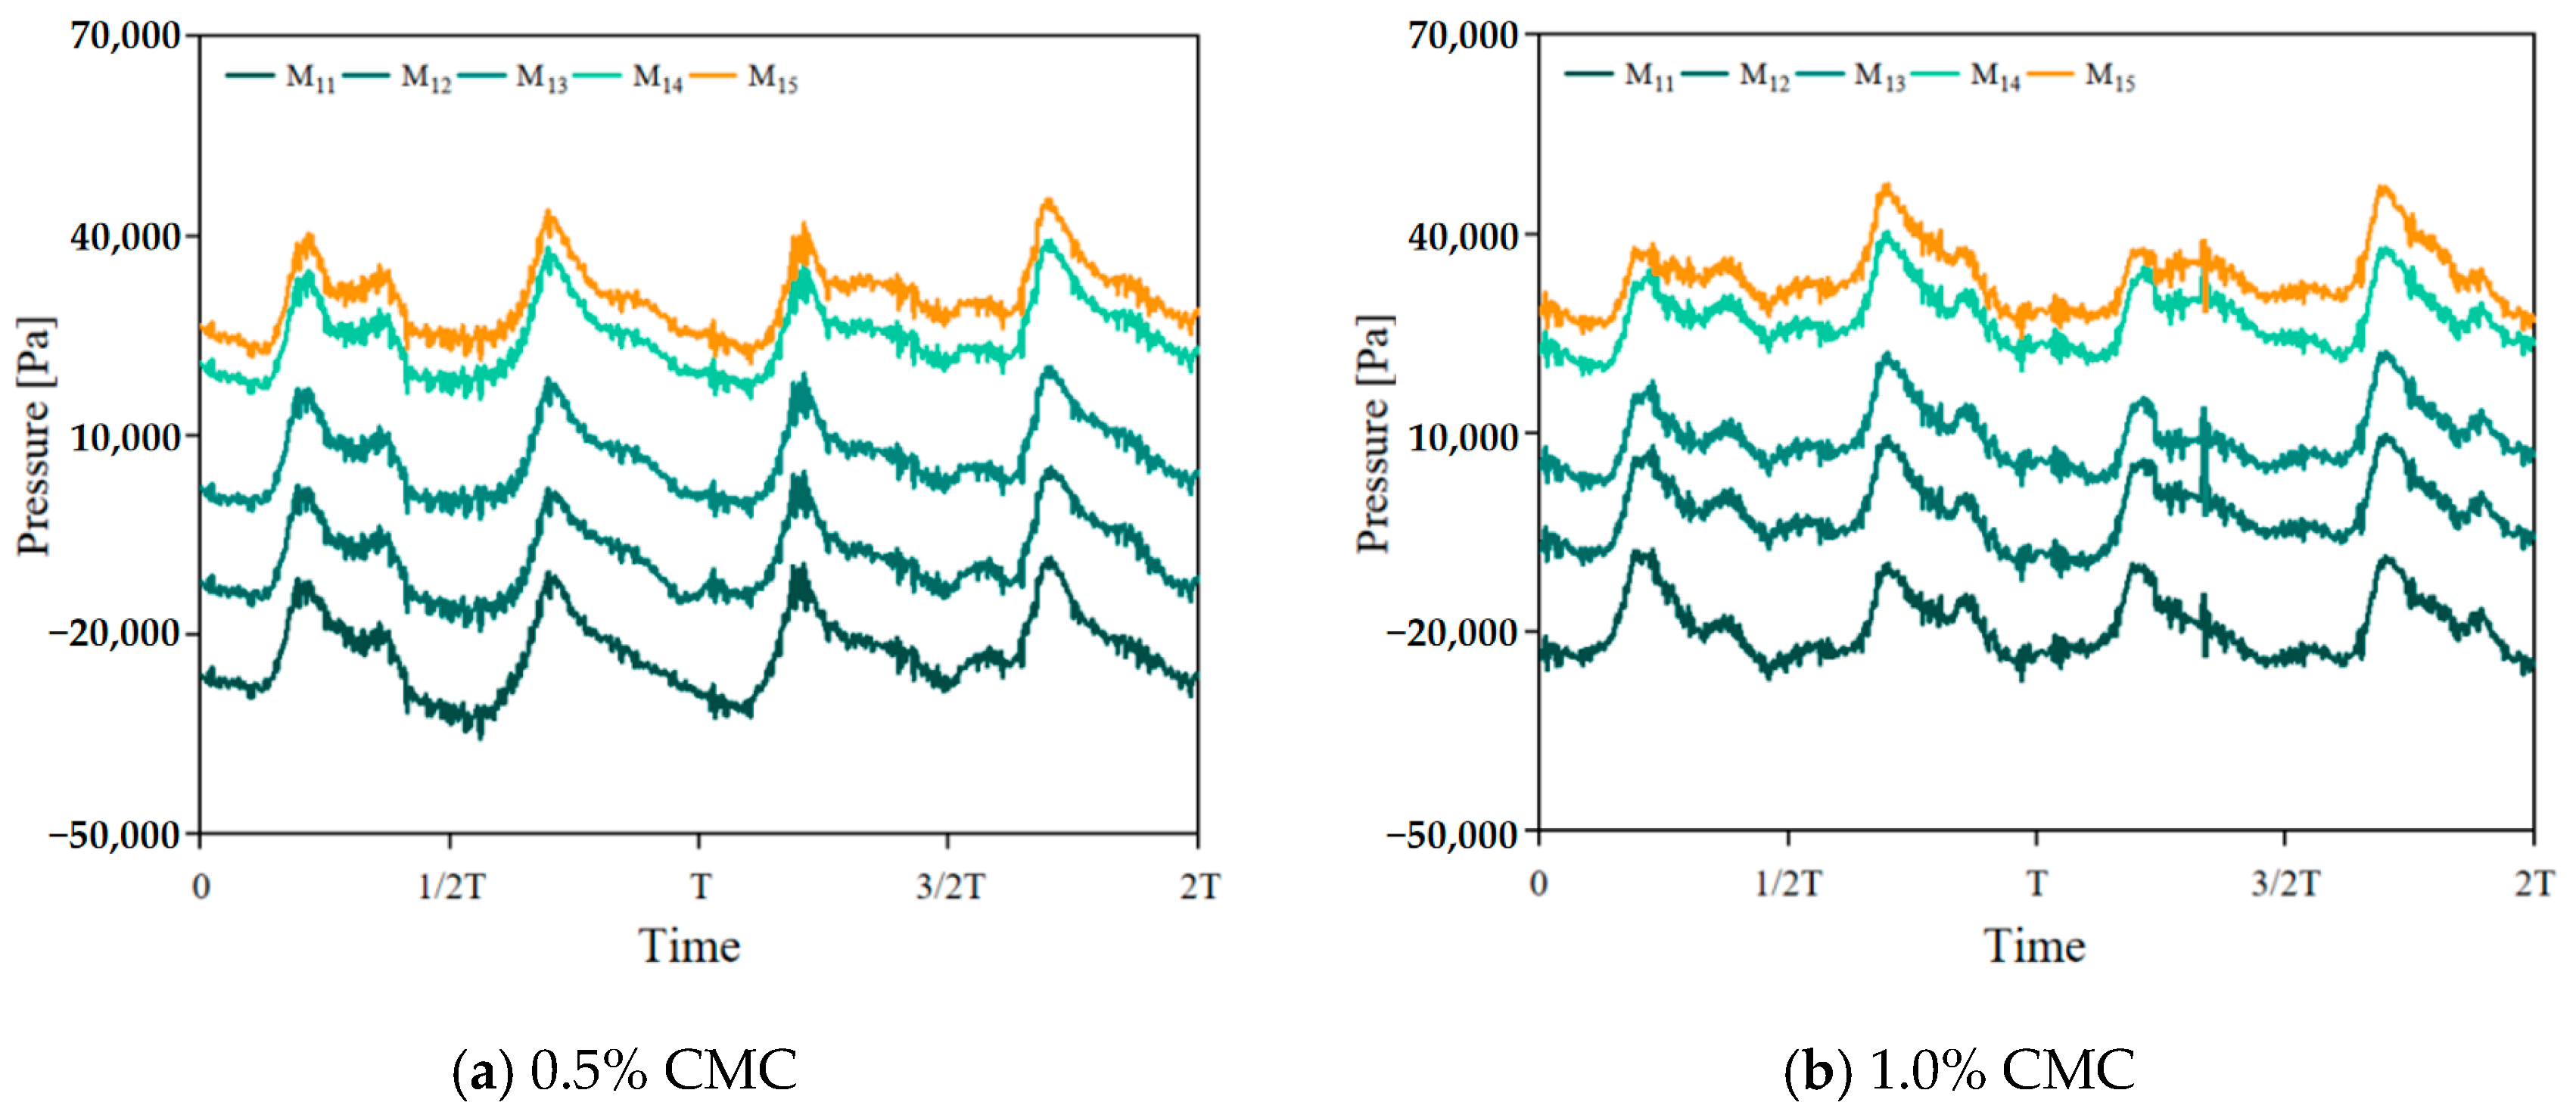
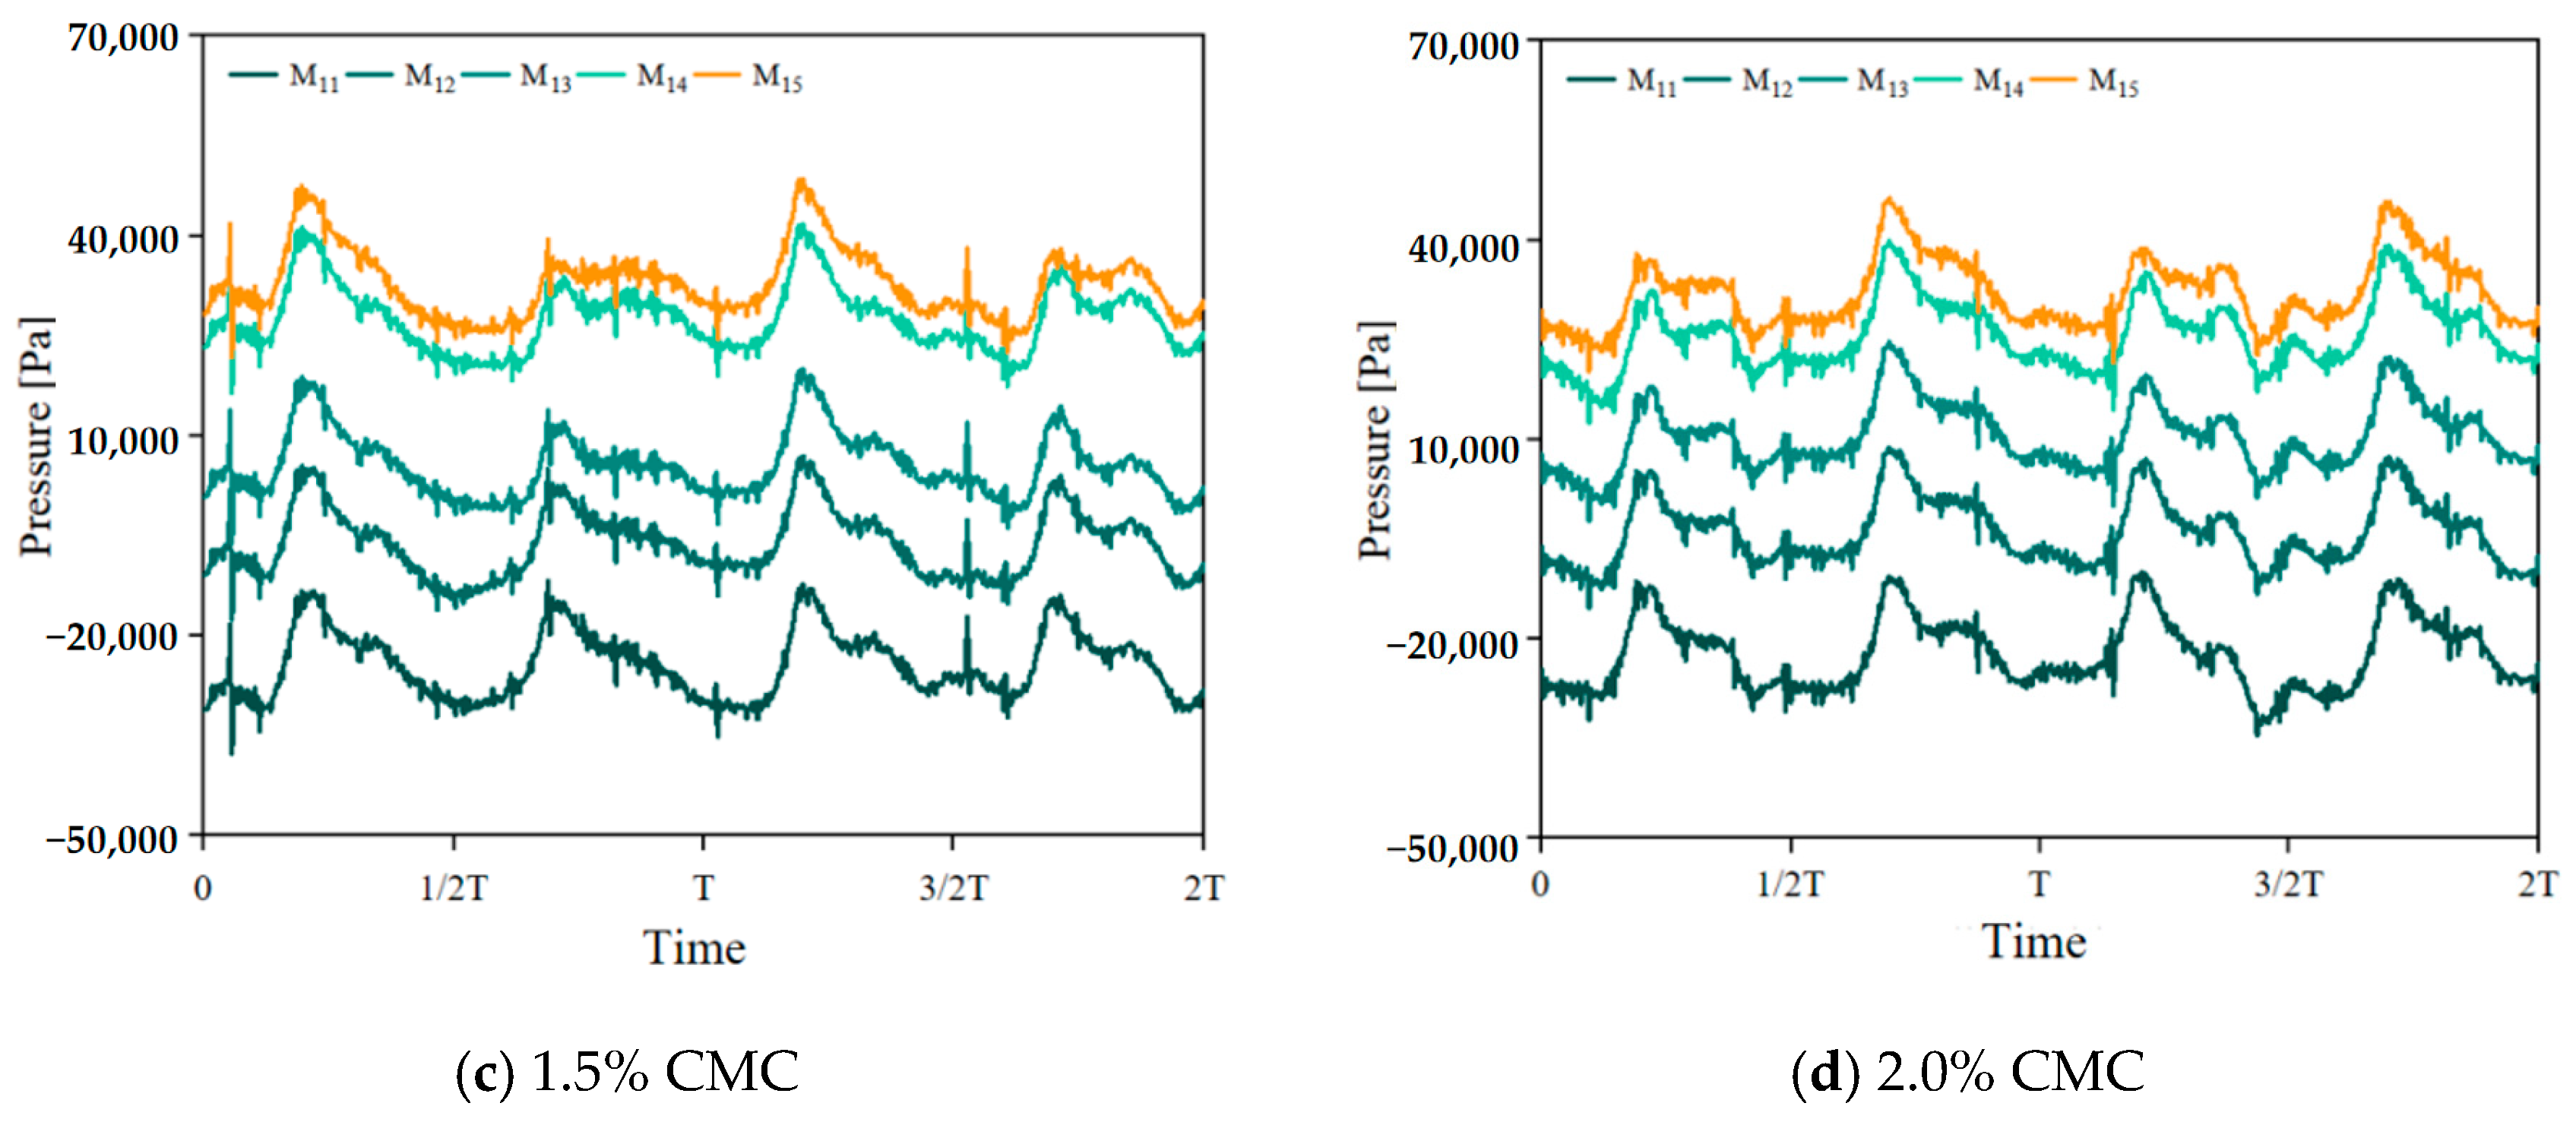
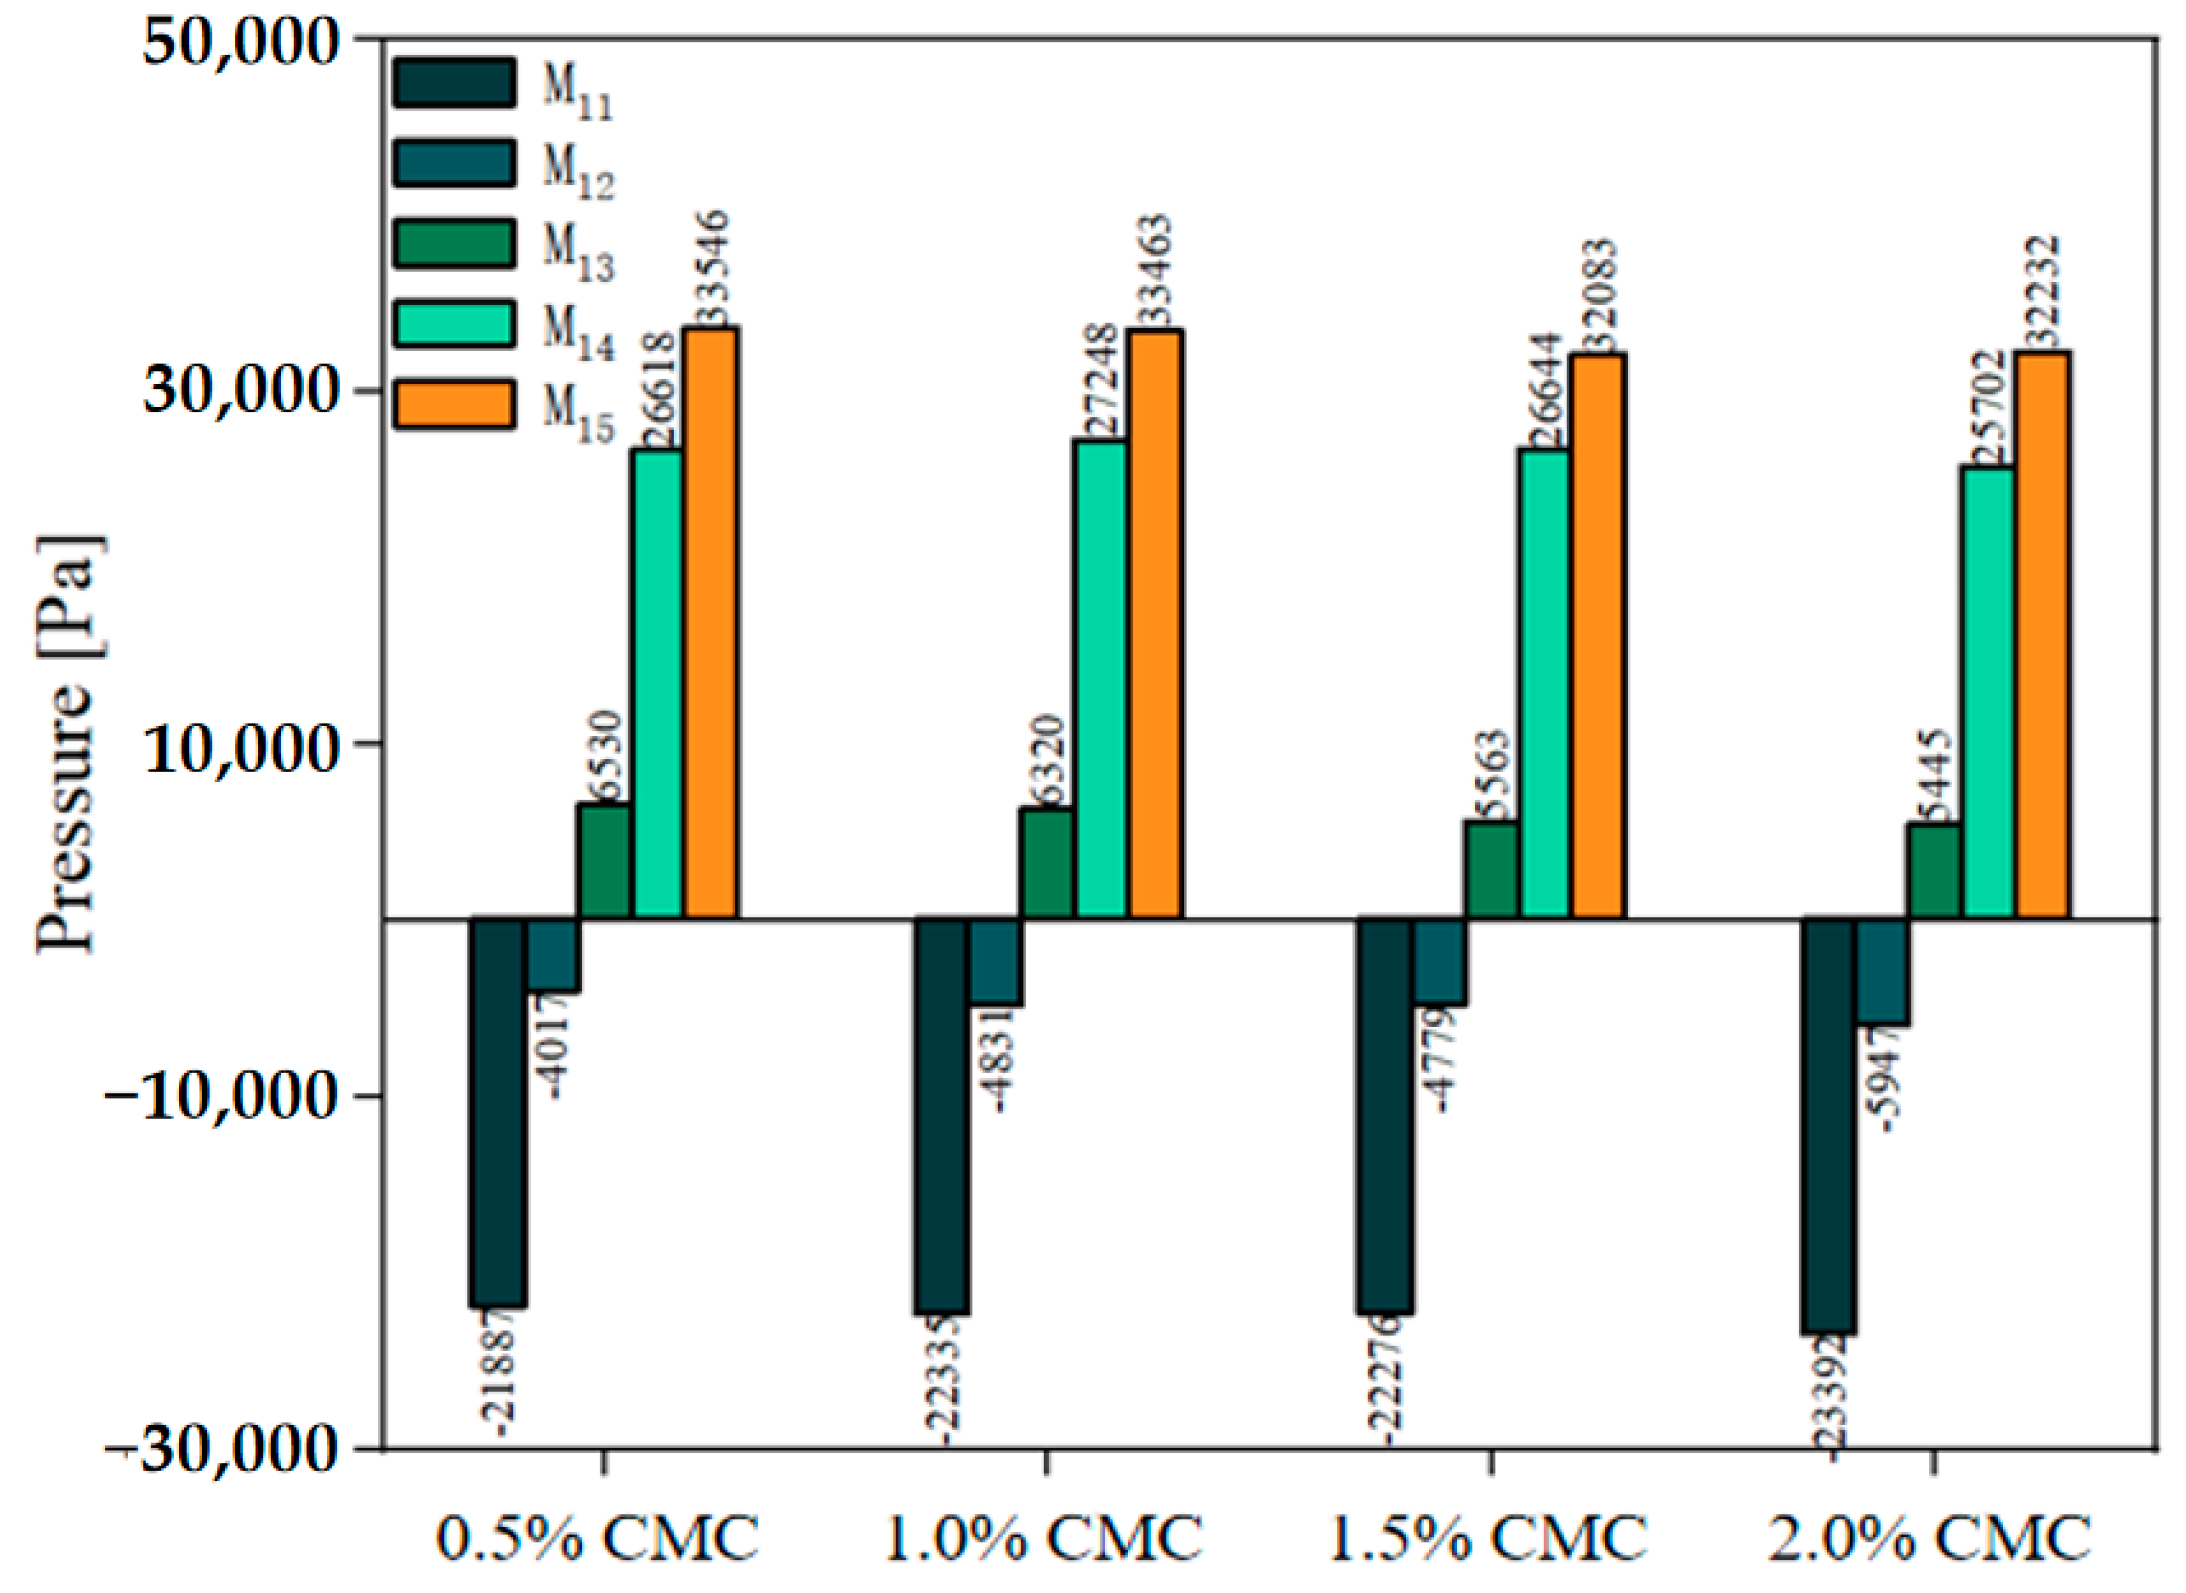
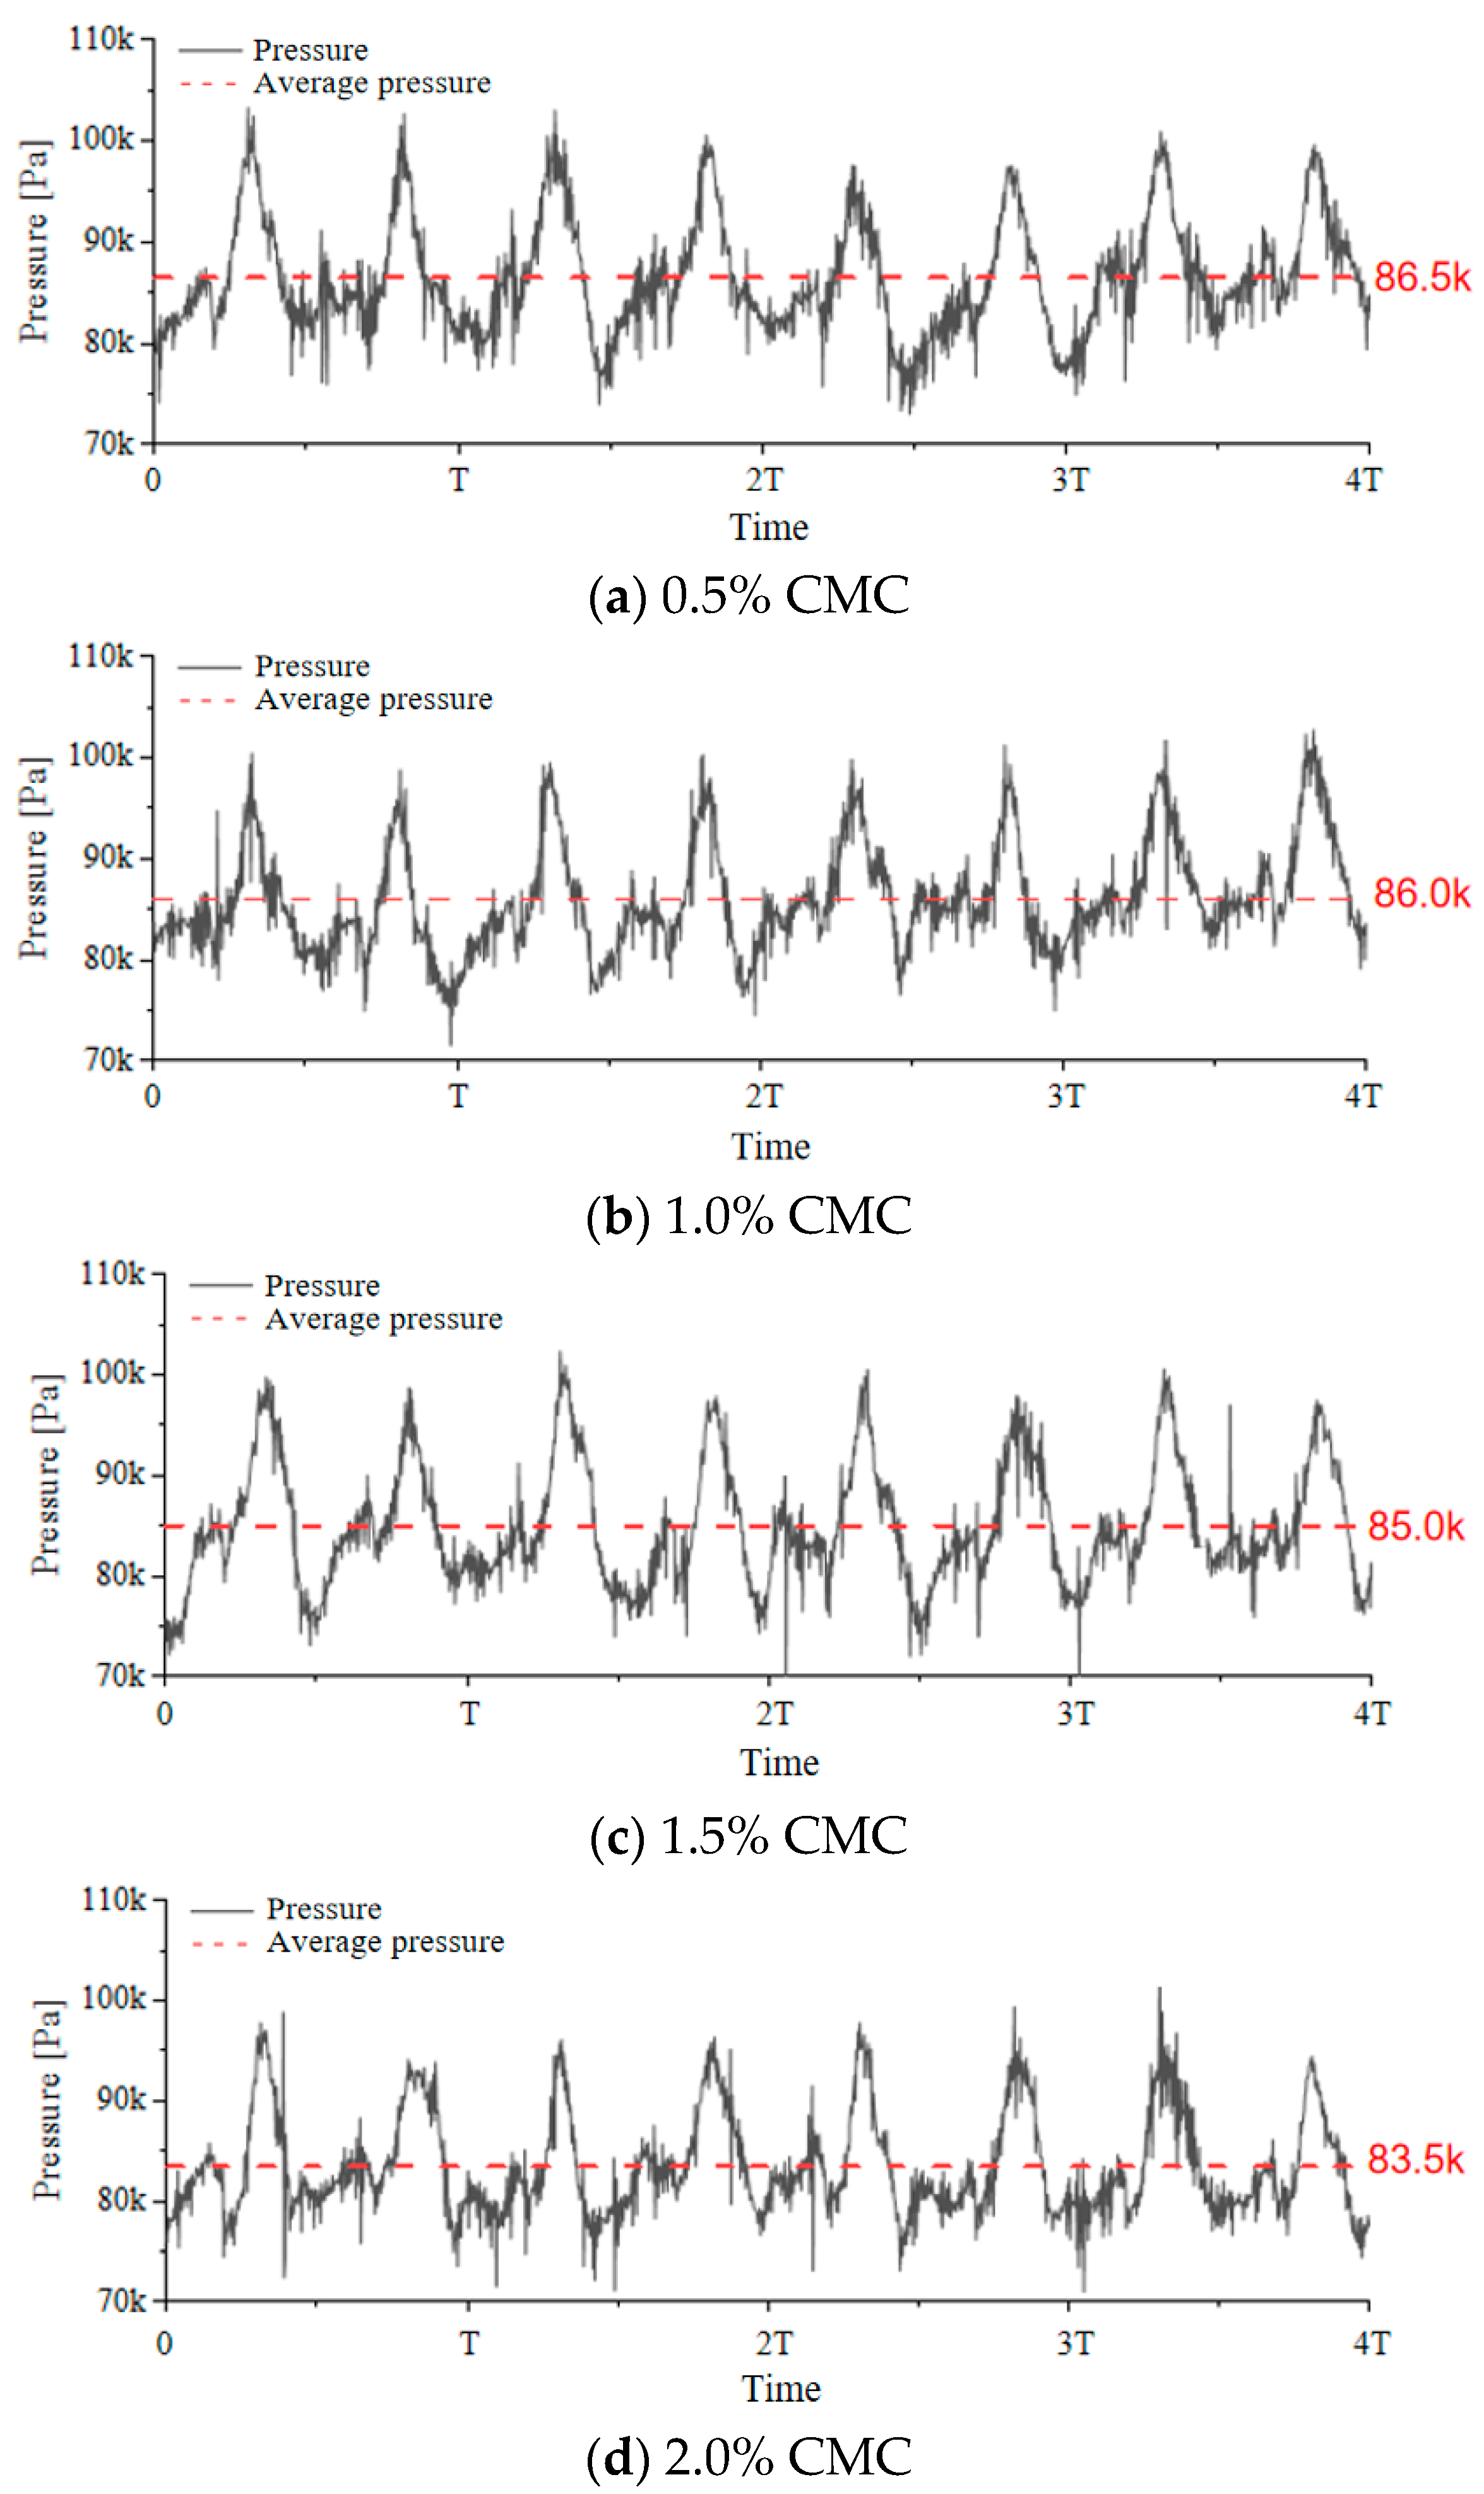
4.5. Analysis of Pressure Pulsations on Sewage Pump Blades and Baffle Plates

In order to conduct an in-depth study of the internal flow characteristics of the sewage pump, monitoring points were set up within the fluid domain, as shown in Figure 17. Each passage was equipped with five points, namely M11, M12, M13, M14, M15, M21, M22, M23, M24, and M25. By comparing the pressure pulsation at each monitoring point in the two passages, it was found that the pressure pulsation within the two passages was similar. Therefore, the analysis in the following sections focuses only on the pressure at the five monitoring points within a single passage.
To compare the pressure variations in the internal flow field of the pump when conveying fluids of different viscosities at rated flow, the pressures were monitored at five monitoring points (M11 to M15) within the passages for two rotational cycles of four different viscosity fluid media, as shown in Figure 18. The recording time is one cycle T (T = 3.57 × 10⁻² s), which is the time it takes for the impeller to make one revolution. The monitoring time in Figure 18 is 2T. It was observed during the analysis of pressure fluctuations on the impeller that the pressure fluctuation period of the impeller is around 1/2T. Similarly, the monitoring results of pressure fluctuations at the monitoring points in the flow field also exhibit a period of around 1/2T. Therefore, in the fluctuation graph with a monitoring time of 2T, four peaks and four valleys can be observed, with peak values at approximately 40 kPa. Comparing the pressure at monitoring points M11 to M15, it can be noticed that these five monitoring points are arranged sequentially within a passage from the entrance to the exit of the impeller, resulting in a staircase-like increase in pressure values along this sequence.
For easier and more intuitive analysis of the pressure variations within the impeller passages at different concentrations, the average pressure fluctuations at each monitoring point were calculated. Figure 19 shows the average pressure fluctuation levels at various monitoring points. From the figure, it can be observed that the flow regions at M11 and M12 are both negative pressure, while those at M13, M14, and M15 show positive pressure. Looking at the average pressure values for the four concentrations of CMC solutions, it is evident that the pressure values are relatively close for each group, but still exhibit a decreasing trend. Comparing the 0.5% CMC solution with the 2.0% CMC solution, the differences at the five monitoring points are 1314 Pa, 916 Pa, 1085 Pa, 1930 Pa, and 1505 Pa, all positive values. This indicates that with an increase in solution concentration, the pressure in various areas inside the pump shows a decreasing trend. By summing the average pressure values at the monitoring points for the 0.5% CMC solution and the 2.0% CMC solution and calculating the rate of change of the difference, a change rate of 16.5% was obtained, indicating significant pressure variations within the passages when there is a difference in concentration.
The tongue of a centrifugal pump is a particularly special area, subjected to significant fluid impact and shear stress, thus requiring a more detailed analysis. Figure 20 depicts the pressure fluctuations and their averages at the tongue over a certain period. To obtain a more accurate picture of the pressure fluctuation, monitoring of the pressure fluctuations at the tongue was conducted over a longer time scale, covering four cycles, totaling 3.9684 × 10⁻⁴ s. From the pressure monitoring curve in the Figure, it is evident that the pressure fluctuations at the tongue exhibit a very regular cyclic variation over time, with a period of 1/2T, meaning that the tongue undergoes two similar changes within one rotation of the impeller. Comparing the average tongue pressures for the experimental pump using different concentrations of CMC solutions as the fluid medium, it can be observed that the average pressure at the tongue decreases with increasing concentration of CMC solution. When the concentration of the CMC solution is 0.5%, 1.0%, 1.5%, and 2.0%, the average pressures at the tongue are 86.5 kPa, 86.0 KPa, 85.0 kPa, and 83.5 kPa, respectively. The difference between the 0.5% CMC solution and the 2.0% CMC solution is 3.0 kPa, with a change rate of 3.5%.

5. Conclusions

This paper presents a numerical study on the flow characteristics of power-law fluids inside pumps at different concentrations using CFD technology. By analyzing the flow characteristics such as velocity, pressure, vortex structure, and pressure fluctuation of the power-law fluid inside the pump, the following conclusions are drawn:
  • Comparing the influence of different concentrations of CMC solution on the sewage pump, it was found that there is minimal difference in the velocity distribution.
  • The vortices in the pump are mainly concentrated at the impeller inlet. This is because of the higher flow velocity at the impeller inlet, where power-law fluids experience greater shear forces, leading to a decrease in viscosity. With lower viscosity, the fluid is more prone to shear deformation and vortex motion. With the increase in concentration of CMC solution and the consequent increase in fluid viscosity, the vortices at the impeller inlet increase to some extent. Additionally, at a certain concentration of CMC solution, a small number of vortices are also generated in the volute region. As the concentration of CMC solution in the test pump increases, the strength of vortices at the outer edge of the impeller slightly increases.
  • Analysis of wall shear stress revealed that the regions of high shear stress on the volute casing are located on both sides of the volute outlet, and they tend to slightly increase with the increase in concentration of CMC solution.
  • The pressures on the impeller blades, within the flow passages, and at the tongue of the volute decrease with the increase in concentration of CMC solution. When the concentration of CMC solution increases from 0.5% to 2.0%, the overall pressure within the flow passages and at the tongue of the volute decrease by 16.5% and 3.5%, respectively, indicating the effect of the concentration of power-law fluid on the pressure within the pump.

Author Contributions

Conceptualization, X.L. and S.Z.; methodology, Q.H. and Z.S. (Zhenghao Shao); software, M.C.; validation, X.L.; formal analysis, X.L.; investigation, Z.S. (Zhenghao Shao); resources, X.L.; data curation, X.L. and S.Z.; writing—original draft preparation, X.L., Y.L., and M.X.; writing—review and editing, X.L. and Z.S. (Zenan Sun); supervision, M.C.; project administration, Z.S. (Zenan Sun). All authors have read and agreed to the published version of the manuscript.

Funding

This research was supported by Zhejiang Provincial National Science Foundation of China under Grant No. LGG22E060011.

Data Availability Statement

Data are contained within the article.

Conflicts of Interest

Author Xukan Li was employed by the company Zhejiang Zheneng Aerospace Hydrogen Energy Technology Co., Ltd. The remaining authors declare that the research was conducted in the absence of any commercial or financial relationships that could be construed as a potential conflict of interest.

References

  1. Fedotov, A.V.; Svittsov, A.A.; Vanchurin, V.I. Integrated Processing of Waste Water Containing Organic Pollutants and Plant Waste of the Agro-Industrial Complex. Russ. J. Phys. Chem. B 2021, 15, 1200–1206. [Google Scholar] [CrossRef]
  2. Duan, J.; Zhou, J. Studies on frictional pressure drop of gas-non-Newtonian fluid two-phase flow in the vacuum sewers. Civ. Eng. Environ. Syst. 2006, 23, 1–10. [Google Scholar] [CrossRef]
  3. Moloshnyi, O.; Szulc, P.; Moliński, G.; Sapozhnikov, S.; Antonenko, S. The analysis of the performance of a sewage pump in terms of the wear of hydraulic components. J. Phys. Conf. Ser. IOP Publ. 2021, 1741, 012015. [Google Scholar] [CrossRef]
  4. Chen, J.; Shi, W.; Zhang, D. Influence of blade inlet angle on the performance of a single blade centrifugal pump. Eng. Appl. Comput. Fluid Mech. 2021, 15, 462–475. [Google Scholar] [CrossRef]
  5. Zhou, P.; Wu, Z.; Mou, J.; Wu, D.; Zheng, S.; Gu, Y. Effect of reflux hole on the transient flow characteristics of the self-priming sewage centrifugal pump. J. Appl. Fluid Mech. 2019, 12, 689–699. [Google Scholar] [CrossRef]
  6. Wu, D.; Zhu, Z.; Ren, Y.; Gu, Y.; Zhou, P. Influence of blade profile on energy loss of sewage self-priming pump. J. Braz. Soc. Mech. Sci. Eng. 2019, 41, 1–14. [Google Scholar] [CrossRef]
  7. Li, G.; Ding, X.; Wu, Y.; Wang, S.; Li, D.; Yu, W.; Wang, X.; Zhu, Y.; Guo, Y. Liquid-vapor two-phase flow in centrifugal pump: Cavitation, mass transfer, and impeller structure optimization. Vacuum 2022, 201, 111102. [Google Scholar] [CrossRef]
  8. Gu, Y.; Yu, L.; Mou, J.; Shi, Z.; Yan, M.; Wu, D. Influence of circular non-smooth structure on cavitation damage characteristics of centrifugal pump. J. Braz. Soc. Mech. Sci. Eng. 2022, 44, 155. [Google Scholar] [CrossRef]
  9. Kudo, H.; Kawahara, T.; Kanai, H.; Miyagawa, K.; Saito, S.; Isono, M.; Nohmi, M.; Uchida, H.; Kawai, M. Study on clogging mechanism of fibrous materials in a pump by experimental and computational approaches. IOP Conf. Ser. Earth Environ. Sci. IOP Publ. 2014, 51579, 012011. [Google Scholar] [CrossRef]
  10. Imasaka, Y.; Kanno, H.; Saito, S.; Miyagawa, K.; Nohmi, M.; Isono, M.; Kawai, M. Clogging mechanisms of vortex pumps: Fibrous material motion capture and simulation with a CFD and DEM coupling method. In Proceedings of the Fluids Engineering Division Summer Meeting, Montreal, QC, Canada, 15–20 July 2018; American Society of Mechanical Engineers: New York, NY, USA, 2018; Volume 51579, p. V003T12A030. [Google Scholar] [CrossRef]
  11. Deng, L.; Hu, Q.; Chen, J.; Kang, Y.; Liu, S. Particle distribution and motion in six-stage centrifugal pump by means of slurry experiment and CFD-DEM simulation. J. Mar. Sci. Eng. 2021, 9, 716. [Google Scholar] [CrossRef]
  12. Xu, Y.; Wu, Y.; Sun, Q. Flow characteristics of the raw sewage for the design of sewage-source heat pump systems. Sci. World J. 2014, 2014, 503624. [Google Scholar] [CrossRef]
  13. Radhakrishnan, A.T.; Van Lier, J.B.; Clemens, F.H.L.R. Rheological characterisation of concentrated domestic slurry. Water Res. 2018, 141, 235–250. [Google Scholar] [CrossRef] [PubMed]
  14. Wu, X.H.; Wang, F.; Sun, D.X.; Yang, W.H. Rheology and flow characteristic of urban untreated sewage for cooling and heating source. Exp. Therm. Fluid Sci. 2011, 35, 612–617. [Google Scholar]
  15. Rituraj, F.; Vacca, A. External gear pumps operating with non-Newtonian fluids: Modelling and experimental validation. Mech. Syst. Signal Process. 2018, 106, 284–302. [Google Scholar] [CrossRef]
  16. Sun, W.; Yu, Z.; Zhang, W. Effect of shear-thinning property on the energy performance and flow field of an axial flow pump. Energies 2022, 15, 2341. [Google Scholar] [CrossRef]
  17. Valdés, J.P.; Becerra, D.; Rozo, D.; Cediel, A.; Torres, F.; Asuaje, M.; Ratkovich, N. Comparative analysis of an electrical submersible pump’s performance handling viscous Newtonian and non-Newtonian fluids through experimental and CFD approaches. J. Pet. Sci. Eng. 2020, 187, 106749. [Google Scholar] [CrossRef]
  18. Mrinal, K.R.; Siddique, M.H.; Samad, A. Performance prediction of a centrifugal pump delivering non-Newtonian slurry. Part. Sci. Technol. 2018, 36, 38–45. [Google Scholar] [CrossRef]
  19. Nguyen, X.L.; Lai, H. The Simulation of Non-Newtonian Power-Law Fluid Flow in a Centrifugal Pump Impeller. J. Chin. Soc. Mech. Eng. Trans. Chin. Inst. En. Ser. C/Chung-Kuo Chi Hsueh Kung Ch’eng Hsuebo Pao 2017, 38, 381–390. [Google Scholar]
  20. Sepulveda, J.; Montillet, A.; Della Valle, D.; Loisel, C.; Riaublanc, A. Deformation of gas-liquid interfaces in a non-Newtonian fluid at high throughputs inside a microfluidic device and effect of an expansion on bubble breakup mechanisms. Chem. Eng. Sci. 2020, 213, 115377. [Google Scholar] [CrossRef]
  21. Griffiths, P.T. Flow of a generalised Newtonian fluid due to a rotating disk. J. Non-Newton. Fluid Mech. 2015, 221, 9–17. [Google Scholar] [CrossRef]
  22. Liu, Y.; Xia, Z.; Deng, H.; Zheng, S. Two-stage hybrid model for efficiency prediction of centrifugal pump. Sensors 2022, 22, 4300. [Google Scholar] [CrossRef] [PubMed]
  23. Yang, G.; Zhang, D.; Yang, X.; Xu, B.; Zhao, X.; Van Esch, B.P.M. Study on the flow pattern and pressure fluctuation in a vertical volute centrifugal pump with vaned diffuser under near stall conditions. J. Braz. Soc. Mech. Sci. Eng. 2022, 44, 118. [Google Scholar] [CrossRef]
  24. Zhao, X.; Xiao, Y.; Wang, Z.; Luo, Y.; Cao, L. Unsteady flow and pressure pulsation characteristics analysis of rotating stall in centrifugal pumps under off-design conditions. J. Fluids Eng. 2018, 140, 021105. [Google Scholar] [CrossRef]
Figure 1. Samples of CMC solution with different concentrations.
Water 16 01526 g001
Figure 2. Anton Paar MCR302 Rotational Rheometer.
Water 16 01526 g002
Figure 3. Data of rheological properties of CMC solution.
Water 16 01526 g003
Figure 4. 3D model of fluid domain. 1—Inlet Pipe, 2—Clearance of Wear-rings, 3—Air–Liquid Separation Chamber, 4—Outlet Pipe, 5—Volute Front Cavity, 6—Impeller, 7—Volute Casing, 8—Rear Cavity, 9—Reflux hole.
Water 16 01526 g004
Figure 5. Analysis of grid independence.
Water 16 01526 g005
Figure 6. Grid of fluid domain.
Water 16 01526 g006
Figure 7. y+ distribution in impeller fluid domain.
Water 16 01526 g007
Figure 8. Experimental transparent pump.
Water 16 01526 g008
Figure 9. External characteristic test equipment. (a) Diagrammatic sketch of external characteristic test equipment. 1—Electric motor, 2—Test pump, 3,6—Pressure sensors, 4—Electromagnetic flowmeter, 5,7—Gate valves, 8—Water tank. (b) Physical drawing of external characteristic test equipment.
Water 16 01526 g009
Figure 10. Comparison between simulation and experimental efficiency.
Water 16 01526 g010
Figure 11. Velocity contour maps of different concentrations of CMC solution inside the pump.
Water 16 01526 g011
Figure 12. Pressure contour maps of different concentrations of CMC solution inside the pump.
Water 16 01526 g012
Figure 13. Pressure distribution maps of the impeller for different concentrations of CMC solution inside the pump.
Water 16 01526 g013
Figure 14. Vortex structure inside pump.
Water 16 01526 g014
Figure 15. Impeller vorticity distribution.
Water 16 01526 g015
Figure 16. Wall shear stress distribution. A—Areas on both sides of the volute outlet, B—Tongue area, C—Leading edge area of the blade, D—Blade tip area at the trailing edge, E—Middle area of the blade suction surface.
Water 16 01526 g016
Figure 17. Monitoring points in the impeller passages.
Water 16 01526 g017
Figure 18. Pressure pulsation of monitoring points.
Water 16 01526 g018aWater 16 01526 g018b
Figure 19. Average pressure at monitoring points.
Water 16 01526 g019
Figure 20. Pressure fluctuation and average value of volute tongue.
Water 16 01526 g020
Table 1. Main parameters of test pump.
Design ParametersNumerical ValueUnit
Design Flow Rate6.5m3/h
Design Head7m
Rotation Speed1680r/min
Blade Number2
Impeller Inlet Diameter60mm
Impeller Outer Diameter158mm
Blade Outlet Width16mm
Blade Wrap Angle255°
Table 2. Setting of boundary condition.
Computational ConditionsSettings
Inlet Boundary Condition6.5 [m3/h]
Outlet Boundary Condition101,325 [Pa]
Rotation Speed1680 [r/min]
Turbulence Modelingthe SST k-ω (Steady); the SAS (Transient)
Time Step Size9.921 × 10−5 [s]
Number of Time Steps5400
Disclaimer/Publisher’s Note: The statements, opinions and data contained in all publications are solely those of the individual author(s) and contributor(s) and not of MDPI and/or the editor(s). MDPI and/or the editor(s) disclaim responsibility for any injury to people or property resulting from any ideas, methods, instructions or products referred to in the content.

