Article

Do Submerged Macrophytes Influence the Response of Zooplankton and Benthic Ostracoda to NaCl Salinity Gradients in Shallow Tropical Lakes?

1
School of Life and Health Sciences, Hainan University, Haikou 570228, China
2
One Health Institute, Hainan University, Haikou 570228, China
3
Aquatic Plant Research Center, Wuhan Botanical Garden, Chinese Academy of Sciences, Wuhan 430074, China
4
Yani Wetland Ecosystem Positioning Observation and Research Station, Tibet University, Lhasa 850000, China
5
Key Laboratory of Biodiversity and Environment on the Qinghai-Tibetan Plateau, Ministry of Education, Tibet University, Lhasa 850000, China
6
School of Breeding and Multiplication, Hainan University, Sanya 572025, China
*
Authors to whom correspondence should be addressed.
Water 2024, 16(11), 1542; https://doi.org/10.3390/w16111542
Submission received: 4 April 2024 / Revised: 22 May 2024 / Accepted: 24 May 2024 / Published: 27 May 2024

Abstract

:
Both the increasing salinity levels and the decline of submerged macrophytes represent growing concerns in global freshwater ecosystems, posing a threat to water quality and various aquatic organisms. However, there is a limited understanding of the interactive effects of salinity and submerged macrophytes on zooplankton and benthic Ostracoda in tropical zones. To address this knowledge gap, we conducted a controlled experiment spanning 6 months, comparing the biomass of zooplankton (including copepods, cladocerans, and rotifers) and benthic Ostracoda in mesocosms with three levels of salinity, at the presence or absence of submerged macrophytes. Our results showed that in tropical zones, both zooplankton and benthic Ostracoda biomass exhibited a noteworthy decrease in response to increasing salinity, but the presence of submerged macrophytes did not have a significant influence on the zooplankton biomass. However, the presence of submerged macrophytes had a positive effect on the benthic Ostracoda biomass. Interestingly, submerged macrophytes had a strong interaction with salinity on the Ostracoda biomass, which increased with macrophyte presence under intermediate salinity conditions (2 g/L). In summary, our study sheds light on the interplay between salinity, submerged macrophytes, and the biomass of zooplankton and benthic Ostracoda in tropical freshwater ecosystems.

1. Introduction

The frequency of extreme climate events such as storms and heavy rainfall is expected to increase under the background of global changes [1]. These extreme climate events could significantly impact coastal areas [2], leading to fluctuations in salinity in nearshore freshwater ecosystems [3]. These fluctuations in salinity could significantly affect microorganisms, small crustaceans, and aquatic macrophytes [4].
Freshwater zooplankton (viz., copepods, cladocerans, and rotifers) and benthic Ostracoda are important consumers in aquatic ecosystems and play a crucial role in the functioning of aquatic ecosystems [5,6]. For example, large copepods feed on either phytoplankton or other members of small zooplankton species [7]. Additionally, they serve as a vital link in transferring energy between phytoplankton and fish [8]. However, an increase in salinity in aquatic ecosystems can inhibit the growth of zooplankton and even lead to their high mortality [9,10,11,12]. In temperate and subtropical lakes, the biomass of zooplankton tends to decrease with increasing salinity [13,14]. It is generally believed that the salinity threshold for freshwater zooplankton ranges from 2–5 g/L [13,15,16]. However, these studies have not explored the effects of salinity on benthic Ostracoda [13,15,16]. Additionally, the impact of salinity on zooplankton biomass in tropical lakes remains unclear. Therefore, it is crucial to research the effects of salinity on the biomass of zooplankton and benthic Ostracoda in tropical regions.
As primary producers in aquatic ecosystems, submerged macrophytes also have a strong interaction with zooplankton and benthic Ostracoda. Macrophytes and associated periphyton can provide a carbon subsidy to zooplankton through the release of DOC and its assimilation by bacteria [17]. Additionally, the detritus of submerged macrophytes can serve as a food source for certain zooplankton and benthic Ostracoda [18]. Research has also indicated that in temperate lakes, submerged macrophytes can serve as habitats and refuges for zooplankton, protecting against predation by fish [18,19,20]. However, this cascading effect of submerged macrophytes is overruled in subtropical lakes, as abundant small fish also seek refuge within the submerged vegetation in this region [20,21,22]. While there is extensive research on the impact of submerged macrophytes on zooplankton in temperate and subtropical regions, studies on the tropical regions are relatively limited. Nevertheless, it can be inferred that similar effects may be similar to those in subtropical regions.
In this study, we have designed the following experiments to investigate the effects of salinity and the absence or presence of submerged macrophytes on zooplankton and benthic Ostracoda in tropical regions. We hypothesized that: (i) increased salinity would lead to a decrease in the biomass of zooplankton and benthic Ostracoda, according to Jeppesen et al. [23]; and (ii) the presence of submerged macrophytes would have a positive impact on the biomass of zooplankton and benthic Ostracoda, according to de Kluijver et al. [17]. Using a tropical-zone mesocosms experiment, we sought to understand the effects of salinity and submerged macrophytes on zooplankton and benthic Ostracoda.

2. Material and Methods

2.1. Experimental Material and Design

The six-month mesocosm study was conducted at Hainan University, Haikou, China (N 20.0510°, E 110.3322°) from 15 July 2019 to 15 January 2020. The study site is situated within the tropical zone. The experimental design comprised 24 mesocosms with a combination of salinity treatments (3 salinity levels) and plant treatments (2 submerged macrophytes levels), each with 4 replicates. Plant materials used in the experiment were obtained from Wuhan Botanical Garden, Chinese Academy of Sciences.
  • Treatment 1: Plant treatment
Two submerged macrophyte levels were employed in the experiment (N: absence of submerged macrophytes; P: presence of submerged macrophytes). For the N treatment, no submerged macrophytes were planted in each mesocosm. For the P treatment, the five species were Cabomba caroliniana A. Gray, Ottelia alismoides (Lin.) Pers, Vallisneria denseserrulata makino, Myriophyllum spicatum L., and Stuckenia pectinate (Lin.) Börner. Each species (apical shoots or seedlings) measuring approximately 15 cm in length at the start of the experiment was cultivated in separate plastic buckets (top diameter: 0.2 m; bottom diameter: 0.15 m; height: 0.2 m). Further details about plant culturing can be found in our prior study [24].
  • Treatment 2: Salinity treatment
After allowing a week for the stabilization of submerged macrophytes, sediments, and water, varying amounts of NaCl were introduced to each mesocosm, following a one-way factorial experimental design consisting of 3 salinity levels—the control (CK), no addition of NaCl; salinity of 2 g/L (2), and salinity of 5 g/L (5). The selection of the low salinity level of 2 g/L was based on Jeppesen et al. [23], which defined 2 g/L as the tentative salinity threshold for Daphnia-dominance and low phytoplankton biomass. Chen et al. [24] reported that a salinity level of 5 g/L led to the death of over half of the submerged macrophytes within a twelve-week experiment. The actual salinity was measured weekly using a salinity probe (Shenshan Electrionic Inc., Shenzhen, China), and adjustments were made by adding NaCl as necessary to maintain the desired salinity levels.
Each mesocosm (top diameter: 0.6 m; bottom diameter: 0.4 m; height: 0.8 m) was filled with 20 L of water sourced from a nearby freshwater pond (N 19.9299°, E 110.4026°), including initial biota, e.g., zooplankton, Ostracoda, or phytoplankton. Additionally, glass slides (size of 25 mm × 75 mm) were suspended in each mesocosm at a depth of 20 cm to assess monthly periphyton growth. For plant treatment, five plastic buckets were positioned within each mesocosm, as previously mentioned. To establish suitable conditions, all plastic buckets were filled with three-fourths of natural sediment collected from the same pond as above. The sediment was then covered with pre-soaked sand to a depth of approximately 2 cm. An overflow hole, positioned 70 cm above the mesocosm, was incorporated to regulate water depth during the addition of tap water.

2.2. Sampling and Analyses

2.2.1. Water Quality

Water samples (1 L) were collected and measured from 15 July 2019 to 15 January 2020 between approximately 16:00 and 18:00 in each mesocosm. Water temperature (WT; °C) and salinity (g/L) were measured by a salinity probe. pH and electrical conductivity (EC; µs/cm) were recorded using a Mettler-Toledo SevenCompact pH meter (S220, Shanghai, China) and a LEICI DDSJ-307A conductivity meter (Shanghai, China), respectively. Alkalinity (Alk) was analyzed following the method described by Zhang et al. [25]. Total nitrogen (TN; mg/L) and total phosphorus (TP; mg/L) were determined using spectrophotometric methods after digestion with a K2S2O8 (United Initiators Shanghai Co., Ltd., Shanghai, China) solution, as outlined by Huang et al. [26]. Chlorophyll-a concentrations (Chl.a; µg/L) were determined by filtering 500 mL of water samples through a Whatman GF/C filter, followed by ethanol extraction as described by Huang et al. [26]. Samples for physicochemical variables and chlorophyll-a (Chl.a) analysis were collected once a week after the addition of macrophytes, zooplankton, and salinity. Afterwards, the sampling frequency changed to once a month from 15 November 2019 to 15 January 2020. The periphyton samples were harvested and replaced monthly and then underwent ethanol () extraction for periphyton Chl.ɑ measurement as a proxy for periphyton biomass according to Huang et al. [26].

2.2.2. Plankton Community

The zooplankton sampling method generally included benthic Ostracoda when collected from the shallow mesocosms, here we distinguished benthic Ostracoda from zooplankton in our study. Zooplankton and benthic Ostracoda were collected by filtering 10 L of water through a plankton net with a mesh size of 64 µm. This was done every half month from 15 July to October 2019, and once a month from 15 November 2019 to January 2020. The samples were then preserved with Lugol’s iodine solution at a concentration of approximately 10% v/v. Each sample was identified and counted under a light microscope (TL3200B, Shanghai Teelen Guangxue Co., Ltd., Shanghai, China) using 1 mL. At least 30 individuals of each species were measured using the ImageJ software version 1.50 (NIH, Bethesda, MD, USA), and their biomass was calculated through the equations from Huang et al. [26] and McEnnulty et al. [27].
The ratio of zooplankton biomass to phytoplankton biomass (indicated by Chl.a) (Bzoop:Bphyt) and the ratio of Chl.a to TP (Chl:TP) serve as indicators to assess potential differences in top-down control, as described by Guo et al. [28]. A high Bzoop:Bphyt value or a low Chl:TP value suggests that the phytoplankton are experiencing intense grazing pressure from zooplankton [29,30]. These ratios provide insights into the dynamics of predator–prey interactions in the aquatic ecosystem.

2.2.3. Plant Volume Inhabited

The plant volume inhabited (PVI; %) was quantified by measuring the height of the macrophytes contributing to surface coverage and the corresponding water depth they occupy. This method, as described by Olsen et al. [31], provides an assessment of the percentage of aquatic habitat occupied by macrophytes. By determining the PVI, researchers can evaluate the spatial distribution and abundance of macrophytes within the study area.
The PVI can be calculated using the formula:
PVI (%) = (Average height × Coverage) ÷ Depth
where Average height refers to the average height of the macrophytes contributing to surface coverage; Coverage represents the extent of the water surface covered by macrophytes; and Depth indicates the water depth occupied by the macrophytes.

2.3. Data Analysis

To analyze the data, several statistical tests were employed. Initially, two-way ANOVA was used to evaluate the effects of both salinity treatment and plant treatment, taking time as the random factor. Subsequently, linear mixed models (LMM) were utilized to assess the fixed effects of salinity treatments, with time as the random factor and either N treatment or P treatment as the fixed factor. Multiple comparisons were conducted using Tuckey’s test if significant differences were detected between the salinity treatments. Finally, independent sample t-tests were performed to examine the effects of plant treatment under the same salinity condition. All statistical analyses and figures were generated using R (4.3.1) [32]. A significance level of 0.05 (i.e., p < 0.05) was considered significant for all statistical tests.

3. Results

3.1. Water Quality and PVI

The salinity level was low as ca. 0.02–0.03 g/L in CK. At the salinity treatment of 2 g/L, the salinity level was ca. 2.00–2.01 g/L. At the salinity treatment of 5 g/L, the salinity level was ca. 5.07–5.11 g/L. These results indicated that the salinity concentration was maintained at the target levels throughout the entire experiment (LMM, p < 0.05) (Figure 1a). Besides, the PVI also decreased with increasing salinity and was significantly higher in CK and the salinity treatment of 2 g/L compared to the salinity treatment of 5 g/L (LMM, p < 0.05) (Figure 1b).
There was a significant effect of both salinity and plant presence on pH and Alk, with a significant interaction between them (two-way ANOVA, p < 0.05) (Table 1). No significant effects were observed for TN, TP, or WT concerning salinity and plant treatments (two-way ANOVA, p > 0.05) (Table 1).

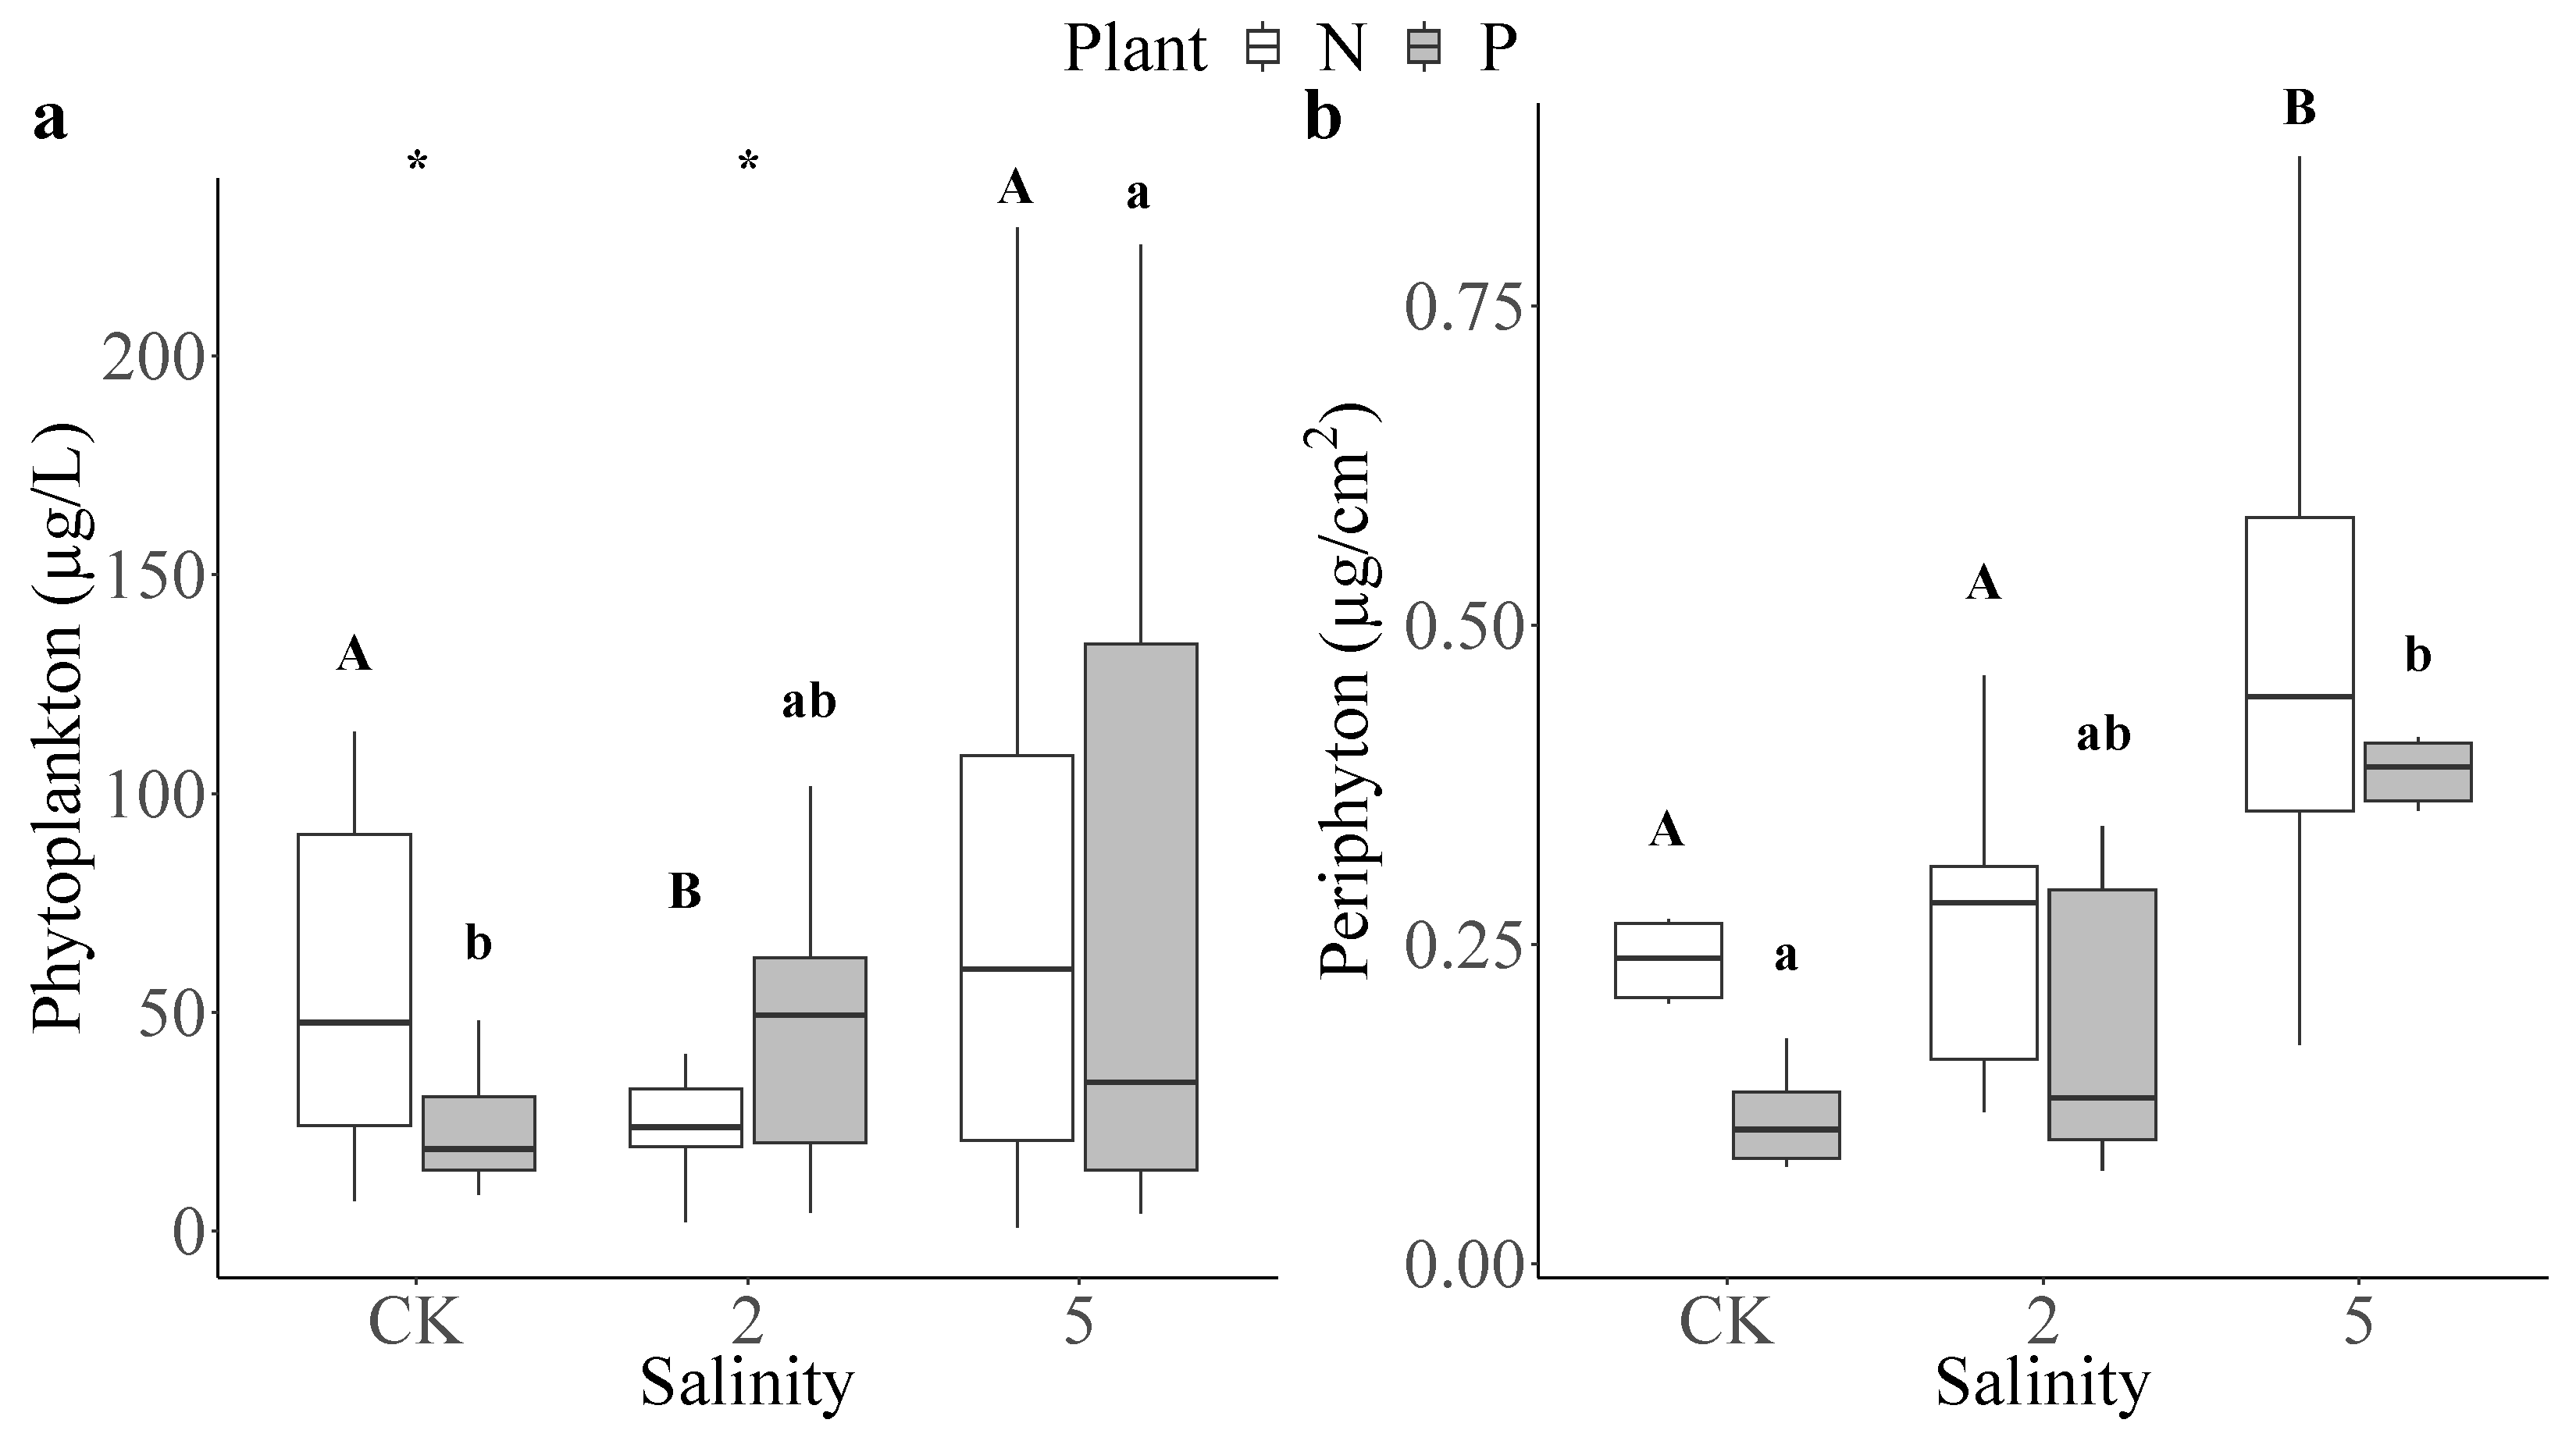
3.2. Phytoplankton and Periphyton

In the absence of submerged macrophytes, the biomass of phytoplankton at a salinity of 2 g/L was significantly lower than that in CK and a salinity of 5 g/L (LMM, p < 0.05) (Figure 2a). Meanwhile, in the presence of submerged macrophytes, the biomass of phytoplankton at a salinity of 5 g/L was significantly higher than that in CK, but there was no significant difference compared to a salinity of 2 g/L (LMM, p < 0.05) (Figure 2a). In CK, the biomass of phytoplankton was significantly higher in the absence of submerged macrophytes than in the presence of submerged macrophytes, but at the moderate salinity (2 g/L), the biomass of the phytoplankton was significantly lower in the absence of submerged macrophytes than in the presence of submerged macrophytes, and at a salinity of 5 g/L, there was no significant difference between the presence and absence of submerged macrophytes (t-test, p < 0.05) (Figure 2a).
Regardless of the presence/absence of submerged macrophytes, with increasing salinity, the biomass of the periphyton increased, and at the 5 g/L salinity, the biomass of the periphyton was significantly higher than in CK (LMM. p < 0.05) (Figure 2b). There was no significant difference between the two plant treatments (t-test, p > 0.05) (Figure 2b).

3.3. Zooplankton and Ostracoda

A total of five zooplankton species were identified in the experiment, including three rotifer species (Brachionus quadridentatus, Hexarthra mira, and Monostyla lunaris), one cladoceran species (Ceriodaphnia cornuta), and one copepod species (Mesocyclops leuckarti). The total biomass of the zooplankton was mainly composed of cladocerans (~50%) and copepods (~15%).
Throughout the experiment, the salinity treatment significantly affected the biomass of the zooplankton, copepods, cladocerans, nauplii, and Ostracoda (two-way ANOVA, p < 0.05) (Table 2). The plant treatments only significantly affected the biomass of the Ostracoda but had no significant effect on the biomass of the other species (two-way ANOVA, p < 0.05) (Table 2). Furthermore, a noteworthy interaction effect was observed between salinity and plant treatment on the biomass of the Ostracoda (two-way ANOVA, p < 0.05) (Table 2).
As the salinity increased to 2 g/L, the biomass of the zooplankton decreased compared with CK, and when the salinity reached 5 g/L, the biomass of the zooplankton significantly dropped to ca. 5% of CK (LMM, p < 0.05) (Figure 3a). The biomass of the cladocerans showed a slight decrease compared to CK at a salinity of 2 g/L, but the difference was not significant. However, at a salinity of 5 g/L, the biomass of the cladocerans significantly decreased compared to CK (LMM, p < 0.05) (Figure 3b). The biomass of the copepods showed a similar trend compared to the cladocerans (Figure 3c). The biomass of the rotifers showed insignificant differences at three salinity levels (LMM, p < 0.05) (Figure 3d). However, the biomass of the nauplii was most sensitive to salinity treatment, as its biomass decreased with increasing salinity, and the differences among different salinity treatments were significant (LMM, p < 0.05) (Figure 3e).
The biomass of the Ostracoda decreased with increasing salinity, and there was no significant difference in the biomass of the Ostracoda between the two submerged macrophyte levels. There was no significant difference in the biomass of the Ostracoda at a salinity of 2 g/L compared to CK, but when the salinity reached 5 g/L, the biomass of the Ostracoda significantly decreased compared to CK (LMM, p < 0.05) (Figure 3f).

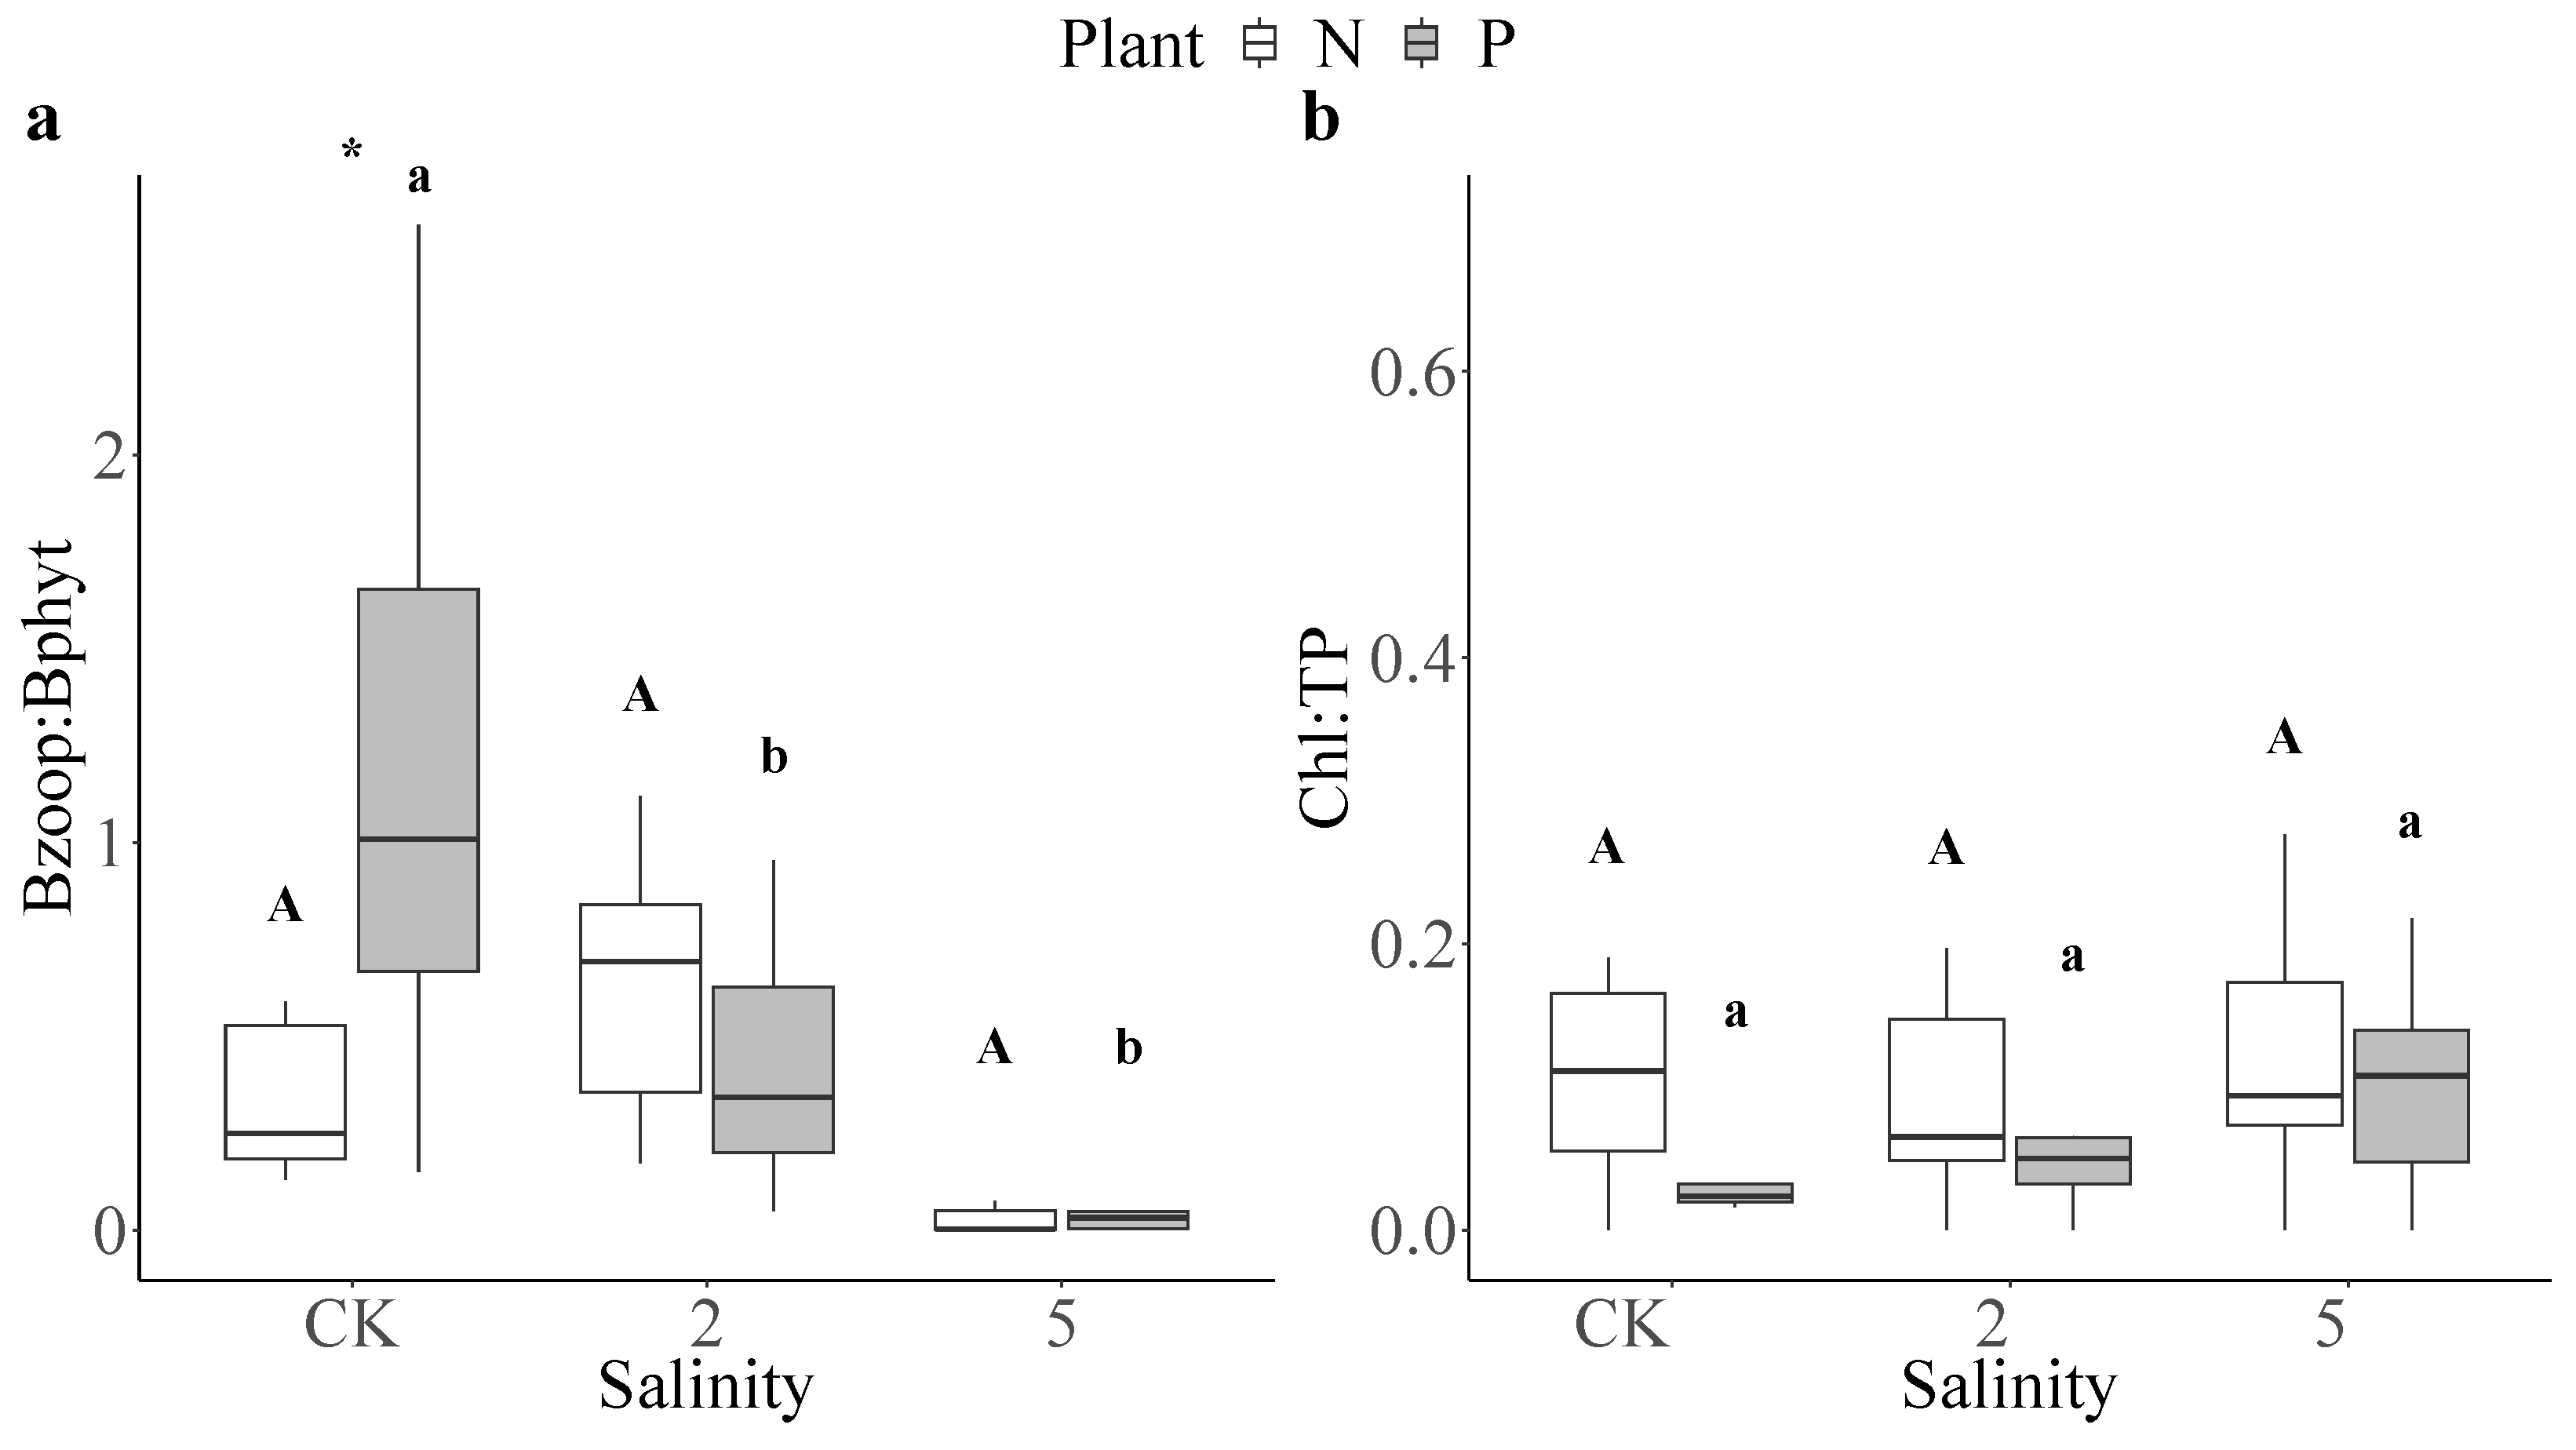
3.4. Top-Down Effects

Concerning the ratio of zooplankton biomass to phytoplankton biomass (Bzoop:Bphyt), it differed between the three salinity treatments only in the presence of submerged macrophytes, with CK being the highest values (1.26 ± 0.83) (LMM, p < 0.05) (Figure 4a). There was no significant difference for the three salinity treatments in the absence of submerged macrophytes (LMM, p > 0.05) (Figure 4a). Specifically, the ratio of Bzoop: Bphyt was significantly higher in the presence of submerged macrophytes compared to the absence of submerged macrophytes in CK (t-test, p < 0.05) (Figure 4a). However, no significant differences were observed in the Bzoop: Bphyt between the two plant treatments at salinity levels of 2 or 5 g/L (t-test, p < 0.05) (Figure 4a). Regarding the ratio of Chl.ɑ to TP (Chl:TP), no significant differences were found among all treatments (LMM, p > 0.05; t-test, p > 0.05) (Figure 4b).

4. Discussion

Here, we experimentally demonstrated that increasing salinity negatively affected the biomass of zooplankton and benthic Ostracoda. The presence of submerged macrophytes had no positive effect on the biomass of zooplankton but promoted the biomass of the benthic Ostracoda. In addition, there was a strong interaction between salinity and plant treatments on the biomass of the benthic Ostracoda.

4.1. Hypothesis 1: Increased Salinity Would Lead to a Decrease in the Biomass of Zooplankton and Benthic Ostracoda

In these tropical mesocosms, the zooplankton biomass decreased as the salinity increased from control to 2 g/L, and down to ca 5% of the ambient conditions when the salinity arrived at 5 g/L. In addition to the negative response of the zooplankton biomass, our study suggests that there was a decline in the benthic Ostracoda biomass as salinity levels increased. Compared with the control, the Ostracoda biomass at a salinity of 5 g/L decreased by 95%. Therefore, the increase in salinity led to a decrease in the biomass of the zooplankton and benthic Ostracoda, supporting the first hypothesis. Consistently, in temperate fjords, zooplankton biomass decreased with salinity increasing from 0.3 to 3.8 g/L [13]. Besides, in temperate plateau lakes (Tibetan), most freshwater zooplankton species were restricted to salinities below 3 g/L [16]. In another tropical lagoon, the limitation of zooplankton growth is at a salinity level of ca. 2 g/L [15]. Furthermore, the effect of salinity on zooplankton was direct rather than indirect, because zooplankton food (phytoplankton and periphyton) increased with the increase in salinity, while zooplankton biomass did not increase. In summary, the salinity threshold for zooplankton growth was less than or equal to 5 g/L in the tropical mesocosms.
The biomass of zooplankton mainly consisted of cladocerans and copepods in our control mesocosms (CK). Moreover, there were species-specific responses of the zooplankton to salinity stress, as Daphnia survived at a salinity below 2 g/L, and Eurytemora and Acartia can exist above 2 g/L in eutrophic brackish lakes [33]. Consistent with the previous studies [34,35], we found that cladocerans decreased markedly with increasing salinity. However, the dominant cladoceran species was Ceriodaphnia cornuta in our mesocosms. It is evident from our study that C. cornuta can tolerate salinity above 2 g/L. This is consistent with a previous study that the EC50 of NaCl for C. cornuta was 2.6 g/L [36]. Thus, our result showed C. cornuta is more tolerant to salinity stress than Daphnia. Commonly, copepods are more tolerant to salinity [37,38]. However, Mesocyclops leuckarti in our mesocosms is a freshwater species, which only survived at a salinity below 5 g/L. In addition, the larva form (nauplii) was more sensitive to salinity at 2 g/L compared to the adult form. As for rotifers, their biomass was low throughout the whole experiment. Since in natural lakes planktivorous fish predate on large-bodied zooplankton (i.e., cladocerans and copepods) [39,40], rotifers dominate the zooplankton community in the lakes and ponds with abundant fish [28]. However, as our system had no fish, rotifers were outcompeted by cladocerans and copepods, and it was not significantly affected by salinity, which indicated the interaction between large zooplankton and rotifers was much stronger than the effect of salinity.
A study on 20 Ostracoda species revealed that some euryhaline species can inhabit hypersaline environments at a salinity level of 10 g/L, while others (e.g., Ilyocypris bradyii) are limited to salinity levels below 6 g/L [41]. Similarly, it has been reported that benthic Ostracoda, specifically freshwater taxa, ceases to thrive when salinity levels exceed 3 g/L in lagoons [42]. Thus, the threshold for Ostracoda in our study, like that of zooplankton, was below 5 g/L.

4.2. Hypothesis 2: The Presence of Submerged Macrophytes Would Have a Positive Impact on the Biomass of Zooplankton and Benthic Ostracoda

In contrast to our second hypothesis, the presence of submerged macrophytes did not have a significant positive impact on the biomass of the zooplankton (including cladocerans, copepods, rotifers, and nauplii). The presence of submerged macrophytes can directly influence habitat structure by providing more complex habitats for zooplankton refuge [18]. Thus, in temperate shallow lakes and littoral zones, the presence of submerged macrophytes provides shelter for zooplankton, and zooplankton can coexist with their predatory fish in lakes at high latitudes [43]. In warm (tropical) lakes, submerged vegetation is often abundant but is less effective as a refuge for zooplankton, because huge amounts of small fish also find refuge there from their predators [20]. Since fish were absent in our mesocosms, this resulted in the absence of a cascading effect on zooplankton from submerged macrophytes. If fish were introduced into the mesocosms, the fish may increase the pressure on zooplankton predation, potentially reducing the grazing pressure of zooplankton on phytoplankton. Additionally, submerged macrophytes may not provide as strong protection for zooplankton. Meanwhile, the specific changes of fish presence warranted a further study. Therefore, the presence or absence of submerged macrophytes in tropical regions might not significantly affect the biomass of the zooplankton.
The presence of submerged macrophytes could indirectly provide a food source for zooplankton growth through the associated periphytic biofilm [17], suggesting that submerged macrophytes can contribute to enhancing the biomass of the zooplankton. However, concurrently, the presence of submerged macrophytes inhibited the growth of phytoplankton through allelopathy [18,44], and the phytoplankton also serves as a vital food source for zooplankton. We found that submerged macrophytes did not significantly affect zooplankton biomass, which could be attributed to the offset between the positive and negative impacts from these two factors.
In addition, our study suggested that the submerged macrophytes had a positive effect on benthic Ostracoda biomass. Besides, we also found that there was a significant interaction between submerged macrophytes and salinity on benthic Ostracoda biomass. As stated earlier, the presence of submerged macrophytes had a notable impact on the benthic Ostracoda biomass but not on zooplankton biomass, which may be due to differences in their food sources. Though there was no evidence showing that submerged macrophytes have a direct effect on Ostracoda, our results suggest that submerged macrophytes could have the potential to alter the availability of benthic detritus and microorganisms, which serve as a potential food resource for Ostracoda. The interesting nature of this phenomenon prompts us to investigate the underlying reasons for the interaction between submerged macrophytes and salinity on benthic Ostracoda biomass. Thus, further research is warranted.

5. Conclusions

Our research has revealed that higher salinity levels in tropical freshwater ecosystems can lead to a decline in both zooplankton and benthic Ostracoda biomass. Additionally, we found that submerged macrophytes had a mild effect on benthic Ostracoda at moderate salinity levels, although they did not significantly impact zooplankton. These findings provide valuable insights into the impact of salinity and submerged macrophytes on zooplankton and benthic Ostracoda biomass in tropical regions, laying the groundwork for further research in this area. Besides, both the increased salinity and the presence of submerged macrophytes did not have a significant effect on total nitrogen and total phosphorus in the water column. We still emphasized the need for further research to elucidate the mechanisms driving the observed interactions between salinity, submerged macrophytes, aquatic organisms, and water quality.

Author Contributions

Conceptualization, L.Y. and Y.C.; Data curation, T.C.; Funding acquisition, L.Y. and Y.C.; Investigation, T.C. and X.Z.; Methodology, T.C. and Y.C.; Supervision, L.Y., W.L. and J.H.; Visualization, T.C.; Writing—original draft, T.C. and Y.C.; Writing—review and editing, L.Y., W.L., J.H. and Y.C. All authors have read and agreed to the published version of the manuscript.

Funding

This research was funded by the National Natural Science Foundation of China (31860101, 32370388) and the Hainan Province Science and Technology Special Fund (ZDYF2022SHFZ113).

Data Availability Statement

Data are available from the corresponding author upon reasonable request.

Acknowledgments

We would like to thank Honglong Yang, Xiangjie Zeng, Yanfei Lv, Guoming Zeng, Can Yang, and Shunda Qiu for their help with the experiment.

Conflicts of Interest

The authors declare no competing interests.

References

  1. Field, C.B.; Barros, V.R. Climate Change 2014: Impacts, Adaptation, and Vulnerability; Part A: Global and sectoral aspects. Contribution of Working Group II to the Fifth Assessment Report of the Intergovernmental Panel on Climate Change (IPCC); Cambridge University Press: Cambridge, UK, 2014. [Google Scholar]
  2. Babcock, R.C.; Bustamante, R.H.; Fulton, E.A.; Fulton, D.J.; Haywood, M.D.E.; Hobday, A.J.; Kenyon, R.; Matear, R.J.; Plagányi, E.E.; Richardson, A.J.; et al. Severe Continental-Scale Impacts of Climate Change Are Happening Now: Extreme Climate Events Impact Marine Habitat Forming Communities Along 45% of Australia’s Coast. Front. Mar. Sci. 2019, 6, 411. [Google Scholar] [CrossRef]
  3. Lorrain-Soligon, L.; Robin, F.; Barbraud, C.; Brischoux, F. Some like it salty: Spatio-temporal dynamics of salinity differentially affect anurans and caudates in coastal wetlands. Freshw. Biol. 2023, 68, 279–1292. [Google Scholar] [CrossRef]
  4. James, K.R.; Cant, B.; Ryan, T. Responses of freshwater biota to rising salinity levels and implications for saline water management: A review. Aust. J. Bot. 2003, 51, 703–713. [Google Scholar] [CrossRef]
  5. Bakhtiyar, Y.; Arafat, M.Y.; Andrabi, S.; Tak, H.I. Zooplankton: The Significant Ecosystem Service Provider in Aquatic Environment. In Bioremediation and Biotechnology; Springer: Cham, Switzerland, 2020; Volume 3, pp. 227–244. [Google Scholar]
  6. Xiong, W.; Huang, X.; Chen, Y.; Fu, R.; Du, X.; Chen, X.; Zhan, A. Zooplankton biodiversity monitoring in polluted freshwater ecosystems: A technical review. Environ. Sci. Ecotechnol. 2020, 1, 100008. [Google Scholar] [CrossRef]
  7. Ward, B.A.; Dutkiewicz, S.; Jahn, O.; Follows, M.J. A size-structured food-web model for the global ocean. Limnol. Oceanogr. 2012, 57, 1877–1891. [Google Scholar] [CrossRef]
  8. Telesh, I.V. Plankton of the Baltic estuarine ecosystems with emphasis on Neva Estuary: A review of present knowledge and research perspectives. Mar. Pollut. Bull. 2004, 49, 206–219. [Google Scholar] [CrossRef] [PubMed]
  9. Van Meter, R.J.; Swan, C.M.; Leips, J.; Snodgrass, J.W. Road salt stress induces novel food web structure and interactions. Wetlands 2011, 31, 843–851. [Google Scholar] [CrossRef]
  10. Thompson, P.L.; Shurin, J.B. Regional zooplankton biodiversity provides limited buffering of pond ecosystems against climate change. J. Anim. Ecol. 2012, 81, 251–259. [Google Scholar] [CrossRef]
  11. Van Meter, R.J.; Swan, C.M. Road Salts as Environmental Constraints in Urban Pond Food Webs. PLoS ONE 2014, 9, e90168. [Google Scholar] [CrossRef]
  12. Hintz, W.D.; Relyea, R.A. A review of the species, community, and ecosystem impacts of road salt salinisation in fresh waters. Freshw. Biol. 2019, 64, 1081–1097. [Google Scholar] [CrossRef]
  13. Jensen, E.; Brucet, S.; Meerhoff, M.; Nathansen, L.; Jeppesen, E. Community Structure and Diel Migration of Zooplankton in Shallow Brackish Lakes: Role of Salinity and Predators. Hydrobiologia 2010, 646, 215–229. [Google Scholar] [CrossRef]
  14. Yang, L.-J.; Tao, Y.; Jiang, X.; Wang, Y.; Li, Y.-H.; Zhou, L.; Wang, P.-Z.; Li, Y.-Y.; Zhao, X.; Wang, H.-J.; et al. Interactive effects of nutrients and salinity on zooplankton in subtropical plateau lakes with contrasting water depth. Front. Environ. Sci. 2023, 11, 1110746. [Google Scholar] [CrossRef]
  15. Attayde, J.L.; Bozelli, R.L. Assessing the Indicator Properties of Zooplankton Assemblages to Disturbance Gradients By Canonical Correspondence Analysis. Can. J. Fish. Aquat. Sci. 1998, 55, 1789–1797. [Google Scholar] [CrossRef]
  16. Lin, Q.; Xu, L.; Hou, J.; Liu, Z.; Jeppesen, E.; Han, B.P. Responses of trophic structure and zooplankton community to salinity and temperature in Tibetan lakes: Implication for the effect of climate warming. Water Res. 2017, 124, 618–629. [Google Scholar] [CrossRef] [PubMed]
  17. De Kluijver, A.; Ning, J.; Liu, Z.; Jeppesen, E.; Gulati, R.D.; Middelburg, J.J. Macrophytes and periphyton carbon subsidies to bacterioplankton and zooplankton in a shallow eutrophic lake in tropical China. Limnol. Oceanogr. 2015, 60, 375–385. [Google Scholar] [CrossRef]
  18. Jeppesen, E.; Søndergaard, M.; Christoffersen, K. (Eds.) The Structuring Role of Submerged Macrophytes in Lakes; Springer: New York, NY, USA, 1998. [Google Scholar]
  19. Manatunge, J.; Asaeda, T.; Priyadarshana, T. The Influence of Structural Complexity on Fish–zooplankton Interactions: A Study Using Artificial Submerged Macrophytes. Environ. Biol. Fish. 2004, 58, 425–438. [Google Scholar] [CrossRef]
  20. Meerhoff, M.; Iglesias, C.; Teixeira-de Mello, F.; Clemente, J.; Jensen, E.; Lauridsen, T.; Jeppesen, E. Effects of habitat complexity on community structure and predator avoidance behaviour of littoral zooplankton in temperate versus subtropical shallow lakes. Freshw. Biol. 2007, 52, 1009–1021. [Google Scholar] [CrossRef]
  21. Ghadouani, A.; Pinel-Alloul, B.; Prepas, E.E. Effects of experimentally induced cyanobacterial blooms on crustacean zooplankton communities. Freshw. Biol. 2003, 48, 363–381. [Google Scholar] [CrossRef]
  22. González-Bergonzoni, I.; Meerhoff, M.; Davidson, T.A.; Teixeira-de Mello, F.; Baattrup-Pedersen, A.; Jeppesen, E. Meta-analysis Shows a Consistent and Strong Latitudinal Pattern in Fish Omnivory Across Ecosystems. Ecosystems 2012, 15, 492–503. [Google Scholar] [CrossRef]
  23. Jeppesen, E.; Sondergaard, M.; Pedersen, A.R.; Jurgens, K.; Strzelczak, A.; Lauridsen, T.L.; Johansson, L.S. Salinity Induced Regime Shift in Shallow Brackish Lagoons. Ecosystems 2007, 10, 48–58. [Google Scholar] [CrossRef]
  24. Chen, T.; Jiang, H.S.; Wang, Y.; Wang, S.; Yin, L.; Cao, Y. Responses of five submerged macrophytes to NaCl salinity in a tropical mesocosm study. Fundam. Appl. Limnol. 2020, 193, 359–370. [Google Scholar] [CrossRef]
  25. Zhang, Y.; Yin, L.; Jiang, H.S.; Li, W.; Gontero, B.; Maberly, S.C. Biochemical and biophysical CO2 concentrating mechanisms in two species of freshwater macrophyte within the genus Ottelia (Hydrocharitaceae). Photosynth. Res. 2014, 121, 285–297. [Google Scholar] [CrossRef]
  26. Huang, X.F.; Chen, W.M.; Cai, Q.M. Survey, Observation and Analysis of Lake Ecology—Standard Methods for Observation and Analysis in Chinese Ecosystem Research Network; Series, V., Ed.; Standards Press of China: Beijing, China, 1999. [Google Scholar]
  27. McEnnulty, F.R.; Davies, C.H.; Armstrong, A.O.; Atkins, N.; Coman, F.; Clementson, L.; Edgar, S.; Eriksen, R.S.; Everett, J.D.; Anthony Koslow, J.; et al. A database of zooplankton biomass in Australian marine waters. Sci. Data 2020, 7, 297. [Google Scholar] [CrossRef]
  28. Guo, C.; Li, S.; Ke, J.; Liao, C.; Hansen, A.G.; Jeppesen, E.; Zhang, T.; Li, W.; Liu, J. The feeding habits of small-bodied fishes mediate the strength of top-down effects on plankton and water quality in shallow subtropical lakes. Water Res. 2023, 233, 119705. [Google Scholar] [CrossRef]
  29. Jeppesen, E.; Jensen, J.P.; Jensen, C.; Faafeng, B.; Hessen, D.O.; Søndergaard, M.; Lauridsen, T.; Brettum, P.; Christoffersen, K. The impact of nutrient state and lake depth on top-down control in the pelagic zone of lakes: A study of 466 lakes from the temperate zone to the arctic. Ecosystems 2003, 6, 313–325. [Google Scholar] [CrossRef]
  30. He, H.; Jin, H.; Jeppesen, E.; Li, K.; Liu, Z.; Zhang, Y. Fish-mediated plankton responses to increased temperature in subtropical aquatic mesocosm ecosystems: Implications for lake management. Water Res. 2018, 144, 304–311. [Google Scholar] [CrossRef] [PubMed]
  31. Olsen, S.; Chan, F.; Li, W.; Zhao, S.; Søndergaard, M.; Jeppesen, E. Strong impact of nitrogen loading on submerged macrophytes and algae: A long-term mesocosm experiment in a shallow Chinese lake. Freshw. Biol. 2015, 60, 1525–1536. [Google Scholar] [CrossRef]
  32. R Core Team. R: A Language and Environment for Statistical Computing; R Foundation for Statistical Computing: Vienna, Austria, 2020; Available online: https://www.r-project.org (accessed on 23 July 2020).
  33. Frenzel, P.; Henkel, D.; Siccha, M.; Tschendel, L. Do ostracod associations reflect macrophyte communities? A case study from the brackish water of the southern Baltic Sea coast. Aquat. Sci. 2005, 67, 142–155. [Google Scholar] [CrossRef]
  34. Gonçalves, A.; Castro, B.; Pardal, M.; Gonçalves, F. Salinity effects on survival and life history of two freshwater cladocerans (Daphnia magna and Daphnia longispina). Ann. Limnol.—Int. Lim. 2007, 43, 13–20. [Google Scholar] [CrossRef]
  35. Santangelo, J.M.; Bozelli, R.L.; Rocha, A.d.M.; Esteves, F.d.A. Effects of slight salinity increases on Moina micrura (Cladocera) populations: Field and laboratory observations. Mar. Freshwater Res. 2008, 59, 9. [Google Scholar] [CrossRef]
  36. Do-Hong, L.C.; Slooten, K.B.-V.; Tarradellas, J. Tropical ecotoxicity testing with Ceriodaphnia cornuta. Environ. Toxicol. 2004, 19, 497–504. [Google Scholar] [CrossRef] [PubMed]
  37. Lance, J. The salinity tolerance of some estuarine planktonic Copepods. Limnol. Oceanogr. 1963, 8, 440–449. [Google Scholar] [CrossRef]
  38. Finney, C.M. Salinity stress in harpacticoid copepods. Estuaries 1979, 2, 132–135. [Google Scholar] [CrossRef]
  39. Zhang, T.L. Life-History Strategies, Trophic Patterns and Community Structure in the Fishes of Lake Biandantang. Ph.D. Thesis, Institute of Hydrobiology, The Chinese Academy of Sciences, Wuhan, China, 2005. [Google Scholar]
  40. Yu, J.; Liu, Z.; He, H.; Zhen, W.; Guan, B.; Chen, F.; Li, K.; Zhong, P.; Mello, F.T.; Jeppesen, E. Submerged macrophytes facilitate dominance of omnivorous fish in a subtropical shallow lake: Implications for lake restoration. Hydrobiologia 2016, 775, 97–107. [Google Scholar] [CrossRef]
  41. Jeppesen, E.; Søndergaard, M.; Kanstrup, E.; Petersen, B.; Eriksen, R.B.; Hammershøj, M.; Mortensen, E.; Jensen, J.P.; Have, A. Does the impact of nutrients on the biological structure and function of brackish and freshwater lakes differ? Hydrobiologia 1994, 275, 15–30. [Google Scholar] [CrossRef]
  42. Ruiz, F.; Abad, M.; Bodergat, A.M.; Carbonel, P.; Rodríguez-Lázaro, J.; González-Regalado, M.L.; Toscano, A.; García, E.X.; Prenda, J. Freshwater Ostracods as Environmental Tracers. Int. J. Environ. Sci. Technol. 2013, 10, 1115–1128. [Google Scholar] [CrossRef]
  43. Timms, R.M.; Moss, B. Prevention of growth of potentially dense phytoplankton populations by zooplankton grazing, in the presence of zooplanktivorous fish, in a shallow wetland ecosystem. Limnolsm. Oceanogr. 1984, 29, 472–486. [Google Scholar] [CrossRef]
  44. Van Donk, E.; van De Bund, W.J. Impact of submerged macrophytes including charophytes on phyto- and zooplankton communities: Allelopathy versus other mechanisms. Aquat. Bot. 2002, 72, 261–274. [Google Scholar] [CrossRef]
Figure 1. The mean values (solid line within box-and-whisker plots) of (a) salinity and (b) plant volume inhabited (PVI) in the mesocosms. Salinity treatments were control (CK, no addition of NaCl), salinity of 2 g/L (2), and salinity of 5 g/L (5). Plant treatments were the absence of submerged macrophytes (N) and the presence of submerged macrophytes (P). Different letters represent significant differences (p < 0.05), where capital letters indicate the absence of submerged macrophytes (N) and lowercase letters indicate the presence of submerged macrophytes (P). Statistical differences between the two plant treatments were designed as follows: *** p < 0.001, **** p < 0.0001.
Water 16 01542 g001
Figure 2. The mean values (solid line within box-and-whisker plots) of (a) the biomass of the phytoplankton and (b) the biomass of the periphyton in the mesocosms. Salinity treatments were control (CK, no addition of NaCl), salinity of 2 g/L (2), and salinity of 5 g/L (5). Plant treatments were the absence of submerged macrophytes (N) and the presence of submerged macrophytes (P). Different letters represent significant differences (p < 0.05), where capital letters indicate the absence of submerged macrophytes (N) and lowercase letters indicate the presence of submerged macrophytes (P). Statistical differences between the two plant treatments were designed as follows: * p < 0.05.
Water 16 01542 g002
Figure 3. The mean values (solid line within box-and-whisker plots) of (a) total zooplankton biomass, (b) cladoceran biomass, (c) copepod biomass, (d) rotifer biomass, (e) nauplii biomass, and (f) Ostracoda biomass in the mesocosms. Salinity treatments were control (CK, no addition of NaCl), salinity of 2 g/L (2), and salinity of 5 g/L (5). Plant treatments were the absence of submerged macrophytes (N) and the presence of submerged macrophytes (P). Different letters represent significant differences (p < 0.05), where capital letters indicate the absence of submerged macrophytes (N) and lowercase letters indicate the presence of submerged macrophytes (P).
Water 16 01542 g003
Figure 4. The mean values (solid line within box-and-whisker plots) of (a) the ratio of zooplankton biomass to phytoplankton biomass (Bzoop:Bphyt) and (b) the mean monthly ratio of chlorophyll-ɑ to total phosphorus (Chl:TP) (solid line within box-and-whisker plots) observed in the different mesocosms. Salinity treatments were control (CK, no addition of NaCl), salinity of 2 g/L (2), and salinity of 5 g/L (5). Plant treatments were the absence of submerged macrophytes (N) and the presence of submerged macrophytes (P). Different letters represent significant differences (p < 0.05), where capital letters indicate the absence of submerged macrophytes (N) and lowercase letters indicate the presence of submerged macrophytes (P). Statistical differences between the two plant treatments were designed as follows: * p < 0.05.
Water 16 01542 g004
Table 1. Results of two-way ANOVA investigating the effects of salinity, plants, and their combined effects on pH, alkalinity (Alk), electrical conductivity (EC; µs/cm), total phosphorus (TP; mg/L), total nitrogen (TN; mg/L), and water temperature (WT; °C) within mesocosms.
VariablesF Value and Significance
SalinityPlantSalinity × Plant
pH5.292 *56.219 ***7.838 **
Alk98.056 ***38.989 ***9.615 **
EC2820.963 ***0.0931.177
TP0.2601.4302.952
TN2.5990.3141.358
WT0.8610.5110.520
Note: Data are shown as F value with the significance results in asterisk (* p < 0.05, ** p < 0.01, *** p < 0.001).
Table 2. Results of two-way ANOVA examining the effects of salinity, plants, and their interactions on the measurements of total zooplankton, rotifers, nauplii, copepods, cladocerans, and Ostracoda biomass within mesocosms.
VariablesF Value and Significance
SalinityPlantSalinity × Plant
Total zooplankton6.390 **0.4960.585
Copepods53.622 ***2.6431.393
Cladocerans3.706 *0.7160.607
Nauplii34.579 ***0.0070.951
Rotifer1.3940.8731.875
Ostracoda17.779 ***13.956 **7.000 **
Note: Data are shown as F value with the significance results in an asterisk * p < 0.05, ** p < 0.01, *** p < 0.001.
Disclaimer/Publisher’s Note: The statements, opinions and data contained in all publications are solely those of the individual author(s) and contributor(s) and not of MDPI and/or the editor(s). MDPI and/or the editor(s) disclaim responsibility for any injury to people or property resulting from any ideas, methods, instructions or products referred to in the content.

