Abstract
Composting is a common treatment for the high amounts of sewage sludge produced in wastewater treatment plants, and the product is used in agriculture. Composting reduces the levels of biodegradable organic pollutants, although other compounds present in wastewater and not eliminated previously by conventional physical–chemical and chemical treatments, such as polychorodibenzo-p-dioxins/furans (PCDD/Fs) and polychlorinated biphenyls (PCBs), have been found in the final compost at higher levels than those observed in the initial sludge. Their formation was studied during composting under unfavorable aeration conditions and paying attention to different stages of the process. Experiments were carried out in small vessels inside a controlled oven for three types of sewage sludge. Pentachlorophenol was previously added as a dioxin precursor. A clear formation of PCDD/Fs was found, especially during the maturation stage for two experiments. Mainly octachlorodibenzo-p-dioxin (OCDD) and 1234678-heptachlorodibenzo-p-dioxin (1234678-HpCDD) to a lesser extent were formed. OCDD levels in the final samples were around 10 times higher than those of the initial mixture after removing the concentration effect. No clear formation nor degradation of PCBs was observed. The toxicity values due to PCDD/Fs and PCBs found in the initial mixtures were 1.20–2.46 ng WHO-TEQ/kg, and those from the final samples were 2.30–7.86 ng WHO-TEQ/kg. Although the toxicity values are below the most restrictive limits found in Europe in this case, toxicity could increase considerably with the presence and concentration of other precursors. Compost from sewage sludge is an ecological product, but the operating conditions must be controlled to avoid PCDD/F formation and facilitate degradation of persistent organic pollutants.
Keywords:
sewage sludge; sawdust; composting; inappropriate aeration; PCP; PCDD/Fs; PCBs; thermophilic stage; maturation stage 1. Introduction
Large amounts of sewage sludge are generated every year as a residue of wastewater treatment plants (WWTPs). In Europe, the production of sludge has remained relatively stable between 2007 and 2018, averaging around 7–8 million metric tons per year [1,2]. This waste contains valuable organic matter, nitrogen, phosphorus and micronutrients (in particular, metals such as nickel and copper), useful for soil fertilization and remediation. Therefore, its use in agriculture potentially represents an optimum solution. Although around 40% of the total amount produced is used in agriculture, it increases up to 80% in Spain, where the waste is used directly or in previous composting [2]. Unfortunately, sewage sludge also contains pathogens, organic and inorganic pollutants and potentially toxic compounds, such as polycyclic aromatic hydrocarbons (PAHs), polychlorinated biphenyls (PCBs), polychlorinated dibenzo-p-dioxins and furans (PCDD/Fs), nonylphenols and other trace pollutants, such as pharmaceuticals and phytopharmaceuticals, personal care products and microplastics, so-called “emerging contaminants” [3]. They derive from the contaminated wastewater, and conventional physical–chemical and biological treatments carried out in WWTPs do not eliminate them. They pass from water to sludge. Pollutants can be persistent in the environment, accumulating and biomagnifying, and may pose hazards to human health and the ecosystem [4], such as carcinogenicity, teratogenicity, reproductive toxicity and genotoxicity. The EU Directive 86/278/EC on sludge used in agriculture [5] did not establish limit values for these organic compounds, and some Member States have adopted them. A new directive that provided limits for organic micropollutants and pathogens was proposed in 2000, but it was withdrawn [6]. Nevertheless, sewage sludge treatment activities focus on improving its quality for recovery opportunities (which should include organic pollutants control) while minimizing the quantities to be treated and disposed in accordance with the EU Directive on waste [7] and the Circular Economy Action Plan [8]. In this sense, the current plan calls for wastewater treatment plants (WWTPs) to be turned into water resource recovery facilities (WRRFs) [9].
A common treatment for sewage sludge before its application in agriculture is composting. This process involves microbial degradation of materials in the presence of adequate air and moisture levels, resulting in a product known as compost. Compost exhibits characteristics similar to fertile soil. To initiate composting, sewage sludge is mixed with bulking agents such as straw, sawdust, leaves, or woodchips to enhance permeability to air and facilitate biological degradation. As aerobic microorganisms oxidize the organic matter, they generate heat, leading to temperature elevation. Then, the composting process must include a thermophilic stage (fermentation at 45–70 °C for several days) and a maturation stage at room temperature [10]. Composting is also suitable for many types of organic waste, such as yard waste, livestock waste or municipal solid waste (MSW). This treatment reduces the amount of waste and should also reduce the levels of biodegradable organic pollutants, such as lesser molecular mass PAHs, nonylphenol and nonylphenol ethoxylates, antibiotics or personal care products [11,12,13]. However, other compounds such as PCDD/Fs and PCBs have been found in the final compost at higher levels than in the initial sludge [14,15].
PCDD/Fs and PCBs are unintentionally produced by-products of chemical industrial processes and combustion processes. They are listed as persistent organic pollutants (POPs) in the Stockholm Convention [16]. These compounds can be present in the initial sewage sludge, and due to the mass reduction during composting, a concentration of recalcitrant pollutants increases their levels. Furthermore, they could be present in the bulking materials added to the composting process, such as sawdust or wooden pellets previously treated with pentachlorophenol (PCP)-containing wood preservatives [17]. PCP was used for many years as a fungicide to treat wood to prevent woodworm, although nowadays its use is limited because of its relationship with the formation of PCDD/Fs. It has been observed that PCP is the most contaminated pesticide with these compounds. Another source of PCDD/Fs and PCBs in compost could be an enzymatic formation from chlorophenols such as PCP during the composting process, as has been demonstrated for PCDD/Fs in experiments in vitro with different chlorophenols at 25 and 37 °C in the presence of lignin and manganese peroxidases, lignolytic enzymes typical during sewage sludge composting [18]. Octachlorodibenzo-p-dioxin (OCDD) but also 1234678-heptachlorodibenzo-p-dioxin (1234678-HpCDD) to a lesser extent were the congeners which showed the highest formation. The formation of HpCDD and OCDD with chlorinated organic precursors during metabolic processes from different types of waste under environmental conditions (such as composting and digestion) has also been reported [19,20,21]. However, the study on PCDD/Fs in sewage sludge and its compost is limited due to the high cost of analysis of PCDD/Fs. A significant decline in the levels of PCDD/Fs and PCBs has been observed in sewage sludge from some European countries since the late 1970s, and they are now generally below 10 ng TEQ/kg dry mass (expressed as toxicity equivalents, TEQ) in samples without specific industrial contributions [3]. Therefore, the levels found in compost are normally lower as well, although some recent Chinese samples showed levels higher than the limit proposed for land application [22].
The specific conditions which favor the enzymatic formation of these types of compounds have not been clearly determined until now. Variations of nearly tenfold have been observed in PCDD/F levels of compost samples collected from various locations within the same composting plant [23]. The enzymatic formation depends on the presence of precursors (specifically chlorophenols) from sewage sludge or sawdust, and therefore on the initial materials used, and the operating conditions (aeration, humidity, aerobic/anaerobic, etc.) [22]. Different points of the composting plant could have different conditions, and the sample heterogeneity plays an important role. Muñoz et al. [24] observed that inappropriate aeration and the presence of PCP caused a notable rise in OCDD levels. Weber et al. [20] also observed HpCDD and OCDD formation during anaerobic treatment of sewage sludge. No study reported the removal or degradation percentage for PCDD/Fs during sludge composting, which might be attributed to the elevated levels of HpCDD and OCDD.
Most papers highlighted the PCDD/F formation but did not pay much attention to PCBs (they did not observe a clear formation in the conditions studied or did not analyze them) [19,25,26], despite being closely related to PCDD/Fs. Some of them, 12 congeners, are identified by the World Health Organization (WHO) as having dioxin-like properties, so they are called dioxin like-PCBs. Nevertheless, Muñoz et al. [27] observed a high contribution of PCBs to the total toxicity due to PCDD/Fs and PCBs in composted samples from MSW (although the toxic concentrations were low and did not present great environmental concern). Therefore, PCBs must be also considered.
Nevertheless, proper composting conditions lead to PCDD/F biodegradation and can be used for remediation of dioxin-contaminated soils, as was demonstrated by Huang et al. [28] and Tran et al. [29]. These authors obtained a removal efficiency of 75 an 81%, respectively, after 35 days of aerobic co-composting of food waste with PCDD/F contaminated soil. The highest biodegradation rate was observed during the thermophilic phase, where bacterial activity was at its peak. Other authors found similar results using simulated compost-amended landfill reactors under hypoxic conditions [30]. Other authors used a semi-aerobic, mesophilic, fed-batch composting (FBC) reactor loaded with household garbage to remove PCDD/Fs [31]. The bacteria “Dehalococcoides” and its phylogenetic relatives of Chloroflexi were proposed as the possible dechlorinators. The proper aeration conditions for the PCDD/F biodegradation are not defined, although promising results were obtained in different conditions. White rot fungi, and specifically the enzyme manganese peroxidase they secrete, have been found to be crucial in PCDD/F degradation from contaminated soils [32,33,34]. In some cases, the removal mechanism was found to be biased towards oxidation rather than dehalogenative reduction. It is noticeable that fungal growth is inhibited by high PCDD/F concentrations.
The aim of this work was to study the formation/degradation of PCDD/Fs and dioxin like-PCBs during the composting process of sewage sludge with the presence of PCP and inappropriate aeration, so the mixtures could simulate the lumps which are not well mixed in a composting plant. Inappropriate aeration causes a higher PCDD/F formation for these kinds of materials according to the literature. A simple method at laboratory scale was used, and different parameters were studied: type of sludge and phase of the process. Previous results corresponding to PCDD/F levels after 40 days of composting indicated a formation, so it was considered interesting to study possible changes during the maturation stage from 40 to 70 days in this work and compare them to the previous results. In addition, it was considered interesting to add PCB results, so in this case samples were analyzed at the beginning of the composting process, at 40 days and at 70 days in this study. The results obtained will help define the controls that must be carried out during the composting process so that this material can be completely beneficial for the soil.
2. Materials and Methods
2.1. Sewage Sludge and Initial Mixtures
Three different types of sewage sludge were used for the experiments. They originated from different wastewater treatment plants (WWTPs) in the province of Alicante (Spain) which collect sanitary water and rainwater and can collect direct discharge with tanker trucks upon request. The WWTPs serve different areas with different industrial loads and population. Therefore, sludge samples corresponded to rural, urban and urban–industrial areas (hereafter R, U and UI sludge, respectively). Table 1 illustrates the characteristics of the WWTPs from which the three sludge samples originated. All of the samples derived from a mixture of primary and secondary decantation treatments, The secondary decantation had a previous biological reaction stage involving activated sludge. The WWTP where R sludge was produced carried out physical–chemical treatment of coagulation and flocculation prior to the biological degradation. In addition, this sludge was chemically stabilized with Ca(OH)2. The other two samples, U and UI, were subjected to a stabilization treatment using anaerobic digestion due to their higher contaminant load.

Table 1.
Characteristics of the WWTPs of origin [35].
The samples of sewage sludge were first air-dried from around a water content of 85% until 30% to better mix the materials. Then, they were mixed with bulking agents: sawdust and straw. The mixture comprised 80% sewage sludge and 20% bulking materials: 14% sawdust and 6% straw (volume percentages based on wet materials and assuming a 30% water content for sludge). This specific composition was selected according to a previous study of our group [24] to ensure a sufficient temperature increase to 60 °C during the initial days and achieve acceptable fermentation. This fermentation was related to the evolution of CO2, denoted by a concentration of the inorganic material (ash).
Once the three initial mixtures were prepared, their moisture content was adjusted to 65% by spraying water to ensure adequate moisture for the process without compromising aeration. PCP (Sigma-Aldrich, Darmstadt, Germany, 99% certified) dispersed in water was added as dioxin precursor to achieve 100 mg PCP/kg dry mixture. This compound can be found in the initial materials, e.g., 2.8–12.0 mg/kg in sawdust [36], but it was added in excess to contaminate samples with PCP and to observe a possible formation more clearly. The concentration of PCP was selected based on values in the literature for in vitro PCDD/F formation from PCP, specifically those obtained when the reaction was catalyzed by peroxidases typical of sewage sludge composting, with values up to 7·108 ng OCDD/kg PCP [18]. Then, with 100 mg PCP/kg mixture, the OCDD formation could be around 8000 ng/kg sample. Mixing was carried out manually for a sufficient duration to ensure homogeneity. Before composting, 10 g of each mixture was analyzed for the PCDD/F and PCB content in the initial samples.
The characterization of those initial mixtures is shown in Table 2. This is useful for determining the C/N ratio before composting, which is an important parameter for the process, and appreciating differences between sludge samples. The C, H, N and S contents were determined using a Carlo Erba CHNS-O EA 1108 analyzer (Triad Scientific, Manasquan, NJ, USA), which was used to carry out complete oxidation and analysis of resultant gases by gas chromatography. The content in other elements was analyzed by X-ray fluorescence by a sequential spectrometer PHILIPS MAGIX PRO (Philips Analytical, Almero, the Netherlands) equipped with a rhodium X-ray tube and beryllium window. The results are expressed as weight percentage with respect to dry matter, and the rest up to 100% mainly corresponds to oxygen. The Ca content was high in the mixture with sludge from a rural area stabilized with Ca(OH)2, as expected, and N and K showed lower levels for this sample. On the other hand, sludge from an urban–industrial area showed slightly higher levels of some metals such as Fe, Si and Al.
Table 2.
Elemental composition of the initial mixtures.
2.2. Laboratory Runs
Two identical 250 mL polyethylene containers with lids were filled with each mixture up to 4/5 of the total volume in order to produce replicates. The lids had been previously perforated homogeneously, and therefore non-aerated conditions, probably semi-anaerobic conditions, were achieved. In this way, the mixtures could simulate the lumps which are poorly mixed in a composting plant. The six containers were placed inside a conventional oven with natural convection (UNB100, Memmert GmbH + Co.KG, Schwabach, Germany). Additional containers filled with water were also placed in the oven to maintain atmospheric humidity during the experiment, and water was periodically added to the samples to counteract the possible moisture loss through evaporation. A diagram of the experimental configuration can be observed in Figure 1.
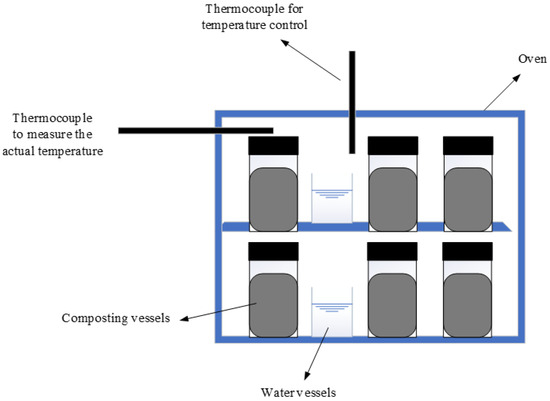
Figure 1.
Diagram of the experimental setup.
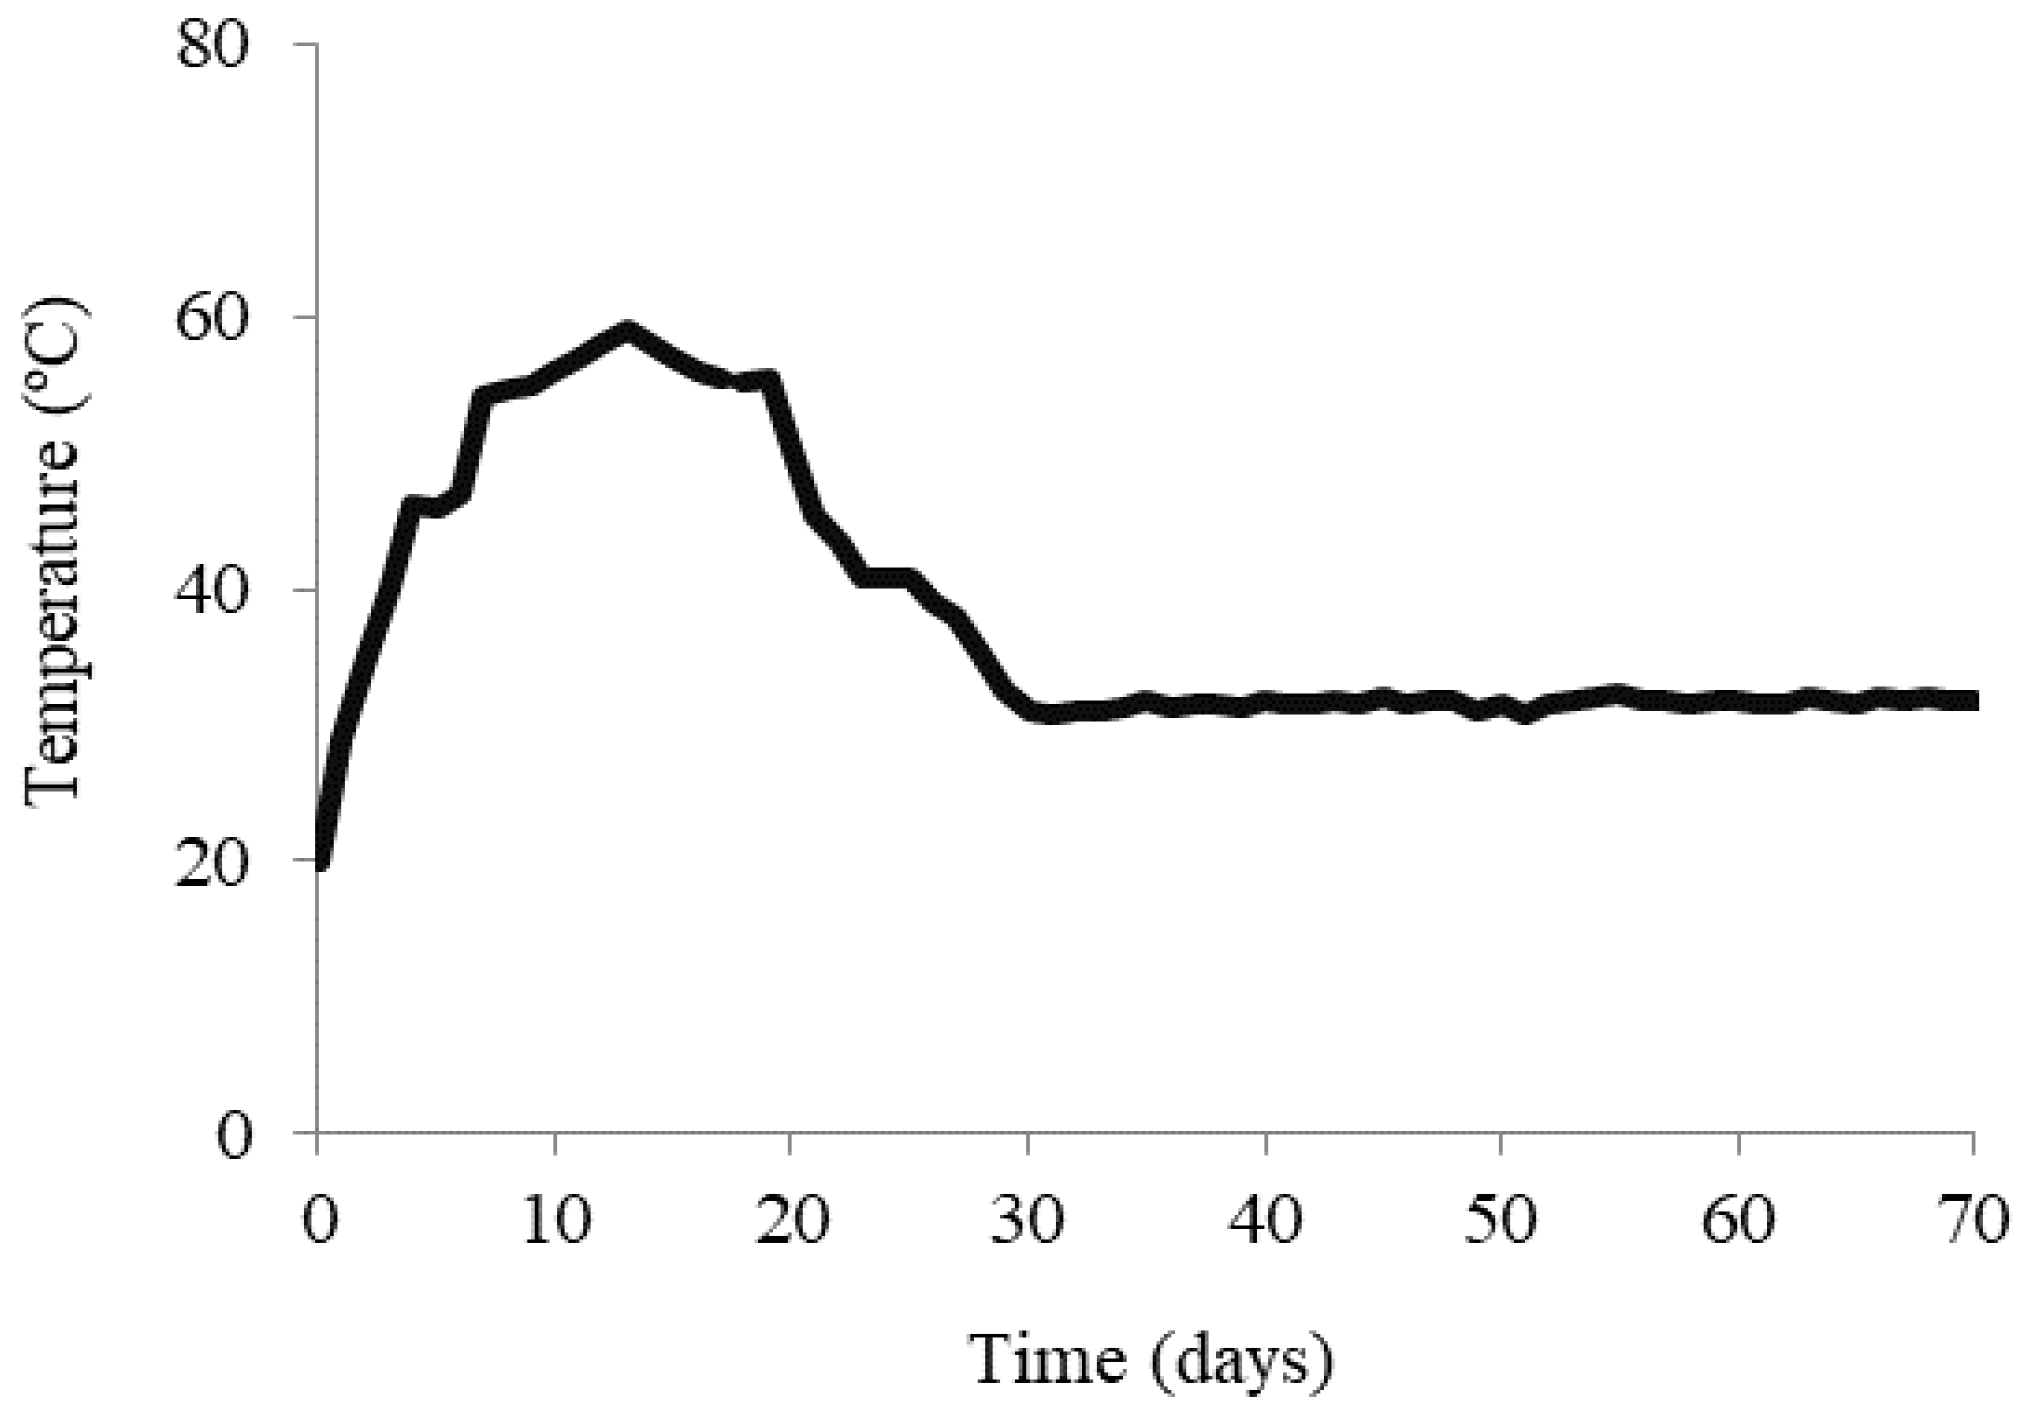
The oven temperature was adjusted manually to simulate the temperatures reached in the composting process, ensuring that it remained above 60 °C for a minimum of 10 days, followed by a gradual decrease until 40 days (end of the composting process). Finally, the temperature was kept at around 30 °C for 30 more days (maturation phase). Figure 2 shows the temperature profile in the oven.
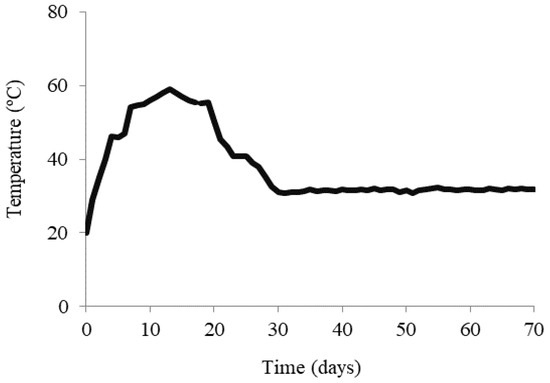
Figure 2.
Temperature profile during the experiments (adapted from Muñoz et al. [24] with permission from Science of the Total Environment; published by Elsevier, 2018).
Table 3 summarizes the different composting runs carried out. For each one, three samples of 10 g were collected for PCB analysis: an initial one, one sample taken from the vessel after 40 days and one ample taken after 70 days. Therefore, 18 samples were analyzed in total. The PCDD/F levels in the initial samples and those obtained at 40 days were previously studied [24] and are used in this paper for comparison as well as those obtained in experiments without PCP. PCDD/F levels after 70 days were analyzed in this study.
Table 3.
Description of runs.
2.3. Sample Analysis
Samples were either analyzed immediately upon collection or frozen for up to one month prior to analysis to stop the composting process.
The moisture content was necessary to express results of PCDD/F and PCB contents on a dry basis, so that water did not influence the final results. This was obtained by drying at 105 °C for 24 h.
The ash content was also important since the ratio between composted material ash and the initial material ash (both on dry matter) indicated the concentration degree of the organic material due to the biodegradation process. The ash content was determined in a Heron 12PR/300 muffle furnace (Hobersal, Barcelona, Spain) at 900 °C for 8 h.
The analysis of the 17 toxic tetra- through octa-chlorinated 2378-substituted PCDD/Fs and the 12 dioxin-like PCBs (non-ortho and mono-ortho congeners) was based on the US EPA method 1613 [37], as detailed in a previous study [24]. Wet samples were spiked with the internal standard solutions EPA-1613 LCS and WP-LCS (Wellington Laboratories Inc., Guelph, ON, Canada) and left with anhydride sodium sulfate for a minimum of 3 h. Subsequently, they were extracted in toluene using accelerated solvent extraction with a Dionex 100 apparatus (Dionex Corp., Sunnyvale, CA, USA). After an acid-basic wash, a multi-column clean-up was carried out using an FMS Power Prep TM System (FMS Inc., Boston, MA, USA) to eliminate interference and fractionate analytes. Prior to the analysis, the recovery standards 13C PCDDs and 13C PCBs (Wellington Laboratories Inc., Guelph, ON, Canada) were added. A Thermo Finnigan MAT95 XP High Resolution Mass Spectrometer with a positive electron impact (EI+) source coupled to a Thermo Finnigan TRACE GC 2000 Chromatography apparatus (Thermo Fisher Scientific, Waltham, MA USA) was used for the analysis of compounds. A J&W DB-5MS column (60 m × 0.25 mm × 0.1 μm) was employed for the separation of the specific isomers of PCDD/Fs and a DB-XLB column (60 m × 0.25 mm × 0.25 μm) for PCBs.
The toxicity values are expressed as WHO2005-TEQ based on WHO2005 TEF toxicity factors [38].
2.4. QA/QC
Blank samples with anhydride sodium sulfate were analyzed to identify possible interference. PCDD/F and PCB levels of the blanks were much smaller than those of the samples. Quality assurance and quality control (QA/QC) specifications used for identification of each congener are described in our previous work [24]. The recovery percentages of all congeners were within the limits specified by the US EPA Method 1613 [37]; most of them were 80–90%. The minimum concentration of PCDD/Fs and PCBs detected was 0.1 ng/kg sample.
3. Results
3.1. Degradation of Material
A degradation process occurred inside the vessels, as can be observed from Table 4. In all cases, the ash content increased from the beginning to 40 days, whereas no clear increase was observed between 40 days and 70 days (which corresponds to the maturation stage). The main degradation was produced during the first 40 days. Differences between replicates are notable due to the heterogeneity of these kinds of samples. This could also be the cause of the decrease in ash that seems to be observed in some samples between 40 and 70 days.
Table 4.
Ash content and concentration degree during the process for all runs.
The concentration degree of organic matter is also shown in Table 4 and was calculated by dividing the ash content of the composted sample by the ash content of the initial mixture. This indicates the concentration of ash and other remaining components during fermentation, considering the loss of CO2, NH3 and dry matter, as well as H2O [39]. Note that the concentration degree is normally around 1.5 in these experiments. This was used to refer all results of PCDD/F and PCB content to the initial mixture mass, thus removing the effect of mass concentration, which indicates whether formation takes place.
3.2. PCDD/F Formation
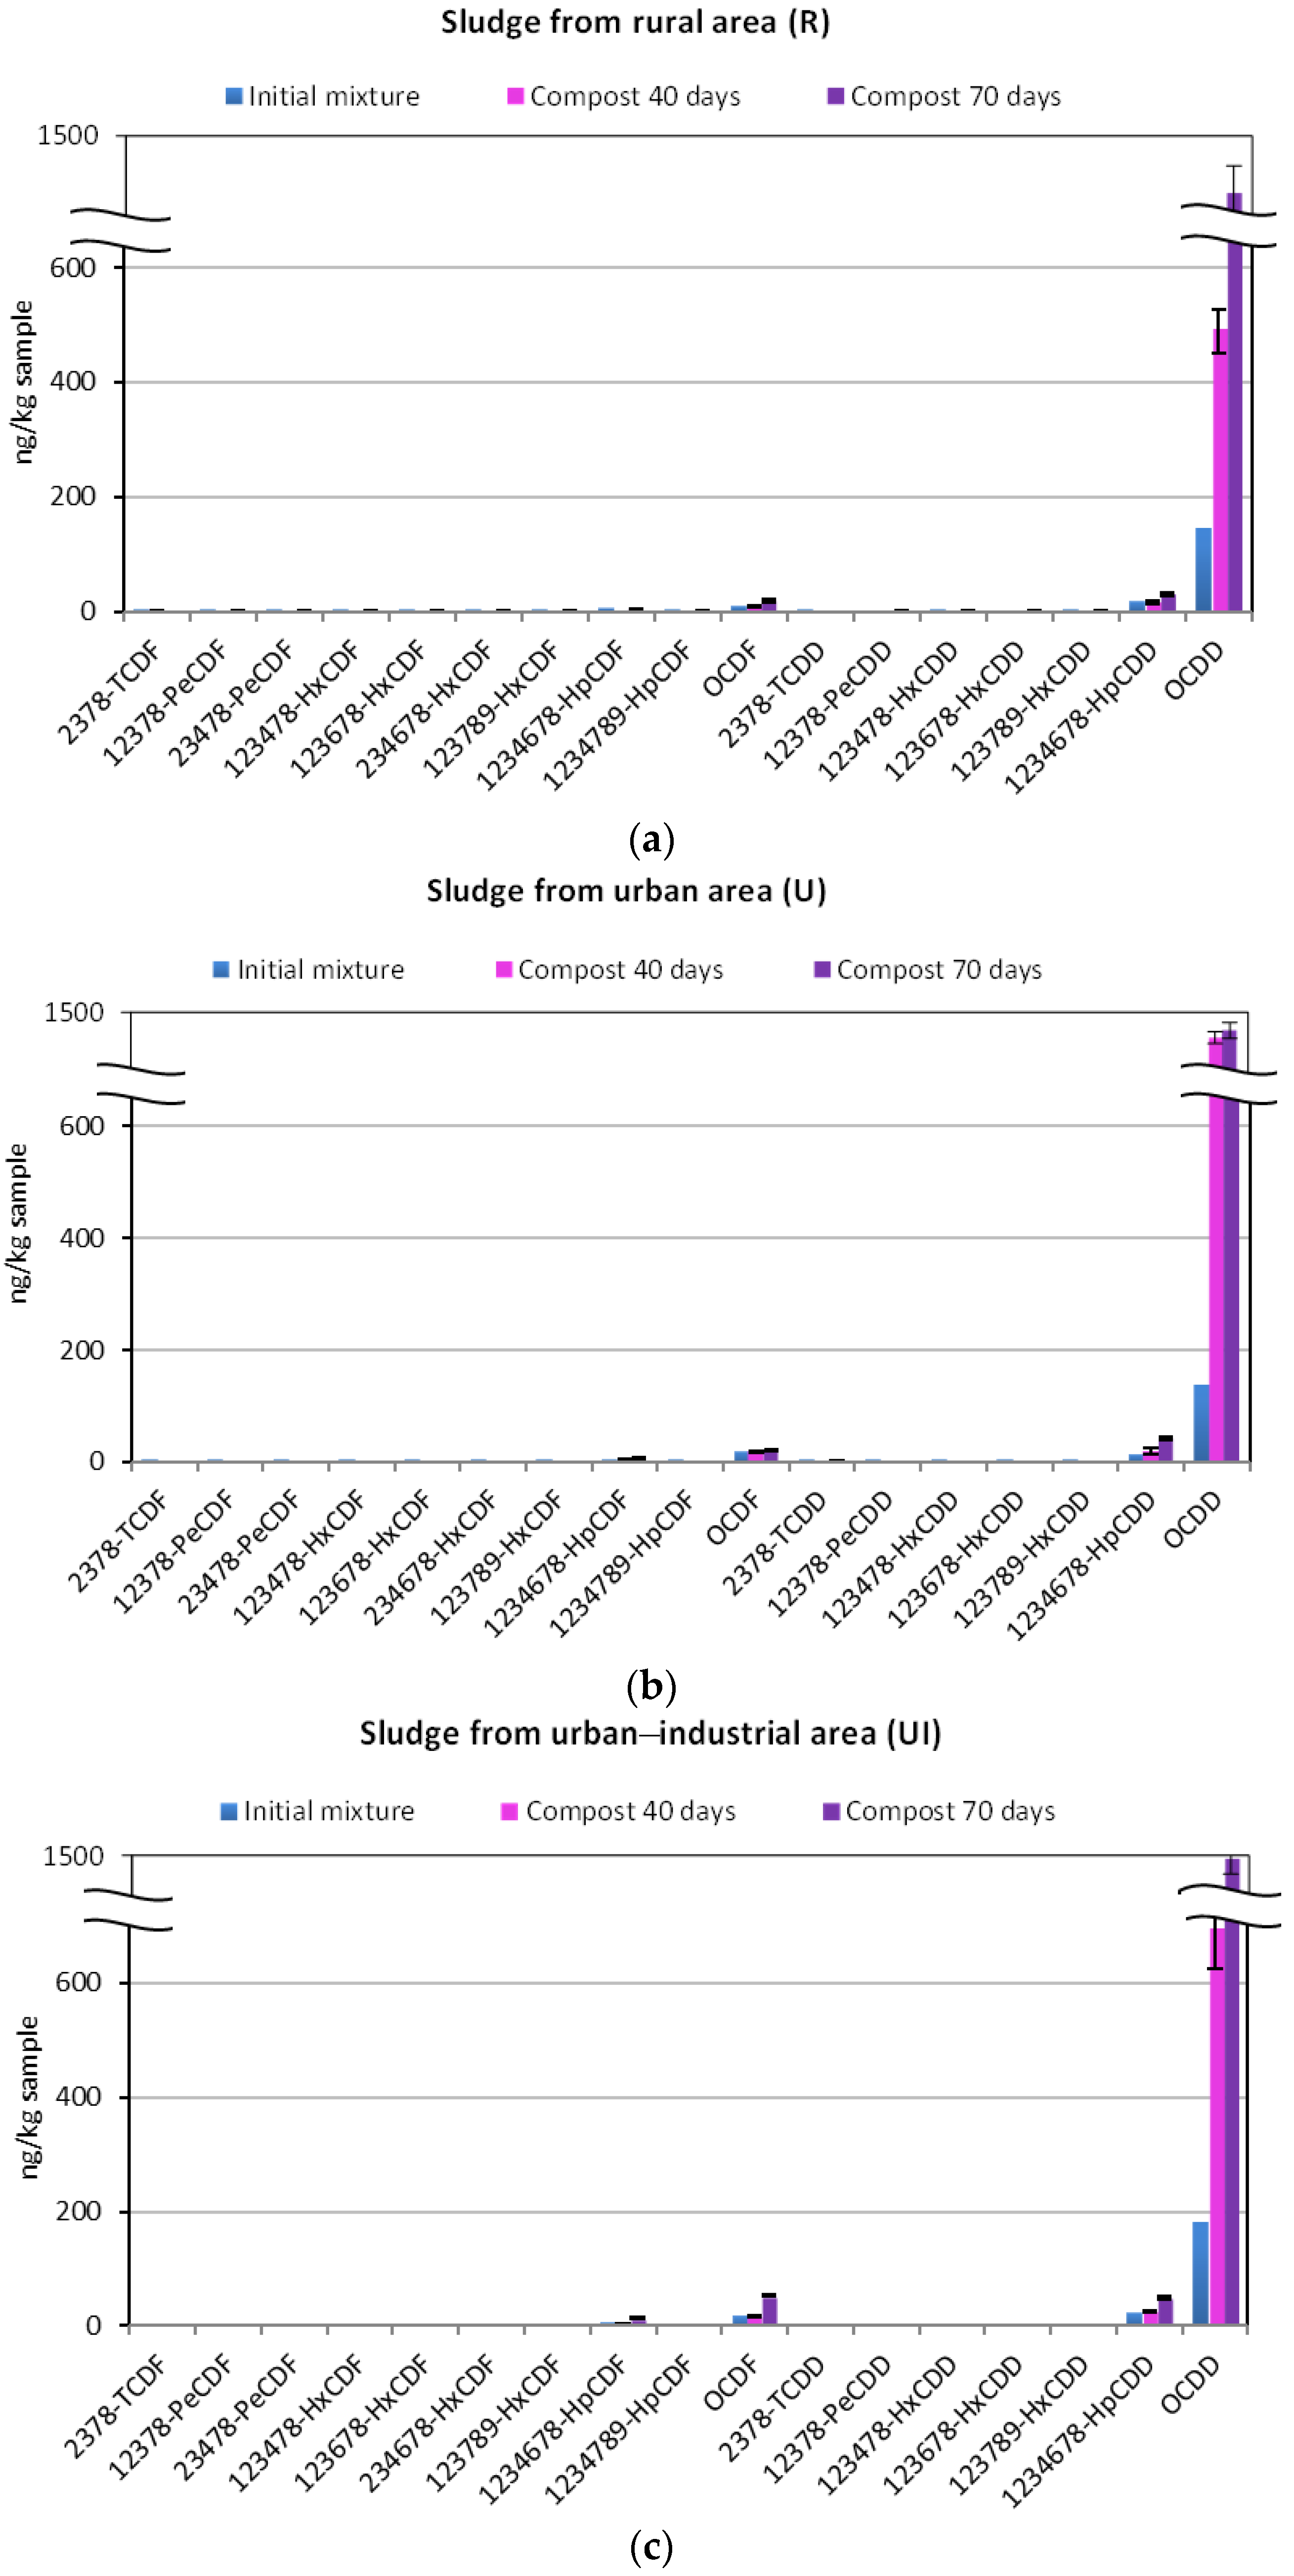
Figure 3 shows the PCDD/F levels obtained in the initial mixture and the final ones taken at 40 d (end of fermentation process) and at 70 d (end of maturation stage). All results refer to the initial sample mass. From this figure, it is deduced that there was a clear formation of OCDD in the three compost experiments when PCP was added, especially important after 70 d, when the fermentation process had supposedly finished. Levels in these samples were around 10 times higher than those of the initial mixture (724–962% increase, depending on the sample), as can be also observed in Figure 4. This means that special attention must be paid to the maturation phase, where the product is not normally aerated. After Student’s t-test, the difference between the OCDD levels before and after composting at 70 d (referring to the initial sample mass) was significant with a p-value of 0.000022.
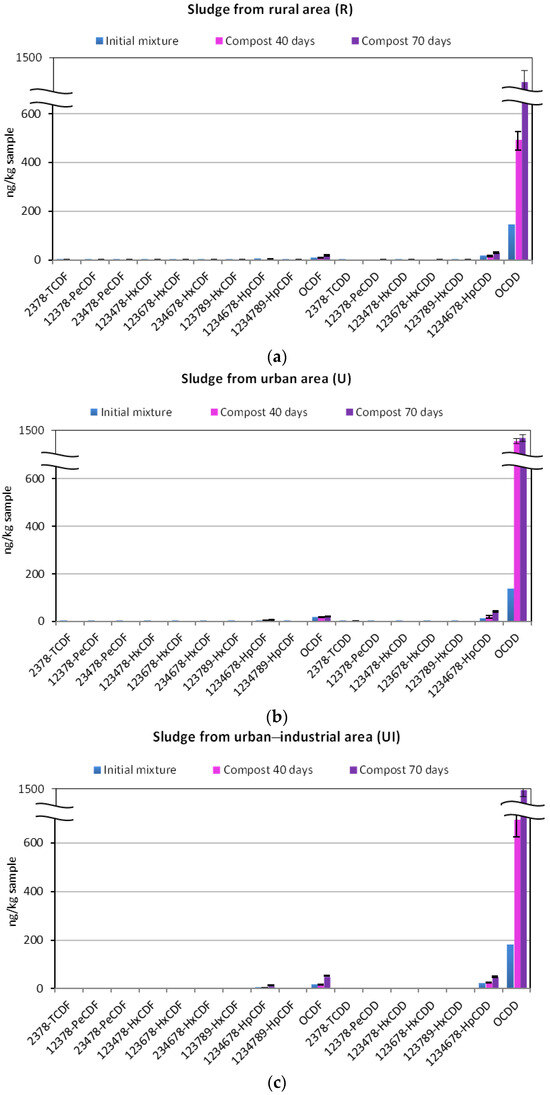
Figure 3.
PCDD/F levels in initial samples and those taken at 40 and 70 days of processing. Results refer to the initial sample mass. Experiments with sludge from different types of area: (a) rural area; (b) urban area; (c) urban–industrial area. Error bars correspond to the standard deviation.
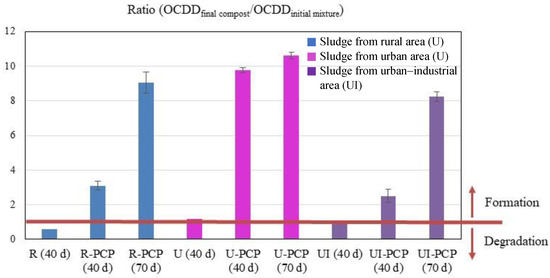
Figure 4.
Ratio OCDD levels obtained in the 40 d and 70 d samples compared to OCDD in the initial samples, with and without the addition of PCP. All results refer to the initial sample mass. Error bars correspond to the standard deviation.
The same behavior was observed for the three sewage sludge experiments and their replicates. It is remarkable that the urban sludge showed the highest increase in OCDD after 40 d, which was not the case for the other types of sludge. Nevertheless, all samples showed similarly high levels after 70 d.
There is also a significant formation of 1234678-HpCDD (82–235% increase depending on the sample, p-value 0.02), more pronounced from 40 d to 70 d of composting, and possibly of 1234678-HpCDF (14–144% increase but non-significant with a p-value of 0.18) and OCDF (21–201% increase but non-significant with a p-value of 0.23). However, the formation of these congeners is much lower than that of OCDD. Other congeners showed very low values or were not detected, and their formation was not significant (p-values > 0.05).
Since OCDD is the congener with the most significant increase, Figure 4 shows the ratio between the final and initial OCDD levels (considering final samples from 40 days of processing and from 70 days separately) in order to depict the differences more clearly. All values refer to the initial samples to remove the concentration effect of remaining material. In the same figure, values from samples composted for 40 days without addition of PCP are shown (R, U and UI) for comparison. They were taken from Muñoz et al. [24]. A clear OCDD formation can be observed in samples with PCP for all kinds of sludge, whereas no formation was found without PCP addition. Therefore, removing dioxin precursors during wastewater treatments can be considered crucial to avoiding their formation during sludge composting even in the most unfavorable conditions.
3.3. PCB Formation
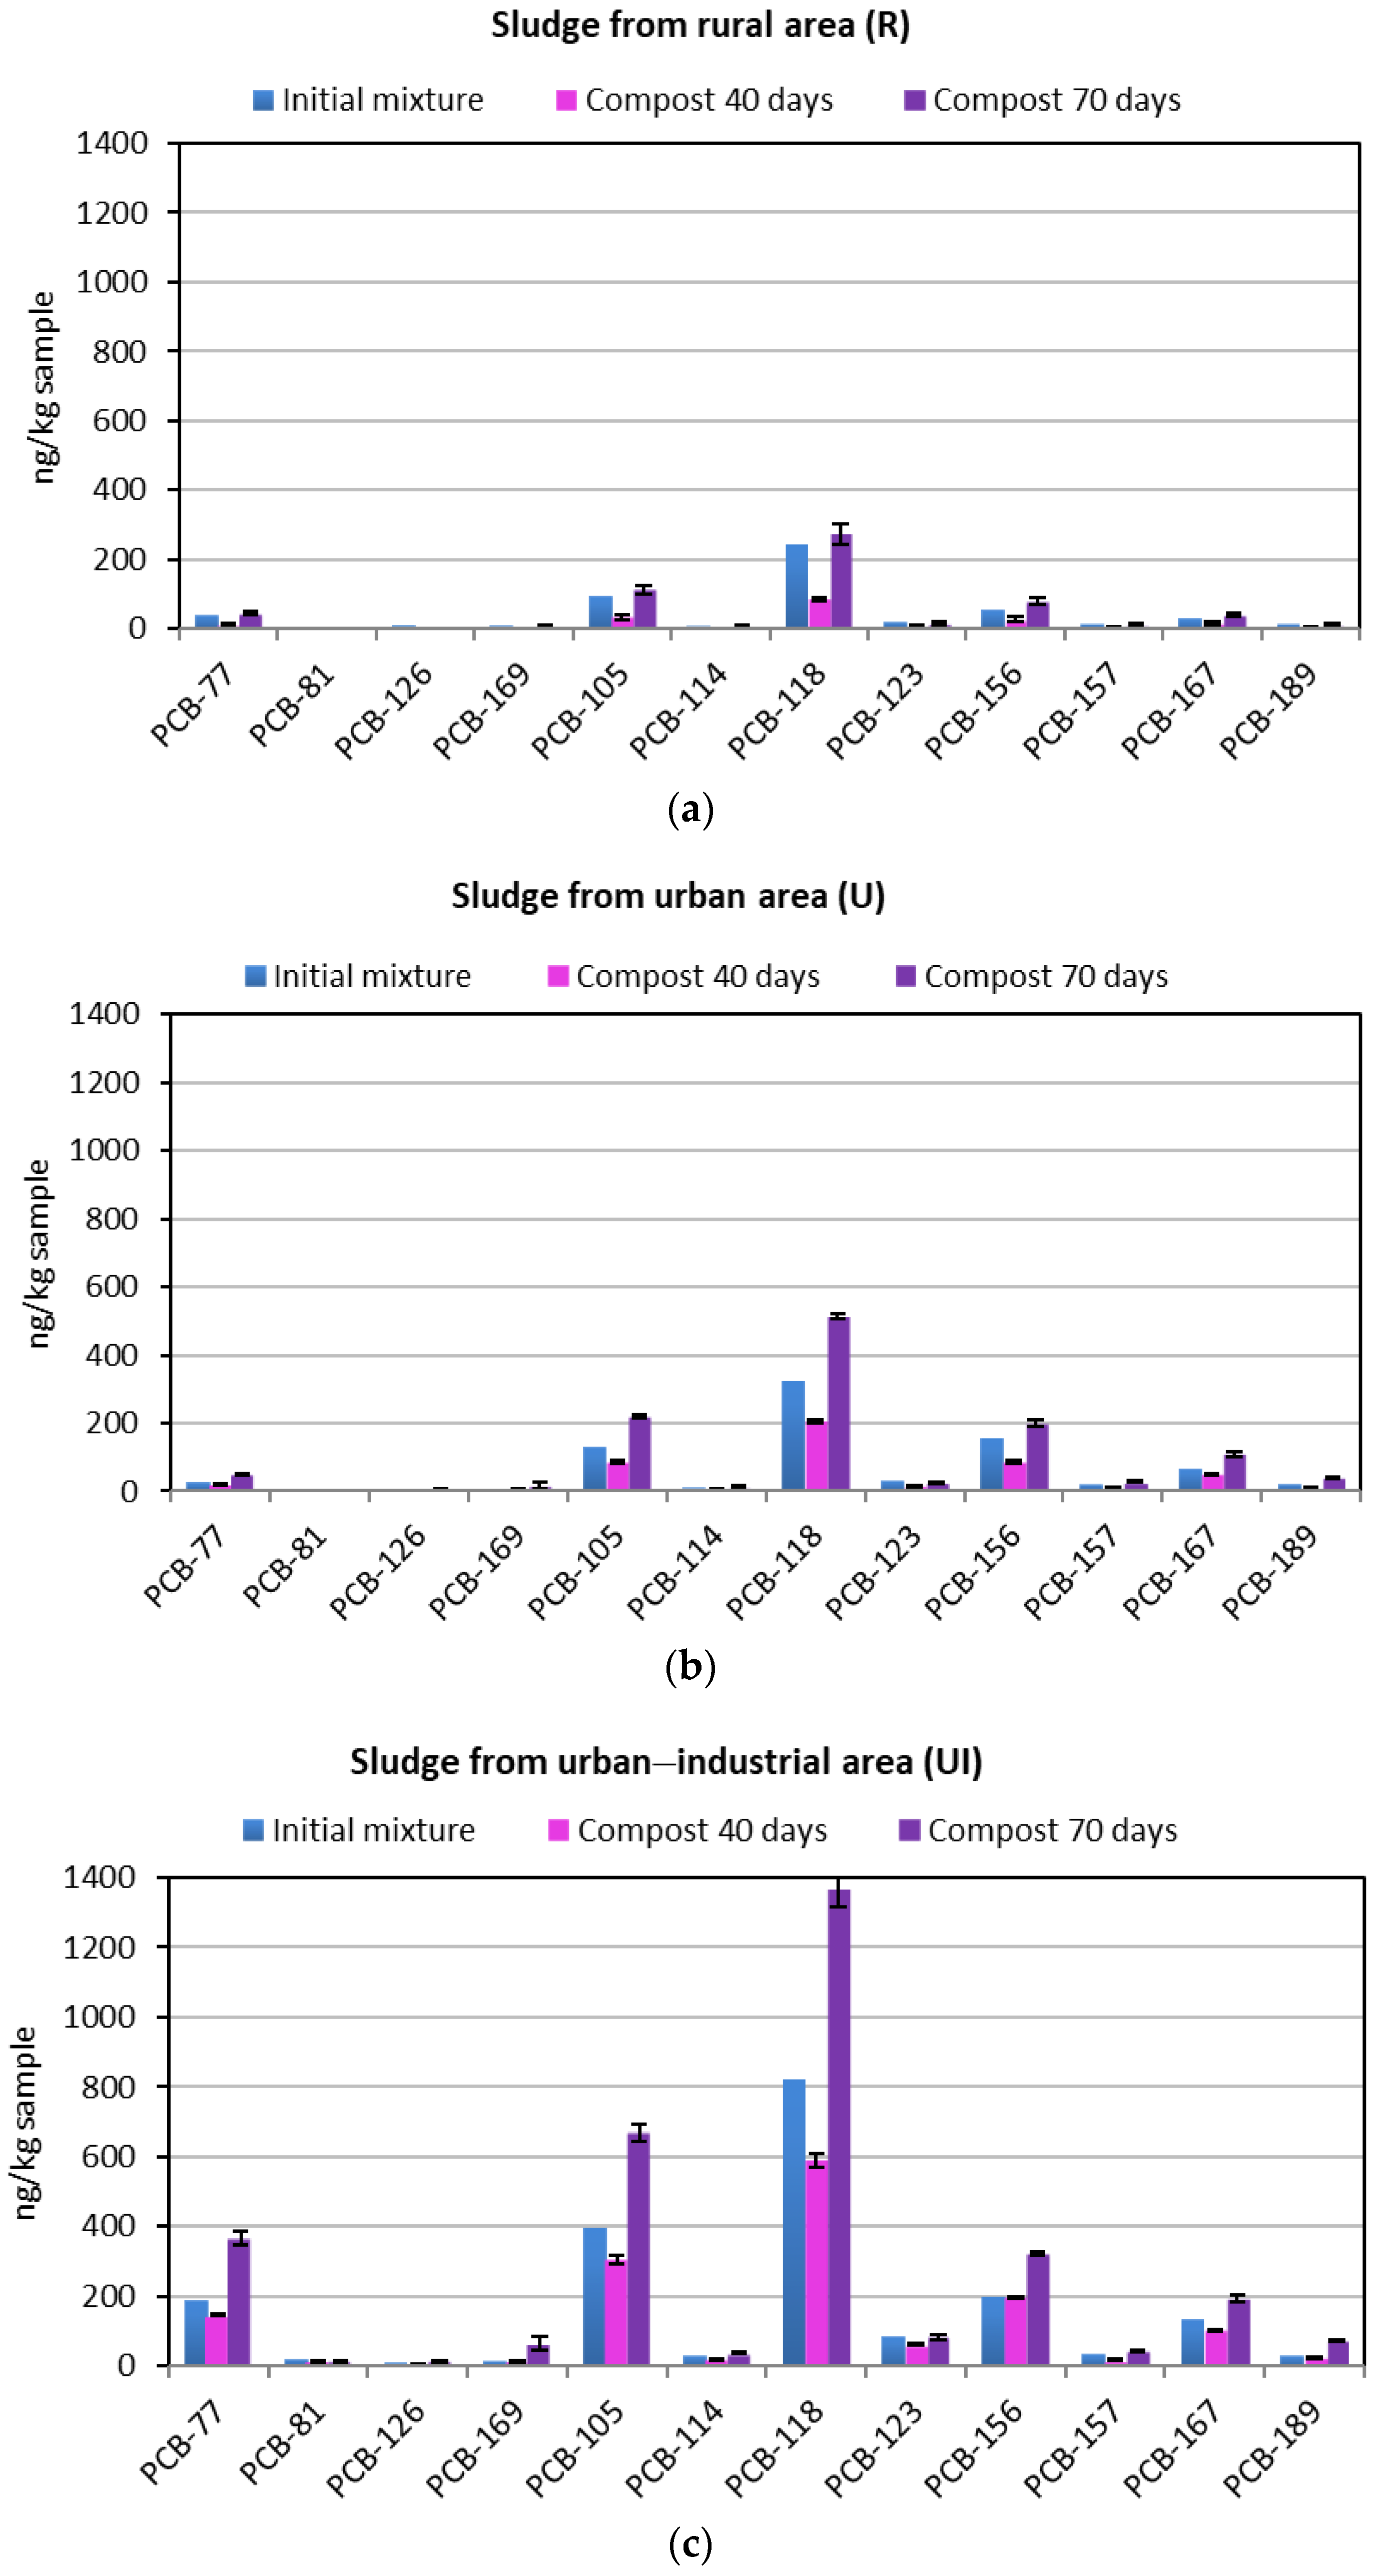
Figure 5 shows the dioxin-like PCB levels obtained in the initial mixture and the final ones taken at 40 d (end of fermentation process) and at 70 d (end of maturation stage). All results refer to the initial sample mass. No clear formation was observed, since levels seemed to decrease from the beginning to the end of the fermentation phase at 40 d, but they increased again during the maturation phase, showing a similar trend for all the congeners. The experiment with rural sludge (R) showed the lowest increase.
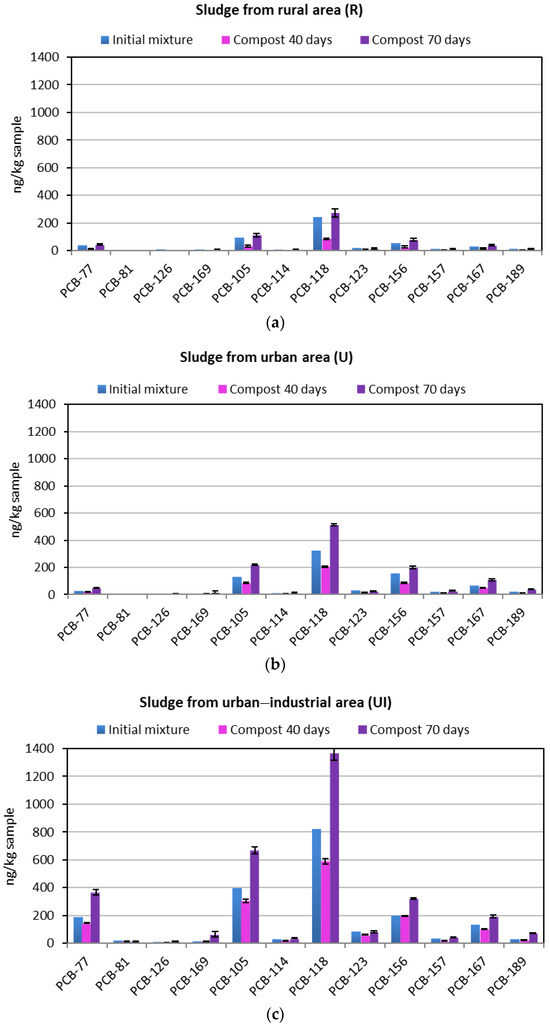
Figure 5.
Dioxin-like PCB levels in initial samples and those taken at 40 and 70 days of processing. Results refer to the initial sample mass. Experiments with sludge from different types of area: (a) rural area; (b) urban area; (c) urban–industrial area. Error bars correspond to the standard deviation.
PCB-118 was the congener with the highest levels and is considered as one of the marker PCBs by the International Council for the Exploration of the Seas (ICES). Figure 6 shows the ratio between the final and initial PCB-118 levels as an example (considering final samples from 40 days of processing and from 70 days separately) in order to observe a possible formation more clearly. All values refer to the initial samples to remove the concentration effect of remaining material. In the same figure, values from samples composted for 40 days without addition of PCP are shown (R, U and UI) for comparison. It seems that there was a possible formation of this compound during composting for two samples with PCP, but the increase observed is much lower than that produced for OCDD (13–66% increase, p value 0.53). The rest of the congeners also showed p-values higher than 0.05), and therefore non-significant formation was observed.
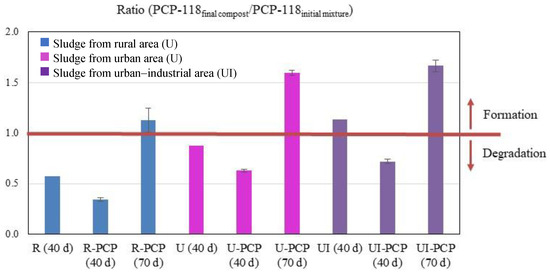
Figure 6.
Ratio PCB-118 levels obtained in the 40 d and 70 d samples compared to PCB-118 in the initial samples, with and without the addition of PCP. All results refer to the initial sample mass. Error bars correspond to the standard deviation.
3.4. Total Levels and Toxicity due to PCDD/Fs and PCBs
Table 5 shows the PCDD/F and PCB levels in the initial samples and in the final ones taken at 70 days as they would be applied to the soil (not referring to the initial sample mass) and the WHO2005-TEQ toxicity levels. The increase in concentrations of 1234678-HpCDD and OCDD during the composting process is noteworthy, taking into account that this material would be used in agriculture. Nevertheless, the toxicity values can be considered low for all samples. The values found in the initial mixtures ranged between 1.20 and 2.46 ng TEQ/kg, and those from the final samples ranged between 2.30 and 7.86 ng TEQ/kg. The contribution of each congener to the total toxicity can be observed in Table S1 of the Supplementary Information. The contribution of OCDD is low due to its lower toxicity factor compared to other congeners, thus going from 0.04–0.08 ng TEQ/kg in the initial samples to 0.57–0.69 in the final ones. The most toxic congeners, 2378-TCDD and 12378-PeCDD, are just found in three samples, causing a considerable but still low increase in the total toxicity. Dioxin-like PCBs showed a higher contribution for the composted sample from urban–industrial sludge (UI) due to PCB-126 and PCB-169, which are the most toxic PCBs. The marker PCB-118 has a low toxicity compared to the previous congeners, and its contribution to the toxicity is only notable for the UI sample, in spite of having higher levels for all samples.
Table 5.
Total levels and toxicity due to PCDD/Fs and dioxin-like PCBs in the initial samples and the 70 d composted ones.
I-TEQ toxicity values are also shown in Table 5 to facilitate the comparison with other authors, although they do not take into account the dioxin-like PCBs. The OCDD toxicity factor with this international standard was higher than those obtained from the WHO standard. Therefore, considering only PCDD/Fs, I-TEQ values were slightly higher than WHO-TEQ values.
4. Discussion
4.1. PCDD/F Formation
Our results indicating OCDD formation and 1234678-HpCDD formation to a lesser extent, especially during the maturation stage, are in accordance with those obtained by other authors. Malloy et al. [19] observed an important increase in the PCDD/F levels during composting, especially for compounds with a greater number of chlorine atoms such as OCDD. They studied sewage sludge samples contaminated with PCP and composted samples taken after the maturation stage. Similar results were obtained by Rullan et al. [40], who observed a high contribution of HpCDD and OCDD for compost samples taken after the maturation stage. They did not precisely measure the composting stage where the formation was higher and gave the results at the end of the whole process. However, Ng et al. [26] found progressively elevated levels of these kinds of POPs in the compost samples during the fermentation process (weeks 0–8), not paying attention to the maturation stage. Again, analysis of the congener profiles revealed that the heptaCDD and octaCDD were the main contributors to the observed increase in dioxin/furan content. This profile is typical of enzymatic formation of PCDD/Fs from PCP, as demonstrated in the literature [18]. The maturation phase is not normally considered important in the formation of POPs, contrary to our results. However, Lazzari et al. [41] observed the increase in other pollutants, priority PAHs, in this phase of sludge composting due to the mass reduction (around 40–60%) and low degradation/volatilization rates of some high molecular weight PAHs.
The non-aerated conditions during composting seem to play an important role for the PCDD/F formation. In a previous work, we carried out composting experiments with one of the samples studied in the present work, with added PCP and forced aeration conditions [24]. As a result, no PCDD/F formation was observed, contrary to what is observed under conditions of poor aeration.
The type of area the samples derive from could be important for the formation process. Grossi et al. [42] found high levels of PCDD/Fs in compost samples from MSW that were above the acceptable levels, especially in compost from metropolitan areas. In our work, compost samples from an urban area (U) showed higher OCDD/F formation during the first 40 days. In the case of sewage sludge, after comparing the effect of adding PCP, we can generally state that wastewater with high levels of dioxin precursors is prone to causing elevated dioxin levels during sludge composting.
4.2. PCB Formation
In our work, neither clear formation nor degradation of PCBs was observed, but rather fluctuation. Lü et al. [22] highlighted that recalcitrant PCBs are difficult to degrade during composting, resulting in a low removal or even an increase, thus posing potential risks for land application. This might be partly related to the strong sorption of PCBs onto organic matter during sludge composting and to the mass reduction. For example, Gibson et al. [43] reported 11.7% of removal, whereas Lazzari et al. [15,41] observed an increase by 37% during the whole composting process. The bulking agents, composting methods and processes influence the differences in results. Note that the mass reduction effect was removed in our study. It has been demonstrated that, in soil, microbial degradation of PCBs occurs significantly only after 12 months [44].
Ng et al. [26], who also found that mean concentrations of PCBs fluctuated throughout the fermentation process (weeks 1–8) with no clear temporal trend of change, analyzed the congener profiles. They revealed that PCB-118, PCB-105 and PCB-156 were the main contributors to the observed increase in dioxin-like PCB content during weeks 0–4. They are also the main contributors in our work, from the beginning of the process until the end, especially PCB-118, one of the marker PCBs.
Regarding the influence of aeration conditions, since we did not observe PCDD/F formation under forced aeration in a previous work [24], presumably, there would also be no formation of PCBs.
4.3. Toxicity due to PCDD/Fs and PCBs
All samples showed toxicity values below the lowest limit values found for PCDD/Fs, 17 ng/kg with units of I-TEQ as proposed guideline value [45] and 20 ng TEQ/kg as regulation in some European countries [6]. The limit values for PCBs normally refer to different congeners from those studied in our paper, such as the value 0.2 mg/kg set in Denmark for the sum of seven congeners: PCB-28, 52, 101, 118, 138, 153 and 180 [6]. Therefore, we considered dioxin-like PCBs together with PCDD/Fs so that both contributed to the value to be compared with the TEQ limit.
Our results of toxicity due to PCDD/Fs and PCBs, 2.30–7.86 ng WHO-TEQ/kg in the final samples after 70 d, are in accordance with the literature. Ng et al. [26] found similarly low levels in matured livestock compost for sale. The mean concentrations (lower–upper bound) of total dioxins/furans, total dioxin-like PCBs and total PCBs were 2.01–2.05 ng I-TEQ/kg dry mass, 0.04–0.05 ng WHO-TEQ/kg dry mass and 1.55 μg/kg dry mass, respectively. On the other hand, a study carried out with 88 compost samples from 16 European countries (eight different types/categories) indicated good quality of the composts at the European level in general. Few of the samples exceeded the most conservative limits applied within different countries. PCDDs/Fs and dioxin-like PCBs were detected at generally small concentrations, ranging from 2.9 and 15.1 ng WHO-TEQ/kg for PCDD/Fs and 14–130 ng WHO-TEQ/kg for PCBs [46]. The current restrictions regarding PCBs and PCP in wood preservatives may contribute to the low levels in compost samples from some countries. Nevertheless, it would be desirable for persistent organic pollutants contained in sewage sludge to be degraded to produce a safer product. Therefore, the degradation pathway during sludge composting must be investigated.
5. Conclusions
A remarkable increase in PCDD/Fs, specifically OCDD, was noted for all samples with previously added PCP. One could conclude that this is simply due to the effect of a reduction in the amount of material during the composting process. However, the results refer to the initial sample mass, and this effect has been removed. The OCDD concentration increased during the first 40 days and continued during maturation.
No clear formation nor degradation of PCBs was observed. The differences are probably due to heterogeneity.
The TEQ values obtained are not worrying, and it can be said that compost from sewage sludge is an ecological product, but the operating conditions must be controlled even in the maturation stage since PCDD/F formation is possible.
Supplementary Materials
The following supporting information can be downloaded at: https://www.mdpi.com/article/10.3390/w16111545/s1, Table S1: Toxicity levels due to PCDD/Fs and dioxin-like PCBs in the initial samples and the 70 d composted ones.
Author Contributions
Conceptualization, M.F.G.-R. and R.F.; methodology, T.H. and M.A.G.; investigation, T.H. and M.A.G.; data curation, M.A.G.; writing—original draft preparation, M.F.G.-R.; writing—review and editing, R.F. and M.F.G.-R.; supervision, R.F.; funding acquisition, R.F. All authors have read and agreed to the published version of the manuscript.
Funding
This research was funded by the Generalitat Valenciana (Spain), grant number PROMETEOII/2014/007, and the Ministry of Economy, Industry and Competitiveness (Spain), grant number CTQ2016-76608.
Data Availability Statement
Data are contained within the article.
Conflicts of Interest
The authors declare no conflicts of interest.
References
- Eurostat Water Statistics. Sewage Sludge Production and Disposal. Available online: https://ec.europa.eu/eurostat/databrowser/view/env_ww_spd__custom_8221620/default/line?lang=en (accessed on 30 October 2023).
- European Commission Commision Staff Working Document Evaluation. Council Directive 86/278/EEC of 12 June 1986 on the Protection of the Environment, and in Particular of the Soil, When Sewage Sludge Is Used in Agriculture. Available online: https://eur-lex.europa.eu/legal-content/EN/TXT/PDF/?uri=CELEX:52023SC0157 (accessed on 30 October 2023).
- Huygens, D.; Garcia-Gutierrez, P.; Orveillon, G.; Schillaci, C.; Delre, A.; Orgiazzi, A.; Wojda, P.; Tonini, D.; Jones, A.; Pistocchi, A. Screening Risk Assessment of Organic Pollutants and Environmental Impacts from Sewage Sludge Management; Publications Office of the European Union: Luxembourg, 2022; ISBN 978-92-76-57322-7. [Google Scholar]
- Rigby, H.; Dowding, A.; Fernandes, A.; Humphries, D.; Petch, R.G.; Reynolds, C.K.; Rose, M.; Smith, S.R. Transfer of Polychlorinated, Polybrominated and Mixed-Halogenated Dioxins, Furans and Biphenyls, Polychlorinated Naphthalenes and Alkanes, Polycyclic Aromatic Hydrocarbons and Chlorobenzenes to the Milk of Dairy Cattle from Controlled Ingestion of Industrial and Municipal Bioresources Recycled to Agricultural Land. Sci. Total Environ. 2023, 886, 163546. [Google Scholar] [CrossRef] [PubMed]
- EUR-Lex Council Directive of 12 June 1986 on the Protection of the Environment, and in Particular of the Soil, When Sewage Sludge Is Used in Agriculture. Available online: https://eur-lex.europa.eu/legal-content/EN/TXT/PDF/?uri=CELEX:31986L0278 (accessed on 30 October 2023).
- Collivignarelli, M.C.; Abbà, A.; Frattarola, A.; Miino, M.C.; Padovani, S.; Katsoyiannis, I.; Torretta, V. Legislation for the Reuse of Biosolids on Agricultural Land in Europe: Overview. Sustainability 2019, 11, 6015. [Google Scholar] [CrossRef]
- EUR-Lex Directive EU/2018/851 of the European Parliament and of the Council of 30 May 2018 Amending Directive 2008/98/EC on Waste. Available online: https://eur-lex.europa.eu/legal-content/EN/TXT/PDF/?uri=CELEX:32018L0851 (accessed on 30 October 2023).
- EUR-Lex Communication from the Commission to the European Parliament, the Council, the European Economic and Social Committee and the Committee of the Regions a New Circular Economy Action Plan for a Cleaner and More Competitive Europe. Available online: https://eur-lex.europa.eu/legal-content/EN/TXT/HTML/?uri=CELEX:52020DC0098 (accessed on 30 October 2023).
- Domini, M.; Bertanza, G.; Vahidzadeh, R.; Pedrazzani, R. Sewage Sludge Quality and Management for Circular Economy Opportunities in Lombardy. Appl. Sci. 2022, 12, 10391. [Google Scholar] [CrossRef]
- Bueno Márquez, P.; Díaz Blanco, M.J.; Cabrera, F. Factores Que Afectan al Proceso de Compostaje. In Compostaje; Moreno Casco, J., Moral Herrero, R., Eds.; Mundi-Prensa: Madrid, Spain, 2008; pp. 93–109. ISBN 978-84-8476-346-8. [Google Scholar]
- Brändli, R.C.; Kupper, T.; Bucheli, T.D.; Zennegg, M.; Huber, S.; Ortelli, D.; Müller, J.; Schaffner, C.; Iozza, S.; Schmid, P.; et al. Organic Pollutants in Compost and Digestate: Part 2. Polychlorinated Dibenzo-p-Dioxins, and -Furans, Dioxin-like Polychlorinated Biphenyls, Brominated Flame Retardants, Perfluorinated Alkyl Substances, Pesticides, and Other Compounds. J. Environ. Monit. 2007, 9, 465–472. [Google Scholar] [CrossRef] [PubMed]
- Verlicchi, P.; Zambello, E. Pharmaceuticals and Personal Care Products in Untreated and Treated Sewage Sludge: Occurrence and Environmental Risk in the Case of Application on Soil—A Critical Review. Sci. Total Environ. 2015, 538, 750–767. [Google Scholar] [CrossRef] [PubMed]
- Zheng, G.; Wang, T.; Niu, M.; Chen, X.; Liu, C.; Wang, Y.; Chen, T. Biodegradation of Nonylphenol during Aerobic Composting of Sewage Sludge under Two Intermittent Aeration Treatments in a Full-Scale Plant. Environ. Pollut. 2018, 238, 783–791. [Google Scholar] [CrossRef] [PubMed]
- Hamann, R.; Weber, H.; Disse, G.; Haupt, H.J. “Determination of the PCDD/F Levels in Large-Scale Sewage Sludge Composting. Organohalogen Compd. 1997, 32, 400–402. [Google Scholar]
- Lazzari, L.; Sperni, L.; Salizzato, M.; Pavoni, B. Gas Chromatographic Determination of Organic Micropollutants in Samples of Sewage Sludge and Compost: Behaviour of PCB and PAH during Composting. Chemosphere 1999, 38, 1925–1935. [Google Scholar] [CrossRef]
- Stockholm Convention the 12 Initial POPs under the Stockholm Convention. Available online: https://chm.pops.int/TheConvention/ThePOPs/The12InitialPOPs/tabid/296/Default.aspx (accessed on 3 November 2023).
- UNEP Chemicals Standardized Toolkit for Identification and Quantification of Dioxin and Furan Releases. Available online: https://wedocs.unep.org/bitstream/handle/20.500.11822/32443/STIQDFR.pdf?sequence=1&isAllowed=y (accessed on 31 October 2023).
- Muñoz, M.; Gomez-Rico, M.F.; Font, R. PCDD/F Formation from Chlorophenols by Lignin and Manganese Peroxidases. Chemosphere 2014, 110, 129–135. [Google Scholar] [CrossRef] [PubMed]
- Malloy, T.A.; Goldfarb, T.D.; Surico, M.T.J. PCDDs, PCDFs, PCBs, Chlorophenols (CPs) and Chlorobenzenes (CBzs) in Samples from Various Types of Composting Facilities in the United States. Chemosphere 1993, 27, 325–334. [Google Scholar] [CrossRef]
- Weber, H.; Hamann, R.; Disse, G.; Haupt, H.J. Influence of Different Treatment Methods for Sewage Sludge on the Levels of Chlorinated Dibenzodioxins and Dibenzofurans. Organohalogen Compd. 1997, 32, 394–399. [Google Scholar]
- Öberg, L.G.; Wagman, N.; Andersson, R.; Rappe, C. De Novo Formation of PCDD/Fs in Compost and Sewage Sludge—A Status Report. Organohalogen Compd. 1993, 11, 297–302. [Google Scholar]
- Lü, H.; Chen, X.H.; Mo, C.H.; Huang, Y.H.; He, M.Y.; Li, Y.W.; Feng, N.X.; Katsoyiannis, A.; Cai, Q.Y. Occurrence and Dissipation Mechanism of Organic Pollutants during the Composting of Sewage Sludge: A Critical Review. Bioresour. Technol. 2021, 328, 124847. [Google Scholar] [CrossRef] [PubMed]
- Muñoz, M.; Gomez-Rico, M.F.; Font, R. Use of Thermogravimetry for Single Characterisation of Samples of the Composting Process from Sewage Sludge. J. Anal. Appl. Pyrolysis 2013, 103, 261–267. [Google Scholar] [CrossRef]
- Muñoz, M.; Garrido, M.A.; Gomez-Rico, M.F.; Font, R. PCDD/F Determination in Sewage Sludge Composting. Influence of Aeration and the Presence of PCP. Sci. Total Environ. 2018, 616–617, 763–773. [Google Scholar] [CrossRef] [PubMed]
- Harrad, S.J.; Malloy, T.A.; Khan, M.A.; Goldfarb, T.D. Levels and Sources of PCDDs, PCDFs, Chlorophenols (CPs) and Chlorobenzenes (CBzs) in Composts from a Municipal Yard Waste Composting Facility. Chemosphere 1991, 23, 181–191. [Google Scholar] [CrossRef]
- Ng, Q.Y.C.; Chan, A.H.M.; Ma, S.W.Y. A Study of Polychlorinated Dibenzo-p-Dioxins/Furans (PCDD/Fs) and Polychlorinated Biphenyls (PCBs) in the Livestock Waste Compost of Hong Kong, PR China. Mar. Pollut. Bull. 2008, 57, 381–391. [Google Scholar] [CrossRef] [PubMed]
- Muñoz, M.; Gomez-Rico, M.F.; Font, R. PCDD/F and Dioxin-like PCB Concentrations during Municipal Solid Waste Biomethanation and Subsequent Composting. Chemosphere 2014, 98, 73–77. [Google Scholar] [CrossRef] [PubMed]
- Huang, W.Y.; Ngo, H.H.; Lin, C.; Vu, C.T.; Kaewlaoyoong, A.; Boonsong, T.; Tran, H.T.; Bui, X.T.; Vo, T.D.H.; Chen, J.R. Aerobic Co-Composting Degradation of Highly PCDD/F-Contaminated Field Soil. A Study of Bacterial Community. Sci. Total Environ. 2019, 660, 595–602. [Google Scholar] [CrossRef]
- Tran, H.T.; Lin, C.; Hoang, H.G.; Nguyen, M.T.; Kaewlaoyoong, A.; Cheruiyot, N.K.; Bui, X.T.; Vu, C.T. Biodegradation of Dioxin-Contaminated Soil via Composting: Identification and Phylogenetic Relationship of Bacterial Communities. Environ. Technol. Innov. 2020, 19, 101023. [Google Scholar] [CrossRef]
- Chen, W.Y.; Wu, J.H.; Lin, S.C.; Chang, J.E. Bioremediation of Polychlorinated-p-Dioxins/Dibenzofurans Contaminated Soil Using Simulated Compost-Amended Landfill Reactors under Hypoxic Conditions. J. Hazard. Mater. 2016, 312, 159–168. [Google Scholar] [CrossRef] [PubMed]
- Narihiro, T.; Kaiya, S.; Futamata, H.; Hiraishi, A. Removal of Polychlorinated Dioxins by Semi-Aerobic Fed-Batch Composting with Biostimulation of “Dehalococcoides”. J. Biosci. Bioeng. 2010, 109, 249–256. [Google Scholar] [CrossRef] [PubMed]
- Cheng, C.Y.; Zhang, Z.F.; Kaewlaoyoong, A.; Huang, J.T.; Cheruiyot, N.K.; Lin, C.; Huang, H.C. Improved Bioremediation of PCDD/Fs Contaminated Soil by Mycelium-Free Liquids Induced by Agro-Industrial Residues. Bioresour. Technol. Rep. 2023, 22, 101435. [Google Scholar] [CrossRef]
- Kaewlaoyoong, A.; Cheng, C.Y.; Lin, C.; Chen, J.R.; Huang, W.Y.; Sriprom, P. White Rot Fungus Pleurotus Pulmonarius Enhanced Bioremediation of Highly PCDD/F-Contaminated Field Soil via Solid State Fermentation. Sci. Total Environ. 2020, 738, 139670. [Google Scholar] [CrossRef] [PubMed]
- Rhodes, C.J. Mycoremediation (Bioremediation with Fungi)—Growing Mushrooms to Clean the Earth. Chem. Speciat. Bioavailab. 2014, 26, 196–198. [Google Scholar] [CrossRef]
- EPSAR—Saneamiento de Aguas. Available online: https://www.epsar.gva.es/ (accessed on 17 May 2024).
- Mardones, C.; von Baer, D.; Hidalgo, A.; Contreras, A.; Sepúlveda, C. Determination of Pentachlorophenol and Tribromophenol in Sawdust by Ultrasound-Assisted Extraction and MEKC. J. Sep. Sci. 2008, 31, 1124–1129. [Google Scholar] [CrossRef]
- US EPA Method 1613. Tetra-through Octa-Chlorinated Dioxins and Furans by Isotope Dilution HRGC/HRMS. 1994. Available online: https://nepis.epa.gov/Exe/ZyPDF.cgi/20002GR6.PDF?Dockey=20002GR6.PDF (accessed on 23 May 2024).
- Van den Berg, M.; Birnbaum, L.S.; Denison, M.; De Vito, M.; Farland, W.; Feeley, M.; Fiedler, H.; Hakansson, H.; Hanberg, A.; Haws, L.; et al. The 2005 World Health Organization Reevaluation of Human and Mammalian Toxic Equivalency Factors for Dioxins and Dioxin-like Compounds. Toxicol. Sci. 2006, 93, 223–241. [Google Scholar] [CrossRef] [PubMed]
- Lim, S.S.; Park, H.J.; Hao, X.; Lee, S.I.; Jeon, B.J.; Kwak, J.H.; Choi, W.J. Nitrogen, Carbon, and Dry Matter Losses during Composting of Livestock Manure with Two Bulking Agents as Affected by Co-Amendments of Phosphogypsum and Zeolite. Ecol. Eng. 2017, 102, 280–290. [Google Scholar] [CrossRef]
- Rullan, R.; Montana, M.J.; Marti, R.; Broto, F.; Comellas, L.; Rodríguez-Larena, M.C.; Díaz-Ferrero, J. Comparison of OCDD/F Levels in Sewage Sludge before and after Composting and Thermal Drying Processes. Organohalogen Compd. 2003, 63, 98–101. [Google Scholar]
- Lazzari, L.; Sperni, L.; Bertin, P.; Pavoni, B. Correlation between Inorganic (Heavy Metals) and Organic (PCBs and PAHs) Micropollutant Concentrations during Sewage Sludge Composting Processes. Chemosphere 2000, 41, 427–435. [Google Scholar] [CrossRef]
- Grossi, G.; Lichtig, J.; KrauB, P. PCDD/F, PCB and PAH content of Brazilian compost. Chemosphere 1998, 37, 2153–2160. [Google Scholar] [CrossRef]
- Gibson, R.W.; Wang, M.J.; Padgett, E.; Lopez-Real, J.M.; Beck, A.J. Impact of Drying and Composting Procedures on the Concentrations of 4-Nonylphenols, Di-(2-Ethylhexyl)Phthalate and Polychlorinated Biphenyls in Anaerobically Digested Sewage Sludge. Chemosphere 2007, 68, 1352–1358. [Google Scholar] [CrossRef]
- Berthouex, P.M.; Gan, D.R. Loss of pcbs from municipal-sludge-treated farmland. J. Environ. Eng. 1991, 117, 5–24. [Google Scholar] [CrossRef]
- UNEP Chemicals Dioxin and Furan Inventories. National and Regional Emissions of PCDD/PCDF. Available online: https://wedocs.unep.org/bitstream/handle/20.500.11822/8241/-Dioxin%20and%20Furan%20Inventories_%20National%20and%20Regional%20Emissions%20of%20PCDD-PCDF-19991820.pdf (accessed on 10 November 2023).
- Beníšek, M.; Kukučka, P.; Mariani, G.; Suurkuusk, G.; Gawlik, B.M.; Locoro, G.; Giesy, J.P.; Bláha, L. Dioxins and Dioxin-like Compounds in Composts and Digestates from European Countries as Determined by the in Vitro Bioassay and Chemical Analysis. Chemosphere 2015, 122, 168–175. [Google Scholar] [CrossRef] [PubMed]


Disclaimer/Publisher’s Note: The statements, opinions and data contained in all publications are solely those of the individual author(s) and contributor(s) and not of MDPI and/or the editor(s). MDPI and/or the editor(s) disclaim responsibility for any injury to people or property resulting from any ideas, methods, instructions or products referred to in the content. |
© 2024 by the authors. Licensee MDPI, Basel, Switzerland. This article is an open access article distributed under the terms and conditions of the Creative Commons Attribution (CC BY) license (https://creativecommons.org/licenses/by/4.0/).