1. Introduction
1.1. Background
River-ice processes are complex and dynamic phenomena that affect the hydrology, hydraulics, ecology, and geomorphology of rivers in cold regions. One of the most extreme and hazardous river-ice processes is ice-jam formation, which occurs when ice accumulates and blocks the river channel, creating a backwater effect and increasing the water level upstream of the jam. Ice jams can form during freeze-up, mid-winter, or spring breakup, depending on the meteorological, hydrological, and ice conditions of the river. Here we will focus on spring-breakup ice-jam floods, which are particularly common and destructive, as they are associated with high flows, rapid ice breakup, and large ice volumes.
Spring-breakup ice-jam floods can cause significant social, economic, and environmental impacts along the affected river reaches. They can inundate low-lying areas, damage infrastructure and property, disrupt transportation and communication, endanger human and animal lives, and alter aquatic habitats and water quality. Therefore, it is important to develop effective strategies and tools to prevent, mitigate, and respond to these events. One of the key tools for ice-jam flood management is forecasting, which aims to provide timely and accurate information on the occurrence, location, magnitude, and duration of ice-jam floods, as well as guidance for decision-making and emergency actions [
1].
In this review, we aim to highlight the elements and processes required for the successful development of a spring-breakup ice-jam flood forecasting system, using the lower Churchill River in Labrador as a case study. This paper is organized as follows. First, we review the existing forecasting methodologies and systems for spring-breakup ice-jam floods and discuss their strengths and limitations. Then, we describe the lower Churchill River case study, where we present the background information and expound on the extreme May 2017 ice-jam flood event. Next is a description of the forecasting system that was developed for the lower Churchill River, with descriptions of subsequent extensions and improvements. This is followed by requirements for an ice-jam flood forecasting system. The paper closes with conclusions and recommendations for future research and development of spring-breakup ice-jam flood forecasting systems.
1.2. Ice-Jam Flood Forecasting Systems to Date (Adapted from Lindenschmidt [1])
A number of methods have emerged to forecast ice-jam flooding in an operational context. Earlier, more empirical approaches were reviewed by White [
2] in which correlations were made between hydrological and meteorological forcings and ice and hydraulic conditions leading to ice jamming and ice-jam flooding. Often, threshold values were induced to provide binary (yes/no) or tertiary (e.g., high/medium/low probability) outcomes of ice-jam flood level exceedances. One such example of forecasting ice-jam flood severity along the Churchill River in Labrador translated threshold values of runoff beginning 1 April [
3] into areas of increasing, higher, and severe risk in a “calendar date” versus “cumulative rainfall and snowmelt” graph, as shown in
Figure 1. The graph is segregated into forecast zones differentiated by colours, each representing the likelihood and frequency of ice jams: yellow zones have a low probability, where ice jams have not been recorded with those conditions; orange zones, in which ice jamming has occasionally but not often occurred; and red zones, where ice jams usually form due to factors such as larger freshet runoff volumes or thicker ice covers at the end of winter.
Empirical methods to forecast river-ice conditions were typically tailored to specific sites and may have been difficult to transfer to other reaches of the same river [
2,
4]. To address this limitation, statistical techniques were applied such as logistic regression, discriminant function analysis [
5], and multiple linear regression [
6]. These methods offered a means of establishing confidence intervals, enabling forecasts to be contextualized probabilistically and providing extra data on the likelihood of false negatives (when an ice jam occurs despite a forecast to the contrary) or false positives (when a predicted ice jam does not occur).
Empirical and statistical methods for forecasting river-ice conditions often lack the predictive power and forecasting success needed for full implementation in an operational context. Instead, they are typically used to provide a general understanding of potential river-ice outcomes [
3]. To enhance the accuracy of predictions, more sophisticated techniques have been developed. These include the k-nearest neighbour algorithm [
7], decision-tree models [
8], neural networks [
9,
10,
11], and fuzzy-logic models [
12,
13]. Comparable to the empirical and statistical approaches, these models link a set of inputs, such as hydrological, hydraulic, and meteorological variables, to a specific outcome such as breakup date and flood level, but process the information through a network of interconnected decision points (for example, does the flow exceed a certain threshold?) to provide potential forecasts about the state or condition of the river-ice regime and allowing the forecast to be placed in a probabilistic context. By running multiple models and weighting their combined results, better predictions can be obtained [
14,
15].
While these methods enable the tracking of ice-regime outcomes back to certain combinations of hydrologic–hydraulic and ice-input variables, they do not directly connect the causal effects of physical processes to the inputs. To establish such cause–effect relationships, deterministic models of ice processes are required. For instance, River2D [
16] and HEC-RAS [
17] have been used in a forecasting context to predict floodwater levels during ice-jam events. Predictions of breakup dates across the entire stream network of the Athabasca River basin [
18,
19] have also been carried out using the stream temperature model RCM [
20] embedded in the physically-based, semi-distributed hydrological model MESH [
21]. In addition, to complement the deterministic river-ice hydraulic model, other components are necessary for an ice-jam flood forecasting system, including runoff flow forecasts from a hydrological model and observations of ice-cover conditions and extent from monitoring activities [
22,
23].
1.3. Stochastic Modelling Ice-Jam Flood Forecasting
Another method to forecast ice-jam flooding, which has gained much traction in the literature in recent years, is the stochastic modelling approach. Here, a deterministic model is placed within a Monte-Carlo framework in which many hundreds or thousands of simulations can be run. Each simulation has its own unique boundary condition and parameter values selected randomly from frequency distributions of those values. The simulations yield an ensemble of floodwater level profiles, the percentiles of which place the levels within a probabilistic context. The deterministic model within the framework maintains the numerous descriptions of physical processes related to the formation of ice jams and backwater staging. The Monte-Carlo analysis allows the likelihood of various possible outcomes and exceedance thresholds to be calculated.
Figure 2 illustrates a conceptualisation of the setup of the Monte-Carlo framework, in which the deterministic river-ice hydraulic model is executed many hundreds of times, with each simulation having a different set of boundary condition and parameter value settings. These values are randomly selected from frequency distributions of the parameters and boundary conditions (referring also to
Figure 3).
Referring to the top left of
Figure 2, the distribution of the upstream flow boundary condition
Q is based on annual flows that occur during the maximum ice-jam staging or at the end of breakup (recorded by the last b-flag accompanying the flow data). The extreme-value Gumbel distribution is often used for the volume of incoming ice
Vice upstream boundary condition, which requires calibration by adjusting the location and scale parameters of the distribution until the simulated AEP water-level elevations extracted from the ensemble backwater levels match the AEP levels determined from the water-level elevations recorded at the gauge. If the model domain exits into a lake, the distribution for the downstream boundary condition, water-level elevation
W, is determined from annual lake levels that occurred during the ice event. If the downstream end of the model domain is a river reach, an ice-induced rating curve is applied, from which water-level elevations can be extracted for a given upstream flow. The ice-jam toe locations
x are generally selected from a uniform distribution between two chainage points downstream of the ice jamming.
The parameters controlling the river-ice processes are then randomly chosen, generally from uniform distributions, within ranges that were established from the model calibration of single ice-jamming events. The incoming volume of ice consists of ice pans that have a thickness
ST and porosity
PS. The ice accumulates at the upstream end of the ice jam, the ice-jam front, which has thickness
FT and porosity
PC. The resistance to flow is affected by the roughness of the bed
nb and the roughness coefficient of the ice underside
n8. While bed roughness remains constant, the ice roughness increases with the thickness of the ice jam.
K1 represents the ratio of longitudinal forces that are shed laterally to the banks, generating frictional forces between the ice jam and the riverbanks.
K2 signifies the degree of thickening required for the internal resistance to surpass the shoving within and thickening of the ice jam. The thickness of the initial, unbroken ice cover downstream of the ice-jam toe is represented by the parameter
h and extends to the downstream boundary. If the average flow velocity at a cross-section surpasses a threshold velocity
ve, ice erodes from the underside of the ice cover until the flow velocity at that cross-section drops below the threshold value. This ice is transported downstream until it reaches an area where the average flow velocity falls below another threshold velocity
vd, at which point the in-transit ice is deposited on the underside of the ice cover. More detailed descriptions can be obtained in Lindenschmidt [
1,
24].
Once the Monte-Carlo framework is set up and calibrated, the framework can be used for ice-jam flood forecasting. Referring to the conceptualisation in
Figure 4, hundreds of simulations are again carried out with the model, again with boundary condition and parameter values chosen randomly from the frequency distributions of each value; however, only this time the distributions are constrained due to the ranges predicted for the flows (minimum and maximum values of flow calculated from a hydrological model), volume of incoming ice (upper portion of the distribution constrained due to reducing length of ice cover upstream of the ice-jam location) and downstream water-level elevation (lower portion of distribution constrained due to rising water levels during the progression of the ice-cover breakup and potential flooding event).
This stochastic modelling approach has been applied to many rivers in Canada, including the Athabasca River in Alberta [
19,
22], the Red River in Manitoba [
25,
26], the Churchill River in Labrador [
27,
28], the Exploits River in Newfoundland [
29] and the Saint John River in New Brunswick [
30].
2. Site Description
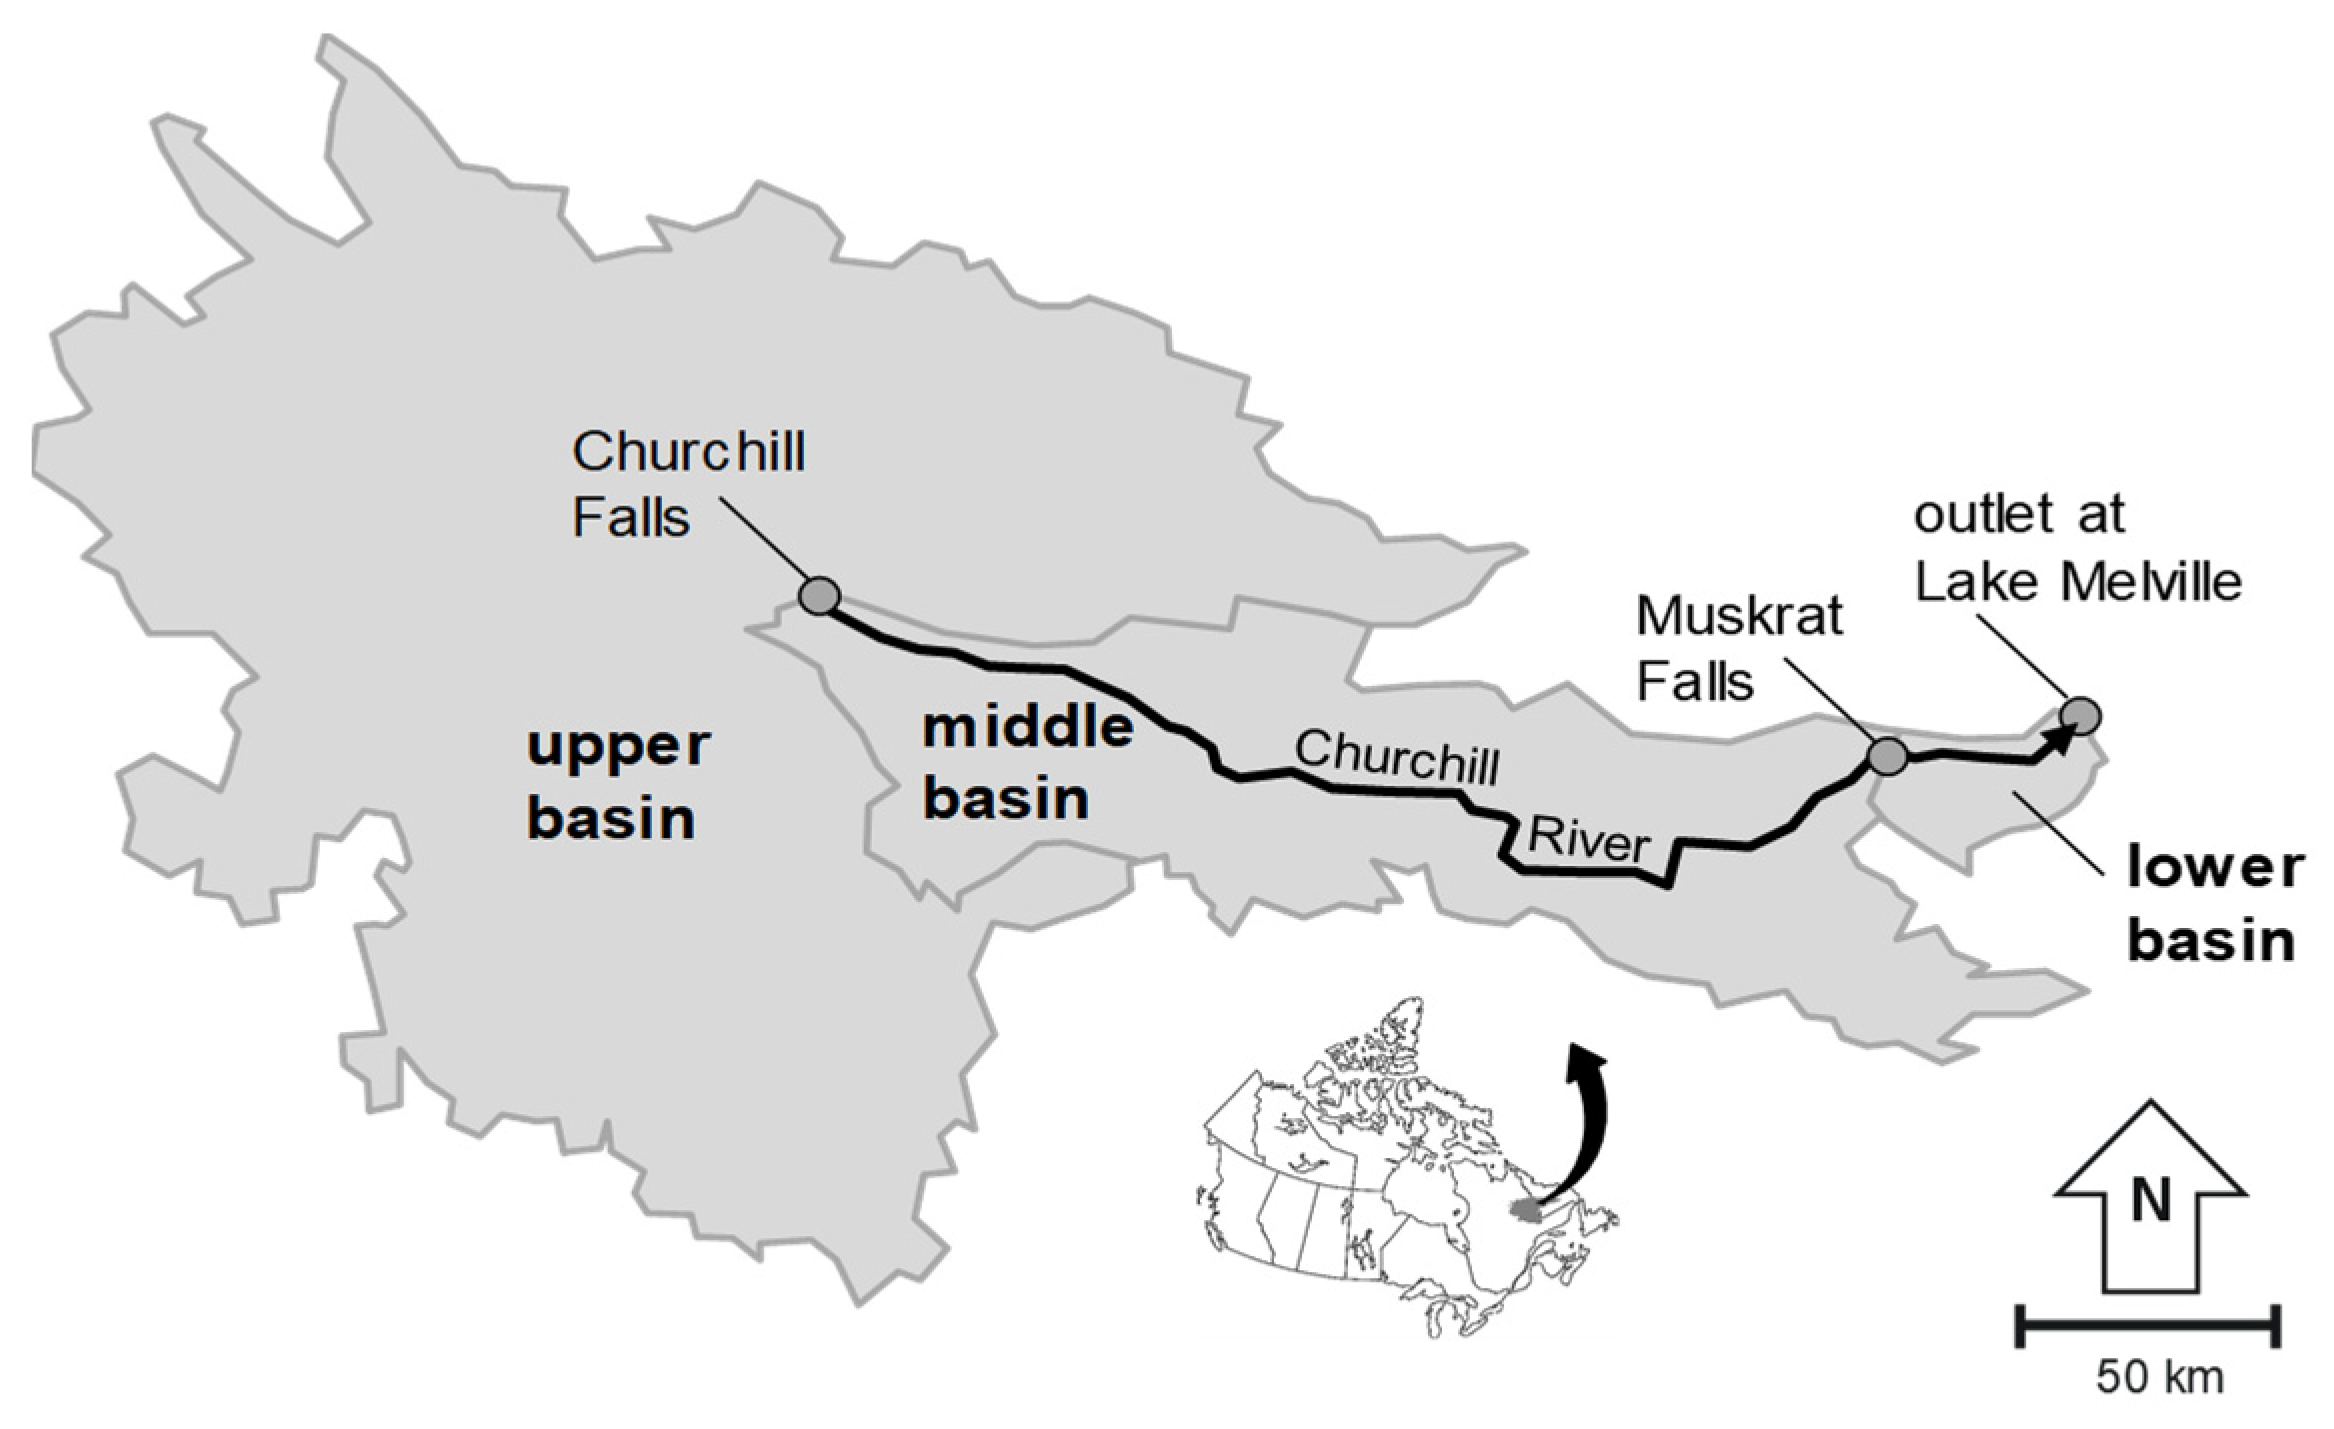
An operational ice-jam flood forecasting system has been implemented for the Churchill River in Labrador. Referring to
Figure 5, the Churchill River is a large and complex river system that drains an area of approximately 94,000 km
2 and flows into Lake Melville, a brackish water body that connects to the Atlantic Ocean [
31]. The basin’s landcover consists of approximately 52% forest, 26% water and wetlands, and 21% mixed barren areas with rock outcrops, while the remaining 1% is residential, commercial, or deforested areas [
28]. Close to the river’s mouth, the coldest month of the year is January with an average air temperature of −17.0 °C, and the warmest month is July with average air temperatures of 15.8 °C (30-year averages for 1991–2020; data for Goose Bay from
https://climate.weather.gc.ca/ (accessed on 23 May 2024)). The average yearly precipitation is 937.8 mm with 43% falling as snow from November to May. The river is regulated via two major hydroelectric facilities: the Churchill Falls Generating Station and the Muskrat Falls Generating Station, which have a combined capacity of 6300 MW. The outlets of the two facilities delineate the basin into the upper, middle, and lower subbasins. The Churchill River is also prone to ice-jam floods with a high flood risk along its lower reach, where the community of Mud Lake is located (see
Figure 6). In May 2017, a large ice-jam flood occurred at this location, requiring the evacuation of the community and causing significant damage to infrastructure and property [
31].
In May 2017, ice jamming along the lower Churchill River led to serious and life-threatening flooding that caused significant damage to homes, businesses, and infrastructure particularly in Mud Lake and along Mud Lake Road. The evacuation of residents was also required during the flood peak [
31]. The flood occurred due to a combination of factors, including unusually warm temperatures, rapid snowmelt, and high flows. In late April and early May 2017, the region experienced unseasonably warm temperatures, causing the snow to melt rapidly. Just prior to the event, the air temperatures ranged from a maximum of 19.8 °C on 15 May 2017 to a minimum of 0.6 °C on 16 May 2017 (data from
https://climate.weather.gc.ca/ (accessed on 23 May 2024)). This led to higher-than-average water levels in the rivers, which were already high due to the rapid melting of the snow. The combination of high-water levels and strong currents caused a large ice jam to form on the Churchill River downstream in the reach adjacent to the Mud Lake community. The sudden nature of the flooding that occurred during the night caught many residents off guard, as they were not prepared for the rapid flooding that occurred. This prompted the development of a flood forecasting system with capabilities of predicting ice-jam flood severity.
3. Churchill River Flood Forecasting System
In response to the 2017 ice-jam flood event, the Churchill River Ice-Jam Flood Forecasting System (CRFFS) was developed which came into operation in 2019. The CRFFS is an automated flood forecasting system that runs year-round (ice conditions during late autumn freezing, mid-winter, and spring breakup and open-water conditions during late spring, summer, and early fall) and provides forecast flows and water levels at key locations along the lower Churchill River between Muskrat Falls and Lake Melville. It uses data collected with sensors and gauging stations along the river to predict ice-jam formation and flooding based on current river conditions. Calibration was carried out in a study by Lindenschmidt [
32] to test the feasibility of modelling ice jams along the Churchill River prior to the launching of a project to develop an ice-jam flood forecasting system.
Ice-affected water-level forecasts are carried out using the RIVICE model. Discharges for the next three days at Muskrat Falls, simulated from the HEC-HMS hydrological model, serve as input for a range of discharges in the RIVICE model. Ice thicknesses surveyed in the field and ice coverage extent extracted from satellite imagery allow the estimation of the volume of ice that could form an ice jam along the river stretch. The RIVICE model is executed 50 times with different boundary condition and parameter settings selected randomly from frequency distributions, which provides an ensemble of 50 backwater level profiles. Percentile plots from the ensemble are used to calculate exceedance probabilities along the riverbanks within a probabilistic context.
The dashboard module of the CRFFS is shown in
Figure 7. The CRFFS provides real-time information on water levels, flows, temperature, ice thicknesses, total accumulated precipitation over the past 48 h, air temperature forecasted 48 h in the future, and ice coverage along the lower river reach. The top row shows current water levels (stages), flows, and temperature at the time of the forecast. The middle row indicates the “Forecast Data” with predictions of water levels and flows over the course of the next three days. The bottom row provides a suite of “Watershed Environmental Maps” with total accumulated precipitation over the past 48 h, air temperature forecasted 48 h in the future, and ice coverage along the lower river reach. Ice maps indicating the type and extent of the ice covers are derived from satellite imagery (an example of a raw image is provided in
Figure 8). Ice thicknesses are measured at four locations using SIMBA acoustic transducers [
1,
33], which continuously log ice thicknesses. Both the ice-cover extent and ice-thickness measurements provide an estimation of the maximum volume of ice that can accumulate in ice jams. The volume of ice is an important input to the RIVICE ice-jam simulations.
“Ice-affected forecasts were carried out with RIVICE daily. Discharges for the next three day at Muskrat Falls, simulated from the HEC-HMS hydrological model, served as input for a range of discharges in the RIVICE model. Ice thicknesses were extracted from field surveys and instrumentation and, along with ice-cover extent extracted from satellite imagery, provided estimates of the volume of ice that could form an ice jam along the lower river stretch. RIVICE was then executed 50 times with different boundary conditions and parameters settings, selected randomly from frequency distributions. This provided an ensemble of 50 backwater level profiles, from which exceedance probabilities along the riverbanks could be placed within a probabilistic context” [
27].
Figure 9 shows forecasted model results for the following three days. The top right window panel labelled “Flow Forecast” displays the forecasted flows for the lower Churchill River acquired from the HEC-HMS hydrological model. Different gauge locations can be selected from the dropdown “Select” button at the far left. For example, the results can be displayed for gauge 03OE017 at “Mud Lake Community”. The window panel “Station Forecast Ice Affected Water Levels” indicates the 10th, 50th, and 90th percentiles of the backwater level elevations summarized from the RIVICE ice-jam model ensembles. Juxtaposed for comparison are the observed water levels at the selected gauge, the elevations of the right and left bank at that river station, along the lowest levee crest elevation in the immediate vicinity of the river station. Longitudinal profiles of the percentile water levels are superimposed onto the profiles of the left and right bank levee crest elevations in the bottom window panel, providing a quick overview of potential overbank flow and hinterland flood sites.
Other modules in the CRFFS are notification, diagnostics, and configuration. The configuration module sends alerts to stakeholders when water levels reach predefined thresholds or when there is a significant change in water-level trends. These notifications can be sent via email, text message, or phone call. The diagnostics module provides real-time analysis of the data collected from the system and identifies potential issues that may affect the accuracy of the forecasts. This includes checking for missing or erroneous data, identifying outliers, and detecting sudden changes in water-level trends. The configuration module allows users to customize the settings of the flood forecasting system based on their specific needs and requirements. This includes setting thresholds for alerts, selecting which gauges to include in the analysis, and configuring the simulation models used by the system.
The CRFFS is an online system that provides automated simulations, data input feeds, and output streams to provide water-level forecasts. An extensive network of water-level, flow, and water-temperature gauges along the lower reach of the Churchill River provides calibration and verification data for the forecasting system. The data are also used to trigger transitions between different simulation modes (referring to
Figure 10): [i] from open-water to freeze-up, [ii] from freeze-up to winter ice, [iii] from winter ice to spring breakup, and [iv] from spring breakup back to the open-water state. RIVICE is the river hydraulic model used to simulate ice-cover extent and ice-jam formation for the freeze-up, winter ice, and spring-breakup models of the forecasting sequence, whereas HEC-RAS is used for open-water conditions [
28].
4. Subsequent Developments and Extensions of the CRFFS
The CRFFS described above is the initial development and rollout of the system. Subsequent developments and extensions of the system help refine the forecasts by adjusting RIVICE boundary conditions (specifically ice-jam toe location ranges) and providing additional information pertaining to ice-jam flood hazard and risk.
Producing larger ensembles with more simulated backwater level profiles can improve the accuracy of ice-jam floodwater level forecasts by reducing the uncertainty associated with individual simulations. By combining multiple simulations, the ensemble can provide a more accurate representation of the range of possible outcomes and reduce the impact of any errors or biases in individual simulations. An extension to the CRFFS has been tested to allow for multiple simulations to be run simultaneously using parallel processing techniques such as distributed computing [
34]. This would enable the CRFFS to generate more ensemble runs within a shorter duration of time, potentially allowing for daily forecasts to be made with greater accuracy and timeliness. Additionally, incorporating more simulations in the ensembles allows for greater flexibility in incorporating new information or adjusting parameters as needed to improve forecast accuracy over time.
Currently, the location of the ice-jam toe can vary within a 5 km stretch along the furthest downstream stretch of the Churchill River, where the ice-jam flood hazard is specifically focused on Mud Lake and the end of Mud Lake Road. Lindenschmidt et al. [
34] have shown the forecasting is working well; however, depending on the location of the ice jam, allowing this 5 km range to be moved further upstream could increase the accuracy of ice-jam flood hazard assessment at the Happy Valley gauge. Flexibility in the location of the range window could improve the accuracy of floodwater level forecasts [
34].
New modules have now been included in the CRFFS, e.g., an inundation module, which provides forecasts on the inundation extent, depths, and probabilities of an upcoming ice-jam flood event [
35], as shown in
Figure 11. The inundation extent refers to the area of land that may be covered by water during the flooding. The inundation depth refers to the maximum height of water above the ground level at any given point during a flood event. The probability component is used to estimate the likelihood that a particular inundation extent or depth will occur during the event and is estimated from the ensemble forecasts.
Another module added to the CRFFS is the flood exposure hazard module [
35], shown in
Figure 12. Flood exposure hazard refers to the potential damage or harm that could be caused by a flood event to people, infrastructure, and the environment. This can include factors such as property damage, loss of life, disruption of transportation networks, and contamination of water sources. To determine the flood exposure hazard, information on the inundation extent, depth, and probability component is used in conjunction with data on the value and location of community assets such as property developments, infrastructure, and natural resources. This information can be analysed using statistical models or other methods to estimate the potential impact of a flood event on these assets. This component has become an important part of flood risk assessment, as it helps communities understand the potential consequences of different flood scenarios and make informed decisions about how to mitigate and prepare for future events.
5. Requirements for a Spring-Breakup Ice-Jam Flood Forecasting System
Ice-jam flood forecasting systems have special requirements for their successful application and operation. Some of these features are expounded below with information drawn from KGS [
28], Lindenschmidt [
31], and Lindenschmidt et al. [
22,
23].
5.1. Hydro-Technical Requirements
An important requirement for ice-jam flood forecasting is real-time monitoring of river conditions, to detect changes in river and ice behaviour that point to an impending ice jam. This becomes more critical in ice-flood forecasting, as compared to open-water flood forecasting, since ice jams can develop and release within hours and the floods that ensue can be quite sudden and severe. Monitoring tools may include gauging stations and remote sensing technologies such as satellite imagery or web cameras with remote internet access. Gauging stations are typically located at key points along a river where water levels and flows can be measured continuously and with a fine temporal resolution, preferably recording values at 5 min intervals. Space-borne remote-sensing technologies can provide detailed information about ice types (smooth or rough ice covers), extent of ice covers, and open-water sections. Airborne remote sensing has the advantage of viewing the ice covers from a closer distance but requires more time to observe long stretches of river corridors.
Predictive modelling tools can help forecast the extent and severity of an ice-jam flood based on a range of inputs such as flows, water levels, and incoming ice volumes (from a river hydraulics perspective), as well as changes in weather patterns (from a river-basin hydrological perspective). Predictive models can also consider other factors that may influence the timing and extent of an ice jam, such as upstream reservoir levels. A hydrological model is essential to accurately simulate runoff and stream discharge under various scenarios of weather changes, dam operations, and flood mitigation measures (e.g., flow diversions). This should be coupled to a hydraulic model that can simulate water and ice dynamics in the river. The performance and reliability of the models can be enhanced if complemented with uncertainty and sensitivity analyses of the model parameters and inputs. This helps to improve the understanding and representation of the physical processes and mechanisms of the river’s ice-jam formation and flood propagation. Room should be allowed to measure the performance and reliability of the forecasts. One example is the use of metrics such as “skill” which measure the accuracy of the forecast after the flood event has occurred [
26].
The ice-jam flood forecasting system should consist of a robust and flexible framework that can integrate data, models, and interface components, as well as relevant knowledge and expertise from different disciplines and institutions. Such a framework is necessary in evaluating and comparing the effectiveness and efficiency of different ice-jam flood mitigation measures and strategies, such as structural, non-structural, operational, and adaptive options. Means should be provided to evaluate the uncertainties and sensitivities of the model parameters and inputs, not just within each model on its own, but also uncertainties and sensitivities that can potentially compound when data are transferred from one model to another. The modelling framework should be flexible enough to allow incorporation of the latest developments and innovations in hydrodynamic and ice modelling. The framework should also allow for the development and implementation of advanced methods and techniques for data acquisition, processing, analysis, and assimilation, such as remote sensing, machine learning, data mining, and data fusion. Generative artificial intelligence could also help in the modelling framework of an ice-jam flood forecasting system by providing synthetic data for training and testing of the models, enhancing the resolution of the input data, and generating realistic scenarios for simulation and analysis.
The availability of a user-friendly and interactive interface that can provide real-time information and visualisation of the current and forecasted ice jam and flood situations, as well as the potential impacts and risks for the stakeholders and decision makers, would also be beneficial [
36].
5.2. Socio–Hydrological Requirements
An important requirement for ice-jam flood forecasting is having effective communication systems in place. Rapid communication between different stakeholders is critical for coordinating efforts to mitigate the impacts of an ice jam. This can be facilitated through the establishment of local river watch committees (as was the case for the CRFFS). This may also involve sharing real-time data through secure networks or other forms of communication, such as alerts sent via text message or email. It is also important to ensure that local communities are informed about potential risks and how they can take action to protect themselves and their property. Communication systems should be designed to be accessible and user-friendly for all stakeholders involved in managing ice jams.
Decision-support tools can help users make informed decisions about how to manage the risks associated with an ice jam, such as whether to release water from upstream reservoirs or implement other mitigation measures. These tools may provide real-time data on river conditions, along with guidance on best practices for managing ice jams and minimizing their impacts on communities and ecosystems. Decision-support tools should be designed to be flexible and adaptable to changing circumstances, allowing users to make informed decisions based on the latest information available.
To effectively use an ice-jam flood forecasting system, stakeholders will need to be trained on how to interpret the data being collected and make informed decisions based on this information. This could include the provision of training sessions or online resources that train users regarding various features and functions of the system, as well as offering ongoing support and guidance to help ensure that everyone is using the system effectively. User training is essential for ensuring that stakeholders can use the system in a way that maximizes its potential benefits and minimizes any risks associated with its use.
An effective ice-jam flood forecasting system should provide collaboration tools that allow stakeholders to work together more efficiently and share information in real time. This could include features such as chat or video conferencing, document sharing, or task management tools that help keep everyone informed on current flood developments and working towards common goals. Collaboration tools are essential for ensuring that all relevant parties can access and use the data being collected in a way that maximizes their potential benefits and minimizes any risks associated with their use.
A participatory and collaborative approach that can involve the key actors and beneficiaries of the system in its design, development, testing, validation, and operation is most imperative in providing the best interface between developers and end-users. Assessing and communicating the social, economic, and environmental impacts and risks of ice-jam and flood events, as well as the benefits and costs of the forecasting system, using multi-criteria and multi-stakeholder analysis, is vital for the successful implementation and operation of an ice-jam flood forecasting system.
Setting up a community-based monitoring program that uses both traditional/local knowledge and western science to observe and track the changes in the river environment is crucial for updating and refining the ice-jam flood forecasting system (e.g., changing sediment depositional areas and sandbar extents along the lower Churchill River). This program should involve all stakeholders, such as community residents, reservoir operators and government agencies. It should also use a two-eyed seeing approach (
http://www.integrativescience.ca/Principles/TwoEyedSeeing/ (accessed 23 May 2024) that combines both traditional knowledge and western science to understand ice-cover conditions and ice-jam flood processes. This is similar to what other communities in Canada have done, such as along the Slave River in the Northwest Territories [
37]. Partnerships should be established among the stakeholders of the community-based monitoring project to create a unit that can administer the monitoring program. An example of such a partnership is the Slave River and Delta Partnership (
https://www.nwtwaterstewardship.ca/en/slave-river-and-delta-partnership; accessed 23 May 2024) in the Northwest Territories.
5.3. Data Requirements
A thorough analysis of historical data can help with identifying patterns and trends that may be useful for predicting future ice jams. This could include analysing historical data on river flows during ice-cover breakup and ice-jamming events, frequency distributions of ice-jam peak backwater levels, and ice-jam cover extents. Historical data analysis can also help identify areas of a river where ice jams are more likely to occur based on patterns in ice-jam lodgement locations.
Integrating data from multiple sources can provide a more comprehensive view of river conditions and improve the accuracy of predictions about potential ice jams. For example, combining real-time monitoring data with historical records or weather forecasts can identify patterns and trends that may be difficult to detect using any single source of information. Multi-source data integration can also help ensure that all relevant factors are being considered when making decisions about ice-jam flood risk management.
It is important for ice-jam flood forecasting systems to be able to handle and store large volumes of data. This could include developing algorithms that are optimised for high-performance computing or using cloud-based infrastructure to store and process large amounts of data in real time. It is imperative that the systems are always up to date with the latest information, which is critical for making informed decisions about ice-jam flood hazard and risk management.
Due to the amount of sensitive information being collected and analysed, it is important for ice-jam flood forecasting systems to have reliable data security measures in place. This could include encryption of data, access controls that limit who can view or modify the data, and regular backups to ensure that data are not lost in case of a system failure. Data security measures are essential for protecting sensitive information from unauthorised access or theft, which is critical for maintaining public trust and ensuring the effectiveness of ice-jam flood forecasting systems.
5.4. Ice-Flood Management Plan
An important accompaniment to any ice-jam flood forecasting system is an ice-flood management plan which incorporates ice-jam flood forecasting capabilities, ice-flood preparedness, ice-flood risk assessment, emergency response, and reservoir dam operations. A manual for ice-flood management should be created, outlining flood protection measures, operational guidelines, and coordination of emergency responses at different river-flood stages. The manual should cover various aspects of flood preparedness and response, including the operation and isolation of land drainage sewer systems, the operation of flood infrastructure (such as gates, flood pump stations and storm retention basins), the raising or closing of primary dikes, the deployment of temporary sandbag dikes, the isolation of natural drainage channels to prevent overland flooding from internal drainage and river backup, and the identification of critical facilities.
The manual should require flood forecasting, including long-term flood outlooks and daily forecasts. It should use a built-in hydraulic profile calculator to convert forecasted flows into flood levels. The manual should define all flood activities based on trigger and activation levels and include an activity tracking module to keep track of daily actions. To aid in visualising the flood systems, the manual should incorporate a fully integrated geographic information system module for mapping all systems and activities.
A key aspect of the plan is the consideration of ice-flood risk, which is a combination of flood hazard and vulnerability. The hazard is determined by the likelihood of occurrence (return period) and the severity of an ice-jam flood (depth and extent of floodwater). While this is relatively straightforward for open water conditions, establishing ice-affected stage frequency curves requires significant effort. Various methodologies for this are provided in works by Beltaos [
38], Lindenschmidt et al. [
39,
40], Lindenschmidt [
1], and White [
41]. Vulnerability is assessed using land-use data and damage costs as functions of flood-water depth and extent. This allows for the evaluation of the vulnerability of certain land-use types (e.g., residences) that would be exposed to a flood and their susceptibility to damage from flooding. The flood risk, which represents the long-term expected damages due to flooding, is calculated by combining both hazard and vulnerability. This flood risk assessment forms the foundation for conducting cost–benefit analyses of mitigation options, such as constructing a flood-water diversion channel, building ring dikes, or raising roads and houses prone to flooding.
The plan should also factor in emergency response. A proactive alert system should be implemented to notify residents about potential ice jamming and flooding, using methods such as text messages, sirens, or radio broadcasts. For instance, the Alberta Rivers mobile app, which is available at no cost, offers hydraulic information for rivers and issues flood warnings and advisories. Evacuation strategies and plans should be developed for various flood scenarios, and these plans should include relief measures for those impacted by flood events.
The plan should also incorporate strategies for managing ice. Existing schemes for managing ice are already operational for other rivers in Canada, such as the Red River [
42,
43], the Peace River (managed by a task force of multiple stakeholders) [
44], and the Athabasca and Clearwater rivers at Fort McMurray, which specifically monitor the breakup of ice covers. The ice management scheme could include several components:
Ice-cover tracking—monitor the characteristics and behaviour of the ice cover throughout the winter season, from the start of freeze-up to the end of breakup, and include assessment of the hazards and risks of ice-jam flooding;
Ice-thickness monitoring—intensify the monitoring of ice thickness using technologies such as ground-penetrating radar to identify variations in the thickness of the ice cover along the river; areas with thicker ice may indicate locations more susceptible to jamming;
Pre-cutting and pre-breaking of ice covers—weaken the ice at ice-jam prone areas by pre-cutting and/or pre-breaking the ice cover to create a corridor for the continued flow of ice runs and potentially reduce the risk of ice-jam flooding;
Annual bathymetric surveying—conduct systematic surveys of the river bottom to identify areas of sediment erosion and accretion (areas of accretion could potentially constrict ice flow); these surveys can provide insights into whether dredging would be feasible to reduce ice-jam flood hazards, identify locations where dredging should be carried out, and estimate the amount of sediment to be removed.
5.5. Hydropower Facility Considerations
The operational guidelines of hydropower facilities should be broadened to encompass measures for reducing flooding. These facilities should operate under a unified plan to ensure optimal water management and flood mitigation. The live storage capacity of a reservoir should be increased to buffer peak inflow discharges, thereby minimizing downstream flood impacts. Outflows should be adjusted, especially during river freeze-up and ice-cover breakup periods, to mitigate the risk of ice jam flooding.


