Abstract
In accordance with the programme of closure works and the implementation of ecological spatial rehabilitation in the area of the Slovenian coal mine Trbovlje–Hrastnik (RTH), there is a great opportunity to exploit shallow geothermal energy from water and ground sources. In the RTH area, there is great energy potential in the utilisation of underground water and heat from the earth. In our research, we have focussed on the use of geothermal energy with heat pumps from groundwater (water/water system) and from ground collectors and wells up to a depth of 150 m (rock/water system). With the water/water system, we have an average of 2.7 MW of thermal energy available, with the rock/water system having 7.5 kW of thermal energy from a 150 m deep well. With the rock/water system in particular, the development of an industrial zone in the RTH area can also provide for a greater demand for thermal energy. The thermal energy obtained in this way is utilised via heat pumps to heat and cool commercial, residential and industrial buildings. The utilisation of shallow geothermal energy can make a major contribution to carbon neutrality, as the use of geothermal energy has no negative impact on the environment and causes no greenhouse gas emissions. The aim of the paper is to provide an overview of the methods used to analyse heat storage in aquifers of abandoned coal mines, to represent these storages in RTH with a basic mathematical–statistical inventory of what is happening in the aquifer, and to investigate the possibility of using shallow geothermal energy with the help of modelling the use of shallow geothermal energy. The results and analyses obtained can make an important scientific contribution to the use of geothermal energy from abandoned and closed mines.
1. Introduction
Geothermal energy is renewable energy such as sunlight, wind, waves, rivers, tides and biomass, among others. The use of fossil fuels for heating buildings is ecologically problematic and must be replaced by the use of renewable energy sources. The main advantage of using renewable energy sources is that we do not emit any CO2 into the environment and therefore do not place any additional burden on the climate [1,2,3]. By utilizing the underground water of a coal mine in the RTH area to generate thermal energy, we replace around 2.1 × 10⁶ units of natural gas when generating 2.7 MW of thermal energy. We therefore provide 22,680 MWht/year of thermal energy. Near-surface (shallow) geothermal energy can be utilised indirectly with the help of geothermal heat pumps or directly without the use of heat pumps. This makes it possible to utilise the heat for heating systems with high temperatures (up to 70 °C) or for cooling systems with a temperature of less than 12 °C. The utilisation of near-surface geothermal energy is combined with building structures that serve as heat exchangers, i.e., energy geostructures that are installed in piles, foundation slabs and in the linings of tunnels or underground mine spaces. The carrier of geothermal energy from the depths of the earth to the earth’s surface is usually thermal water, which [4]:
- flows from underground deposits to the earth’s surface via natural faults “natural thermal springs”;
- flows from underground deposits to the earth’s surface through the artificially created connection openings of the geothermal well;
- flows to the earth’s surface through an artificially created circuit of hot, dry rock.
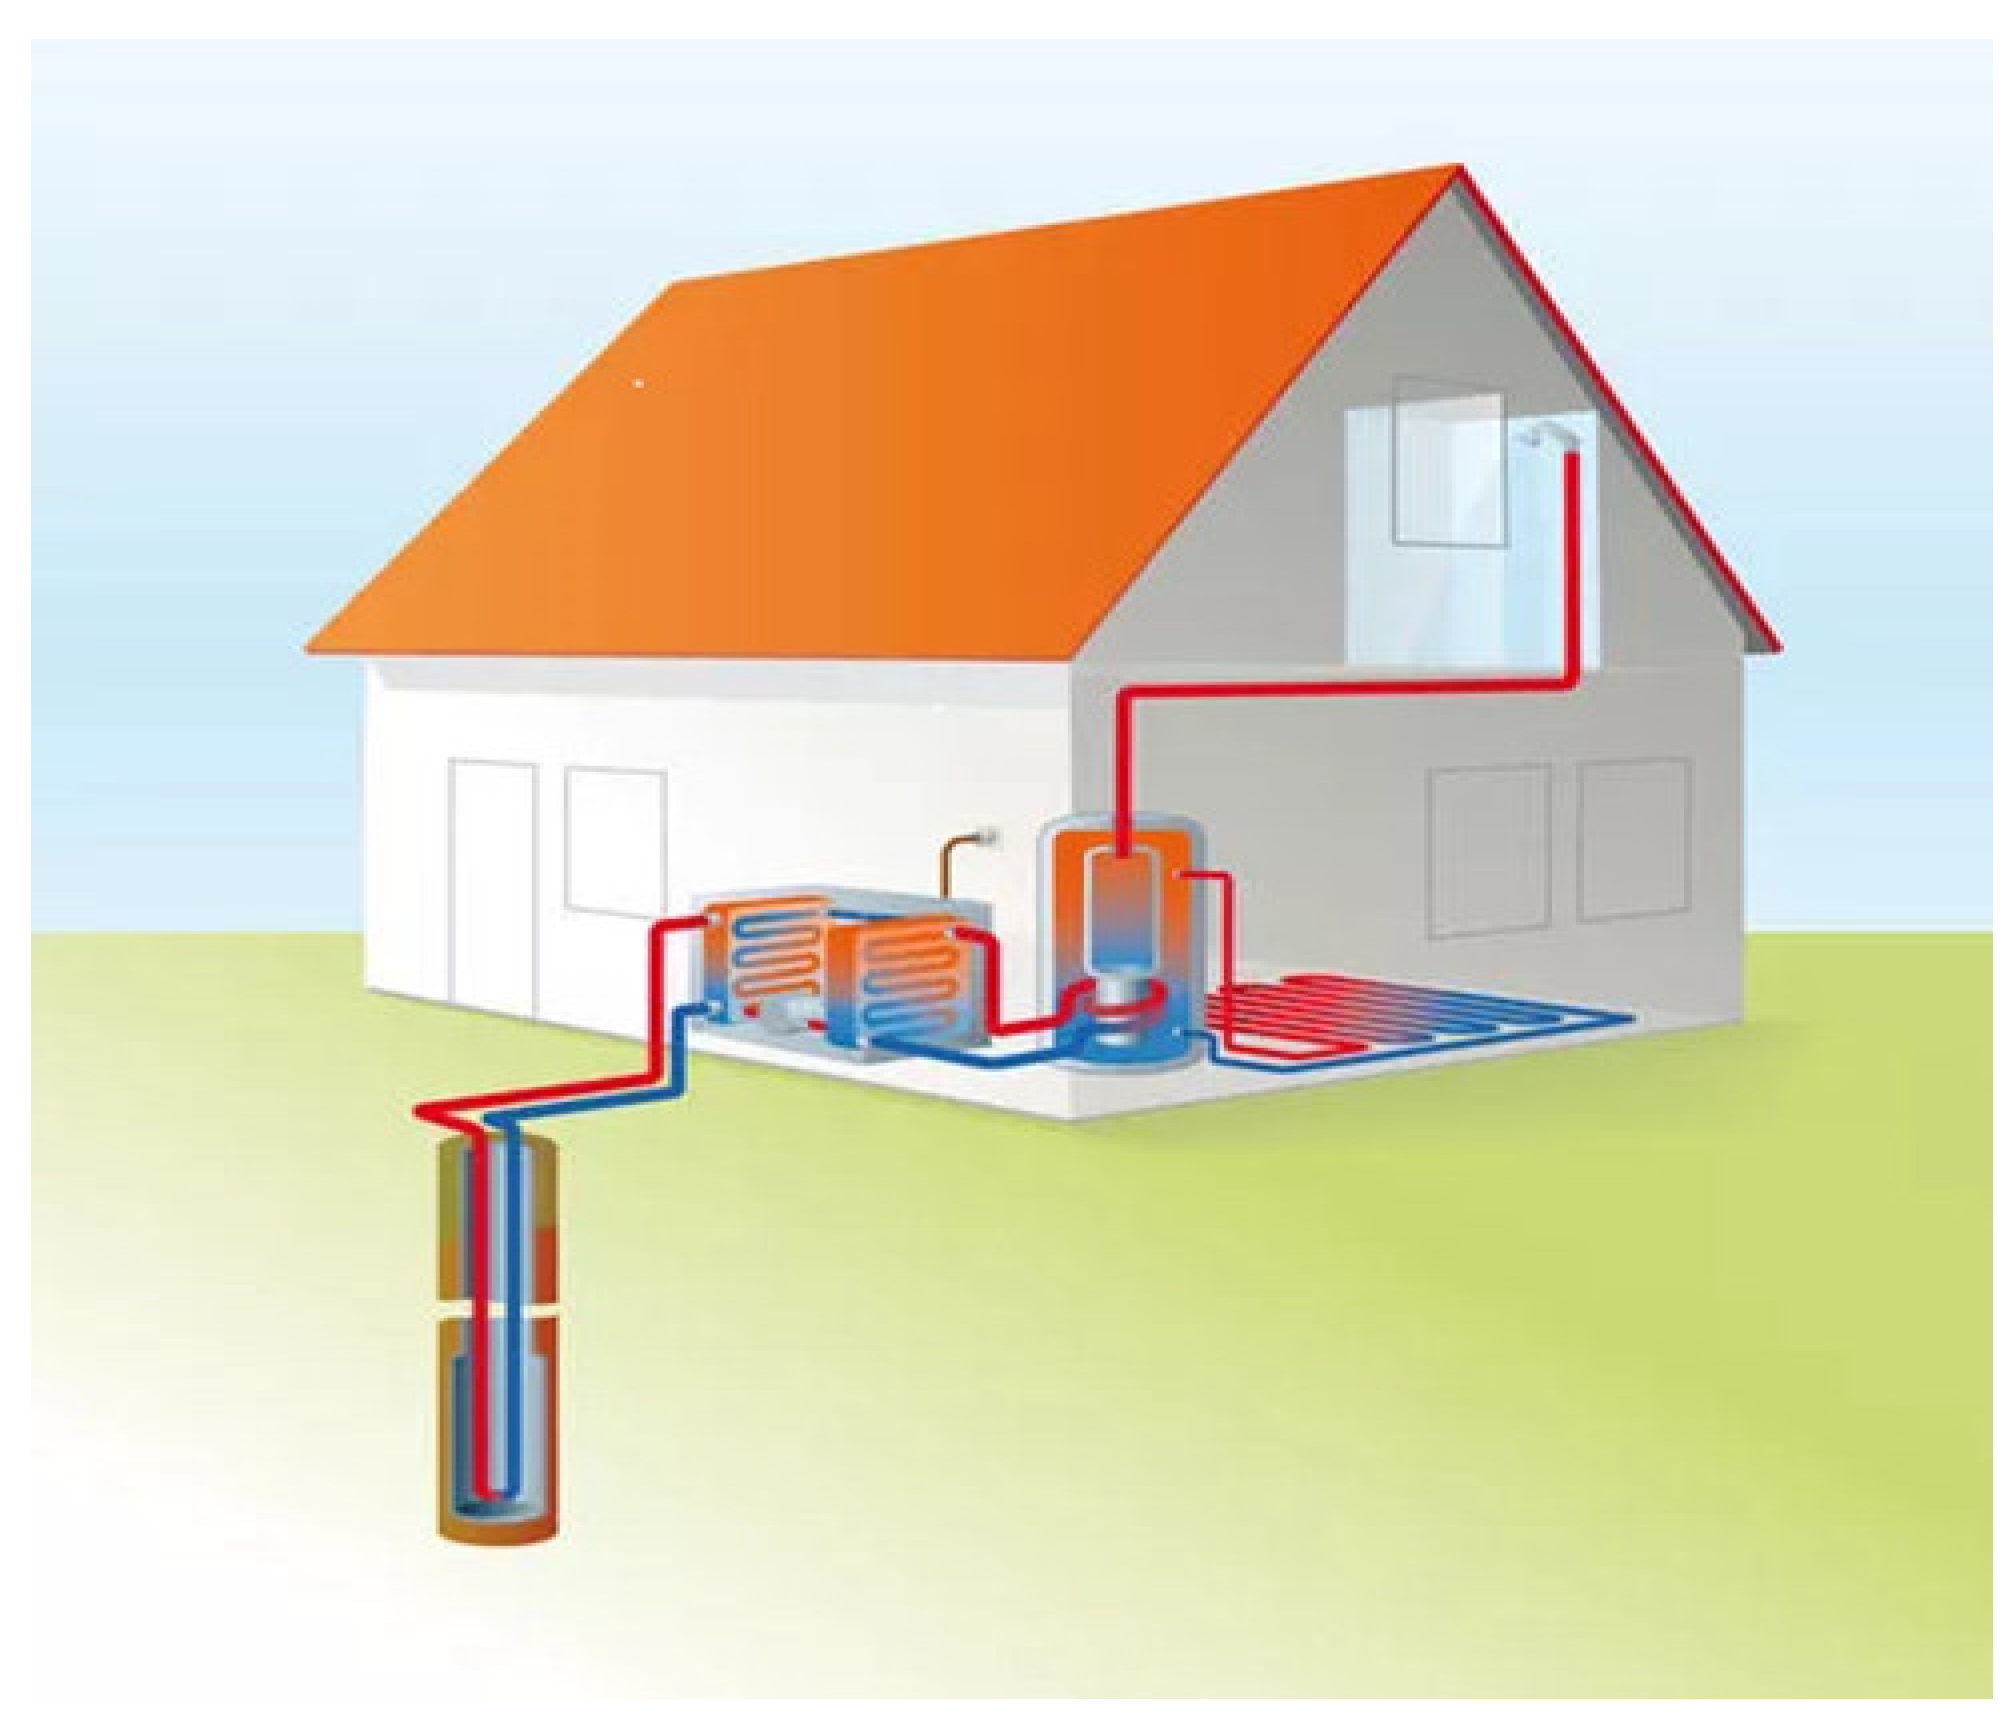
In order to define individual possibilities for the utilisation of near-surface geothermal energy, we present the systems that can be used on abandoned mine sites in more detail. The sources of geothermal energy are shown in Figure 1, with different principles following one another from left to right depending on the depth of the geothermal source.
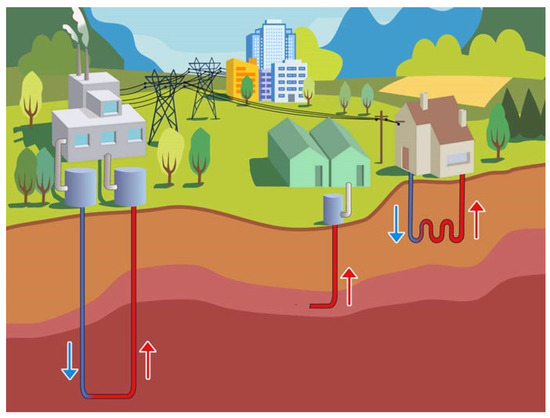
Figure 1.
Geothermal energy sources [5].
The following systems are used to utilise geothermal energy up to a depth of approx. 200 m:
- Underground (water/water system)
A well is built or dug to collect groundwater. The water is pumped to the surface with a submersible pump. The water is then led to the heat pump, which draws a few degrees Celsius from it. After leaving the heating/cooling system, the cooled water flows back into the aquifer from which it was extracted. In our case, we use groundwater from underground areas of abandoned mines (Figure 2).

Figure 2.
Underground water drainage channel in underground facilities of the RTH (water/water system).
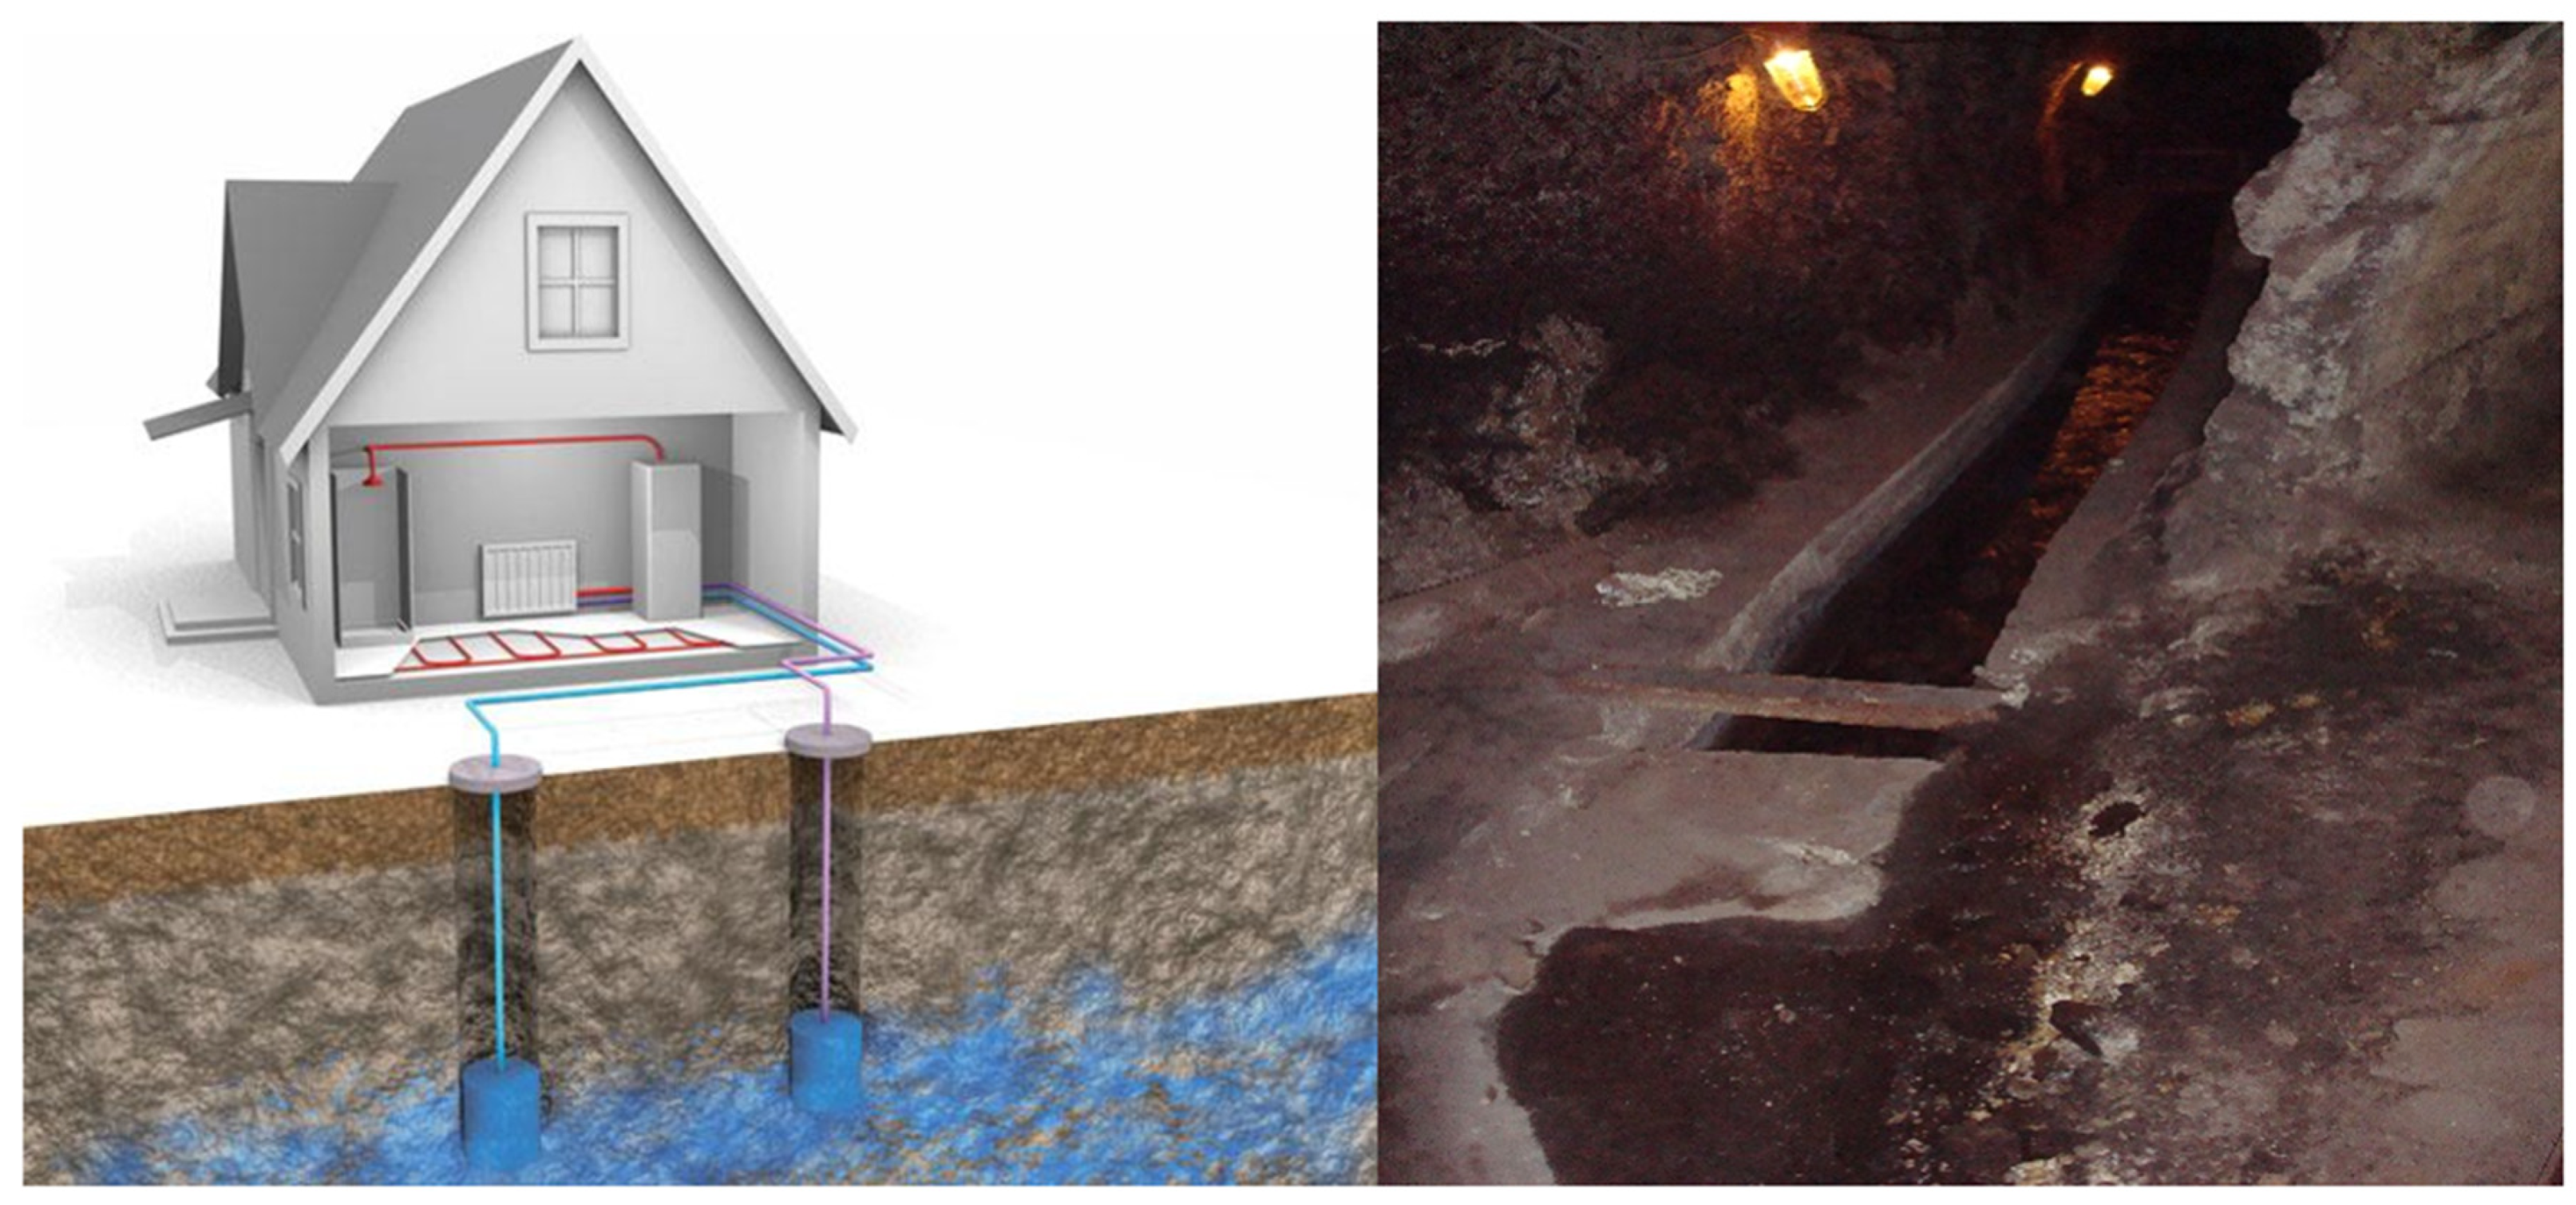
- Geosonde (rock/water system)
The thermal energy of the rock is captured using geosonde technology. Water mixed with glycol circulates through pipes embedded in the borehole (geosonde) and is heated under the influence of the surrounding rock. The liquid, heated by a few degrees Celsius, is then led to the heat pump, where the heat is extracted. The cooled fluid then re-enters the well.
A geosonde based on the rock/water system is shown in Figure 3.

Figure 3.
Geosonde (rock/water system).
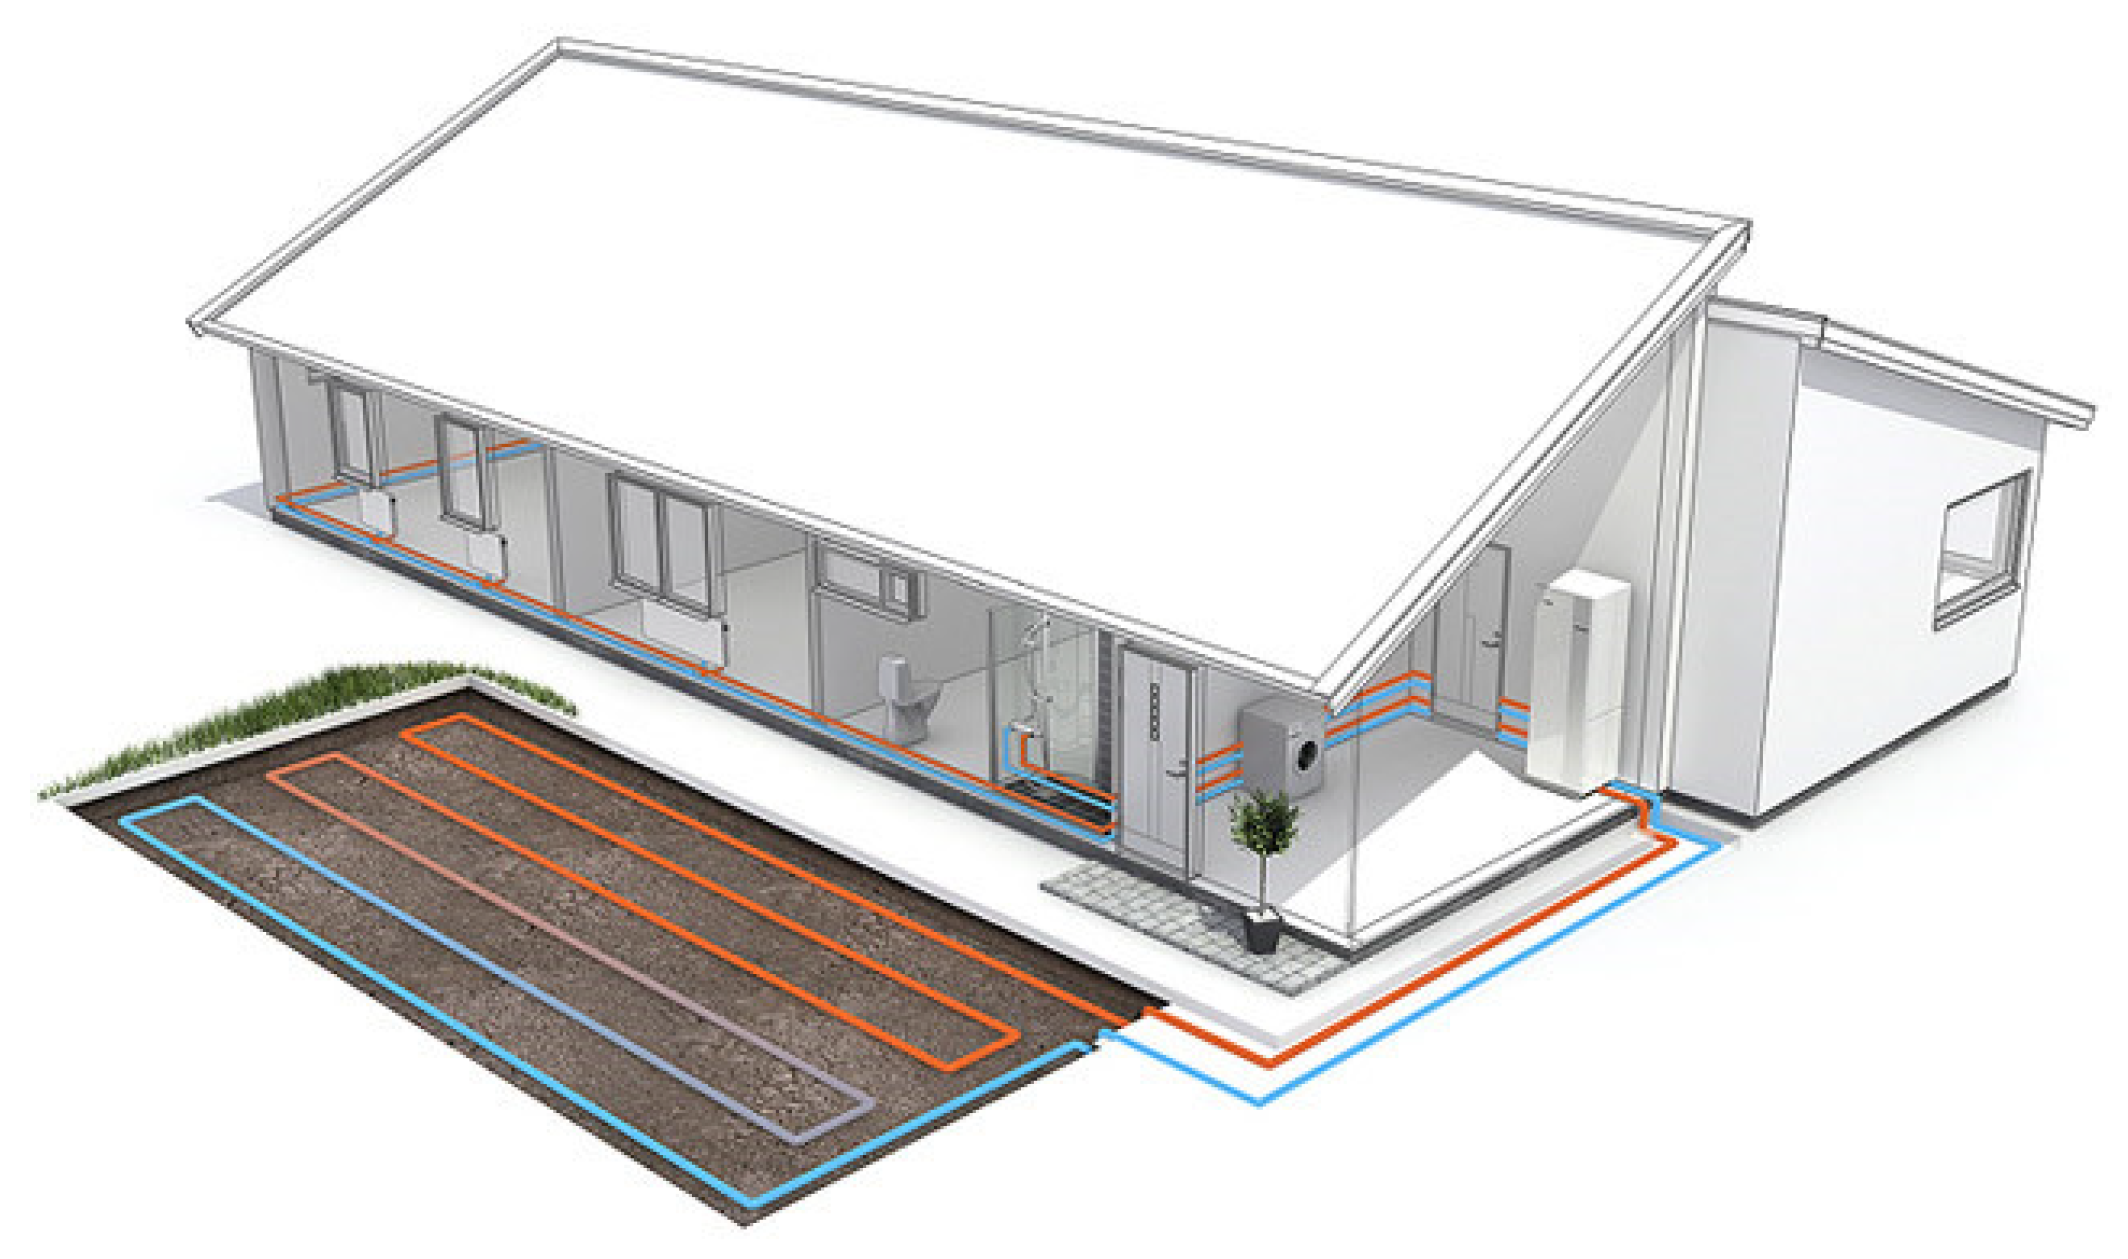
- Ground collector (soil/water system)
The thermal energy of the ground is collected from the uppermost, 1.5-metre-thick layer of the soil. For this purpose, horizontal collectors are sunk into the ground and plastic pipes are laid down, through which a water/glycol mixture circulates. In this way, an average output of around 20 W per square metre of the area covered by the collectors can be achieved.
The principle of the ground collector is shown in Figure 4.

Figure 4.
Ground collector (soil/water system).
What all methods for utilising geothermal energy have in common is that they can also be used for cooling, which leads to an increase in the thermal potential of the earth in the rock/water system.
The aim of the paper is to investigate a number of methods for analysing heat storage in the aquifers of abandoned coal mines, the representation of these reservoirs in RTH with a basic mathematical and statistical description of what is happening in the aquifer and the possibility of using shallow geothermal energy with the help of modelling on a specific model and the possibility of wider use in closed mines in the world [6,7].
Figure 5 shows the entrance to the underground water collection gallery in the Trbovlje–Hrastnik mine (RTH).
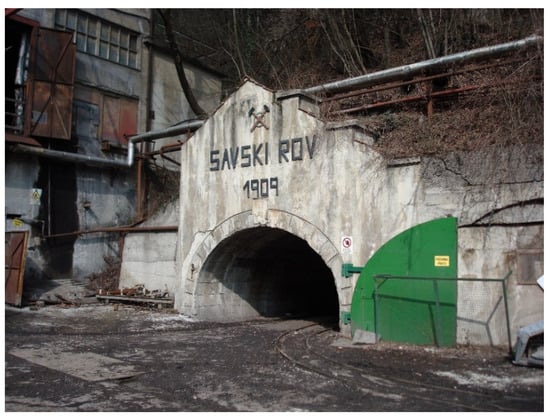
Figure 5.
Underground water collection gallery (water/water system).
2. Materials and Methods
2.1. Geological, Hydrogeological and Geomechanical Properties of the Rocks in the RTH Area
The Tertiary layers of the Zasavje coalfield extend in a long strip in a west-easterly direction. This belt of Tertiary sediments is known as the Laško-Zagorje Synclinorium, which is accompanied by the Trojane Synclinorium to the north and the Litija Anticlinorium to the south. This is a series of Tertiary rocks that are geologically bounded by faults or fault systems.
Together with the Laško mine, the Hrastnik mine forms the easternmost Tertiary depression, followed by the Ojstro, Trbovlje and Zagorje mines in the west [8,9].
The oldest rocks in the area under consideration are grey Permo-Carboniferous clastites and red and grey Gredenian clastites, which are found to the north and south of the Tertiary depression.
The Triassic rocks of the Trojane anticline consist of red siltstone, oolitic limestone and sandy micaceous dolomite from the Lower Scythian and dark grey, flat micritic limestone from the Upper Scythian.
These are followed in the lower part by stratified and sometimes laminated aniseed dolomite, which merges upwards into non-stratified sparitic dolomite with large lenticular conglomerate inclusions. The sparitic dolomite is followed by a layer of flat limestone with cherts and, above this, tuffaceous rocks with lenticular inclusions of limestone with cherts and sparitic dolomite. The tuff series is sometimes replaced by dark grey mudstone and chert. The upper part of this stack clearly belongs to the Lombard, while the lower part could be from the Fassano or even the Anisian. The contact with the Anisian of the classic dolomite facies is not visible. Above the tuffogenic stack lies the unstratified dolomite of the Ridge facies, probably of Cordevolian origin and covered by dark grey clastites several hundred metres thick. Based on the described development, we conclude that the tuffaceous stack with Cordevolian dolomite and dark grey clastics belongs to the Pseudozyl Formation. In the Litija anticline, Carnian carbonates with tuffaceous rocks occur in the lower part, while Sparitic dolomite, probably of Rhaetian age, and Norian limestone with megalodon shells occur in the upper part.
In the Oligocene, Tertiary sediments began to be deposited transgressively on the Triassic base. The conditions under which deposition took place changed rapidly, which is reflected in the different facies forms. We can even speak of three sedimentation cycles. The first sedimentation cycle is represented by carbonaceous layers together with Oligocene marine clays. The second sedimentation cycle begins with the deposition of the Miocene Gova layers. The third sedimentation cycle consists of the deposition of light layers.
The Oligocene consists of the bedrock (lower part of the coal-bearing layers), the coal layer, the overburden (upper part of the coal-bearing layers) and the marine clay (grey).
The lower part of the coal-bearing layers—the bedrock—consists mainly of clay and represents a fill that was deposited along the resulting depression, which received denuded material from the rising neighbouring areas. The thickness of the bedrock layers varies, reaching up to 80 m in some places. The bedrock layers are clastic, consisting of light grey clays (white bedrock), which in some places contain sand inclusions and even gravel layers. Towards the top, the bedrock becomes darker and gradually merges into the black bedrock and this into the coal layer.
The filling of the depression created a fairly wide plain on which a swamp forest developed in the last phase of sedimentation of the bedrock, providing material for the formation of coal. We separate the poorer part of the bedrock from the better part of the overburden of the coal layer. This is shown, among other things, by the fact that bedrock coal has more ash and a lower calorific value, while the overburden coal has the opposite, namely less ash, a lower density and a higher calorific value. In the bedrock part, the coal contains many clay admixtures and clay inclusions. The coal of the overburden part is unreasonably cleaner and of better quality, although it contains kaolinite and tuffite inclusions here and there. We should also point out pyrite and quartz concretions, which are actually pseudomorphs of the minerals mentioned after plant remains.
The upper parts of the coal-bearing layers are located in the lake or lagoon, where the overburden layers have formed, in particular the overburden marl, which is lithologically very different from the bedrock. In the lower part, they consist of black, thin-layered marl with many combustible organic admixtures, which merges upwards into brown, sometimes grey, hard limestone marl.
The grey marine clay was formed during subsidence, when the sea penetrated the lagoons and grey marly marine clay was deposited. The transition from carbonaceous layers to marine clay is gradual, with not even the slightest trace of discontinuity. This means that the subsidence that began with the deposition of the carbonaceous layers continued until the entire area was flooded by the sea and the lagoons became sea bays. The marine clay is not stratified and has a rich foraminifera fauna. It is, on average, 70 m thick. It was no longer deposited in the upper part of the middle Oligocene.
The oldest rocks of the last (third) sedimentation cycle are the so-called Govec layers (lower Miocene), Laško layers (middle Miocene) and Sarmatian layers (upper Miocene). The Govec layer could not be detected anywhere on the surface of the Hrastnik mine, the Ojstro mine and the Trbovlje mine. As a result of the intense tectonics, they were washed out before the Lithuanian limestone was deposited in the entire area exposed today. Govec layers are only found east of Hrastnik, in the Brezno area.
The Laško layer began to be deposited after the Styrian orogenic phase. The discord is very well developed. It begins with a thick layer of basal conglomerate containing 10 or even 30 cm pebbles, among which keratophyre is the most abundant. This conglomerate is cemented with a calcareous binder containing numerous calcareous algae (Lithotamnium). Towards the top, the pebbles become smaller and the basal conglomerate merges into the Lithotamnian limestone without a sharp boundary. In addition to calcareous algae, this may also contain numerous remains of other organisms as well as smaller pebbles and grains of quartz and keratophyre sand. Above the Lithuanian limestone follows light grey, hard sandy marl (Laško marl).
The Sarmatian layers are the youngest in the area under consideration. Between Trbovlje and Hrastnik, they occur in three separate parts. To the north-east and south-east of the village of Plesko, they are found in the form of small patches and, around the village of Prapretno, they cover a larger area. In the Dol area, there is a strong unconformity between the Lak marl and the Sarmatian clastites. Coarse Sarmatian clastics pass upwards into clayey silts and silty clays.
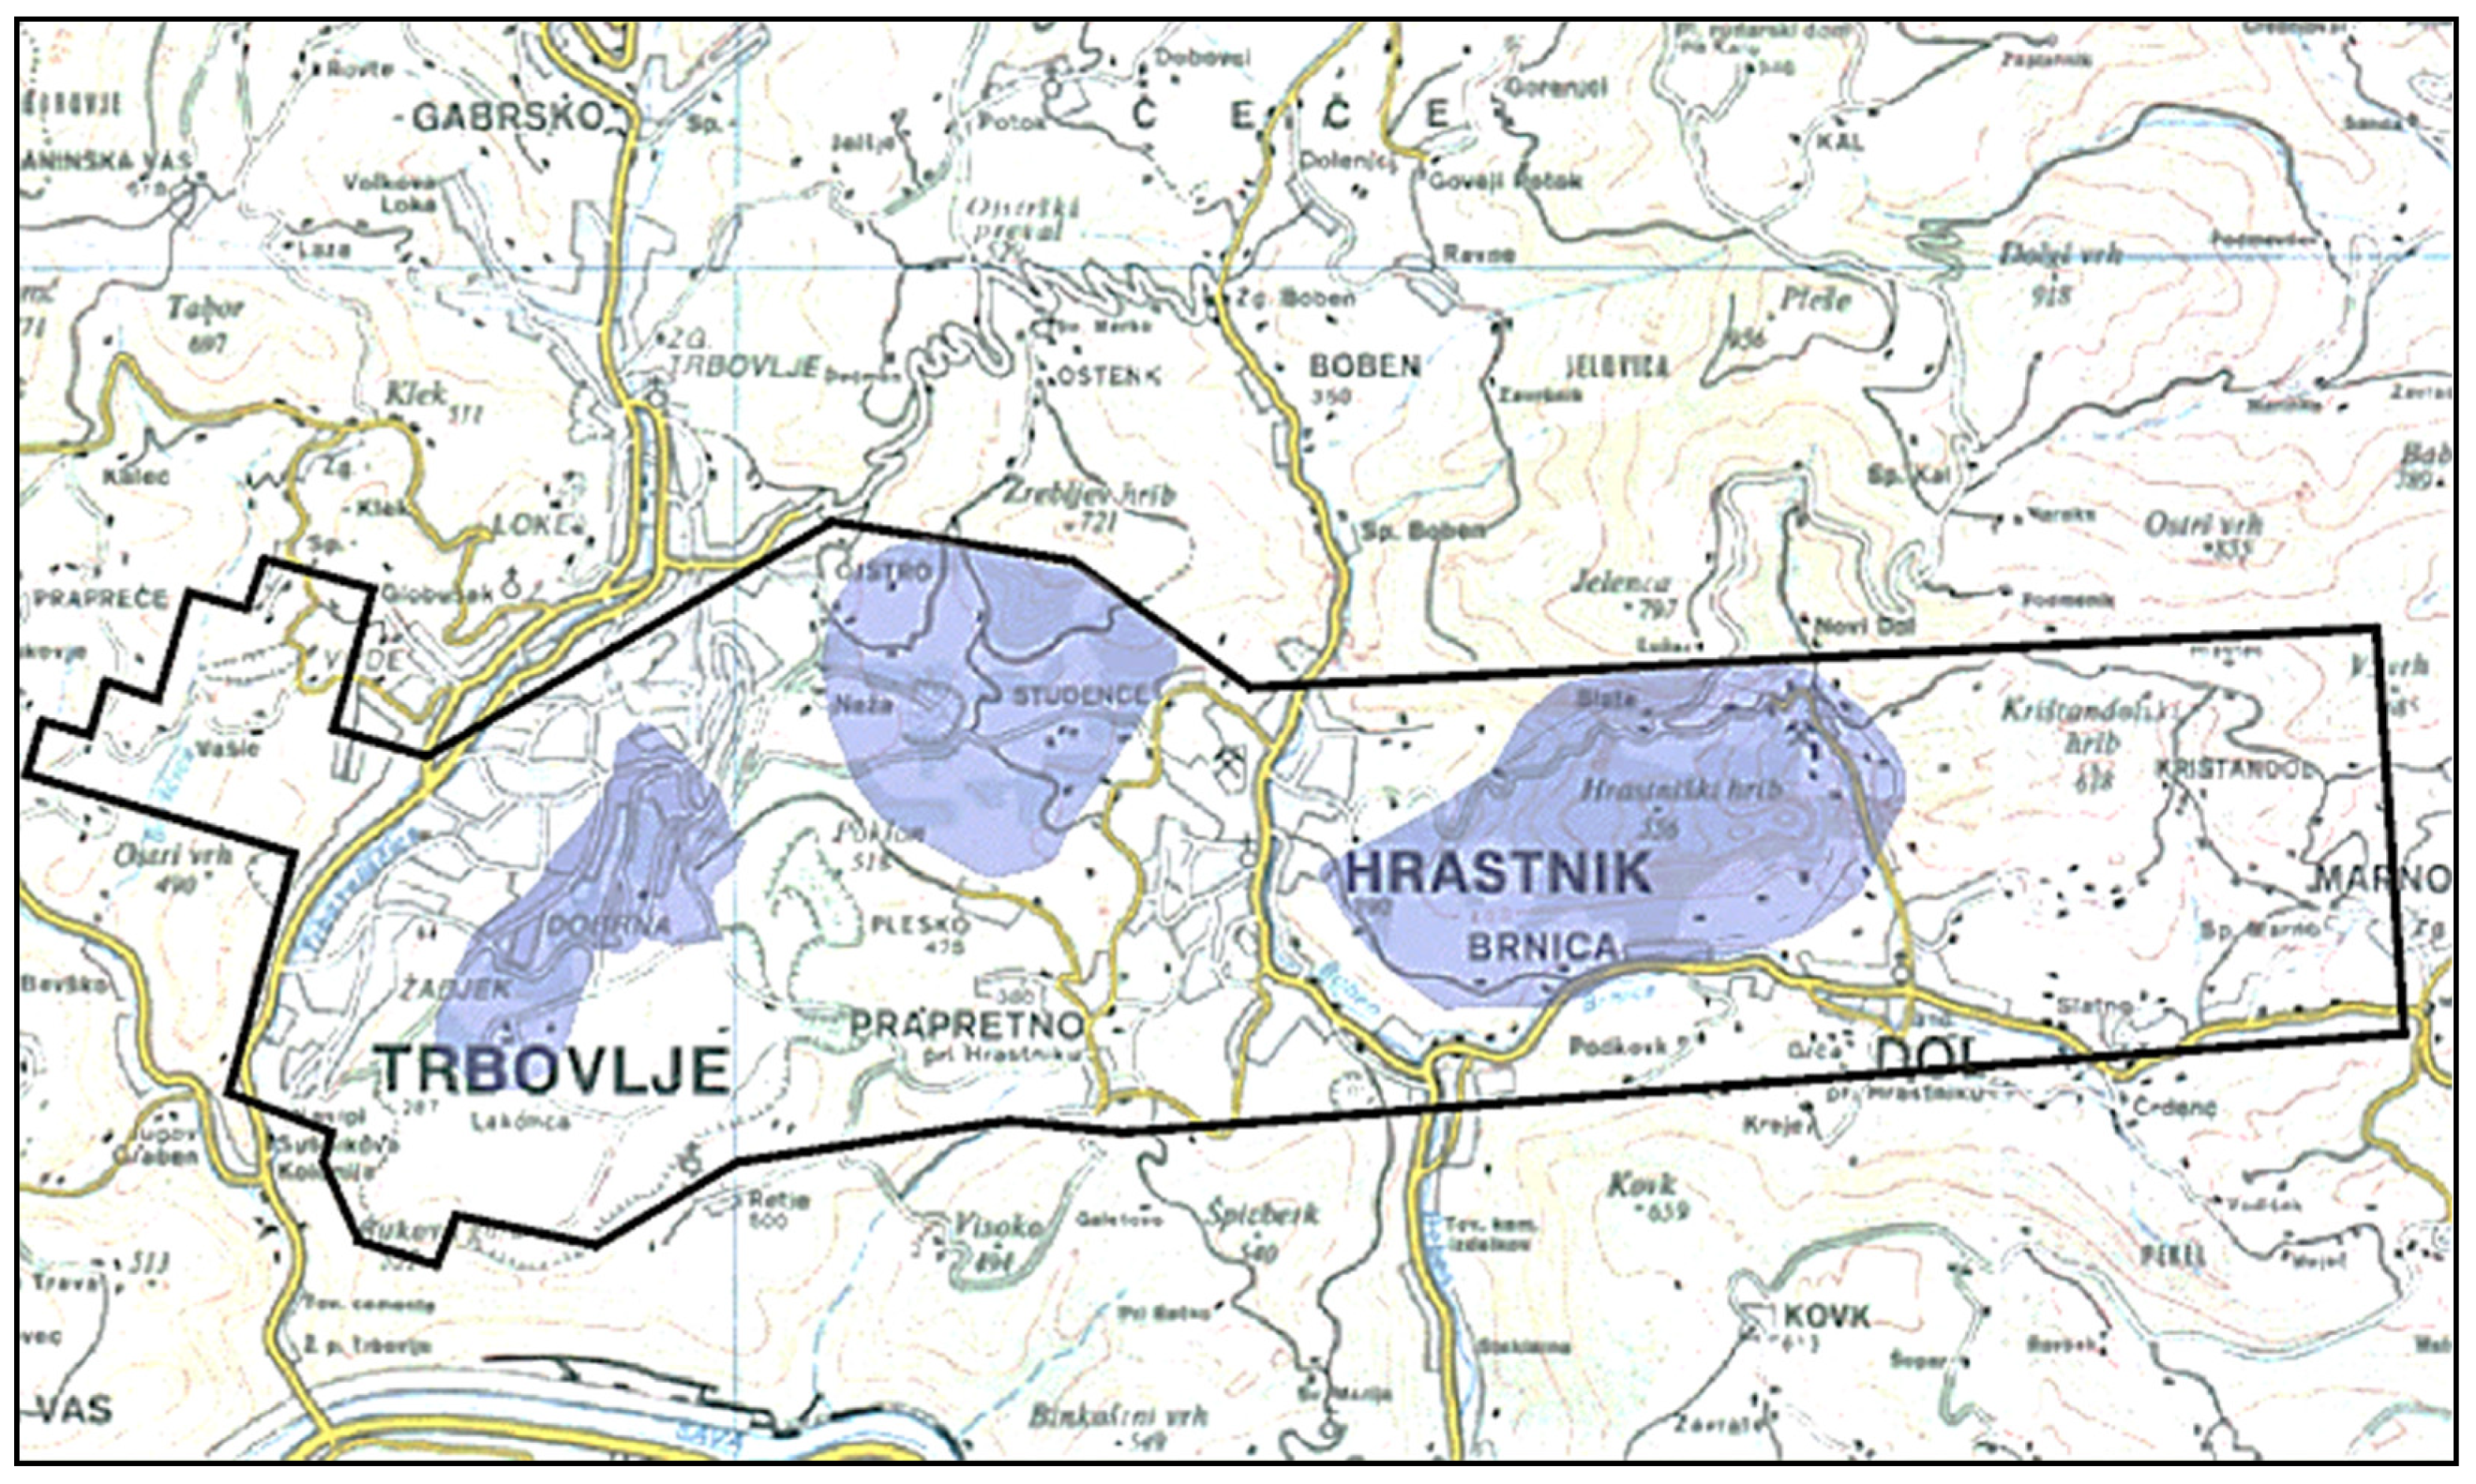
Figure 6 shows the map of Slovenia, on which the area of the Trbovlje–Hrastnik mine is marked with a frame.
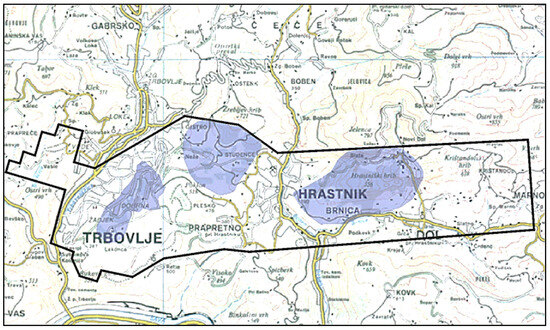
Figure 6.
Map of Slovenia (marked RTH area).
2.2. Hydrogeological Characteristics of the RTH Mining Area
Due to the varied geological structure of the coal deposits in the Trbovlje–Hrastnik mine area and the many years of mining with various mining methods, the hydrological events in the rock are varied and sometimes unpredictable. The geological structure is fractured several times by fault zones, which significantly affects the hydrological conditions in the rock of the mine area. From a hydrological point of view, fault zones and an area destroyed by mining indicate water permeability even in areas that would be impermeable in their original state [10].
In coal mining, collapses accompanied by water ingress occur more frequently in fault zones. Larger pieces of rubble can come into contact with the accumulated mass above the work site and thus pose the danger of water or liquid masses penetrating. Such similar dangerous phenomena usually occur in individual critical excavation areas.
The rocks occurring in the Trbovlje, Ojstro and Hrastnik mining area are divided into good aquifers, conditional insulators and insulators according to their hydrogeological properties. The good aquifers include triad dolomite, which is located at the base of the coal seam. In addition to the dolomite, the Lithuanian limestone, which is located in the overburden and is mainly fed by meteoric water, is also of great importance for the hydrogeological conditions. Due to the ruggedness and cracks in the overburden, the Lithuanian limestone is a strong water reservoir and is categorised as an aquifer.
Conditional insulators are rocks that are insulators in their original state but do not swell on contact with water. They become very permeable to water during demolition. These include overburden marl and Laško marl.
Swell clays are categorised as insulators, provided that the destruction processes are slow. The swelling of the clay closes the cracks created during demolition and the impermeability of the rock is maintained. These are bedrock clays, marine clays from the Oligocene and Sarmatian clays.
2.2.1. Trbovlje Mine
The syncline in the area of the Trbovlje mine is the shallowest. The coal seam is developed to a height of about 170 m above sea level. At the base of the Tertiary, there is Triassic dolomite, which is not layered, strongly fissured and, therefore, permeable to water. It is widely exposed in the Sava Valley, so that the water level in the dolomite has adapted to the bottom of the Sava Valley. The excavation fields in the Trbovlje mine, where the coal was mined, are located higher and are not affected by groundwater.
The water-bearing dolomite of the Trbovlje mine is indirectly drained into the neighbouring Ojstro mine, where the water level is lowered below 50 m above sea level. Water flows into the open underground spaces mainly from the overburden layer and from old workings. The main aquifer in the overburden is Lithuanian limestone. After the coal has been mined, the overburden marl also becomes permeable due to demolition and does not swell enough to close the cracks. The protective layer against the water from the higher overburden is formed by marine clay, which swells so that the cracks in it close quickly. Only in cases where cracks larger than the entire thickness of the Oligocene marine clay form during overburden movements can the protective, water-impermeable layer break and the possible accumulation of water or liquid mass penetrates into the open cave spaces. There is no protective layer of marine clay above the eastern part of the Trbovlje mine, as it was removed before the transgression of the Lithuanian limestone. It is also absent in an average 150 m wide band parallel to the outcrops where the overlying marl reaches the surface. The inflow of water into the Trbovlje mine therefore depends primarily on the amount of precipitation and the consolidation of the overburden and old works, as well as on the shaping of the surface, which is constantly sinking due to demolition process. In recent years, Trbovlje mine has not been excavated, so an intermediate hydrogeological equilibrium has been established in the cave and the water inflows have decreased somewhat and stabilised. In recent times, most of the total water inflow into Trbovlje mine has come from the area of the Sava field. In the area of the Plesko field, the overlying marls and siliceous are eroded, so that the coal is in direct contact with the Lithuanian limestone, which is the most important overlying aquifer in the area of the Trbovlje–Ojstro syncline. The average water inflow from this area in 2007 was around 250 L/min. Due to consolidation, the water inflow from the area of the former Lakonca field and the Frančiška field has decreased and averages 10 L/min.
As of 2018, water flows from the zone of the III field at an average of 35 L/min. Some of the water flows from the surface through the collapsed roof marl into the open underground spaces, at an average of 85 L/min.
In the Trbovlje mine, underground water drains by gravity to the level of the Zvezno Horizon and then into the Sava River. Water pumping is currently only necessary from the Sava field, which is open below the level of the Zvezno horizon. The total inflows of water in the Trbovlje mine in the five-year period are listed in Table 1.

Table 1.
The total inflows of water in the Trbovlje mine in the five-year period.
2.2.2. Ojstro Mine
The hydrogeological conditions in the Ojstro mine are monitored with piezometers, manometers and by measuring the water inflow into the open mine spaces. The Ojstro mine is open to a height of 56 m above sea level (k.+56), where the auxiliary pumping station is located. A total of around 6000 L/min of water currently flows into the mine. Of this, 5600 L/min flows for the most part into the pumping station at k.+56.
The dolomite in the Ojstro mine, i.e., the aquifer, was drained in the past with a line along the dolomite, first at k.+130 (k. means a height mark or horizon measured as altitude), then at k.+120 and even later at k.+90, but currently with drainage facilities and wells at k.+43. All these underground facilities required a large capacity of pumping stations for draining and lowering the water in them. With the long-term withdrawal of water from the mine, the water level dropped intensively. The drainage line at k.+90 has been dry for several years. Based on observations, we note that the water level around the open dolomite structures in the area of the drainage funnel is currently below the k.+55 horizon. In the dolomite, we measure the water level in the Ojstro mine in piezometer PJ-2, where the water level is currently almost 19 m below the line level, i.e., at k.+75.3 and in piezometer PJ-1, where the water level is about 8 m below the top of the well, and at k.+55 and with the help of manometers at the horizontal wells M-3 and M-4. The water from the drainage systems and wells flows into the pumping station at k.+43, the deepest open point of the Ojstro mine. The wells drilled from the pumping station itself in the direction of Terezija polje supply most of the water. Currently, around 2730 L of water per minute flows from the wells. The wells are equipped with shut-off valves so that they can be temporarily closed. In addition to these wells, many shorter wells have been made in the area of the dolomite aquifer, but these are not as extensive. The total inflow of water into the Ojstro mine over the five-year period is shown in Table 2.
Table 2.
The total inflows of water in the Ojstro mine in the five-year period.
2.2.3. Hrastnik Mine
In 2021, the Hrastnik mine was in the final phase of closure work; the closure of the RTH pits proceeds from east to west, i.e., from the mostly still closed Dol pits to the main pits of the Trbovlje mine, where coal was mined the longest. The Hrastnik 1 shaft was filled up to level IV horizons. The production of plugs and the decommissioning of the main pumping station II in the Hrastnik mine also led to a rise in the water level in the dolomite. After the abandonment of pumping station II at k.+80, audit GT-1 was filled with water up to k.+200, where an auxiliary pumping station was built. A deep piezometer PH-1b/04 is provided to monitor the water level in the dolomite. The water inflows into the Hrastnik mine over a period of five years are shown in Table 3.
Table 3.
The total inflows of water in the Hrastnik mine in the five-year period.
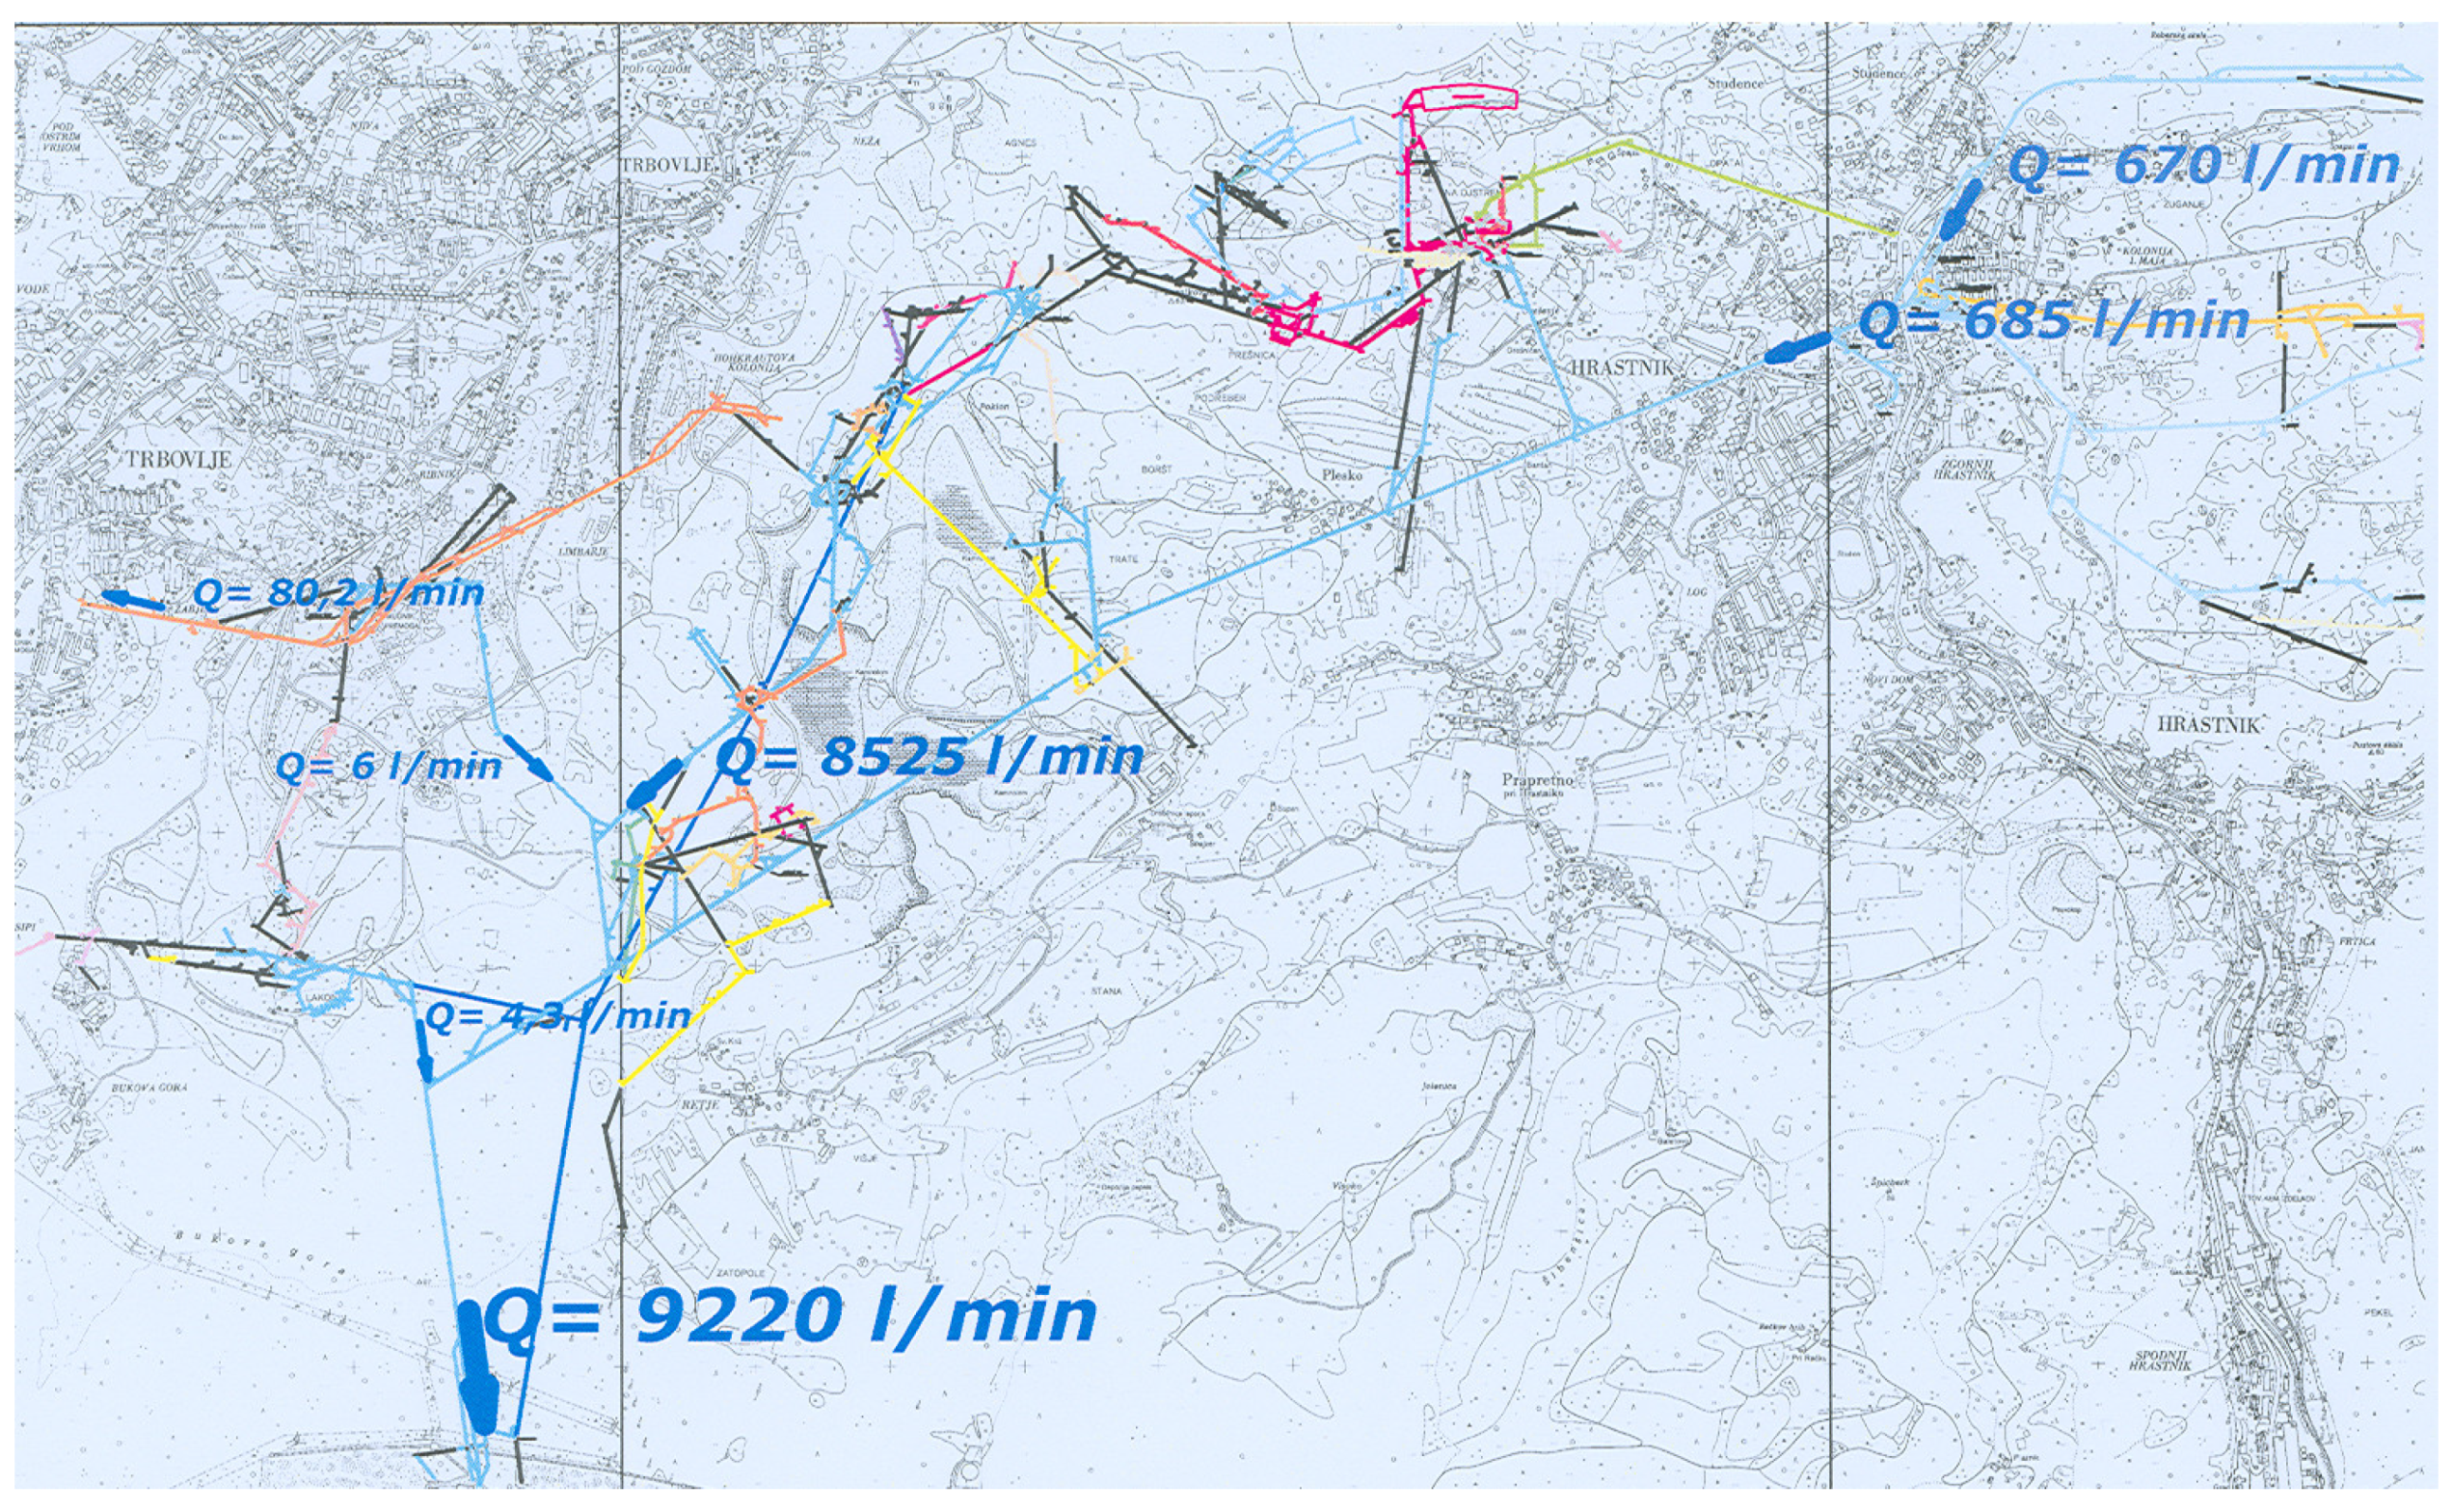
This means that the total amount of water in the area of the closed RTH coal mine reaches a flow rate of around Q = 9000 L/min or 0.15 m3/s. The average water temperature in winter is 11 °C.
The collection of groundwater and the total amount of water flowing from the Trbovlje–Hrastnik mine are shown in Figure 7.
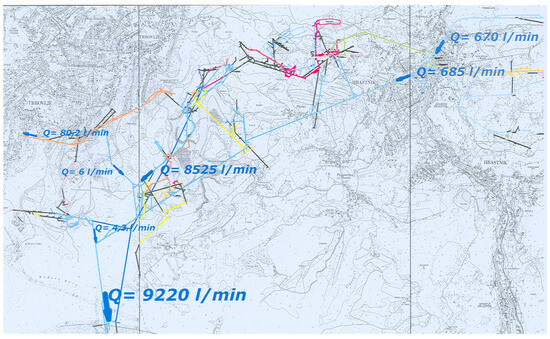
Figure 7.
Total inflow of water from the underground areas of the Trbovlje–Hrastnik mine.
The results of the chemical analysis show that none of the analysed parameters exceed the limit values specified in the Slovenian regulations on the health suitability of drinking water (Table 4). An exception is the iron (Fe) content in the sample from the drainage channel, where the normative value is exceeded. The reason for the exceeding of the iron content is probably due to the rather limonitised rock or the large amount of milling fraction in the water in the drilled limonitised fault zone. The chemical analyses of the water were carried out by an authorised laboratory and the RTH laboratory. Basically, we are dealing with drinking water that does not contain any chemical compounds or will not negatively affect the sustainability of mine water utilisation. In the case of limescale deposits in water installations, a maintenance programme to remove limescale must be prescribed depending on the occurrence of deposits in order to maintain the efficiency of the heating system. Relatively simple removal of limescale deposits is possible with diluted hydrochloric acid (HCl).
Table 4.
Results of chemical analysis.
2.3. Possibilities of Using Shallow Geothermal Energy in the RTH Area
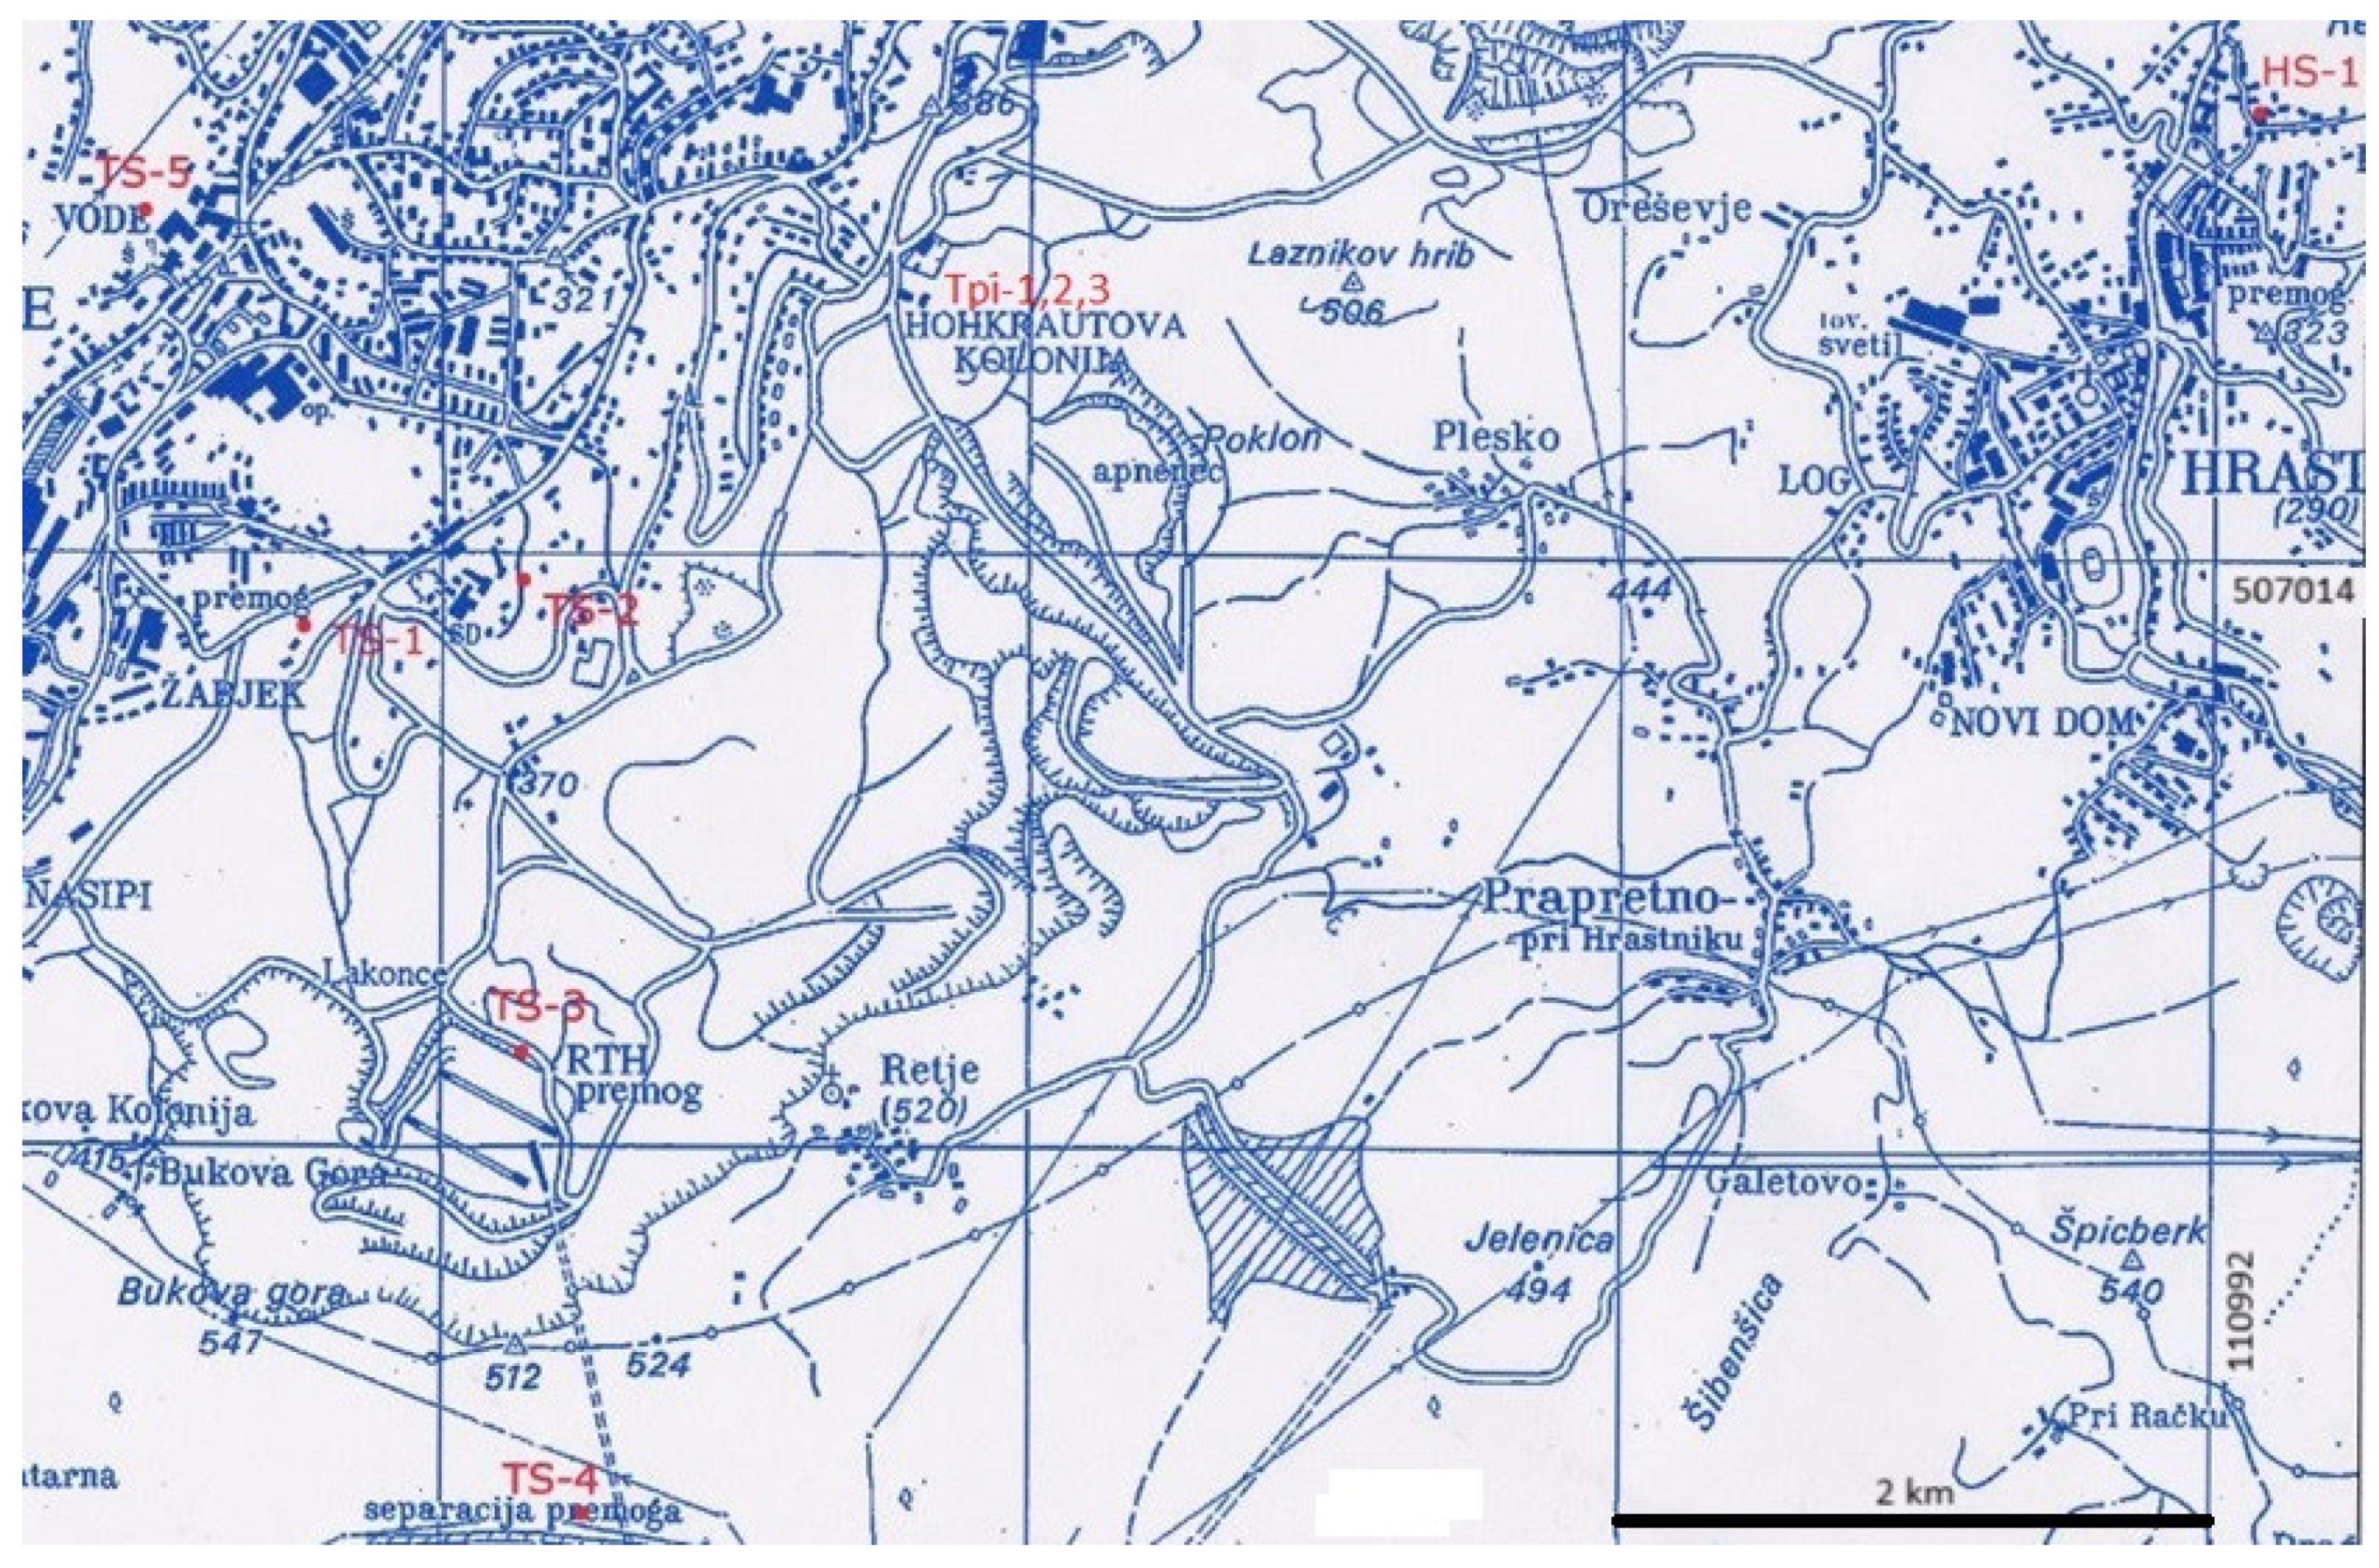
In the RTH area, there is a great possibility of exploiting shallow geothermal energy from water and ground sources [11,12,13]. Therefore, we have identified all options for the utilisation of shallow geothermal energy in certain areas of the RTH. The total thermal energy requirement of the listed buildings is 800 kW. The options are presented in Table 5 and shown in the Figure 8.
Table 5.
Potential utilisation areas of use of shallow geothermal energy with different exploitation systems.
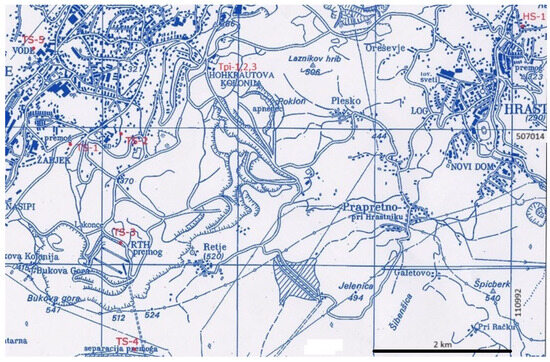
Figure 8.
Locations of the individual users for heating and cooling via heat pumps.
2.3.1. Heat Transfer in Aquifer and Water Drainage
Heat and mass transfer in an aquifer is a combination of conduction, convection and diffusion. Due to the complex nature of the physical phenomenon, it is necessary to make some simplifications, such as the assumption of laminar groundwater flow. We also assume a constant density and viscosity of the groundwater at the temperatures considered [14].
Diffusion of Substances
The mathematical description of groundwater flow is based on Darcy’s law. This describes the linear dependence between the specific flow rate q, area A (Equation (1)) and the hydraulic potential grad h. Darcy’s law is only suitable for porous bodies and laminar flow.
As the hydraulic conductivity K is invariable and only a statistical value of the macroscopic flow inventory, it is only valid for small Reynolds numbers (Re < 10). The groundwater flow Q between two points is proportional to the change in height between the points h, the distance between the points D and the hydraulic conductivity of the substance K through which the flow passes. The hydraulic conductivity is determined by the permeability of the material, the flow velocity and the force of gravity. The latter two components have less influence, so we can simplify them with the permeability.
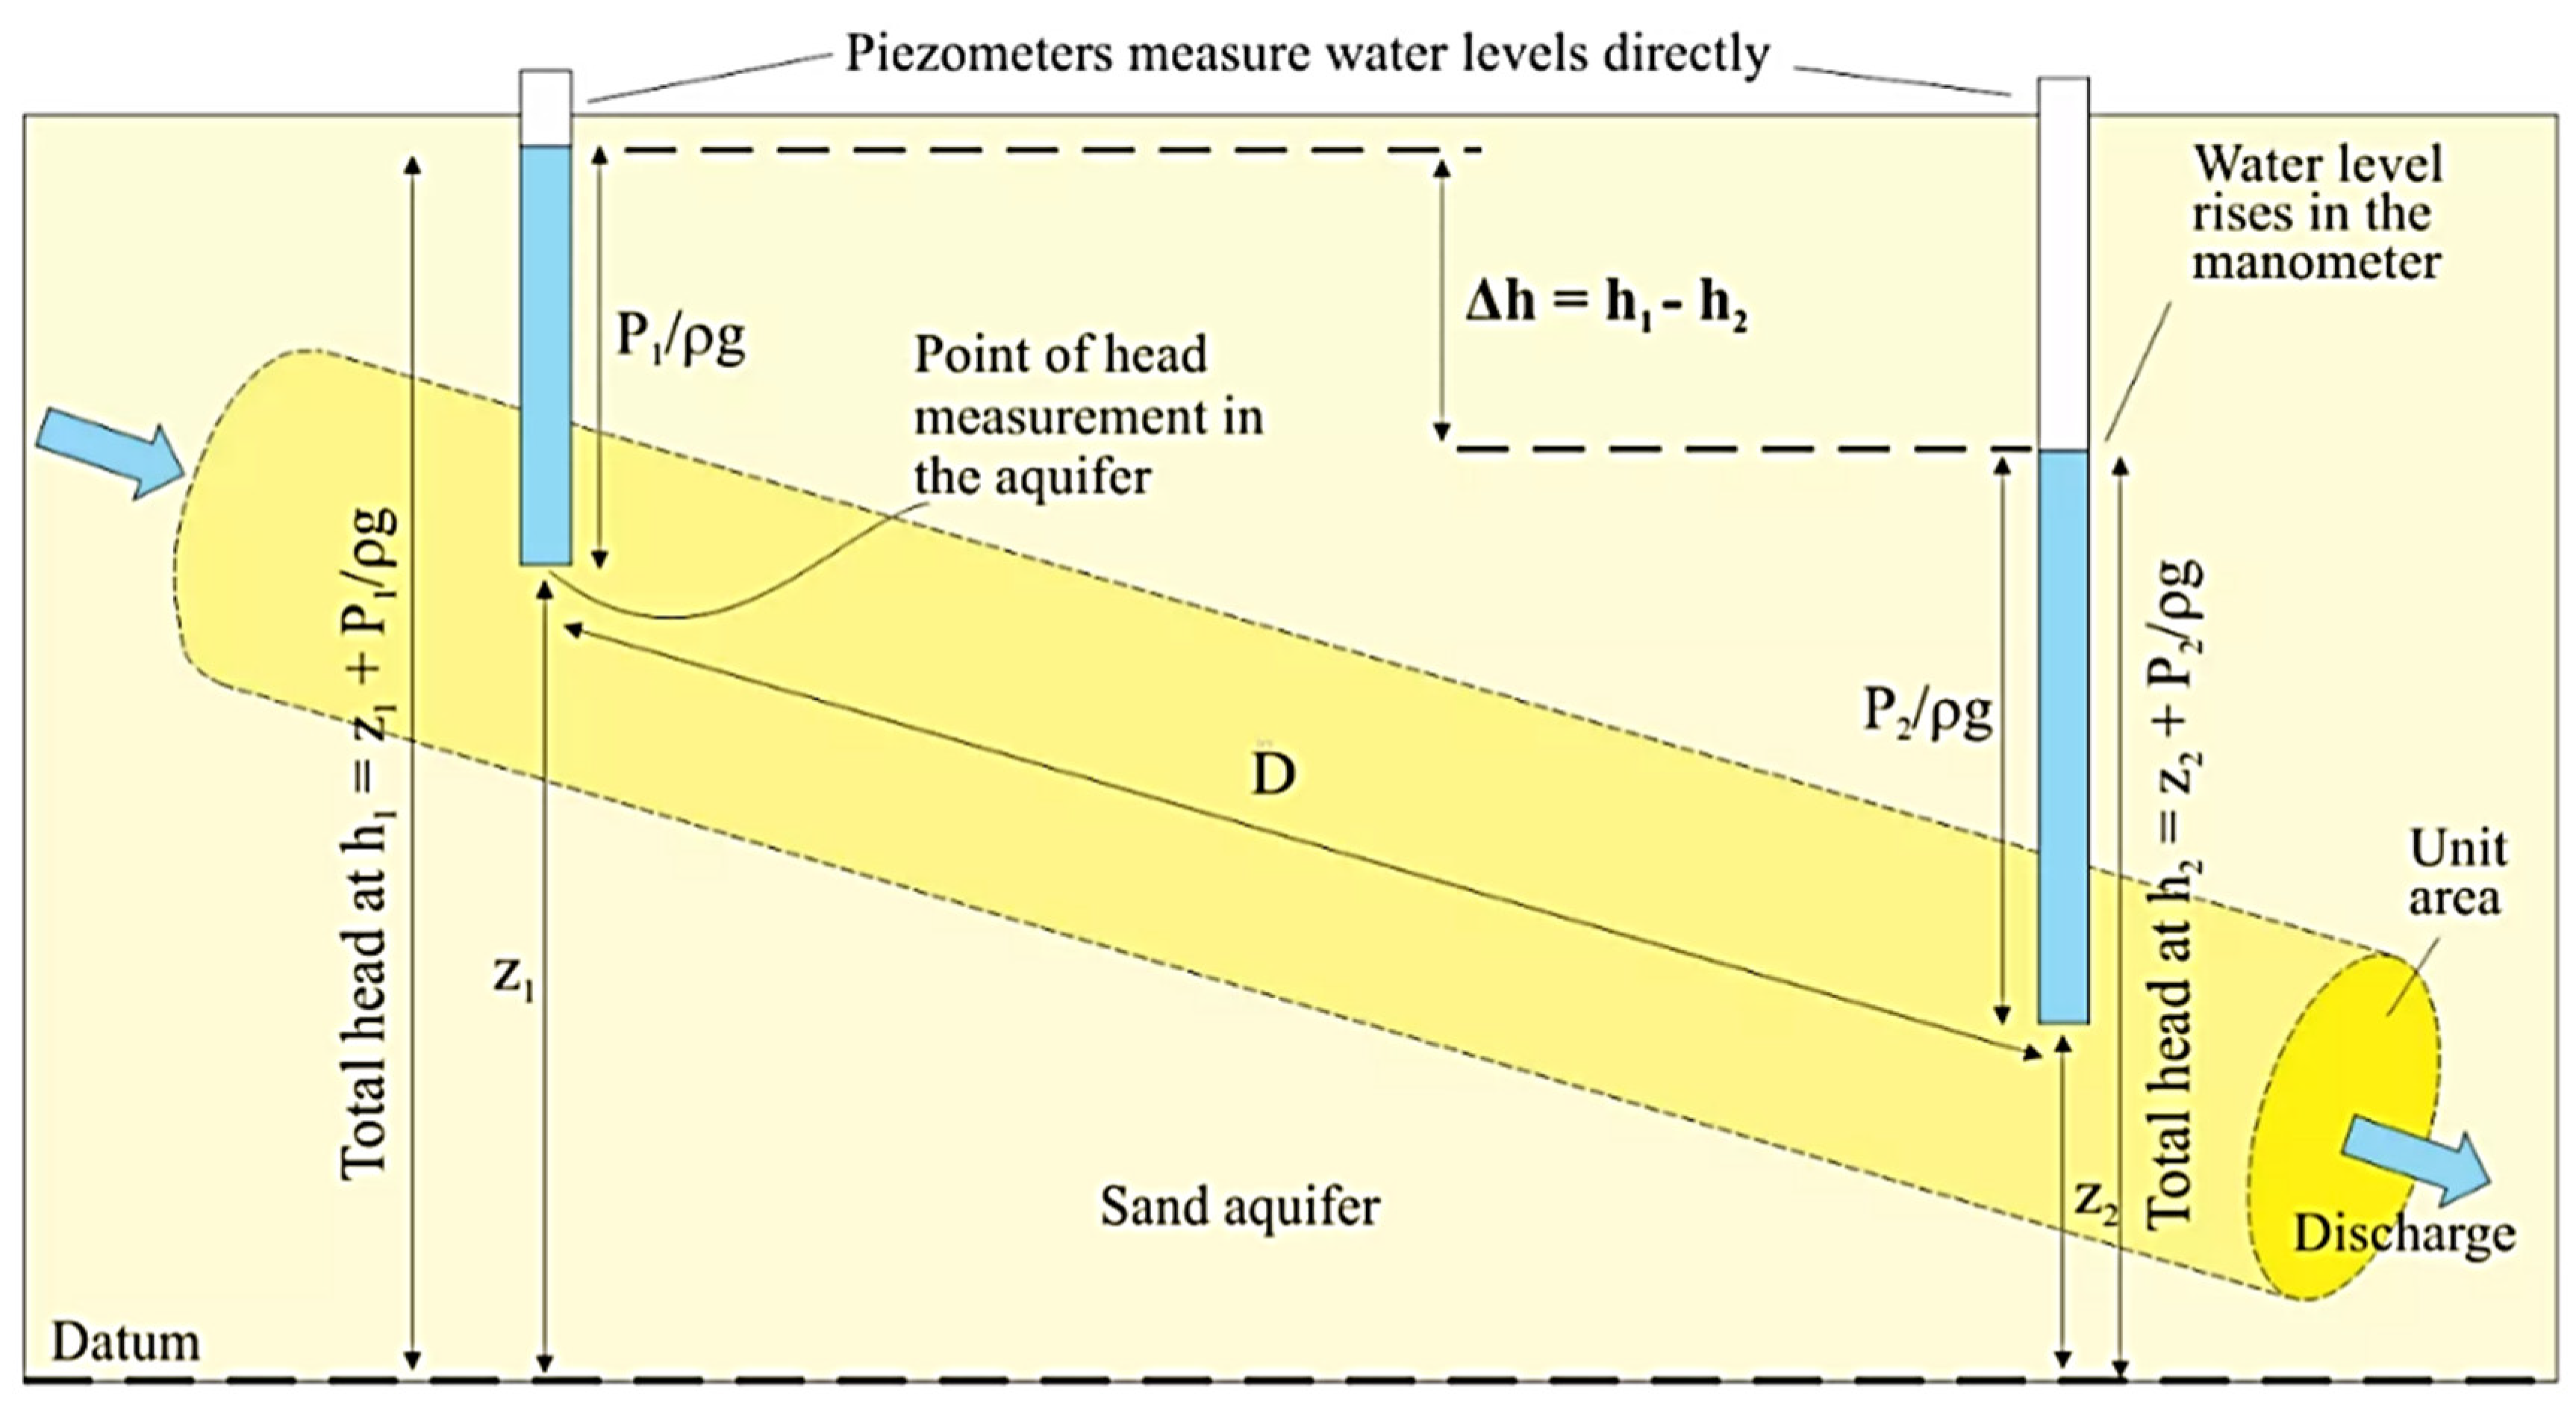
The definition of the flow rate q as a function of the permeability of the material k, the difference in height h between the observed points and the distance between the points D is shown in Equation (2), and the graphical definition of Darcy’s law can be seen in Figure 9.
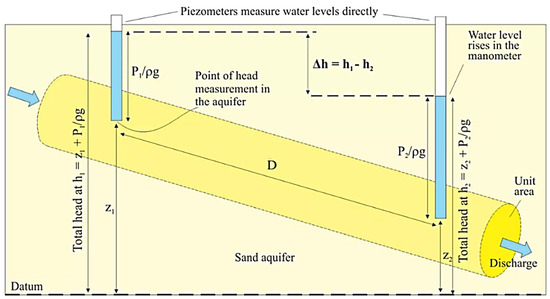
Figure 9.
Definition of Darcy’s law.
The Law of Conservation of the Masses
Regardless of the time step dt, the mass change dmvol in the aquifer is equal to the difference between the mass entering min the observed volume and the mass leaving it mout:
We place the body in the Cartesian coordinate system (index x, y, z in the equation) and replace the mass by the specific flow q with unchanged density as follows:
If Darcy’s law is used in Equation (4) and the term of the fluid source or sink Qw and the compressibility So are added, a differential equation is obtained that describes the three-dimensional flow in an anisotropic aquifer:
In practical calculations, the general groundwater flow equation (Equation (5)) is usually simplified depending on the application. In most cases, an isotropic aquifer is assumed to be Kx = Ky = Kz or the vertical flow is neglected [15].
Heat Flow
The heat flow j is also described analogue to the hydraulic flow Qt:
By applying the law of conservation of energy to the observed volume, we can calculate the temperature change dT within the three-dimensional mode, where c is the specific heat of the fluid and ρ is the density of the fluid:
The combination of Equations (6) and (7) results in the Fourier differential equation for heat transfer, which generally means heat transfer through an anisotropic medium:
The law of conservation of energy can be simplified by considering that the density is constant for theoretically incompressible fluids (where the specific heat cp is at constant pressure). (Note that cp ≈ cv applies to incompressible flows.)
Thermal Potential of the Water/Water System
In the area of the Trbovlje–Hrastnik mine, it makes sense to utilise the thermal potential of water for heating and cooling commercial, industrial and residential buildings [16]. The utilisation of water from the RTH underground is primarily possible as a water/water system (where the utilised water flows into the Sava River) and to a lesser extent as a soil/water system. With the water/water system, we can calculate that we will obtain approx. 2.7 MW of thermal energy via heat pumps (flow rate approx. 9000 L/min; ΔT = 4 °C; Q = 60 L/min is sufficient for approx. 18 kW of thermal energy) [17]. When planning the heating and cooling systems, other parameters, such as the primary construction method of the buildings, must also be taken into account, so the above values are only guidelines.
Since we have a total water flow from the underground areas of the RTH of approx. Q = 9000 L/min and not all potential geothermal energy utilisation systems will be in operation at the same time, it is necessary to check the influence of the mixing of different water temperatures and their possible drop in the water temperature in the system. This results from the equation for the mixing temperature:
where m1 and m2 are the mass of the water, c1 = c2 is the specific heat of the water, T1 and T2 are the temperature of the water and T is the temperature of the mixture.
A simple calculation shows us that if we use water at 1000 L/min, T = 281 K, and P ≈ 300 kW heat energy is obtained, the total amount of water is 9000 L/min, T = 285 K, and the drop in water temperature is ΔT = 4 K.
Since, in this case, we are dealing with flowing water and there is no constant consumption over 24 h, the influence of the temperature difference is negligible for consumers located one behind the other in the underground water utilisation system.
2.3.2. Heat Transfer—Ground Heat Exchanger
The average extraction of a geosonde per metre of length is between 35 and 100 W/m, which mainly depends on the properties of the soil. Of course, we must also take into account the number of hours of circulation of the heat transfer medium over a longer period [18]. According to DIN VG 4640, the standard period for system operation on an annual basis is between 1800 and 2400 h. The data on the thermal properties of the soil are obtained by laboratory measurements, but we must pay attention to the thermal fluctuations at certain depths. The thermal output of the geosonde is influenced by the temperature gradient (which we have to determine from measurements), the density of the earth’s heat flow and the thermal conductivity of the rock λk.
The geothermal gradient is calculated using the following equation:
The thermal conductivity of rocks is determined using the calculated gradient and the local soil heat flow, i.e., we use Fourier’s law:
The equation for the thermal output of the geosonde is:
This equation is determined using the thermal conductivity of the rock, which then allows us to determine the specific heat dissipation Φspec for an operating time of 1800 h or 2400 h.
To determine the heat dissipation, we need to consider the following equation:
where T is temperature, q′ is heat output per metre of the well, r is radius of the well, ω is radius of influence, t is time, and λ is thermal conductivity.
Thermal Potential of the Rock/Water System
In the RTH area, the utilisation of shallow geothermal energy in a rock/water system makes sense at some locations (Table 5). We are interested in how much of this energy potential is available and what influence it has on the temperature change of the geosonde’s surroundings during operation: 1 h, 10 h and 100 h. Known parameters are the well depth h, the thermal conductivity λ, the thermal capacity C, the heat flow q, the thermal transmissivity Tt and the rock thickness d.
The geosonde is limited to an area of 20 × 20 m and is located in the centre of the ground plan. The course of the heat dissipation is only in a horizontal direction. There is no groundwater in the area of the geosonde up to a depth of 150 m—the rock is dry. The parameters are as follows: thermal conductivity λ = 4 W/mK, rock thickness d = 150 m, heat output per metre of the well q’ = 50 W/m, thermal diffusivity α = 0.19 × 10⁻⁶ m2/s (Table 6 and Table 7).
Table 6.
Thermal conductivity, density, heat capacity, and porosity [19].
Table 7.
Thermal diffusivity of some soils and rocks in the RTH area.
The thermal power is determined from Equation (14) for the rock/water system geosonde. It is assumed that about 7.5 kW of thermal energy can be obtained from a 150 m deep well.
The Influence of Utilising Geothermal Energy in the Rock/Water System on Lowering the Temperature of the Rock
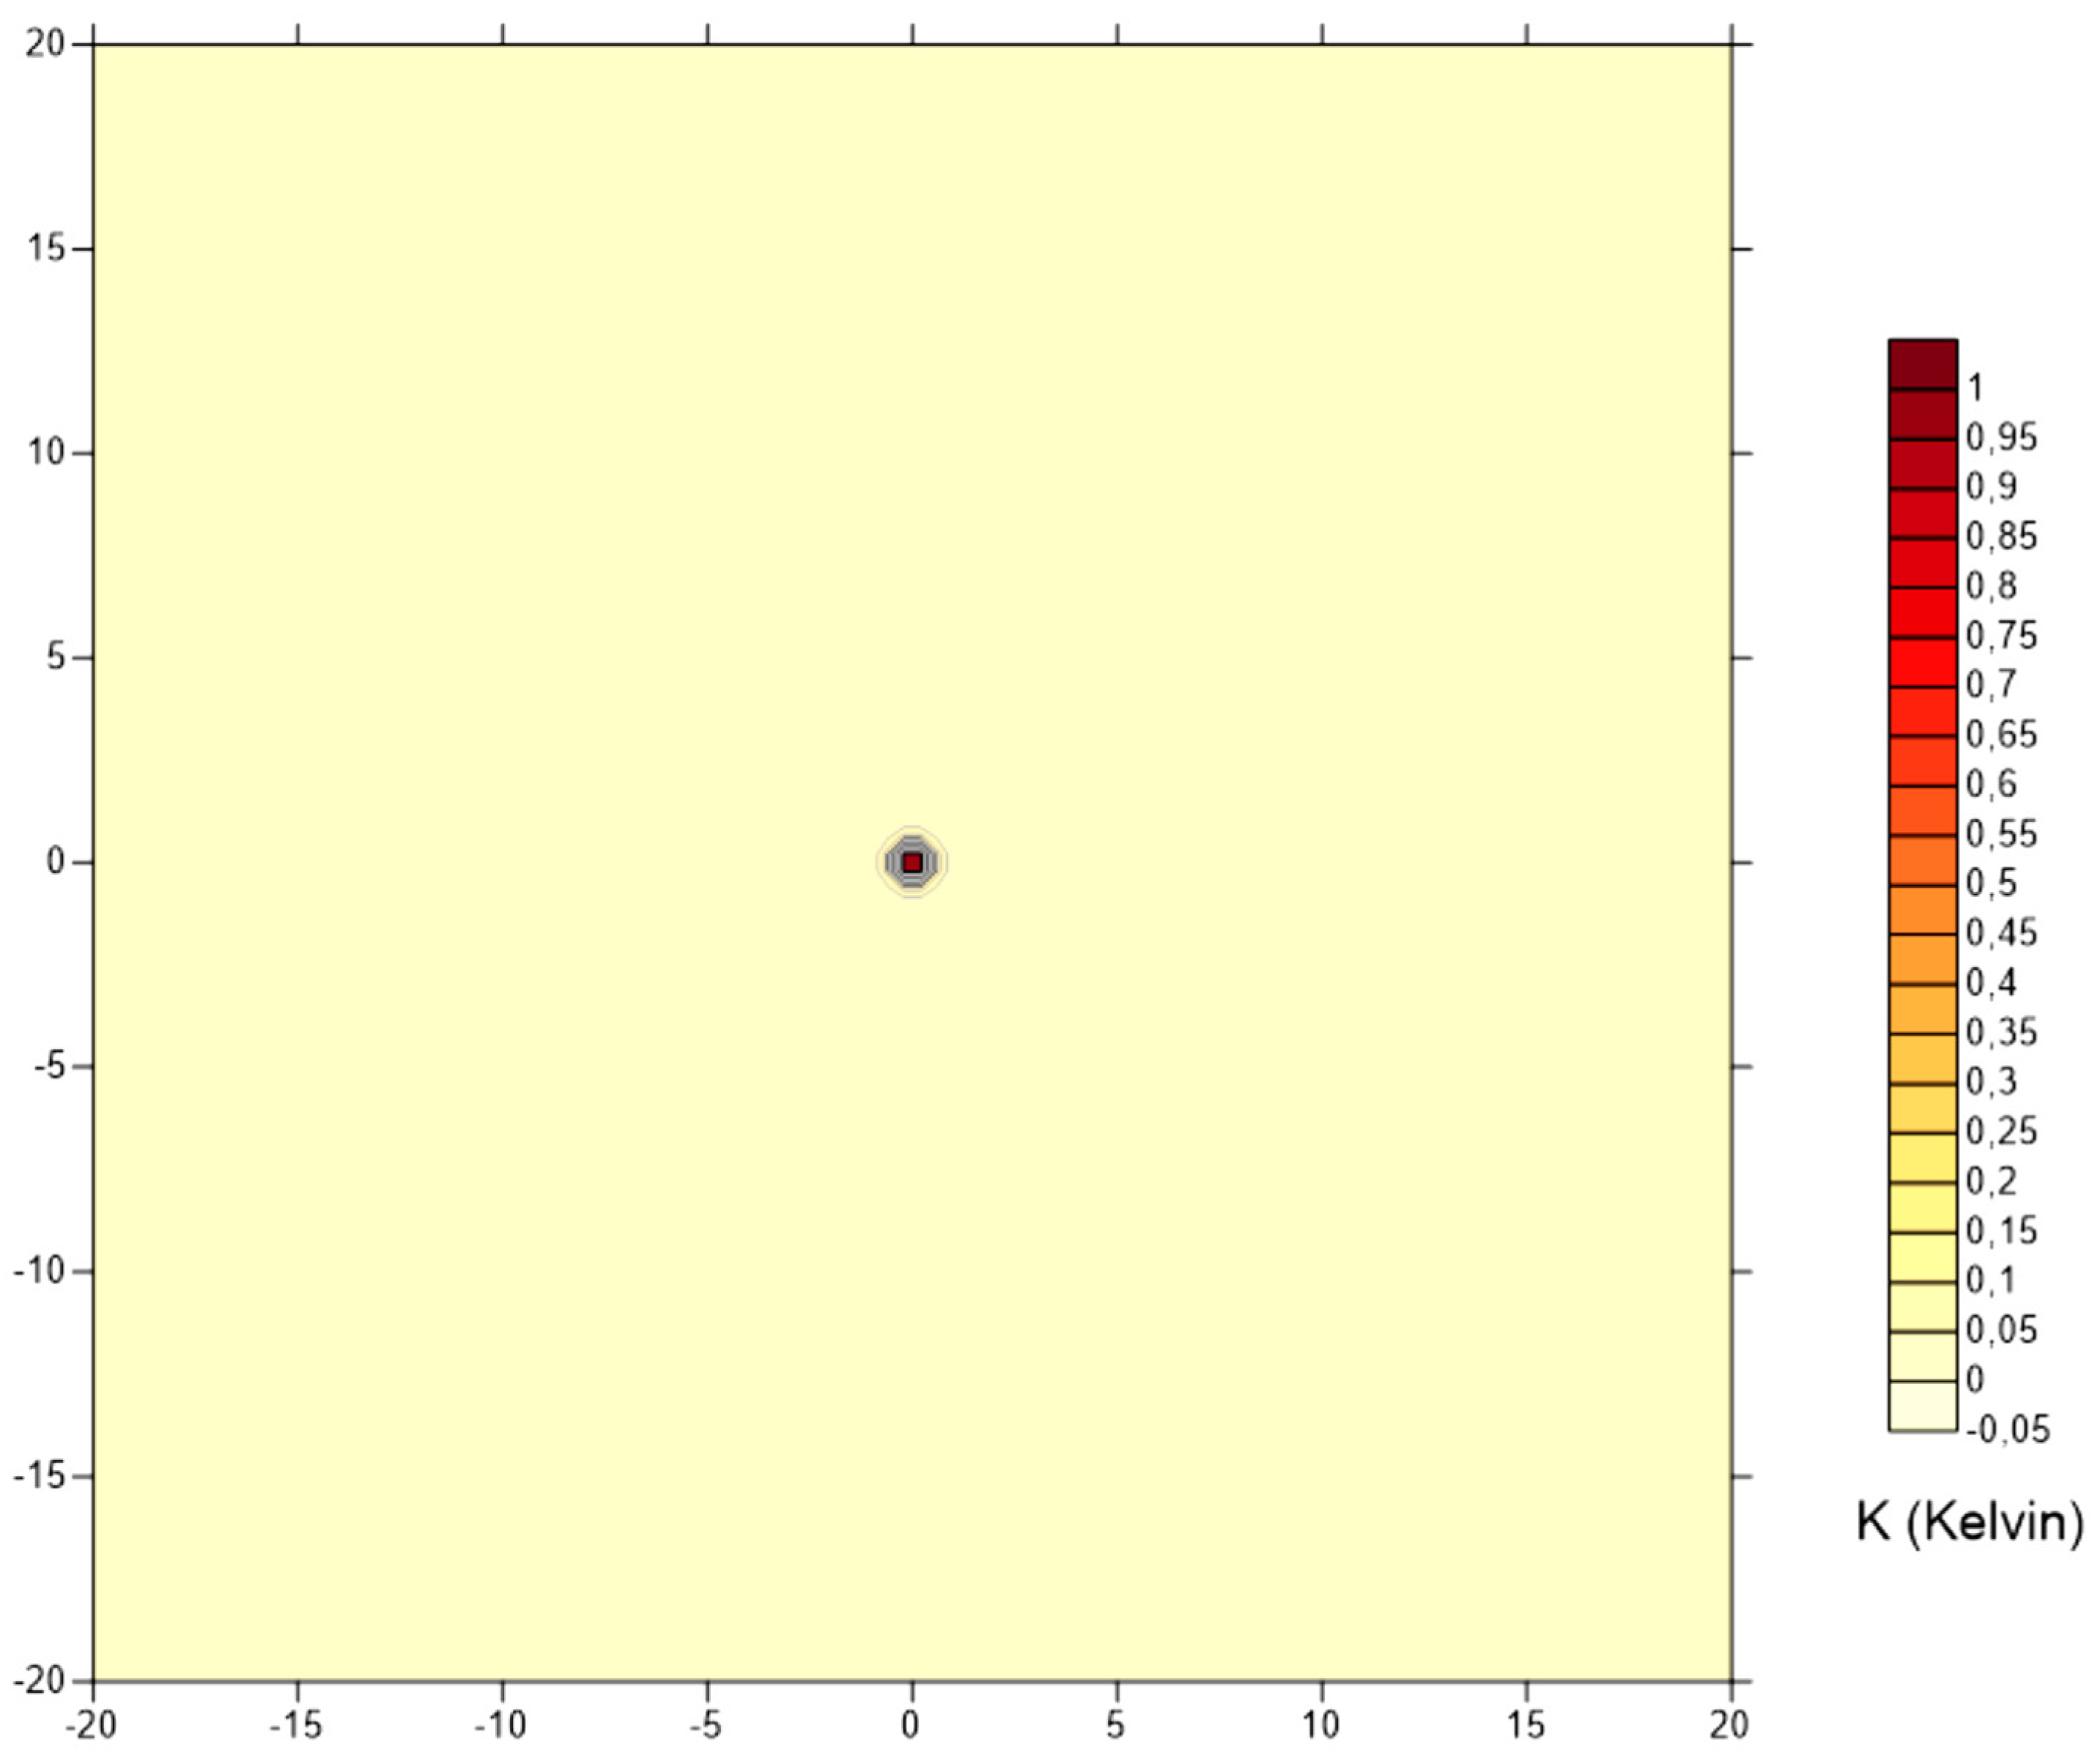
Equation (14) was approximated numerically by developing it into a finite series (Taylor polynomial) and imported into the Surfer programme, in which we constructed diagrams of heat dissipation at different times. The diagrams in Figure 10, Figure 11 and Figure 12 below show the heat dissipation expressed by the change in temperature in the vicinity of the well using the geosonde during 1 h, 10 h and 100 h, respectively.
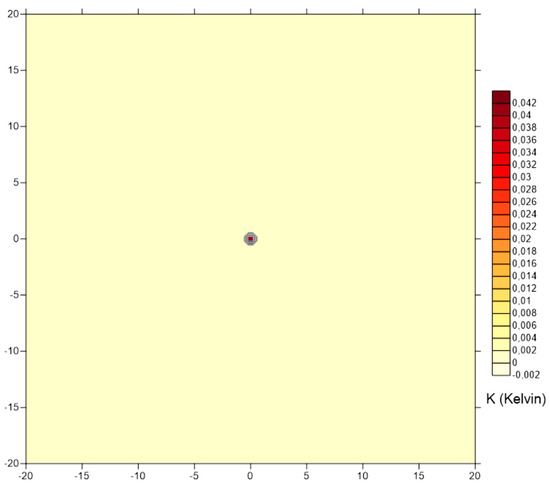
Figure 10.
Calculation of the influence of the geosonde on the lowering of the rock temperature, t = 1 h.
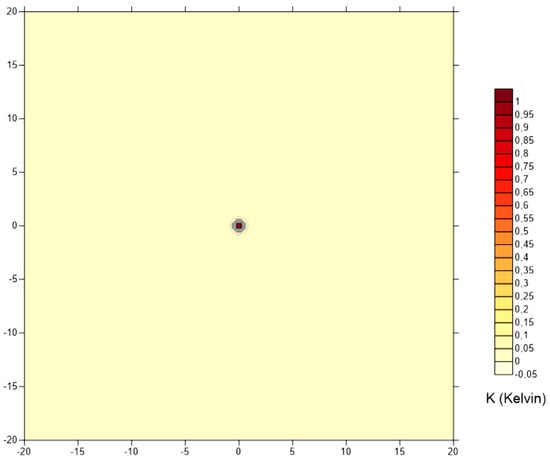
Figure 11.
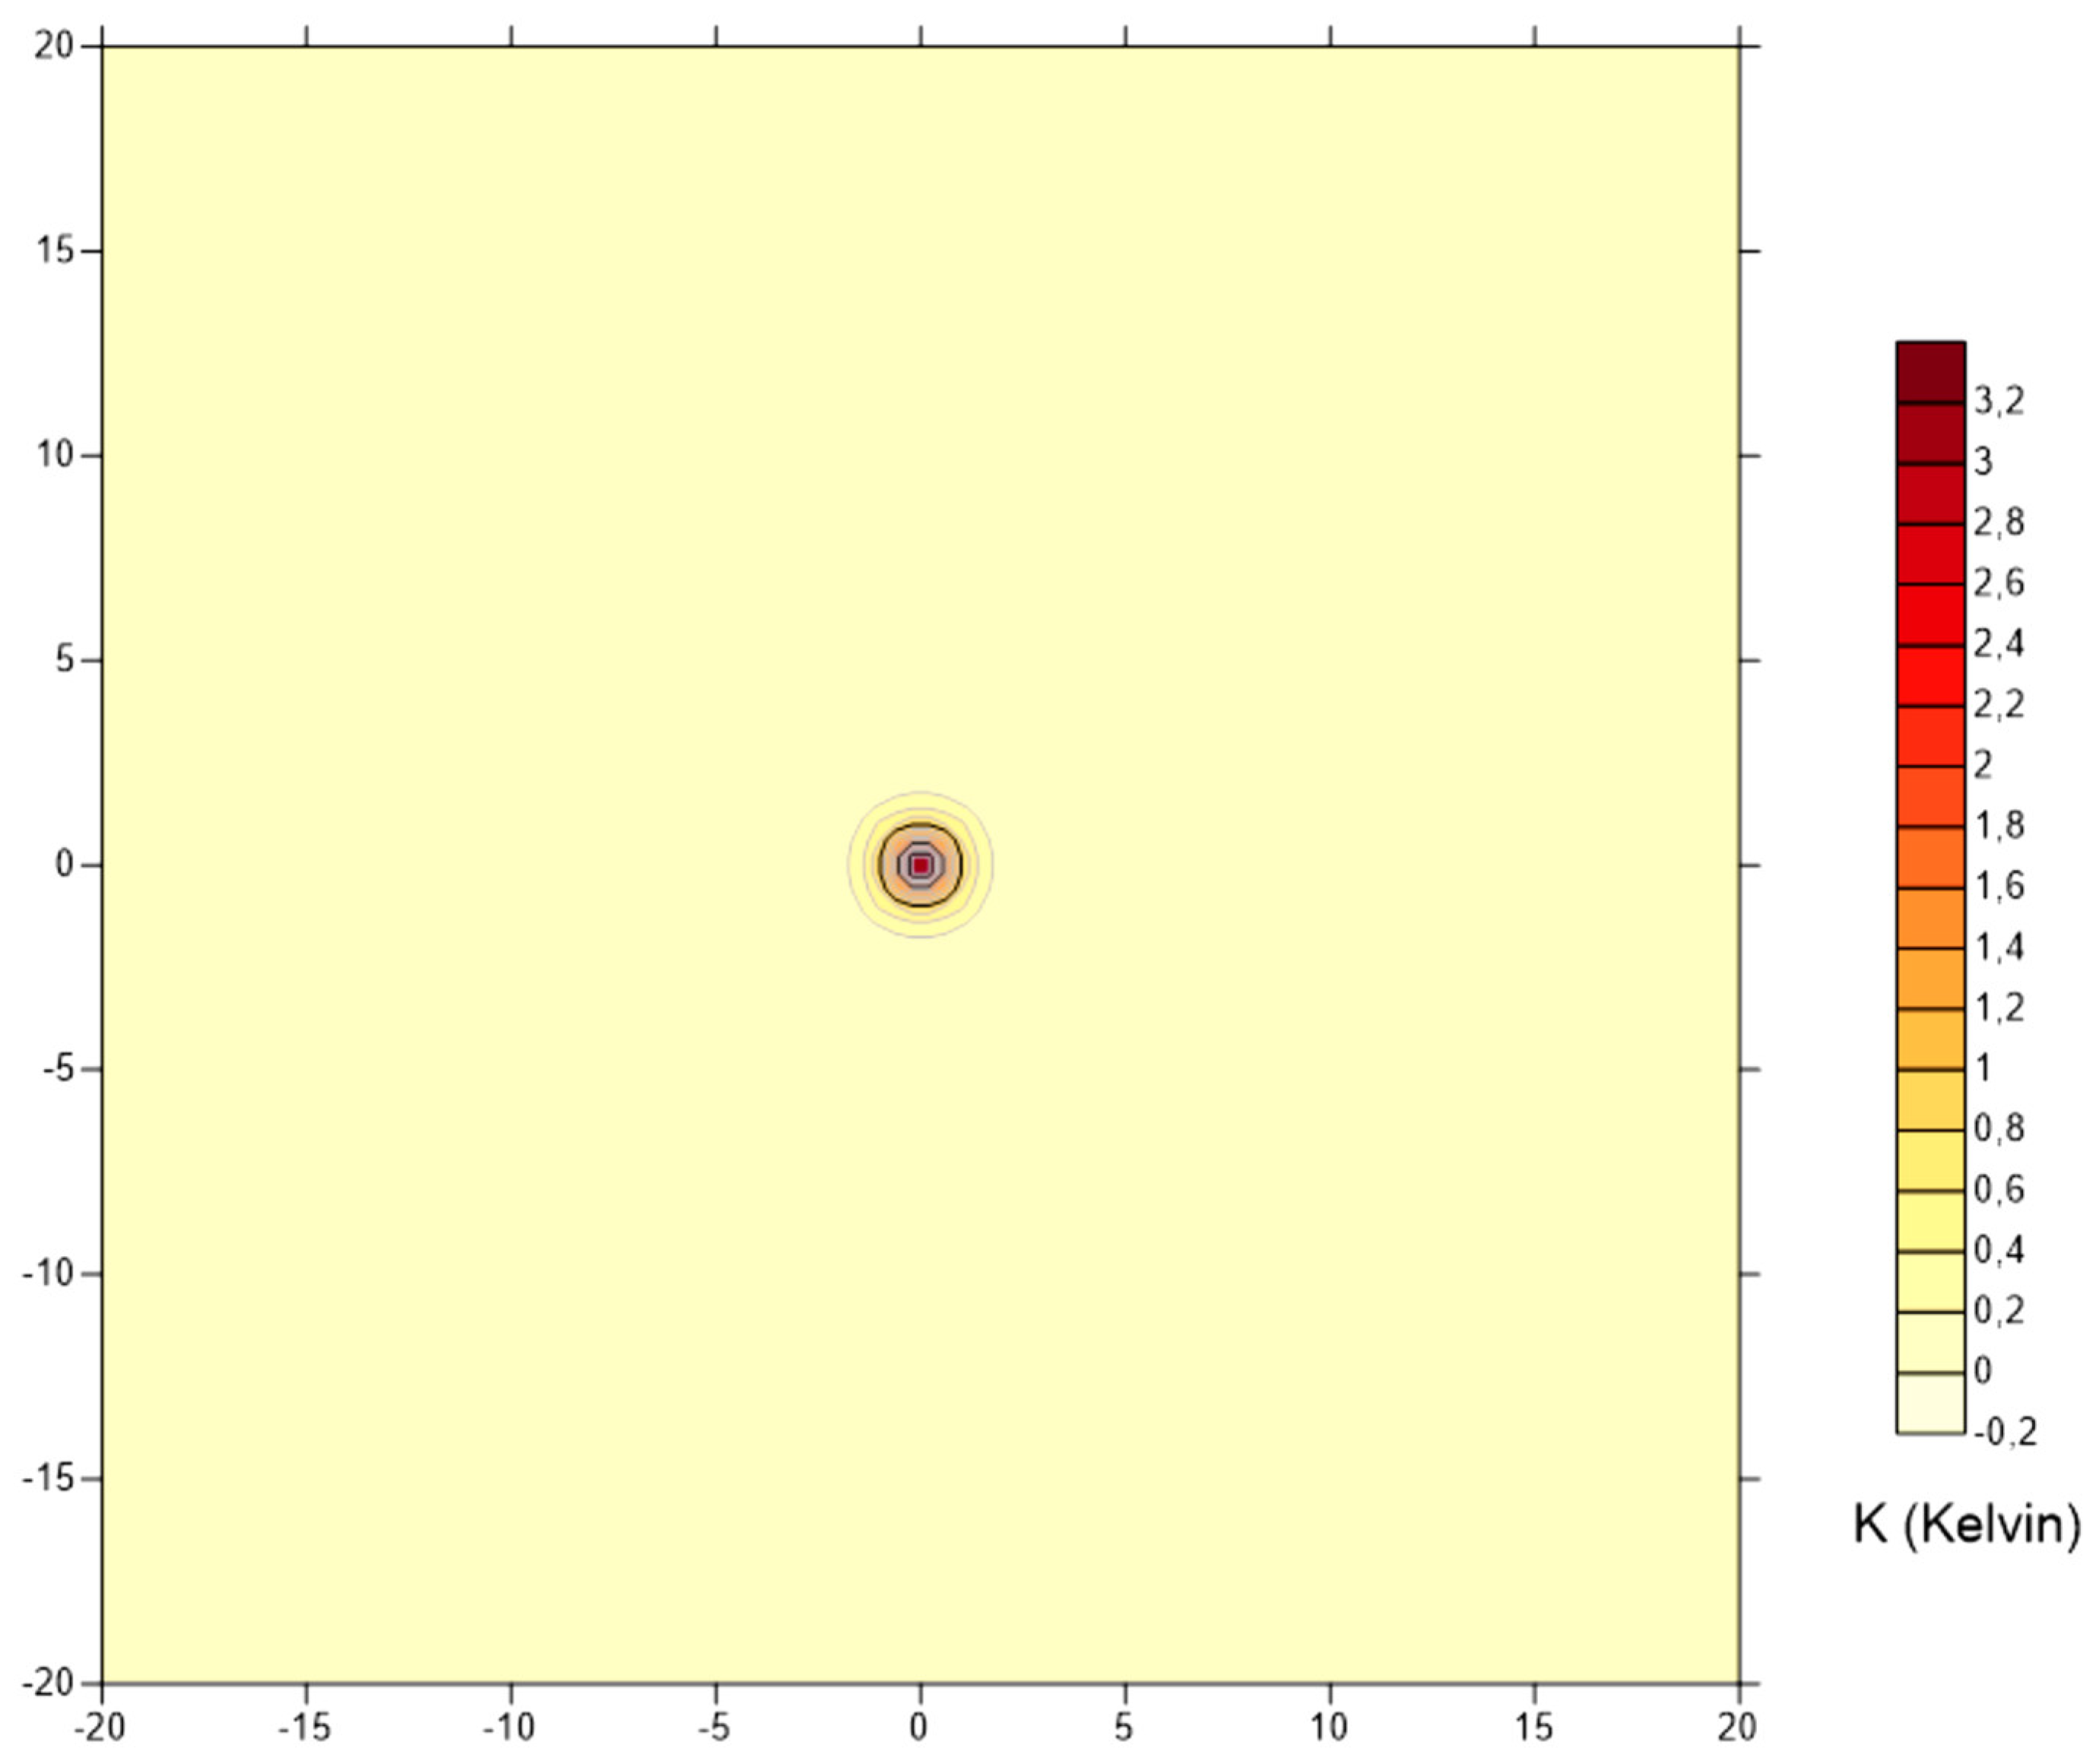
Calculation of the influence of the geosonde on the lowering of the rock temperature, t = 10 h.

Figure 12.
Calculation of the influence of the geosonde on the lowering of the rock temperature, t = 100 h.
Using the Surfer v.17 software, we created a geosonde model for the area and presented the results in the form of diagrams (Figure 10, Figure 11 and Figure 12). From the diagrams, it can be seen that the pumping is highest in the centre, then the pumping decreases quite rapidly as a function of time to a constant level (i.e., to a level where no heat is pumped). The diagrams show how the thermal pumping depends on the pumping time, with the funnel becoming clearly visible at times of 10 to 100 h. In this work, we have focussed on the case where the soil is isotropic, i.e., the thermal conductivity κ is the same in all directions. However, similar methods could also be used to solve the case where our soil is anisotropic. In this case, there is anisotropy in the horizontal direction, i.e., κ is no longer constant when we move horizontally. In this case, κℎ = κx/κy, where the coordinates x and y correspond to the main directions of heat conduction. By linear interpolation of such points, we obtain an ellipse representing all possible directions of anisotropy along the horizontal. The heat dissipation in this case is determined by calculating the values resulting from the solutions of the heat equation at each point of the ellipse.
3. Results
The groundwater heat pump (GWHP) from an energy perspective is shown in Figure 13. The most important parameter of a geothermal system is its thermal potential Pw [20]. The heat Pc obtained from the water/ground can be estimated using the following equation, where q is flow rate, ρw is the density of the water, cw is the specific heat of the water, and difference in temperature is ΔT [21]:
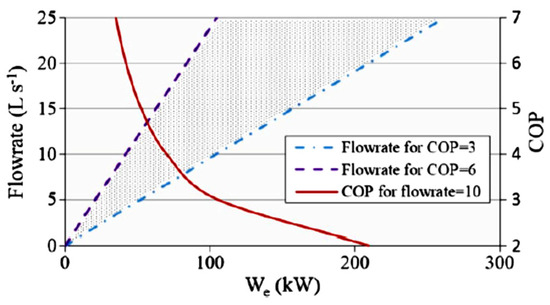
Figure 13.
Change in the electricity consumed by the heat pump as a function of the water flow rate (in litres per second) and the coefficient of performance.
The coefficient of performance (COP) is defined as the amount of heat emitted in relation to the required drive power. The thermal potential that can be extracted from the water with the aid of a heat pump is [22,23,24]:
The power consumption per unit of time is therefore:
The final thermal potential will be lower due to the heat generated in the compressor, taking into account that cooling is present [21]:
Figure 13 shows the application range of heat pumps in the water/water system up to an electrical output of 300 kW. In order to achieve outputs of up to the planned 2.7 MW, several heat pumps must be installed with a pump capacity of up to 9000 L/min in order to achieve the planned final heating power. The same applies to the rock/water system. The efficiency of the COP ground/water heat pumps is around 10% lower than that of the water/water system.
The utilisation of water from underground RTH facilities is primarily possible as a water/water system (with the used water flowing into the Sava River). With the water/water system, we can expect to obtain about 2.7 MW of heat energy from heat pumps at a COP between 4.5 and 5.5 (Figure 13 and Figure 14).
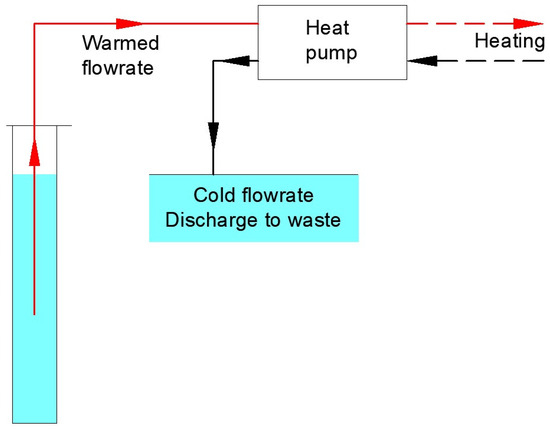
Figure 14.
Open circuit without re-injection system coal mine.
When using the rock/water system, the largest temperature anomaly in all scenarios occurs in the immediate vicinity of the geosonde, and its influence spreads radially and generally decreases with depth. The shape of the temperature anomaly depends on the hill layers overlain by the geosonde. In the presence of groundwater flows, the influential thermal plume moves away from the centre of the geosonde model with increasing Darcy velocity. The temperature anomalies decrease much faster with depth, as advective heat transfer dominates in the central part of the layer, which contributes to faster heat recovery. For the rock/water–geosonde system, about 7.5 kW of thermal energy can be extracted from a 150 m deep well.
4. Discussion
After the end of coal mining, ecological rehabilitation of the disused underground mines is necessary. Ecological remediation is necessary because it avoids negative impacts on the environment and preserves the underground water as an energy potential for the utilisation of shallow geothermal energy in the long term. Shallow geothermal energy can be utilised as an open system or in a closed circuit. In Slovenia, there are currently some disused coal mines that have been ecologically rehabilitated but are not utilised for shallow geothermal energy. By statistically processing the input parameters and mathematical modelling [25], we have shown the extraordinary potential of using shallow geothermal energy, which is possible in a larger global environment [20]. The most common results of the models analysed are the regimes of extracted water temperature and water pumping rate. With a larger number of operating regimes of the heat pumps, we can estimate what thermal power can be provided. It is ideal, for the efficiency of the systems, if they are also used for cooling buildings. The main factors that ensure optimal utilisation of the shallow geothermal energy of mine water are the flow and temperature of the water and the distance to the individual user [26]. If these conditions are met, it is a source that contributes to the sustainable utilisation and generation of thermal energy.
5. Conclusions
The research work presented in this article investigated the feasibility of utilising shallow geothermal energy in a closed coal mine. Primarily, water from aquifers can be utilised, flowing at a rate of about 9000 L/min through the drainage pipes in the audit of the collecting mine. The possibility of utilising a closed system with the geosonde was also presented in the study. In both cases, the aim is to utilise low-temperature sources via heat pumps for heating, sanitary water treatment and cooling of buildings located in the immediate vicinity of a disused mine. The quantities of thermal energy were also estimated in this paper. The water/water system delivers, on average, 2.7 MW of thermal energy, while the rock/water system delivers 7.5 kW of thermal energy from a 150 m deep well. Furthermore, by statistically processing the parameters for the amount of water pumped and the temperature, which averages 11 °C in winter, and by modelling the parameters, we have demonstrated that the potential of providing thermal energy from the abandoned RTH coal mine is reliable and sustainable. In the article, we have combined and analysed modelling methods (Surfer software), mathematical equations and the long-term statistical processing of data on groundwater flows and their temperatures. The method of using shallow geothermal energy from a disused coal mine can be a good example of a sustainable approach to reducing negative impacts on the climate when providing thermal energy for heating and cooling.
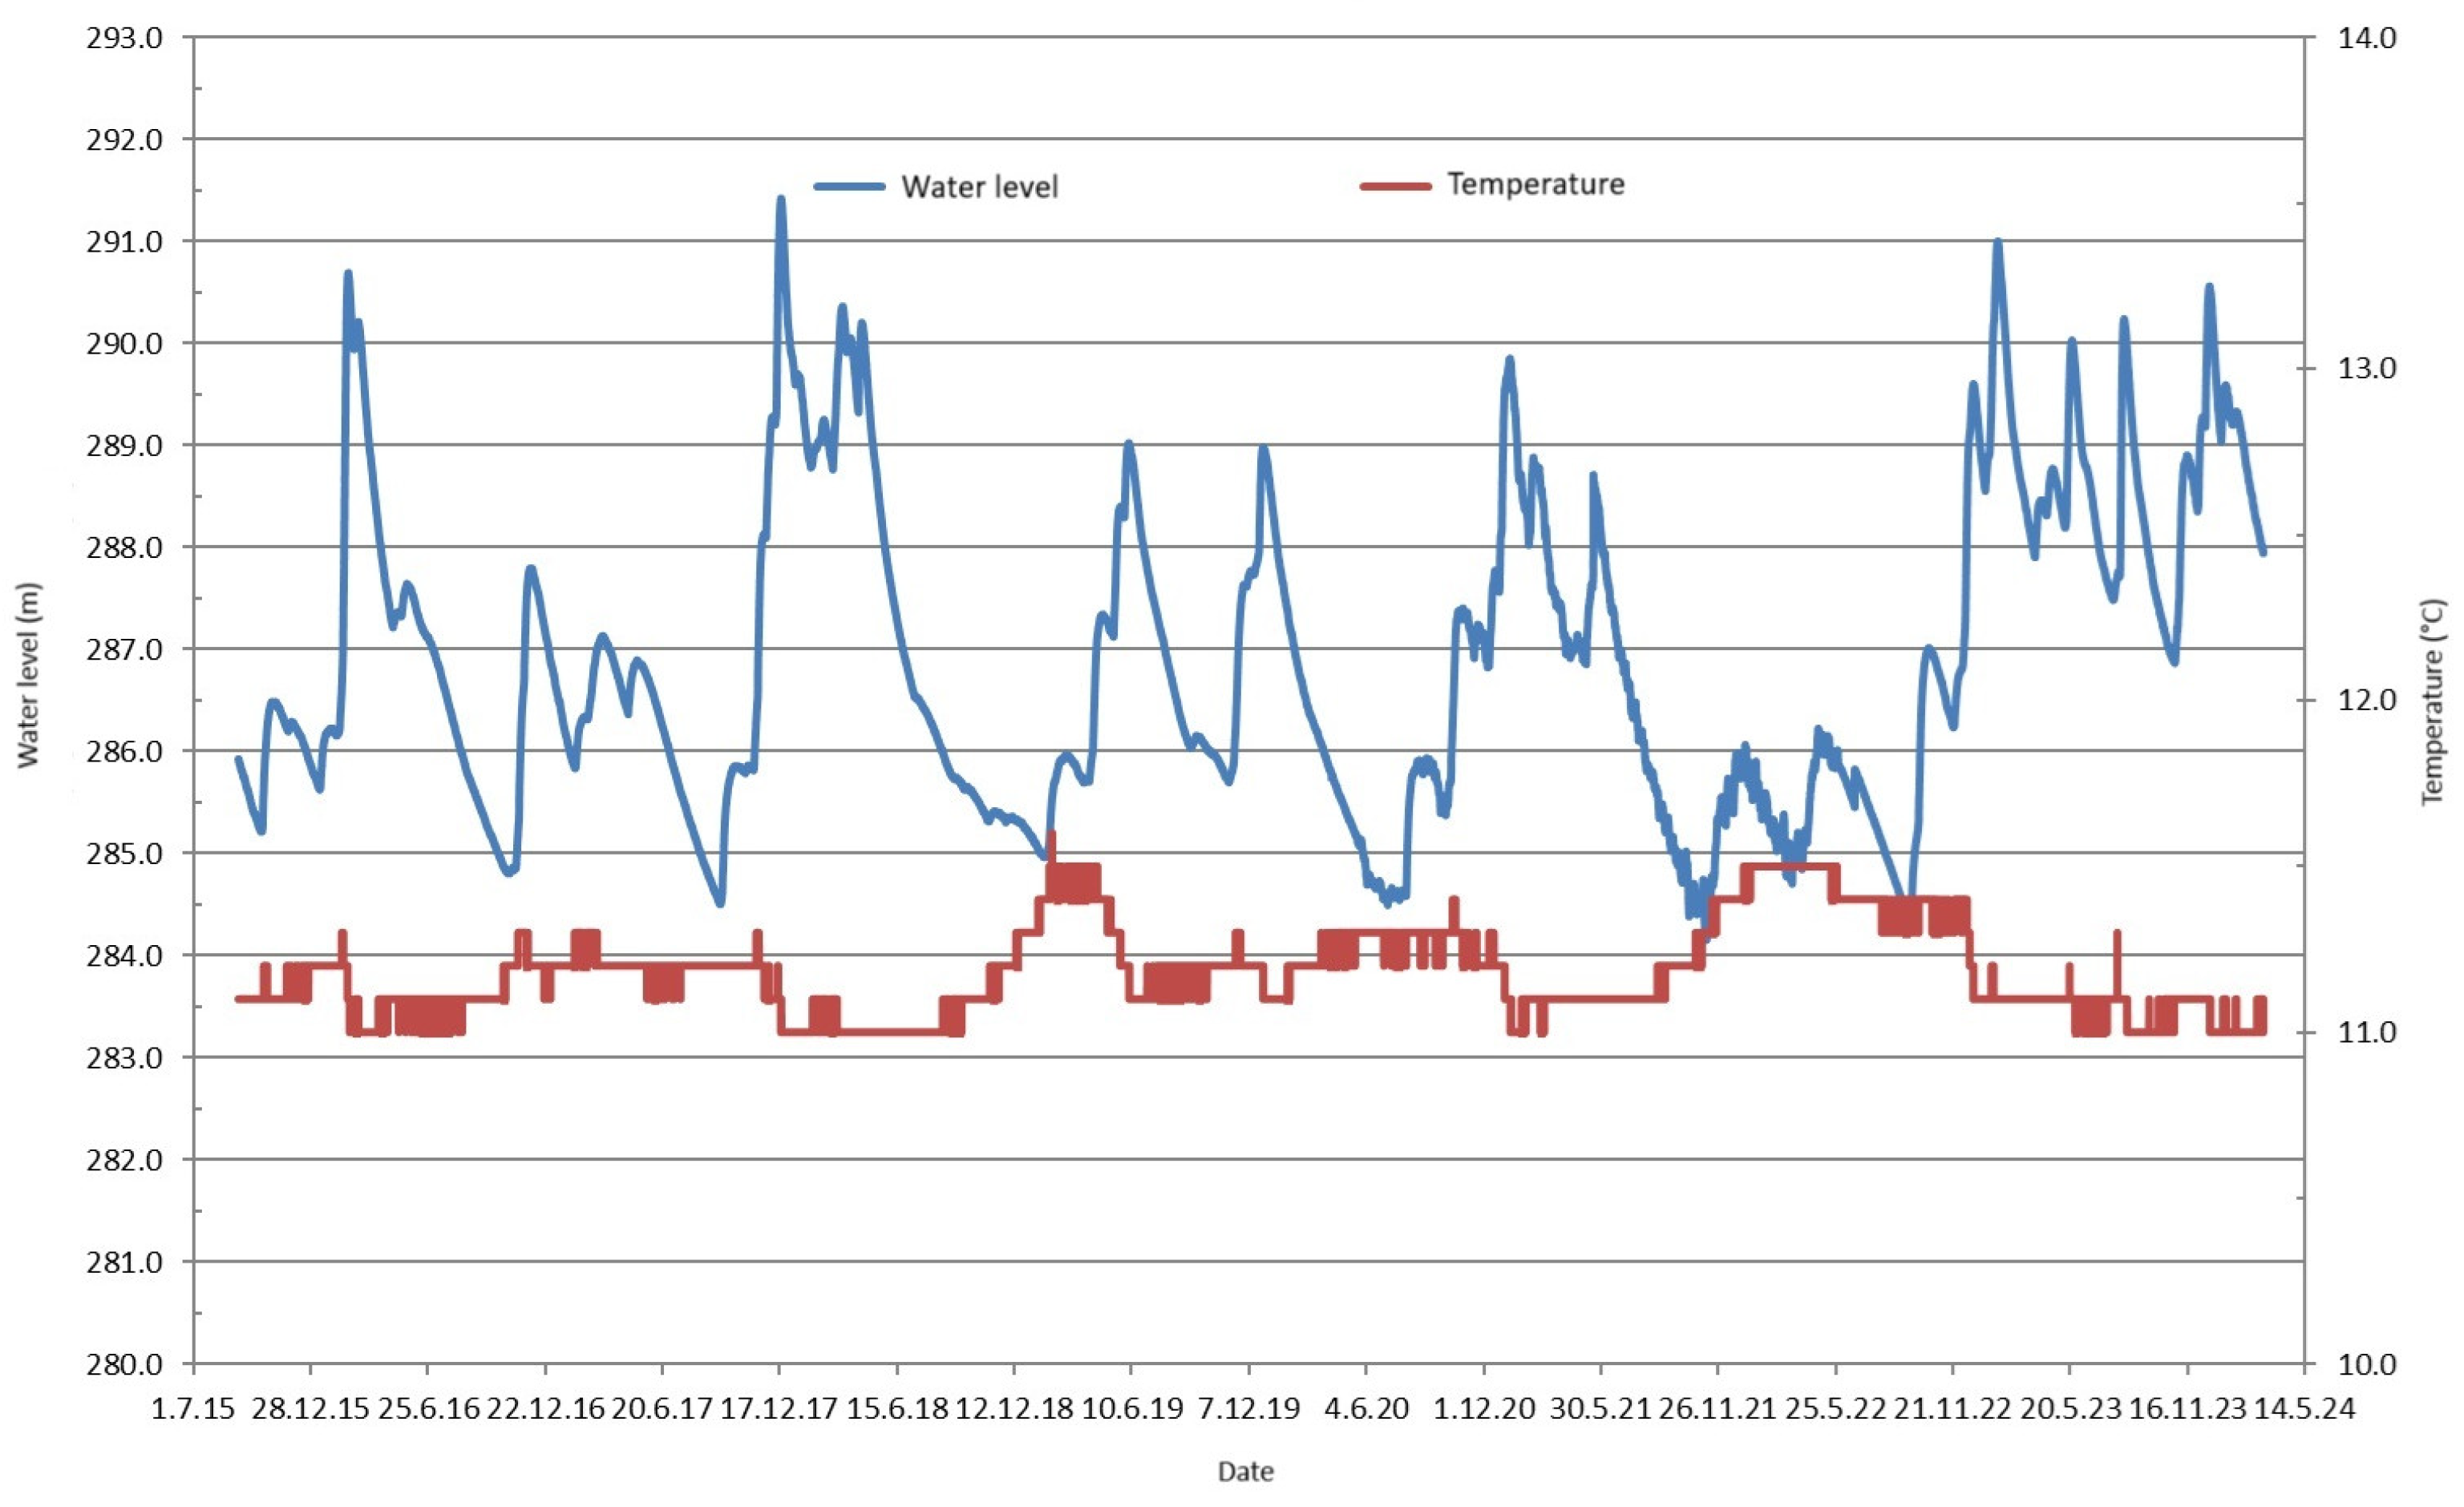
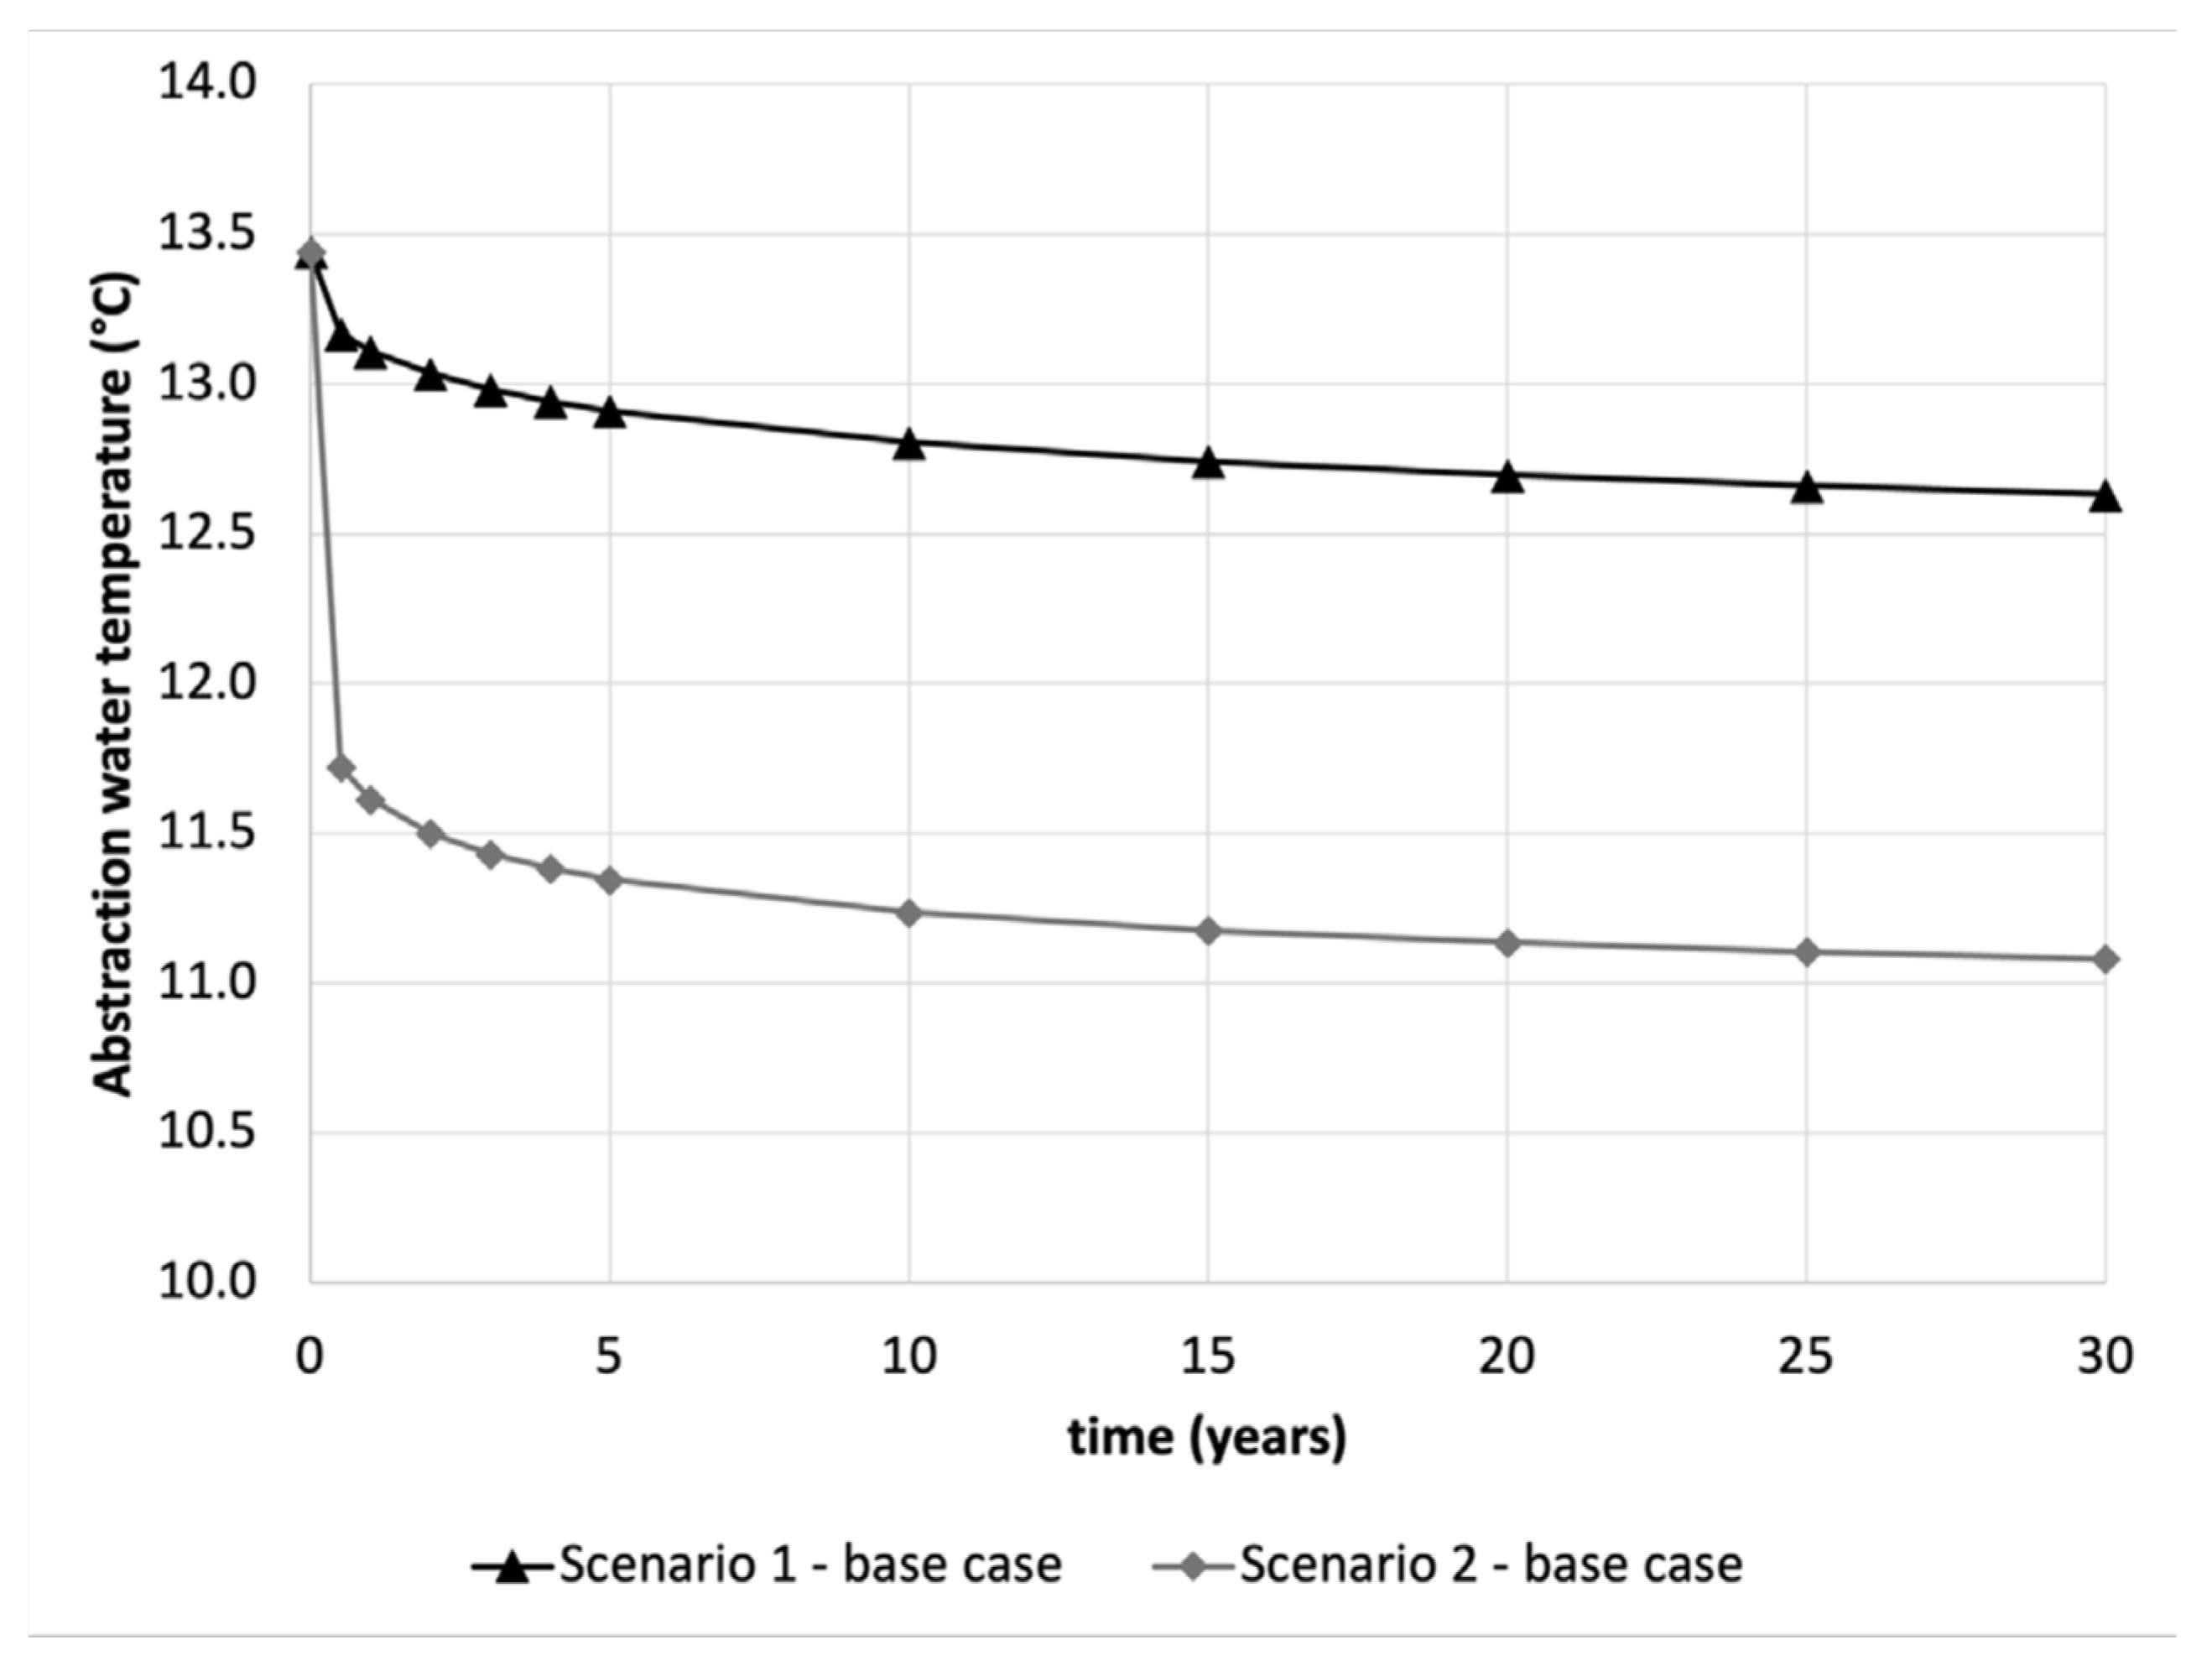
From the published article [27], we can adopt the following scenarios for a period of thirty years, assuming that our source is also thermally and quantitatively stable (Figure 15 and Figure 16). Scenario 1 assumes that the annual heat demand is evenly distributed over the entire area, and scenario 2 assumes that the peak demand of less than 10% of the year actually occurs all year round. At the site, the pump temperature is 13.44 °C and re-injection temperature is 10.00 °C.
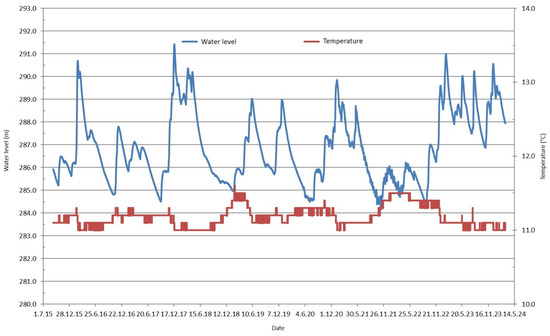
Figure 15.
Groundwater level and temperature in the period from 1 July 2015 to March 2024.

Figure 16.
Thermal efficiency of the system over several years.
Finally, it should be emphasised that the open water/water system, which is the most efficient, must be used primarily for heating and cooling requirements in the RTH area. Figure 16 shows that there are no significant temperature anomalies over a long period of up to 30 years when cooler water at a temperature of around 8 °C is pumped into an aquifer where the temperature is between 11 °C and 14 °C throughout the year. Utilizing the rock/water system for heating and cooling only makes sense in the RTH area where there are no conditions for the use of geothermal energy through the water/water system.
Author Contributions
Conceptualization, Ž.V. and J.Š.; methodology, Ž.V. and J.Š.; software, Ž.V. and J.Š.; validation, Ž.V. and J.Š.; formal analysis, Ž.V. and J.Š.; investigation Ž.V. and J.Š.; resources, Ž.V. and J.Š.; data curation, Ž.V. and J.Š.; writing—original draft preparation, Ž.V.; writing—review and editing, J.Š.; visualization, J.Š.; supervision, Ž.V. All authors have read and agreed to the published version of the manuscript.
Funding
This research received no external funding.
Data Availability Statement
The data presented in this study are available on request from the corresponding author.
Conflicts of Interest
The authors declare no conflicts of interest.
References
- Bechtel, A.; Markic, M.; Sachsenhofer, R.; Jelen, B.; Gratzer, R.; Lücke, A.; Püttmann, W. Paleoenvironment of the upper Oligocene Trbovlje coal seam (Slovenia). Int. J. Coal Geol. 2004, 57, 23–48. [Google Scholar] [CrossRef]
- Li, Q.; Liu, J.; Wang, S.; Guo, Y.; Han, X.; Li, Q.; Cheng, Y.; Dong, Z.; Li, X.; Zhang, X. Numerical insights into factors affecting collapse behavior of horizontal wellbore in clayey silt hydrate-bearing sediments and the accompanying control strategy. Ocean. Eng. 2024, 297, 117029. [Google Scholar] [CrossRef]
- Wang, Y.; Li, Q.; Dong, W.; Li, Q.; Wang, F.; Bai, H.; Zhang, R.; Owusu, A.B. Effect of different factors on the yield of epoxy-terminated polydimethylsiloxane and evaluation of CO2 thickening. RCS Adv. 2018, 70, 39787–39796. [Google Scholar] [CrossRef] [PubMed]
- Chiasson, A.D. Geothermal Heat Pump and Heat Engine Systems: Theory and Practice; Wiley: New York, NY, USA, 2016. [Google Scholar]
- European Commission. CORDIS Results Pack on Geothermal Energy, April 2020, A New and Viable Alternative Energy Source to Help Achieve Europe’s Climate Ambitions; European Commission: Brussels, Belgium, 2020. [Google Scholar]
- Diao, N.; Li, Q.; Fang, Z. Heat transfer in ground heat exchangers with groundwater advection. Int. J. Therm. Sci. 2004, 43, 1203–1211. [Google Scholar] [CrossRef]
- Lee, Y.; Yoon, W.; Jeon, J.; Koo, M.-H.; Keehm, Y. Numerical modeling of aquifer thermal energy storage system. Energy 2010, 35, 4955–4965. [Google Scholar] [CrossRef]
- Markič, M.; Kalan, Z.; Pezdič, J.; Faganeli, J. H/C versus O/C atomic ratio characterization of selected coals in Slovenia. Geologija 2007, 50, 403–426. [Google Scholar] [CrossRef]
- Premru, U. Geologic structure of central Slovenia. Geologija 1980, 2, 227–278. [Google Scholar]
- Vrzel, J.; Ludwig, R.; Vižintin, G.; Ogrinc, N. An Integrated Approach for Studying the Hydrology of the Ljubljansko Polje Aquifer in Slovenia and Its Simulation. Water 2019, 11, 1753. [Google Scholar] [CrossRef]
- Kranz, K.; Dillenardt, J. Mine water utilization for geothermal purposes in Freiberg, Germany: Determination of hydrogeological and thermophysical rock parameters. Mine Water Environ. 2010, 29, 68–76. [Google Scholar] [CrossRef]
- Andrews, B.J.; Cumberpatch, Z.A.; Shipton, Z.K.; Lord, R. Collapse processes in abandoned pillar and stall coal mines: Implications for shallow mine geothermal energy. Geothermics 2020, 88, 101904. [Google Scholar] [CrossRef]
- Solik-Heliasz, E.; Skrzypczak, S. Possibility of Energy Acquiring from Coal Mines in Low-Temperature Geothermal Power Plants. J. Min. Sci. 2013, 49, 611–617. [Google Scholar] [CrossRef]
- Albert, K.; Schulze, M.; Franz, C.; Koenigsdorff, R.; Zosseder, K. Thermal conductivity estimation model considering the effect of water saturation explaining heterogeneity of rock thermal conductivity. Geothermics 2017, 66, 1–12. [Google Scholar] [CrossRef]
- Kallesøe, A.J.; Vangkilde-Pedersen, T. (Eds.) Underground Thermal Energy Storage (UTES)—State-of-the-Art, Example Cases and Lessons Learned; HEATSTORE Project Report; GEOTHERMICA—ERA NET Cofund Geothermal: Reykjavík, Iceland, 2019; 130p, Available online: https://www.heatstore.eu/documents/HEATSTORE_UTES%20State%20of%20the%20Art_WP1_D1.1_Final_2019.04.26.pdf (accessed on 20 May 2024).
- Alzahrani, A.; Dincer, I. Performance assessment of an aquifer thermal energy storage system for heating and cooling applications. J. Energy Res. Technol. 2015, 138, 011901. [Google Scholar] [CrossRef]
- Malovrh, M. Zapiranje jamskih objektov RTH—jama Dol, jama Hrastnik, jama Ojstro, jama Trbovlje, Rudarski projekt. 2024; unpublished. [Google Scholar]
- Bertani, R. Geothermal power generation in the world 2010–2014 update report. In Proceedings of the World Geothermal Congress, Melburne, Australia, 19–25 April 2015. [Google Scholar]
- Stauffer, F.; Bayer, P.; Blum, P.; Giraldo, N.M.; Kinzelbach, W. Thermal Use of Shallow Groundwater; Taylor & Francis Ltd.: London, UK, 2013. [Google Scholar]
- Verhoeven, R.; Willems, E.; Harcouët-Menou, V.; De Boever, E.; Hiddes, L.; Veld, P.O.T.; Demollin, E. Minewater 2.0 project in Heerlen the Netherlands: Transformation of a geothermal mine water pilot project into a full scale hybrid sustainable energy infrastructure for heating and cooling. Energy Procedia 2014, 46, 58–67. [Google Scholar] [CrossRef]
- Preene, M.; Younger, P.L. Can you take the heat?—Geothermal energy in mining. Min. Technol. 2014, 123, 107–118. [Google Scholar] [CrossRef]
- Ochsner, K. Geothermal Heat Pumps. A Guide to Planning and Installing; Routledge: Abingdon, UK, 2008. [Google Scholar]
- Watzlaf, G.; Ackman, T. Underground mine water for heating and cooling using geothermal heat pump systems. Mine Water Environ. 2006, 25, 1–14. [Google Scholar] [CrossRef]
- Donovan, J.; Leavitt, B.; Ziemkiewicz, P.; Vandivort, T.; Werner, E. Flooding of abandoned underground Pittsburgh coal seam mines. In WV173 Phase IV EPA Region III Mine Pool Project. Final Report for DOE Contract DE/AM26-99FT40463; US Department of Energy: Pittsburgh, PA, USA, 2004; pp. 380–382. [Google Scholar]
- Mueller, M.H.; Huggenberger, P.; Epting, J. Combining monitoring and modelling tools as a basis for city-scale concepts for a sustainable thermal management of urban groundwater resources. Sci. Total Environ. 2018, 627, 1121–1136. [Google Scholar] [CrossRef] [PubMed]
- Sommer, W.T.; Doornenbal, P.J.; Drijver, B.C.; van Gaans, P.F.M.; Leusbrock, I.; Grotenhuis, J.T.C.; Rijnaarts, H.H.M. Thermal performance and heat transport in aquifer thermal energy storage. Hydrogeol. J. 2014, 22, 263–279. [Google Scholar] [CrossRef]
- Mouli-Castillo, J.; van Hunen, J.; MacKenzie, M.; Sear, T.; Adams, C. GEMSToolbox: A novel modelling tool for rapid screening of mines for geothermal heat extraction. Appl. Energy 2024, 360, 13. [Google Scholar] [CrossRef]


Disclaimer/Publisher’s Note: The statements, opinions and data contained in all publications are solely those of the individual author(s) and contributor(s) and not of MDPI and/or the editor(s). MDPI and/or the editor(s) disclaim responsibility for any injury to people or property resulting from any ideas, methods, instructions or products referred to in the content. |
© 2024 by the authors. Licensee MDPI, Basel, Switzerland. This article is an open access article distributed under the terms and conditions of the Creative Commons Attribution (CC BY) license (https://creativecommons.org/licenses/by/4.0/).