Abstract
Heavy metals play a crucial role in the environment due to their toxicity, persistence, and bioaccumulation ability, which can lead to severe ecological and health risks. This study aimed to investigate the impact of urbanization and agricultural practices on the heavy metal content in the sediments of the Bug River catchment. To this end, 96 surface sediment samples were collected from various points in the Bug River catchment, including from urban, agricultural, and forested areas. The samples for laboratory analysis were collected in July 2018, 2019, and 2020 in the Polish part of the Bug River watershed. Heavy metal (Zn, Pb, Cr, Ni, Cu, Fe, Mn, and Cd) concentrations were determined using atomic absorption spectroscopy (AAS). The geoaccumulation index (Igeo), contamination factor (CF), and pollution load index (PLI) were used to assess the degree of sediment contamination. The results indicate higher concentrations of heavy metals in urban sediments, where cadmium concentrations reached up to 2.5 mg/kg, compared to agricultural and forested areas, where concentrations were significantly lower. The average Igeo value for cadmium was 0.24 in agricultural areas and 0.15 in urban areas, suggesting the predominance of anthropogenic influences over natural sources. The highest PLI values were found in urban areas, reaching a maximum of 0.33, indicating higher pollution levels. Statistical analysis revealed that urban emissions and agricultural activities significantly influenced the presence of these metals in the Bug River sediments. This study’s conclusions emphasize that effective river water quality management requires continuous monitoring and an understanding of anthropogenic and natural pollution sources. The results contribute to a better understanding the interactions between human activities and water quality, crucial for planning protection and remediation strategies. Additionally, this study provides critical insights into optimizing pollution management strategies and developing remediation methods, serving local and regional policymakers in planning protective actions.
1. Introduction
Heavy metals are among the most studied, hazardous, and problematic pollutants. They can enter surface waters through natural rock-weathering processes and human activities [1,2]. The natural sources of heavy metals include processes such as the erosion of parent rocks and volcanic activity. In contrast, human activities can introduce heavy metals into surface waters via industrial wastewater, mine drainage, transportation, and agricultural runoff due to intensive fertilization, as well as tourism, aquaculture, and fishing activities [3,4,5,6,7]. The presence of heavy metals in the aquatic environment is mainly attributed to human activities. The rapid development of countries and cities, urbanization, and industrialization have led to the deterioration of surface water quality, including in increased contamination. Heavy metal contamination becomes particularly problematic in industrial regions, where concentrated manufacturing activities generate significant amounts of waste containing heavy metals that can exceed the natural capacity of the environment to neutralize them. The impact of these metals on the aquatic environment is long-lasting, as they tend to accumulate in river sediments, becoming a persistent source of pollution in aquatic ecosystems [8,9].
River sediments are particularly susceptible to heavy metal contamination. Metals from human activities usually occur in higher concentrations and can have a more toxic impact on aquatic fauna and flora than those from natural sources. They can bioaccumulate in aquatic organisms and enter the food chain, potentially significantly affecting human health [10,11]. Heavy metals, which are not biodegradable, undergo biotransformation through the complex physicochemical and biological processes in aquatic ecosystems [12]. These processes are crucial for determining the mobility and bioavailability of heavy metals in the water–sediment–river system [13,14]. These phenomena are particularly significant in areas where natural buffering mechanisms, such as the binding of metals by sediments rich in organic matter or metal oxides, are overwhelmed by the continuous inputs of pollutants. Therefore, monitoring river sediments is fundamental for assessing the state of contamination and the ecotoxicological risk posed to aquatic environments and public health. Analyzing the chemical composition of sediments not only allows for the identification of current contaminants but also for predicting future changes in their accumulation or dispersion. A long-term perspective on surface water quality management should effectively consider both point and diffuse sources of heavy metal pollution to minimize their impact on river ecosystems. Understanding and controlling these processes are crucial for developing pollution management strategies and protecting water resources [10,14].
Heavy metals are characterized by low water solubility, which facilitates sedimentation and accumulation in river sediments. The migration of heavy metals in a river system mainly depends on sediments, particularly their organic matter content and granulometric composition [15,16]. The presence and concentration of heavy metals in river sediments are linked to the influence of diverse pollution sources and the geological structure and climatic conditions affecting the natural erosional processes of parent rocks. Each catchment area has a unique pattern of delivering pollutants, including heavy metals, to surface waters, primarily depending on the type and density of pollution sources [17]. Land use practices play a significant role in water and riverbed sediment contamination. In addition to land use methods, the landscape structure of a catchment is also crucial for river contamination with heavy metals. It should be noted that due to the overlapping of natural and anthropogenic influences and natural river processes, the content of heavy metals in the same riverbed can vary significantly [18].
River sediments are an essential source of information regarding the degree of anthropogenic pressure in the aquatic environment, and their chemical composition is an essential indicator of the geochemical situation in the river catchment area [19]. The accumulation of heavy metals in sediments is regulated by various processes, depending on the properties of the sediments and the metals. These processes include the sorption and complexation of fine particles such as clay minerals, iron and manganese oxides, and organic matter, as well as coprecipitation with other elements [20]. The physicochemical properties of sediments, such as pH, carbonate content, organic matter, and redox potential, can significantly influence the processes of heavy metal accumulation [21].
These properties, which vary depending on environmental conditions and human activities, shape sediments’ ability to immobilize or release heavy metals into river water. Understanding these mechanisms is crucial for assessing the risks associated with heavy metals in the natural environment and developing effective remediation methods and water quality management strategies [18,20].
The significantly higher concentrations of heavy metals in sediments than in water allow for detecting changes at relatively low contamination levels. Moreover, the chemical composition of sediments often serves as a more reliable indicator of water contamination than the chemical composition of water, which exhibits more significant temporal variability [1]. At the same time, sediments’ role in assessing the aquatic environment’s state is becoming increasingly important, as the direct relationship between the quality of river sediments and the state of water contamination is undeniable [9,13,16,21,22].
As urban areas expand and agricultural practices become more intensive, they significantly contribute to the quantity and diversity of heavy metals entering water bodies. These activities introduce traditional contaminants and newer, less-studied compounds that can have unforeseen effects on aquatic ecosystems [7,19]. Additionally, the interactions between different sources of pollution, such as industrial wastewater combined with stormwater runoff in urban areas, can lead to synergistic effects, increasing the mobility and toxicity of heavy metals in river sediments [21,22]. Recent geochemical modeling and monitoring advancements have begun to unravel these complex interactions, providing deeper insights into the transport and fate of sediment-associated heavy metals. Studies utilizing isotopic signatures and advanced spectroscopic techniques have revealed that the bioavailability and toxicity of metals are primarily dependent on sediment chemistry, which is significantly altered by urban and agricultural runoff [16,22].
This study constituted a comprehensive examination of the concentration and distribution of heavy metals within the sediments of the Bug River, incorporating analyses across varied catchment management contexts, including urban, agricultural, and forested areas. This study meticulously explored the impact of human activities, such as urbanization, agriculture, and industrial emissions, on the presence of heavy metals in the sediments. This provides an enhanced understanding of the relationship between environmental quality and anthropogenic activities. Furthermore, our research distinguishes itself in the scholarly landscape by focusing on the Bug River catchment as a transboundary resource, which is crucial for international water resource management. Utilizing a combination of geochemical indicators, including Igeo, CF, and PLI, allowed for a more precise evaluation of pollution levels and ecological risks, significantly contributing to environmental management practices. Our findings lay the groundwork for developing strategies to protect water from heavy metal pollution, applicable both locally and in other global regions. Employing such interdisciplinary and advanced research methodologies delivers a valuable addition to the evolving knowledge regarding the impact of human activities on aquatic environments, essential in the face of escalating environmental challenges.
This work aimed to examine the interplay between natural conditions and human activity concerning the accumulation of metals such as Pb, Cr, Cu, Zn, Ni, Cd, Fe, and Mn in the sediments of the Bug River and its tributes. This research centered on identifying the local sources and factors influencing heavy metal concentration and spatial accumulation. A pivotal element of this study was evaluating sediment contamination levels using geochemical indicators like Igeo, CF, and PLI.
2. Materials and Methods
2.1. Research Area
The Bug River ranks as Poland’s fourth largest river and is a critical transboundary watercourse in central and eastern Europe. It stretches over 772 km and encompasses a catchment area of 39,420 km2. Of this, the most significant part lies on Polish territory, 19,400 km2 (49.2%). Ukraine accounts for 10.8 thousand km2 (27.4%) of the catchment area, while Belarus accounts for 9.2 thousand km2 (23.3%). The Bug River catchment area includes several geological and physiographical regions. The main tributaries of the Bug River in Poland are the Liwiec River, 126.2 km; Brok River, 72.9 km’ Cetynia River, 37.27 km; Nurzec River, 100.2 km; Toczna River, 39.7 km; Kamianka River, 27.0 km; Krzna River, 107.5 km; Włodawka River, 52.8 km; Uherka River, 46.65 km; Udal River, 32.56 km; Huczwa River, 79.0 km; and Bukowa River, 24.78 km. The Bug River is primarily characterized as lowland, exhibiting minimal gradient. The riverbed includes numerous meanders and oxbow lakes. The river valley is characterized by a high degree of naturalness. The Bug is one of those few rivers in Europe whose valleys have retained their natural characteristics to this day, altered only slightly by humans. In the catchment area are fragments of the Biala Forest, the Kamieniecka Forest, and the Nadbużański Landscape Park, as well as several reserves. Fourteen per cent of the Bug River basin area is under legal protection. Arable fields dominate in the Bug River catchment area (50.3%). Meadows and pastures cover 17.7%, while forests occupy 23.5% of the watershed area. There are three larger towns: Siedlce (72,858 inhabitants), Chełm (69,016), and Biała Podlaska (55,424), with predominantly small populations. The tourism sector is well developed. The food industry stands out as the most advanced sector.
Additionally, within the catchment area, the other industries include tanning, glass, ceramic, machinery and metalworking, light industry, cement, and electrical engineering. Furthermore, the Bug River and its tributaries receive treated wastewater from municipal and industrial treatment plants. Sewage from Ukraine from mines and industrial plants is also a polluting factor.
The topography of the Bug River catchment, spanning across Poland, Belarus, and Ukraine, is diverse, significantly influencing the hydrology and ecology of the region. The river originates in western Ukraine and discharges into the Vistula River, Poland’s main river. The Bug River begins in the Roztocze area, which features varied terrain. The source area is situated at approximately 345 m above sea level. The terrain at the source is characterized by a hilly landscape with numerous elevations that gradually descend toward the northwest. In the middle course, passing through the Lublin Upland, the Bug flows about 180–200 m above sea level. The river also crosses the Podlaskie Plain, where the elevation decreases, reaching about 150–170 m above sea level. In these areas, the river meanders, forming broad flood valleys, crucial for local ecosystems. In the river’s lower course, the terrain becomes even flatter. From Wyszków to its confluence with the Vistula, the Bug flows through lowland areas, where the elevation hovers around 50–70 m above sea level. This section is characterized by extensive wetlands and numerous old river channels, which play essential ecological and hydrological functions.
The Bug River exhibits a lowland regime, with river flow primarily shaped by precipitation and snowmelt, leading to spring floods. The topographic gradient influences the river’s flow dynamics, where higher regions experience faster flows that may contribute to erosion, while in lower terrains, the flow becomes slower, favoring sedimentation. The flow is relatively lower in the upper course of the river, where it originates and flows through areas with steeper slopes and less water retention. The average flow in this section can range from about 5 to 15 m3/s. In the middle section, where the river passes through areas with better water retention, average flow rates are around 30–70 m3/s. The river is broader and deeper in this section, and its channel is more developed. The average flow ranges from 60 to over 100 m3/s in the lower course.
The Bug River catchment features a moderate climate with continental influences, typical for central and eastern Europe. Average summer temperatures range from about 18 °C to 24 °C, while winters are usually cold, with average temperatures from −6 °C to 2 °C, and temperatures can drop below −20 °C. The average annual precipitation varies from 500 mm to 700 mm, with higher amounts of precipitation occurring in the upper parts of the catchment. The heaviest rainfall usually occurs from June to August, often in the form of storms, which can lead to sudden increases in river water levels. The climate in the Bug River catchment exhibits distinct seasonality, with warm, humid summers and cold, dry winters. Spring and autumn are typically moderate and serve as transitional periods between temperature extremes. The Bug River catchment’s climate directly affects the river’s hydrological regime, contributing to seasonal flow variations. The river flow is usually lower in winter, partly due to freezing and snow accumulation, which melts in spring, often increasing water levels. In summer, the river can quickly react with increased flow in response to intense rainfall and storms, posing a risk of local flooding.
2.2. River Sediment Sampling and Analytical Procedures
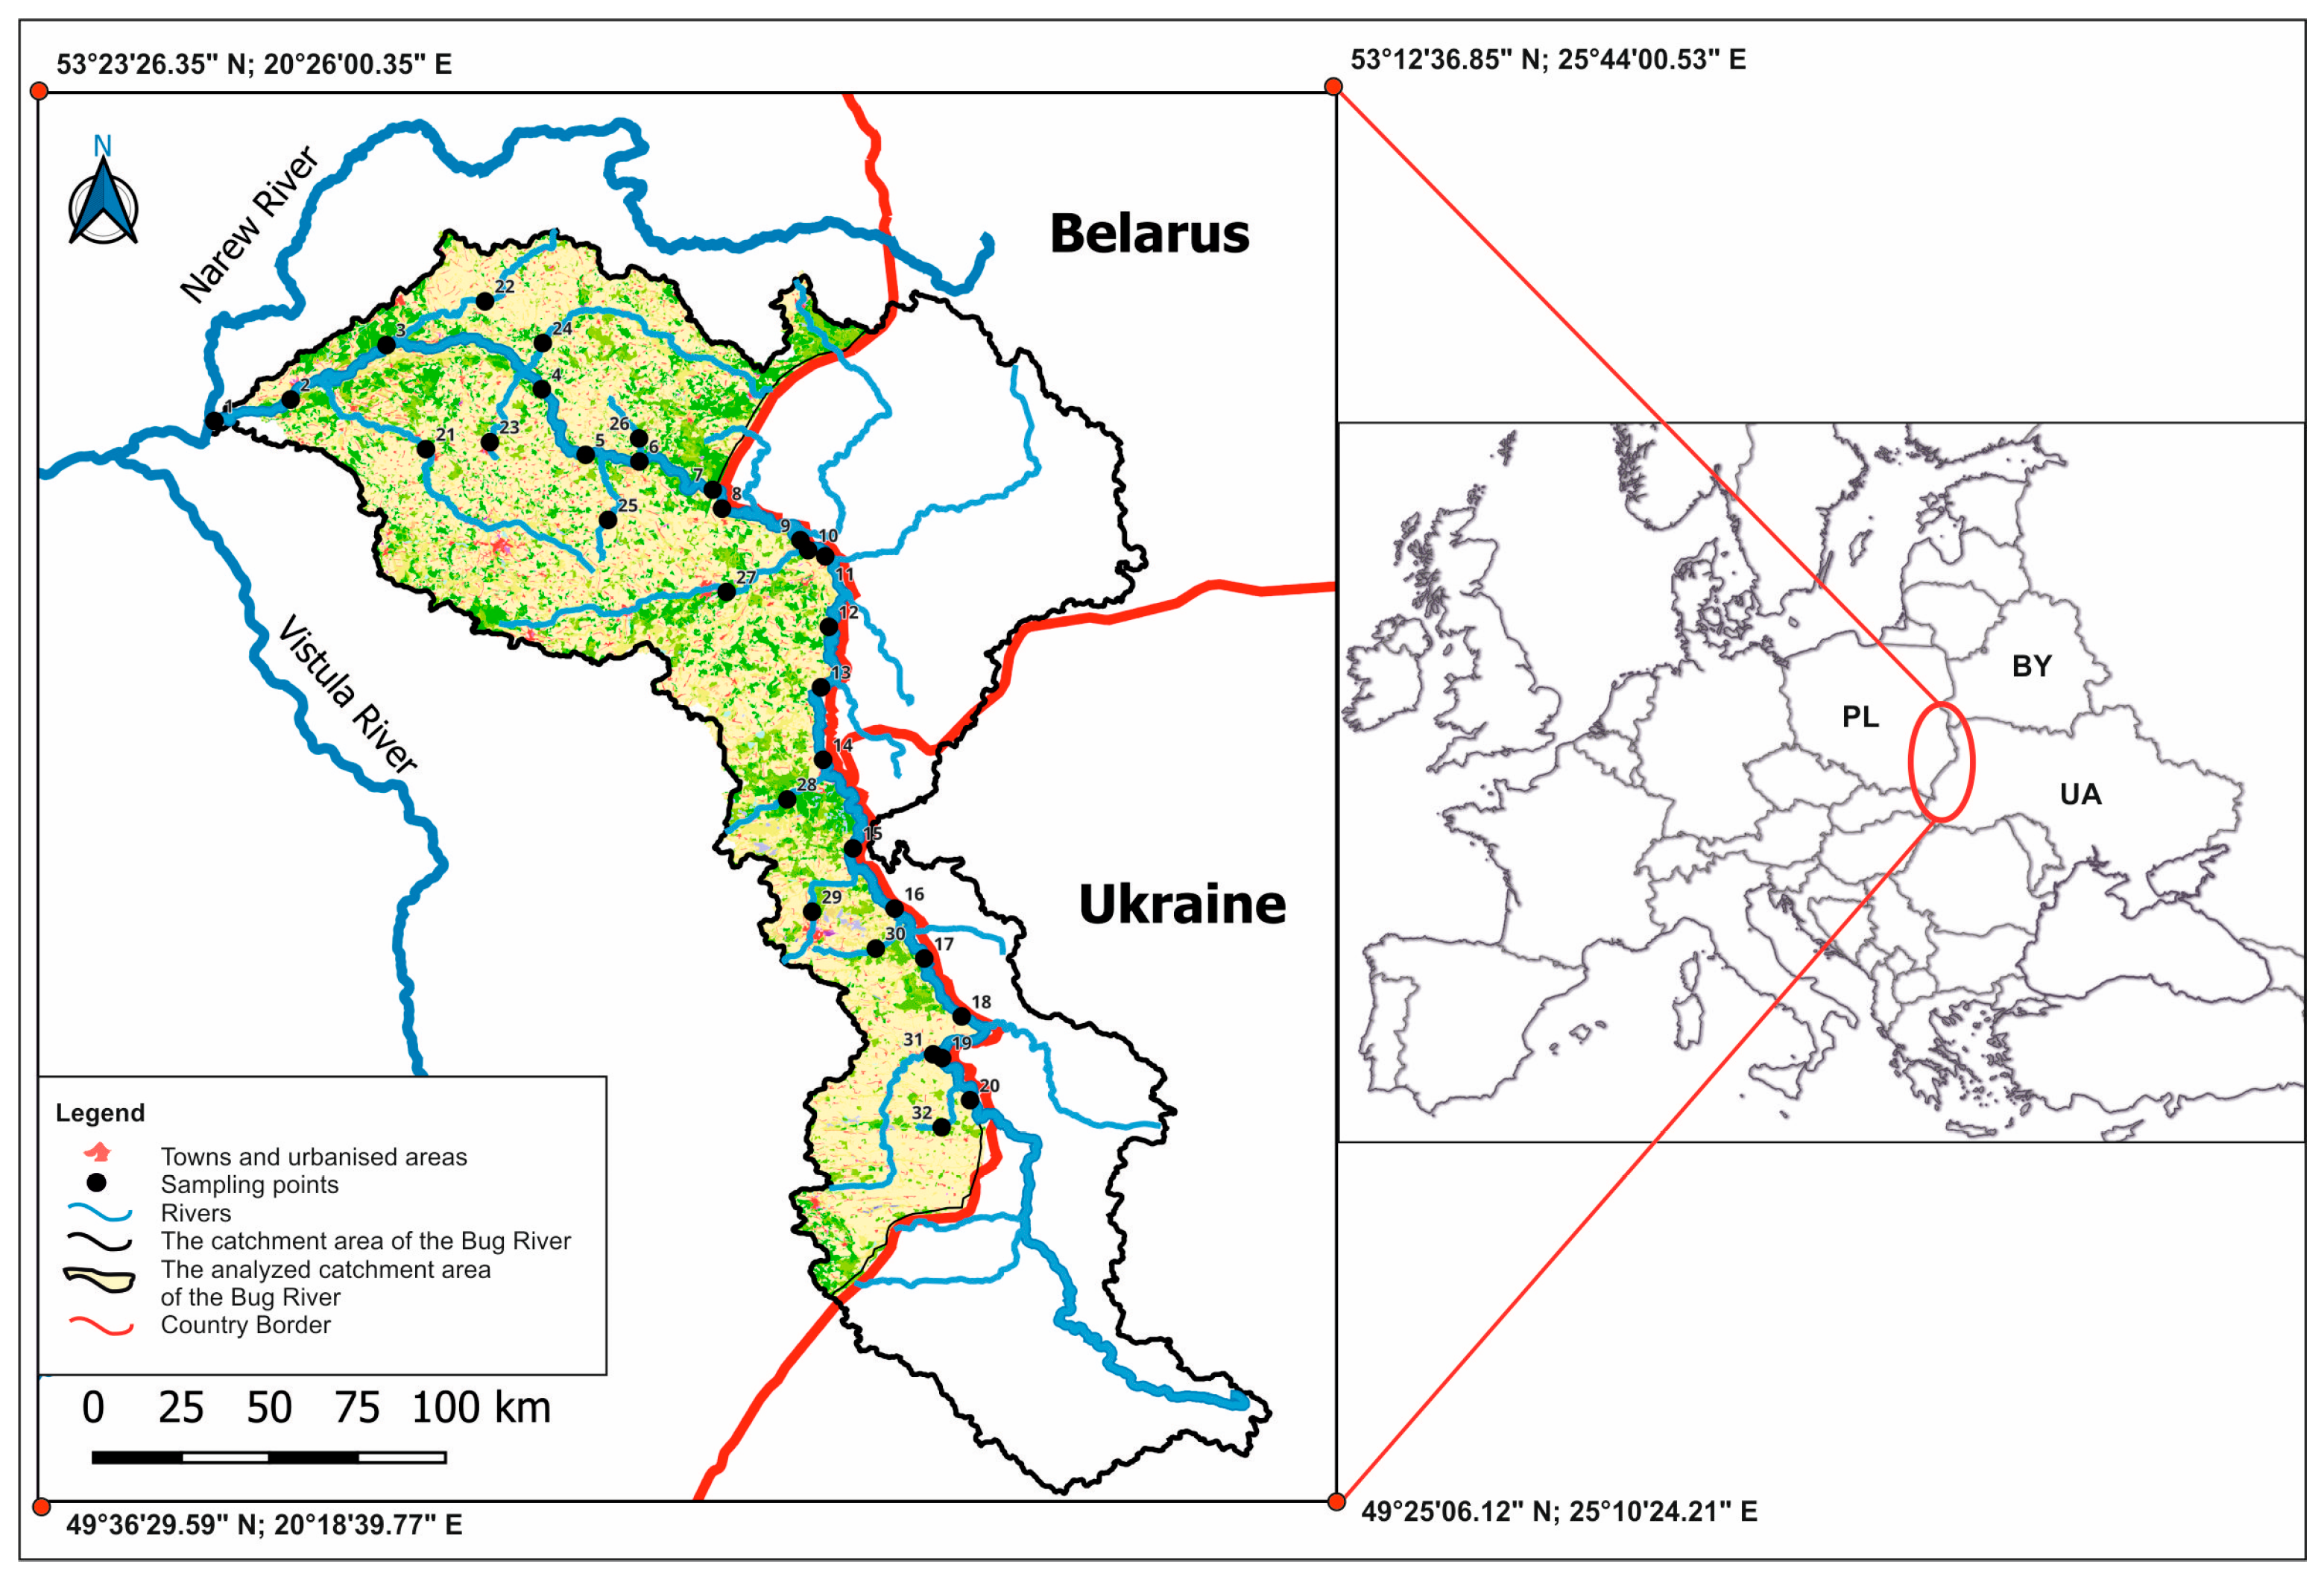
Samples for laboratory analysis were collected in July 2018, 2019, and 2020, in the Polish part of the Bug River watershed. Our object is shown in Figure 1. A total of 32 measurement points were selected, of which 20 were located on the Bug River and 12 on its tributaries: Liwiec, Brok, Cetnia, Nurzec, Toczna, Kamianka, Krzna, Włodawka, Uherka, Udal, Huczwa, and Bukowa. The location of sample collection sites and their number depended on land use within the watershed: urbanized, agricultural, and forested areas (Table 1).
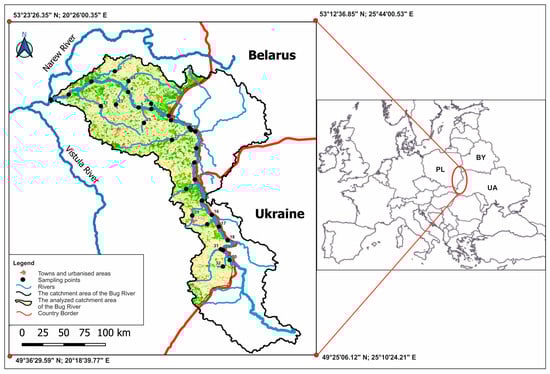
Figure 1.
The designated measurement points were along the Bug River and its tributaries.

Table 1.
Characteristics of sampling points.
Surface sediment samples were collected from the shoreline zone [23]. At each measurement point, multiple individual samples of surface sediments were gathered from depths ranging from 0 to 10 cm, yielding representative samples of around 1000 g each. Subsequently, the samples were air-dried to achieve an air-dry state and stored until further analysis [24]. The sediment samples were then sieved through a 200 µm sieve. The <200 µm fraction represented most of the surface sediments studied. Analysis of the <200 µm fraction made it possible to compare the obtained elemental content results to the local geochemical background of Polish water sediments [25].
The sediment samples were subjected to mineralization with hydrochloric and nitric acid in a volume ratio of 3:1 using an ETHOS EASY microwave mineralizer (Hanon Advanced Technology Group, Dortmund, Germany). The concentrations of Pb, Cr, Cu, Zn, Ni, Cd, Fe, and Mn were quantitatively determined using flame atomic absorption spectroscopy with an AAS ICE 3500 Thermo Scientific spectrometer (Waltham, MA, USA). All measurements were conducted in triplicate. The analysis parameters are shown in Table 2.
Table 2.
AAS ICE 3500 analysis parameters.
The sediment results were validated using certified reference material NCS DC 73317 sediment, with measurement error remaining below 5% of the certified value.
The pH in the tested surface sediments was measured by potentiometry, and the electrolytic conductivity was measured with a conductivity meter. The organic matter content in the sediment samples was assessed by measuring the loss on ignition at a temperature of 500 °C.
2.3. Assessment of Sediment Contamination
Numerous indicators and criteria are used worldwide to assess the condition of sediments. These indicators are tools for analyzing and transforming environmental data from which contaminated areas can be identified. The following indicators were identified in this study: pollution load index (PLI), geochemical index (Igeo), and contamination factor (CF). Most indices for assessing pollution relate to elements occurring naturally in the environment. The geochemical background of Poland [25] and the global background [26] were utilized to assess the degree of pollution of the Bug River and its tributaries’ beds’ sediments. The geochemical index (Igeo) was determined according to [27]
Cm represents the measured content of the analyzed metal (mg·kg−1), while Bn denotes the geochemical concentration of the element proposed by Turekian and Wedepohl [26]. The constant 1.5 is a correlation coefficient accounting for the background matrix attributed to lithological variability.
The contamination factor (CF) was calculated as the ratio of the content of each metal to the background value established by Turekian and Wedepohl [26] in the bed sediments [28], according to
Cm denotes the concentration of the analyzed metal (mg·kg−1), while GB denotes the geochemical background (mg·kg−1).
The assessment of bed sediment quality also involved calculating the pollution load index (PLI) for Fe, Mn, Cu, Ni, Cr, Zn, Pb, and Cd, which are used for a comprehensive evaluation of sediment pollution by multiple elements. PLI is calculated using the formula developed by Tomlinson et al. [29]:
where n represents the number of elements analyzed in the samples. This empirical index directly compares the average heavy metal pollution at different soil sampling locations. The interpretations of the values of individual indicators are presented in Table 3.
PLI = (CF1 × CF2 × CF3 × ... × CFn) 1/n
Table 3.
Characteristics of sampling points for Igeo CF [29,30] and PLI [31].
2.4. Spatial Analysis
To determine the total and partial watershed of the Bug River, the SCALGO Live program by SCALGO Denmark was utilized. For assessing the spatial distribution of the analyzed metals in the riverbed sediments, interpolation using the inverse distance weighting (IDW) method was conducted on the obtained results using QGIS 3.34 (Prizren). Interpolation involved assigning weights to sampling points based on their proximity to determine unknown points, with the influence of each point decreasing with increasing distance. The spatial distribution of metals in the bed sediments helped with identifying areas with elevated metal concentrations and assessing potential sources of pollution.
2.5. Statistical Analysis
Statistical analyses were conducted using Statistica ver. 13.3 for Windows. Mean, minimum, maximum, standard deviation, and coefficient of variation values were calculated. The normal distribution of variables was verified using the Shapiro–Wilk test, with results considered statistically significant at the α = 0.05 level. Pearson correlation analysis was used to investigate the relationships between metals, while factorial analysis identified the primary sources of these elements in the studied areas [32,33]. Before conducting the multivariate statistical analysis (Factor analysis (FA)) on the plant’s element content, the Kaiser–Meyer–Olkin (KMO) test [34] and Bartlett’s test [35] were performed on the analyzed samples. The KMO value ranged from 0.60 to 0.65, and Bartlett’s test indicated heteroscedasticity. The number of factors was determined based on the scatter plot and Kaiser’s criteria. For the interpretation of the factor analysis results, strong associations between the original variable and the factor were assumed when the absolute values of its loadings exceeded 0.70. Factor values (F1 and F2) were estimated in this study as unobservable variables. To test statistically significant differences in metal content in sediments across different areas, a one-way analysis of variance (ANOVA) was applied. ANOVA revealed significant differences between the studied areas. Variance homogeneity was assessed using Levene’s test. Tukey’s test for equal samples was used to determine statistically significant differences between mean surfaces. Data were transformed using the Box–Cox transformation into a logarithmic form to achieve a distribution close to normal.
3. Results and Discussion
3.1. The Concentration of Metals in the Surface Sediments of the Bug River Catchment Area
It is widely recognized that the main factors determining the ability of sediments to accumulate heavy metals are the pH level and the organic matter content. The results showed that the pH level in the studied river sediments varied depending on land use type. The highest pH values were recorded in forested areas (7.22–8.26), while the lowest were in urbanized areas (6.87–7.32) (Table 4). The lower pH in urban areas may have been due to acid rain and other forms of urban pollution, which has also been confirmed in other studies [36,37]. Higher pH levels favor metal adsorption and precipitation processes, which may explain why heavy metals are more concentrated in sediments with higher pH [29,36,37]. The pH of the sediment plays a crucial role in regulating the solubility of metals, where higher pH values tend to increase adsorption and precipitation processes. In comparison, lower pH values can reduce the binding strength of metals, thereby hindering their retention in the sediments. The pH in samples collected in forested areas ranged from 7.22 to 8.26, whereas that in agricultural areas ranged from 6.99 to 8.22, and the lowest values occurred in urbanized areas at 6.87 to 7.32. A correlation could be observed between the pH value obtained and how the catchment was used.
Table 4.
Descriptive statistics of metal concentrations, measured in mg/kg of dry weight, in the sediments of the Bug River basin, taking into account the land use types of the catchment area.
The presence of organic matter (OM) significantly affects the toxicity and bioavailability of heavy metals in surface sediments [33,38]. The organic matter content (OM) in sediments ranged from 0.33% to 4.01%, with the highest values recorded in forested areas. Organic matter influences the toxicity and bioavailability of heavy metals in surface sediments because metals can form complexes with organic matter, which reduces their mobility and bioavailability [29]. The higher OM content in the forested areas may have resulted from natural decay processes and lower anthropogenic pressure. The obtained organic matter content results ranged from 0.33% to 4.01% and occurred in the following order: forested areas > agricultural areas > urbanized areas.
The observed EC values in the sediments were highest in urbanized areas, possibly due to the higher presence of soluble salts from urban and industrial activities [14,17]. High EC values are often an indicator of pollution, consistent with the results of previous studies indicating higher concentrations of pollutants in urban sediments. The EC values of the studied sediments ranged from 298 to 1003 mS/cm. No clear spatial trend in variability was observed, even though EC values were higher in urbanized areas, with a mean content of 766.17 mS/cm.
Only a minimal portion of free metal ions remains in water in a dissolved state, while over 90% of the heavy metal (HM) load in aquatic systems is associated with suspended solid particles and sediments. Variations in the distribution of heavy metals in the sediments of studied rivers, categorized according to different types of watershed land use such as urban, agricultural, and forested areas, may indicate an anthropogenic impact on aquatic ecosystems. The contents of the analyzed HM in surface sediments varied, as evidenced by the coefficients of variation (CVs) being in the range of 10.98% to 54.90%. The developed CV is based on the nature of the river catchment. The following HM series Cr > Fe > Cu > Pb > Zn > Cd > Ni > Mn was observed for the urbanized catchment; Cr > Mn > Cu > Zn > Pb > Ni > Cd > Fe was observed for the agricultural catchment; and Cd > Mn > Cu > Cr > Zn > Ni > Pb was observed for the forested catchment. Coefficient of variation values below 50% may indicate natural content in the sediments, while values above 50% signal an anthropogenic origin of heavy metals [38,39]. The results show moderate variability in the concentrations of certain metals, particularly cadmium at 54.90%, manganese at 54.49% in forested areas, and chromium at 50.05% in agricultural areas. This variability suggests an anthropogenic origin of these metals.
The coefficient of variation (CV) values in this study show that the variability in heavy metal concentrations, particularly of cadmium (54.90%) and manganese (54.49%) in forested areas and chromium (50.05%) in agricultural areas, indicates an anthropogenic origin of these metals. Similar CV values were observed in studies on heavy metal contamination in the sediments of the Ergene River, where cadmium and manganese concentrations also exhibited high variability [16].
Table 4 presents the results of the analysis of variance (ANOVA). The ANOVA revealed statistically significant differences in the average concentrations of metals within the identified groups, namely different catchment areas. Statistical significance according to ANOVA was found for the differences in the contents of almost all metals in sediments bordering agricultural and urbanized areas. No such significance was found only in the case of Cd. Differences in mean Cd contents were statistically significant in the agricultural and forested catchments and the forested and urbanized catchments. Statistical significance was also found in the mean contents of many metals in the forest and urbanized catchments.
The most straightforward approach to assessing the quality of surface sediments in terms of heavy metal (HM) content is to compare it with background geochemical values. The geochemical background established by Turekian and Wedepohl [26], reflecting the natural elemental composition of the Earth’s crust, was used to assess sediment contamination. The analyses showed that all heavy metal concentrations were within natural limits, except for that of cadmium (Cd), which exceeded these levels by 56%, as presented in Table 4. On the other hand, referring to the local background proposed by Bojakowska and Sokolowska [25], HM analysis showed exceedances for Ni (56%), Cd (24%), Mn (11%), Pb (10%), Cr, and Cu (8%). The average HM contents of the surface sediment samples for the agricultural sites occurred in the following order: Fe > Mn > Zn > Ni > Pb > Cu > Cr > Cd. This observation indicates that intensive farming can significantly transform the natural environment. It leads to an intensification of denudation processes, including crop and water erosion [38]. Oost et al. [39] stated that the catchments used for agriculture are often exposed to various erosive forces (such as runoff), especially on steep gradients, which contribute to the transport and deposition of particulate matter along watercourses and form surface sediments. Many studies have reported elevated HM concentrations in agriculturally used soils relative to background concentrations [40]. Additionally, increased agricultural activity often results in the higher usage of fertilizers and pesticides, which are significant sources of heavy metal contamination [2,4]. Sun et al. [8] confirmed that agricultural runoff is a significant pathway for heavy metals entering river systems. The impact of these activities on sediment quality underscores the need for sustainable agricultural practices.
It was found that the concentrations of Fe, Mn and Zn in the studied surface sediments varied within the ranges of 492.36–941.02 mg·kg−1, 110.08–563.29 mg·kg−1, and 5.11–21.48 mg·kg−1, respectively. According to De Andrade et al. [41], elements such as Fe and Mn are typically present in large quantities, and these metals may primarily originate from the weathering of rock fragments rich in these elements. Additionally, the conducted studies revealed the following average concentrations of nickel, lead, copper, and chromium in the analyzed surface sediments: Ni 5.31 ± 1.03 mg·kg−1, Pb 5.04 ± 1.01 mg·kg−1, Cu 2.25 ± 0.65 mg·kg−1, and Cr 1.54 ± 0.77 mg·kg−1.
According to Kelepertzis [42] and Tóth et al. [43], soil enrichment in Cr, Ni, and Zn is mainly due to using pesticides, phosphate, and inorganic fertilizers. The intensive agricultural practices associated with the use of pesticides and fertilizers cause contamination of groundwater and surface water. Increased Cd contents were also observed in the surface sediment samples of the Bug River and its tributaries from agricultural areas, with values varying between 0.35 and 0.75 mg·kg−1, exceeding geochemical background values. The Cd contents in the agricultural catchment river sediments were higher than in urbanized and forested areas. Taghavi et al. [44] and Lu et al. [45] suggested that the enrichment of soil with cadmium (Cd) can be attributed to the use of sewage sludge, manure, and lime. On the other hand, Khan et al. [46] and Hayrat and Eziz [47] argued that high levels of this element in agricultural soils may also result from the repeated use of phosphorus fertilizers. This indicates that various agricultural practices and changes can contribute to the accumulation of Cd in the soil.
Using mineral fertilizers in France accounts for as much as 85% of the anthropogenic cadmium (Cd) found in agricultural soils. This emphasizes these fertilizers’ significant role in the accumulation of Cd in soil environments, especially in agriculture [48]. In addition to the area-based pollution that reaches water bodies from agricultural fields with surface runoff, agriculture can also be a source of point source pollution: leaking septic tanks and sanitary systems, landfills of animal manure directly on the ground without a manure slab, and silage piles from which leachate water is released and migrates to surface waters [49].
The forest ecosystems in the catchment are strongly linked to water resources [50]. Habitat conditions determine the nature and effects of these interactions [51]. On the other hand, forest cover plays a vital role in the water cycle in the catchment and significantly affects its quality [52]. The average contents of the analyzed elements from forested areas followed the same pattern as for agricultural areas (Fe > Mn > Zn > Ni > Pb > Cu > Cr > Cd). The most significant variation was in the results obtained in the surface sediments for Zn (6.95–28.94 mg·kg−1), Cu (0.55–4.15 mg·kg−1), Cr (0.87–3.99 mg·kg−1), and Cd (0.03–0.38 mg·kg−1). The results showed that the highest contents of Zn, Pb, Ni, Cr, Mn, and Fe in the forest areas, respectively, were 28.94, 8.63, 8.99, 3.99, 704.81, and 1110.25 mg·kg−1 and did not exceed the background geochemical values. It was shown that contaminant levels were low under forest cover. The implication is that the water from catchments with a large amount of forest is higher quality than that from other catchment uses, such as urbanizations or arable land.
Heavy metals in aquatic ecosystems pose significant environmental and health risks due to their toxicity and persistence. Understanding the distribution and sources of HMs in surface sediments is crucial for assessing their impact on different types of watersheds, such as those in urban, agricultural, and forested areas. The primary sources of HM in rivers located in urbanized areas include vehicle emissions, atmospheric pollutants, coal burning, and associated urban runoff [53]. The average HM content of the surface sediment samples studied for urbanized areas was as follows: Fe > Mn > Zn > Ni > Pb > Cu > Cr > Cd. The contents of Fe, Mn, and Zn were highest in the studied sediments, and the content of these elements ranged from 1659.33 to 4852.11 mg Fe·kg−1, 701.25 to 1182.01 mg Mn·kg−1, and 32.15 to 53.94 mg Zn·kg−1. According to Bardelli et al. [54], Fe is introduced into the environment through the abrasion of vehicle brake pads. Mn primarily originates from vehicles powered by unleaded gasoline. Pb compounds added to gasoline have been replaced with Mn, leading to increased emissions of this element. Adamiec et al. [55] and Smolders and Degryse [10] pointed out that tire wear releases significant amounts of Zn. Zinc compounds also act as antioxidants for the oil in the combustion chamber [56]. The average Ni, Pb, Cu, Cr, and Cd contents in the analyzed surface sediments were 12.00, 10.67, 5.65, 5.29, and 0.50 mg·kg−1. In addition to the mentioned elements, the Cu in river sediments flowing through urbanized areas may also be related to traffic. Rajaram et al. [57] reported that Zn and Cu are indicators of metal emissions from nonfuel sources, and their high levels confirm the presence of these sources in many countries. Pb and Zn can also enter sediments through coal combustion [11]. Urbanization has led to the contamination of soils and sediments with heavy metals due to anthropogenic influences from transport and coal burning [58]. According to Landre et al. [59], Cu, Pb, and Zn are the metals most commonly found in the surface runoff from urban areas. In surface sediments, Cd, Ni, Cr, Zn, and Cu sources may also include domestic and industrial sewage discharge. The concentrations of the studied HMs in the surface sediments of rivers, except for Cd, were higher in urbanized areas than in agricultural and forested catchments.
3.2. Spatial Variability in Heavy Metals in the Surface Sediments of the Bug River and Its Tributary Systems
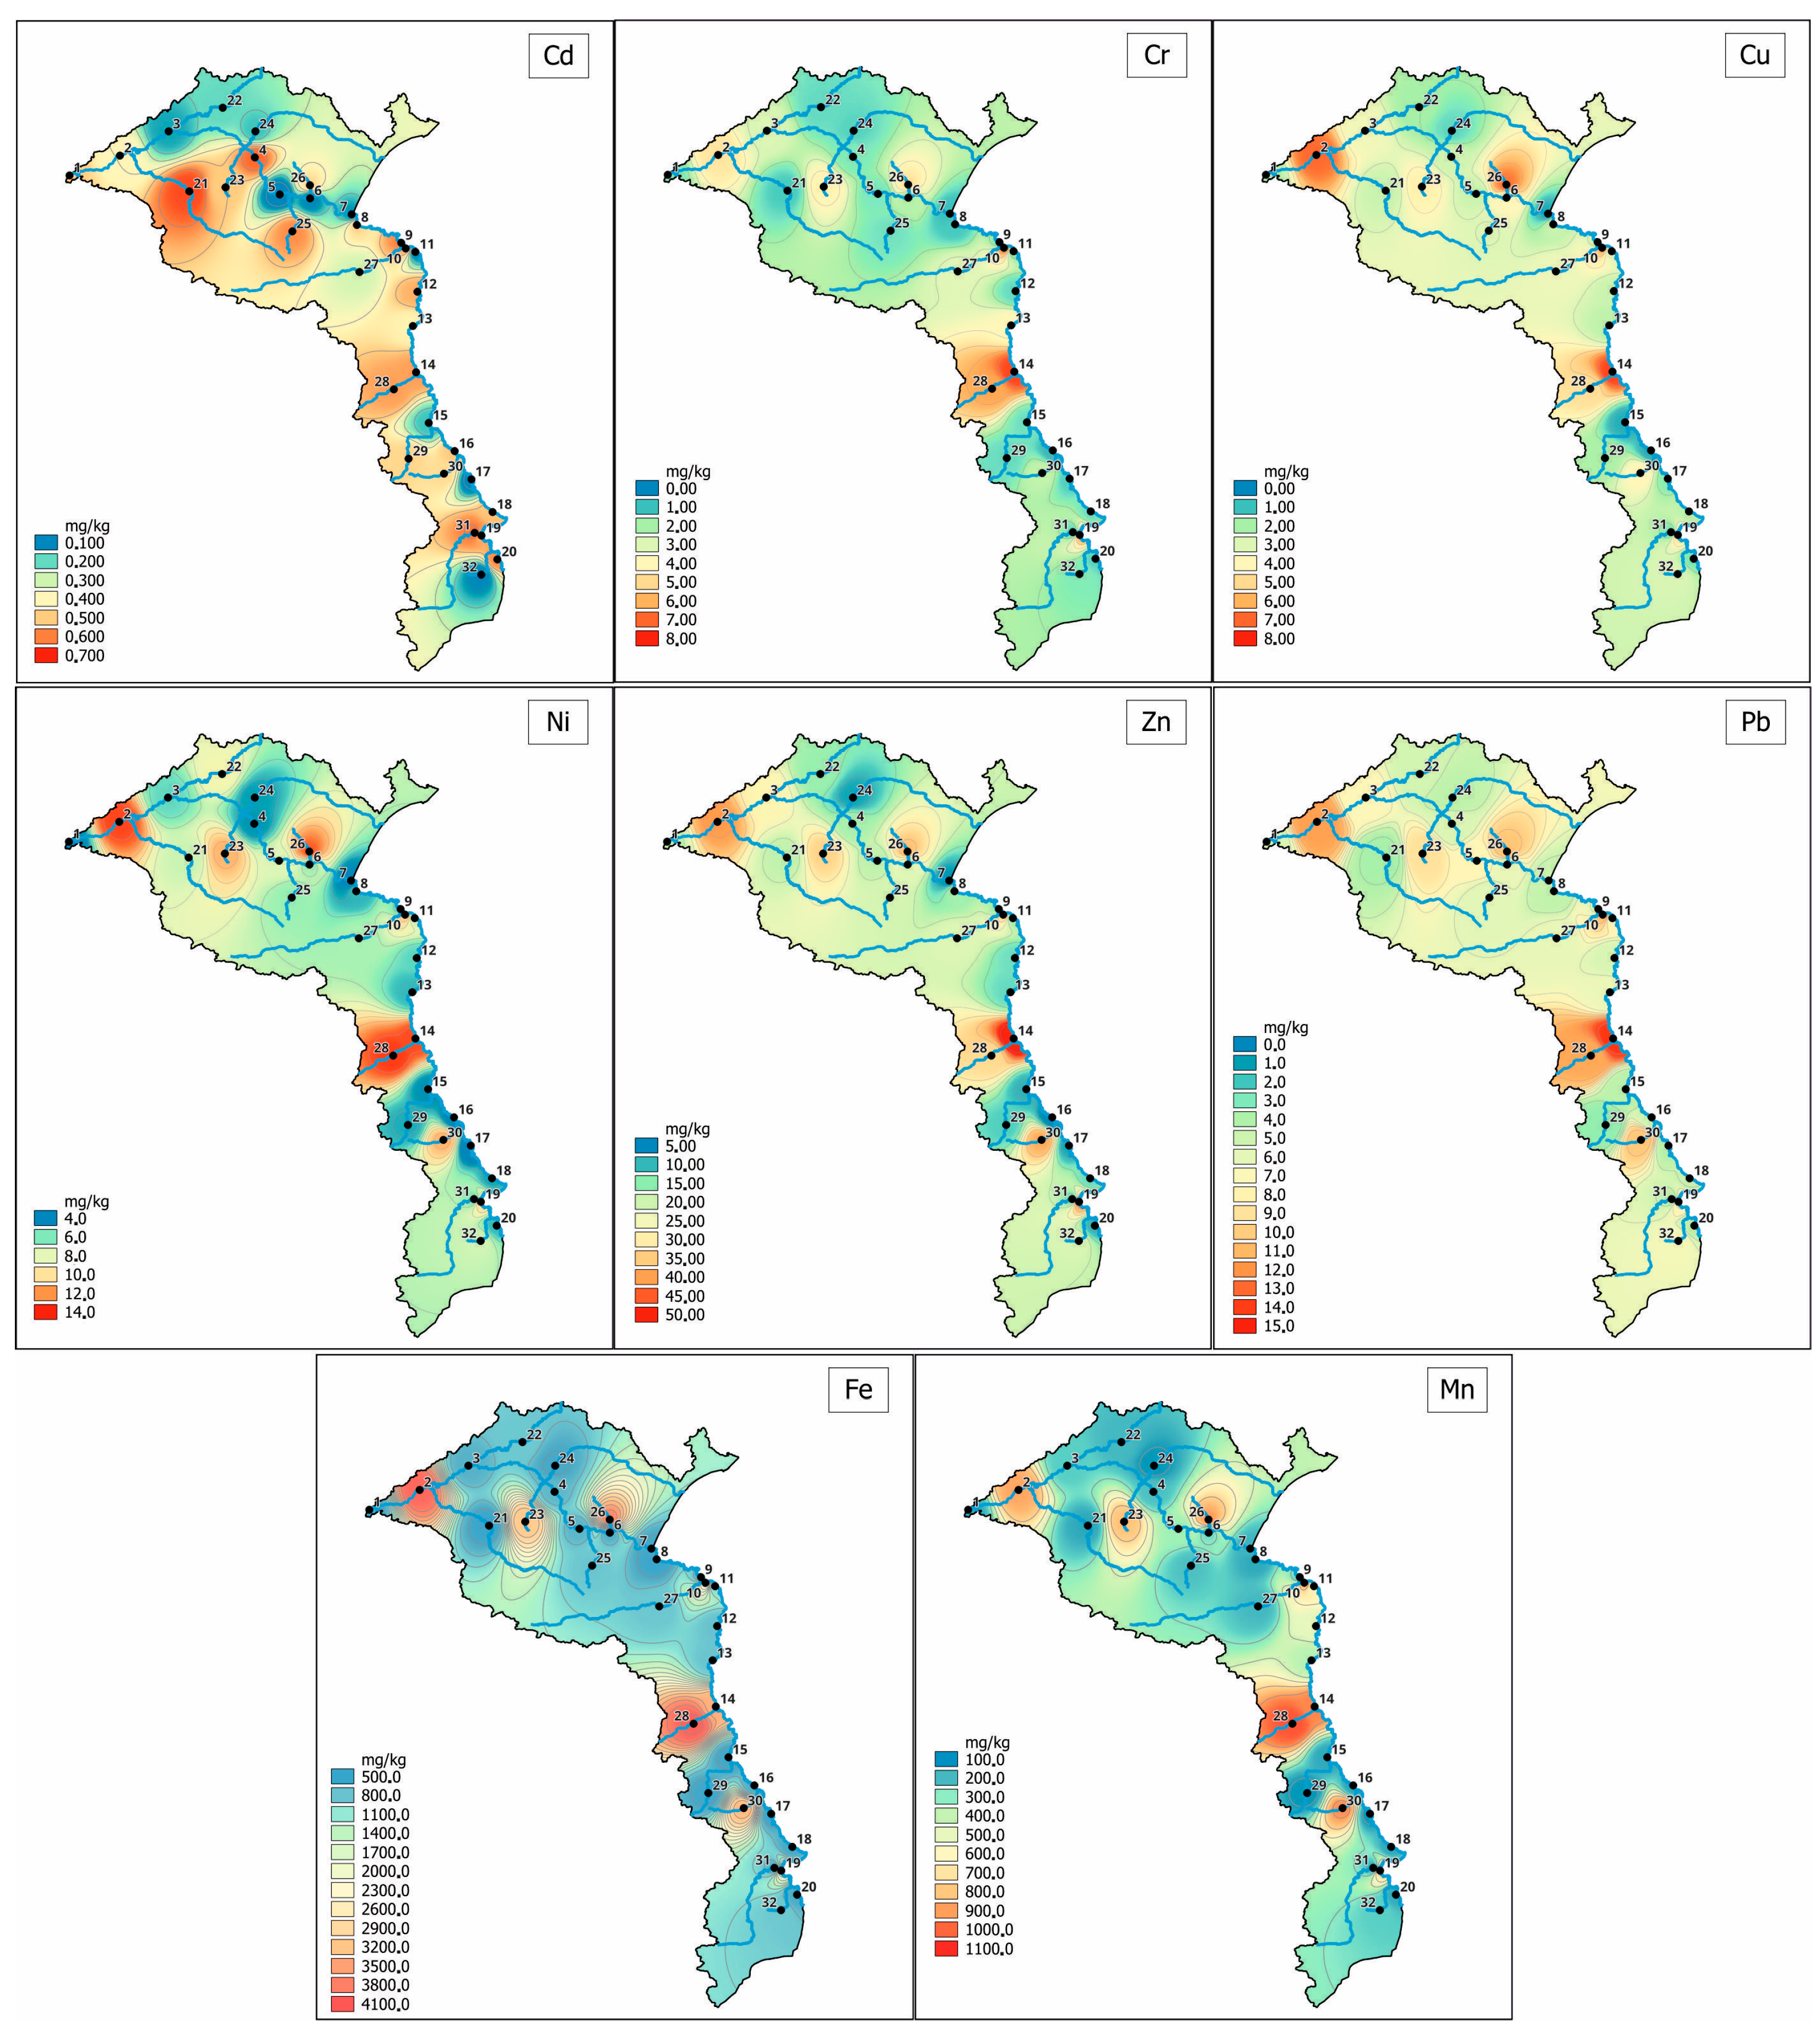
The study of the spatial distribution of the analyzed elements allowed for the differentiation between contaminated and uncontaminated zones in a given area. However, the maps resulting from this analysis are limited to presenting only the general trends in element concentrations in the sediments of the Bug River and its tributaries (Figure 2).
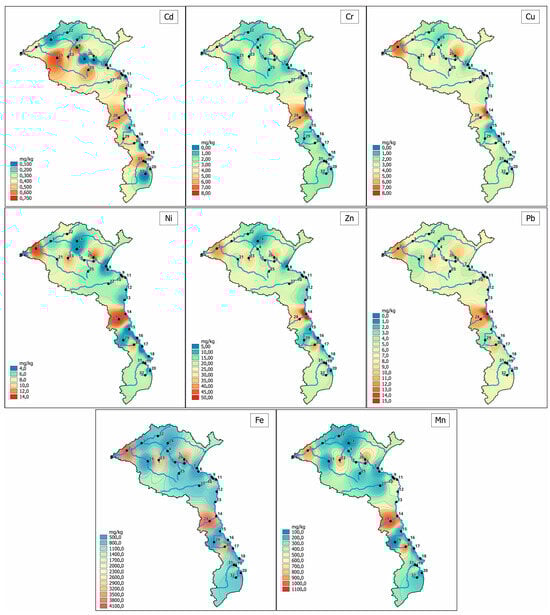
Figure 2.
Zonal distribution of potential heavy metal contamination in the Polish part of the Bug River catchment.
The spatial distribution of the studied heavy metals (HMs) showed similar trends, albeit with detailed differences. Despite these differences, specific general patterns could be observed for different metals. Cadmium (Cd) was an exception, exhibiting a distinctly different distribution pattern than the other heavy metals. The maps clearly show that areas with high metal values occurred in the urbanized areas. This was particularly evident in the lower section of the Bug River. The highest values of Pb, Cr, Cu, Zn, Ni, Fe and Mn in river sediments occurred at the research points located on the Bug River in Wyszków (2) and Włodawa (14), the tributaries Cetynia-Białobrzegi (23) and Kamianka-Siemiatycze (26), and at a point located on the Włodawka River (28). Furthermore, it is worth mentioning that Cr, Cu, Zn, and Mn showed higher concentrations also at Hrubieszów (19) on the Bug River and Fe, Mn and Pb on the tributary Udal (30). The correlation coefficients among Pb, Cr, Cu, Zn, and Ni suggest that similar factors influenced their spatial distribution (Table 4). Many similarities are apparent when analyzing the Fe and Mn distribution models.
What distinguishes five metals (Pb, Cr, Cu, Zn, Ni) from Fe and Mn is their origin; both have similar geochemistry and come from natural sources such as the Earth’s crust [60,61]. On the other hand, the amount of Pb, Cu, Ni, Zn, and Cr in the sediments is influenced by human activities; an exceedance from the local geochemical background values was found for Ni (56%), Pb (10%), Cr, and Cu (8%) [25]. The spatial distribution of Cd concentrations indicated that, according to the geochemical background developed for Poland, the studied sediments were most enriched in Cd by 24% [25], while, according to the global geochemical background, by 56% [26]. It was difficult to identify specific factors that influence the spatial distribution of Cd in the fluvial sediments of the Bug River and its tributaries; it could be the influence of local sources of pollution related to organic fertilization, the mineral application of plant protection products, and industry and communication. A long-term study of arable soils from 1995 to 2015 in the Bug River catchment showed that all metals were at geochemical background levels except for a slight enrichment in Cd and Pb. The highest Igeo, CF, and PLI values were found for Cd [62].
3.3. Indices of Heavy Metal Pollution of the Bug River’s Surface Sediments
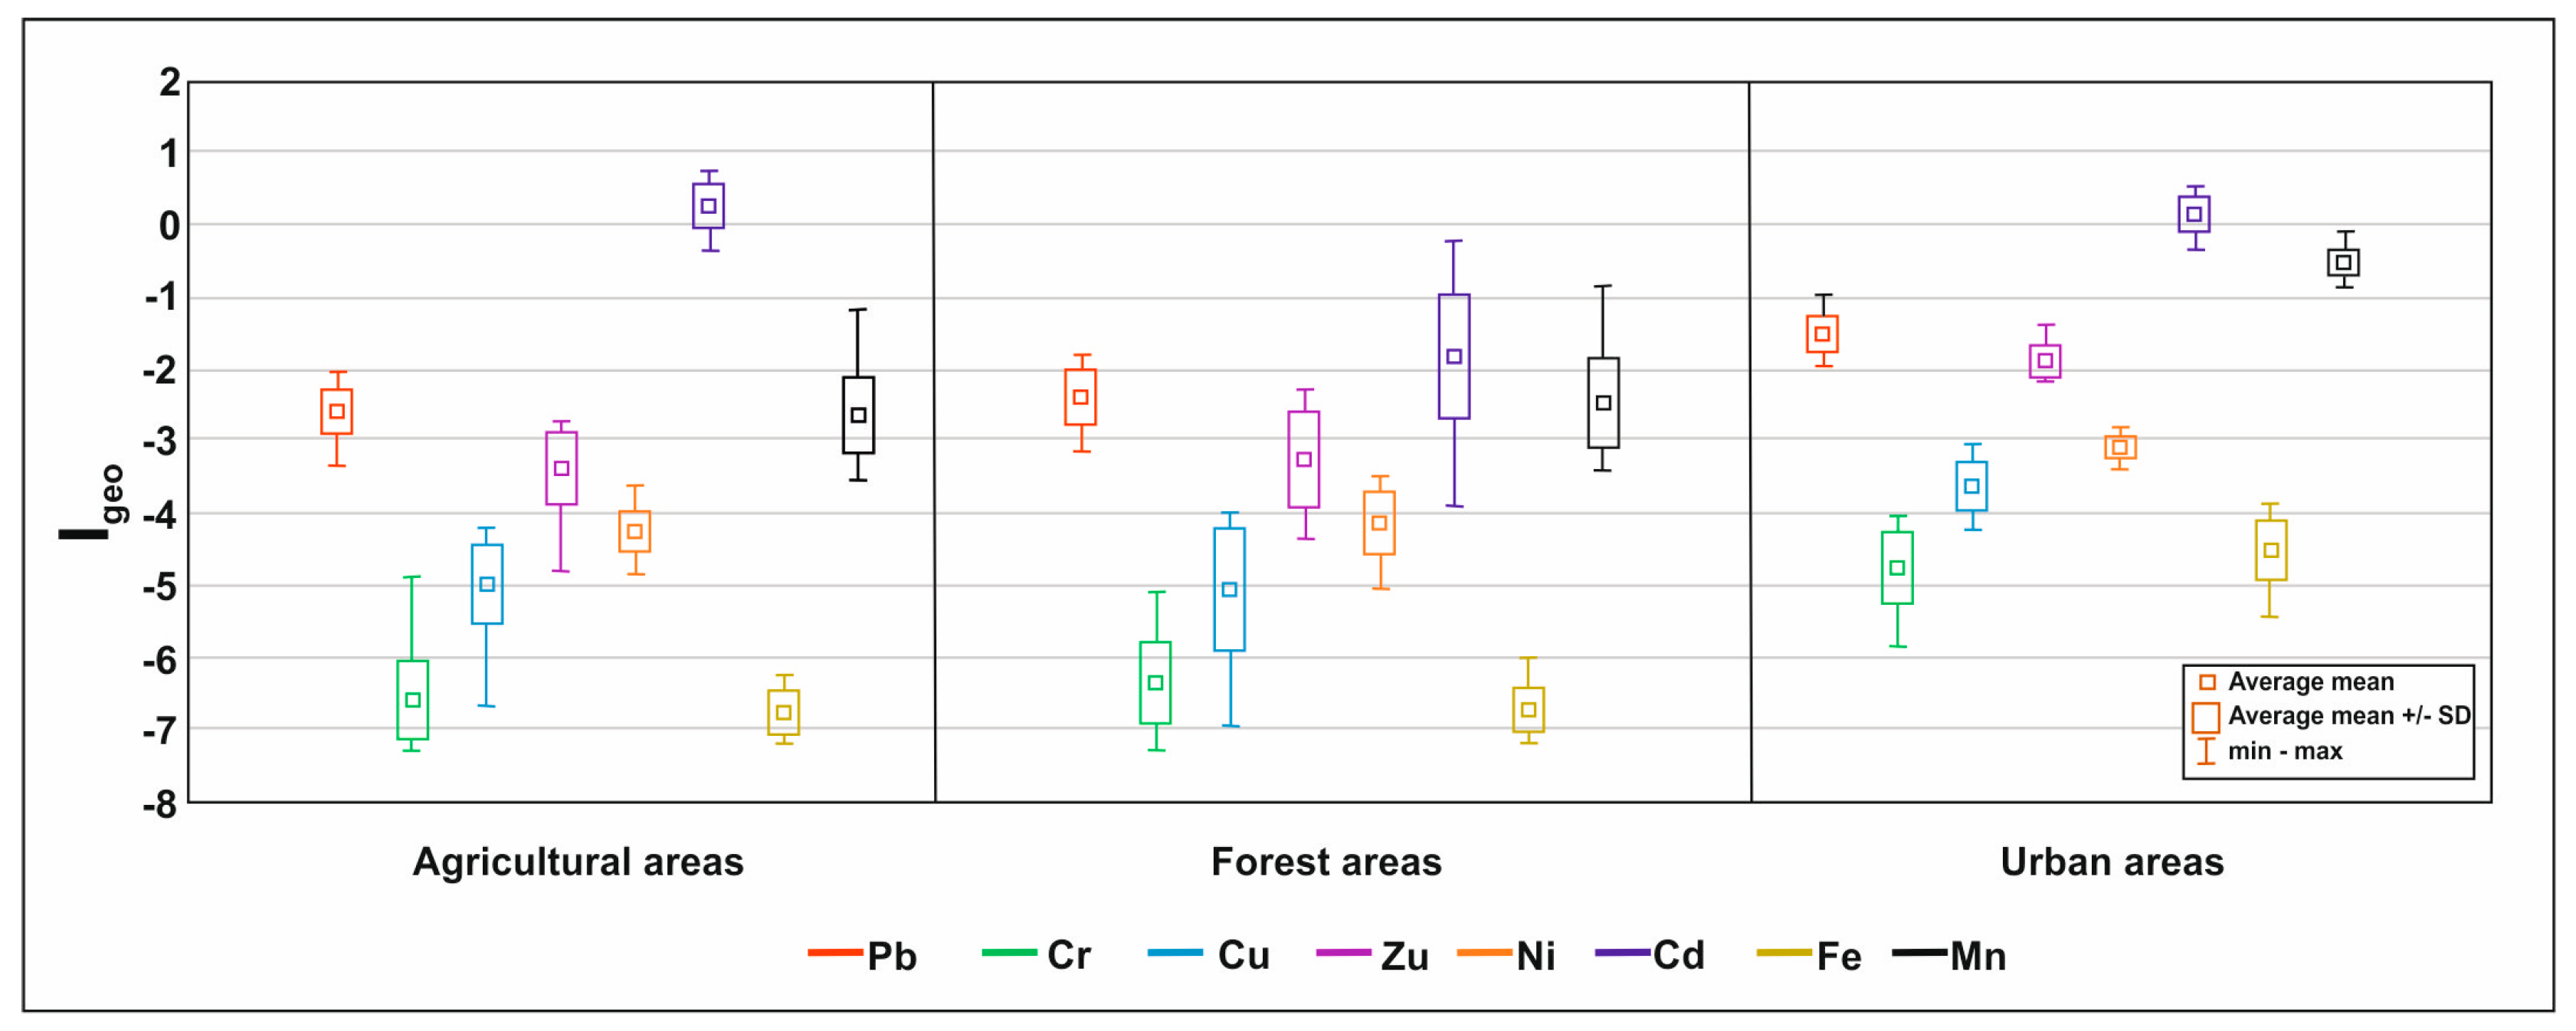
The analysis of HM contamination in sediments conducted using the Igeo method revealed the slight enrichment of the sediments with cadmium, which was particularly evident in agricultural areas, where the average Igeo value was 0.24, compared to that of urbanized areas, where the value was up to 0.15 (Figure 3). These results indicate diverse sources of contamination in different environments. De Andrade et al. [41] also indicated higher cadmium concentrations in agricultural areas, consistent with our observations. Cadmium is often introduced into the environment through phosphate fertilizers and plant protection agents, explaining its higher Igeo values in these areas. On the other hand, metals such as chromium, copper, and iron showed lower Igeo values, often below zero, suggesting concentrations at the background geochemical level. Low levels of these metals in the sediments indicate a lesser impact of anthropogenic sources or effective dispersion and dilution of these metals in the natural environment. Similar results were obtained by Acksel et al. [34], who found that the Igeo values for these metals mostly did not exceed zero, suggesting their geogenic origin.
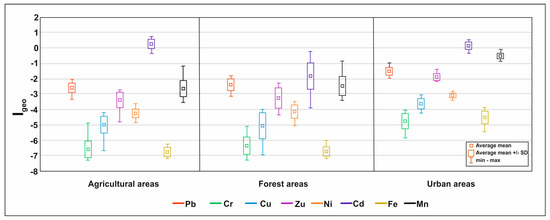
Figure 3.
Igeo index values.
It was found that the Igeo values varied not only between different metals but also between different environments: agricultural, forested, and urban areas. These differences may have resulted from various land management practices and differences in exposure to industrial and urban pollution. Igeo values above zero indicate potential problem areas that may require further monitoring or remedial actions to reduce the impact of heavy metals on the environment and human health.
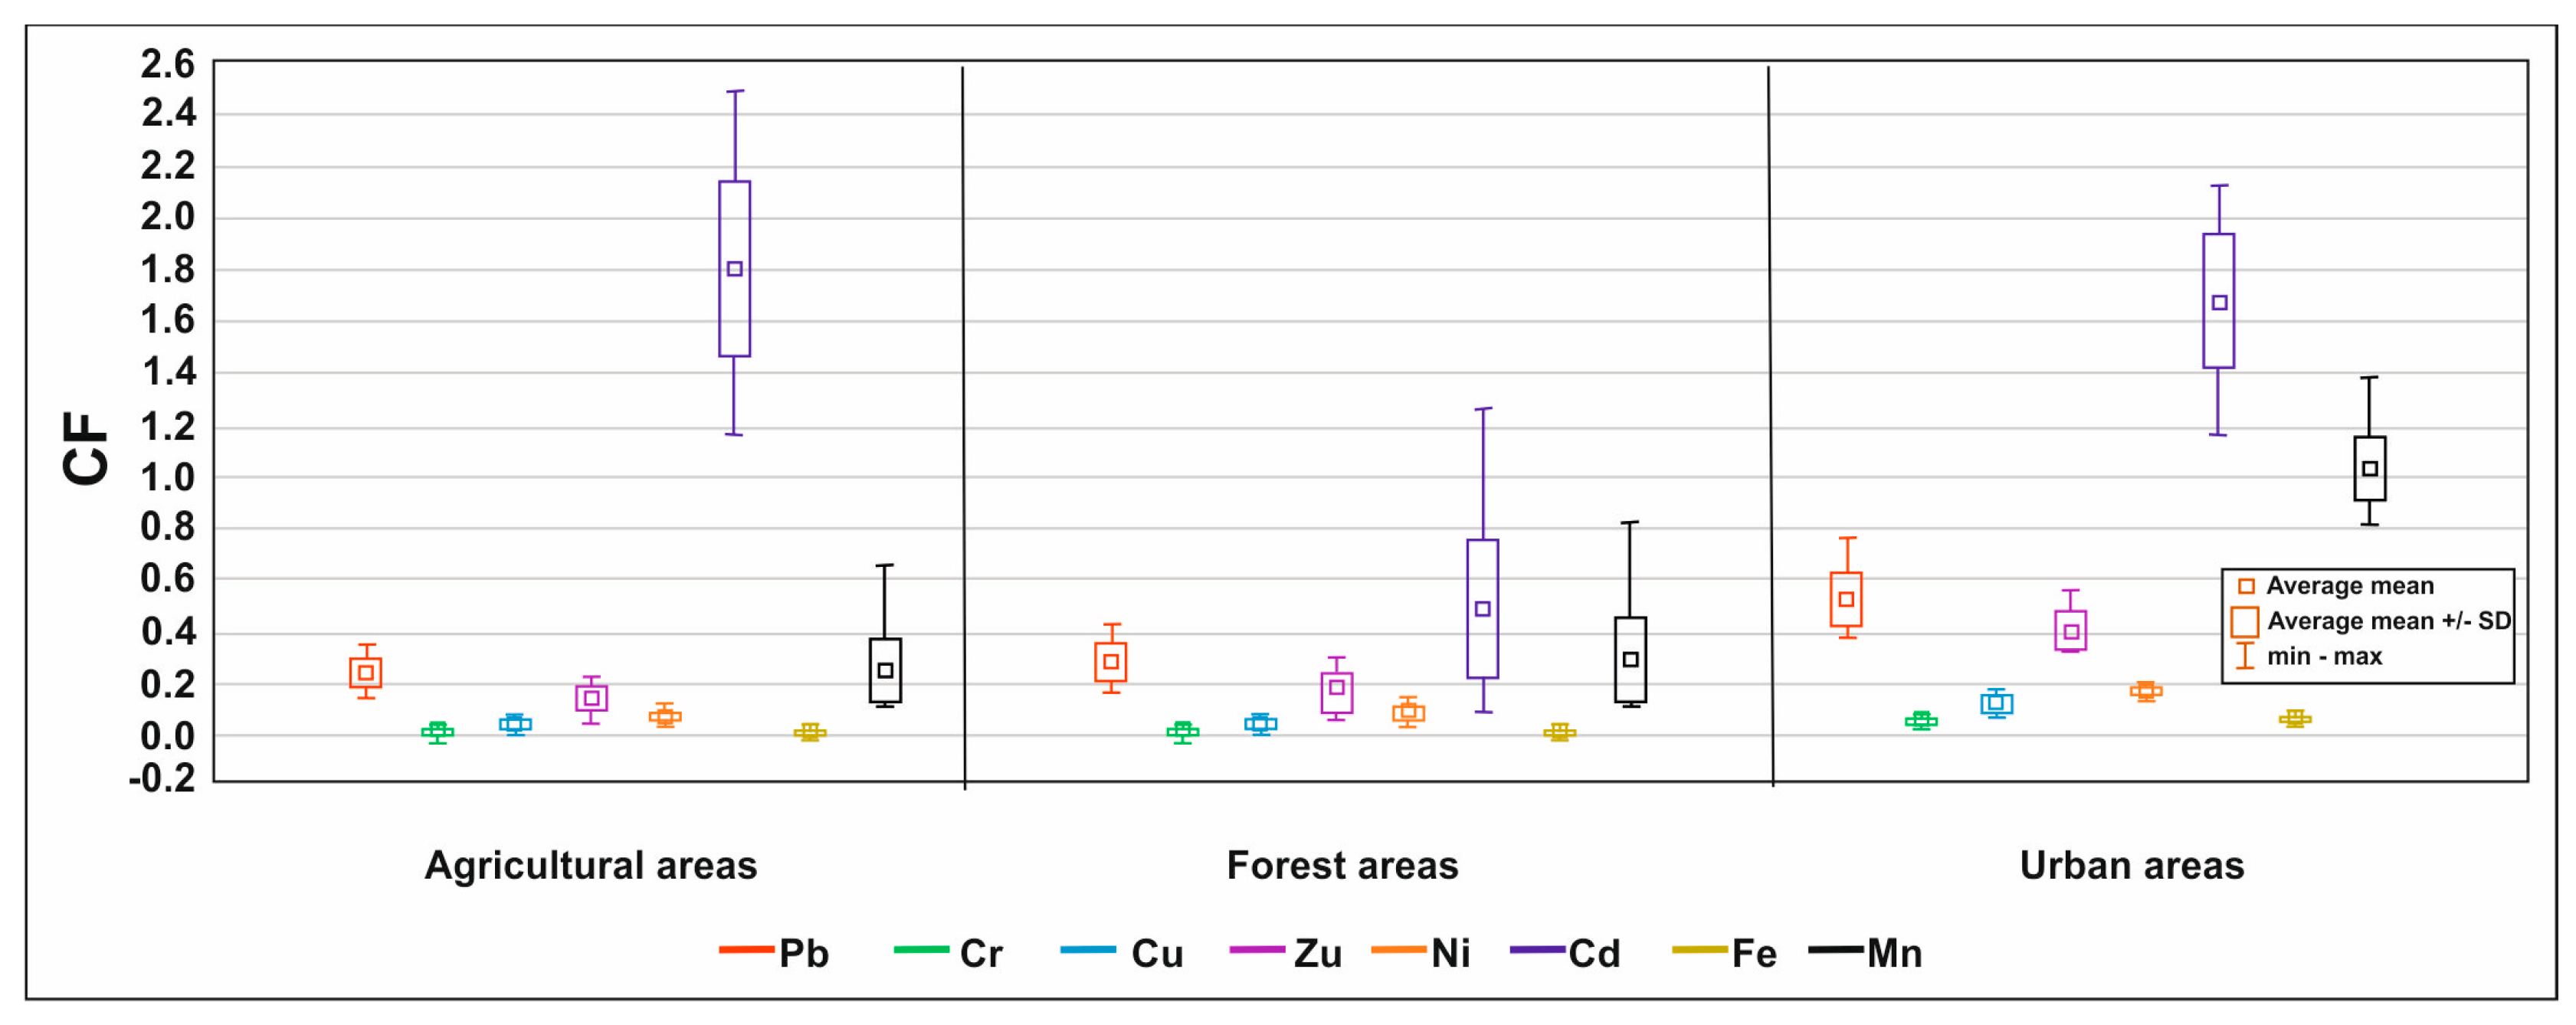
The analysis of the contamination factor (CF) values for various heavy metals in sediments from different environments and correlating these values with established thresholds for pollution classification showed that the level of contamination for most of the studied metals was low in different environments, except for those of cadmium and manganese. The CF values for cadmium in the agricultural areas were significantly higher, reaching 2.6 (Figure 4). Cadmium also reached high values in the urban areas, with the highest recorded values being 2.50 (4-Bug) and 2.13 (14-Bug, Włodawa). These results classify sediments from these regions as moderately contaminated, significantly exceeding the natural background. This indicates the influence of anthropogenic factors such as intensive agriculture or industrial pollution [61,62]. The manganese in the urban areas also exceeds CF values above 1, reaching a maximum of 1.39 (28-Włodawka), indicating moderate contamination. This may have resulted from industrial and transportation pollution sources in these areas [63,64]. For the remaining analyzed metals (Pb, Cr, Cu, Zn, Ni, Fe), most CF values were below one in all studied environments, indicating that their contents in the sediments were at levels close to the natural background levels. These metals do not currently pose a significant threat to the environment in the studied areas.
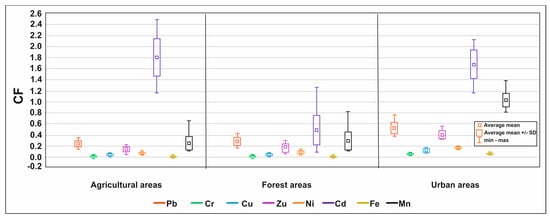
Figure 4.
CF index values.
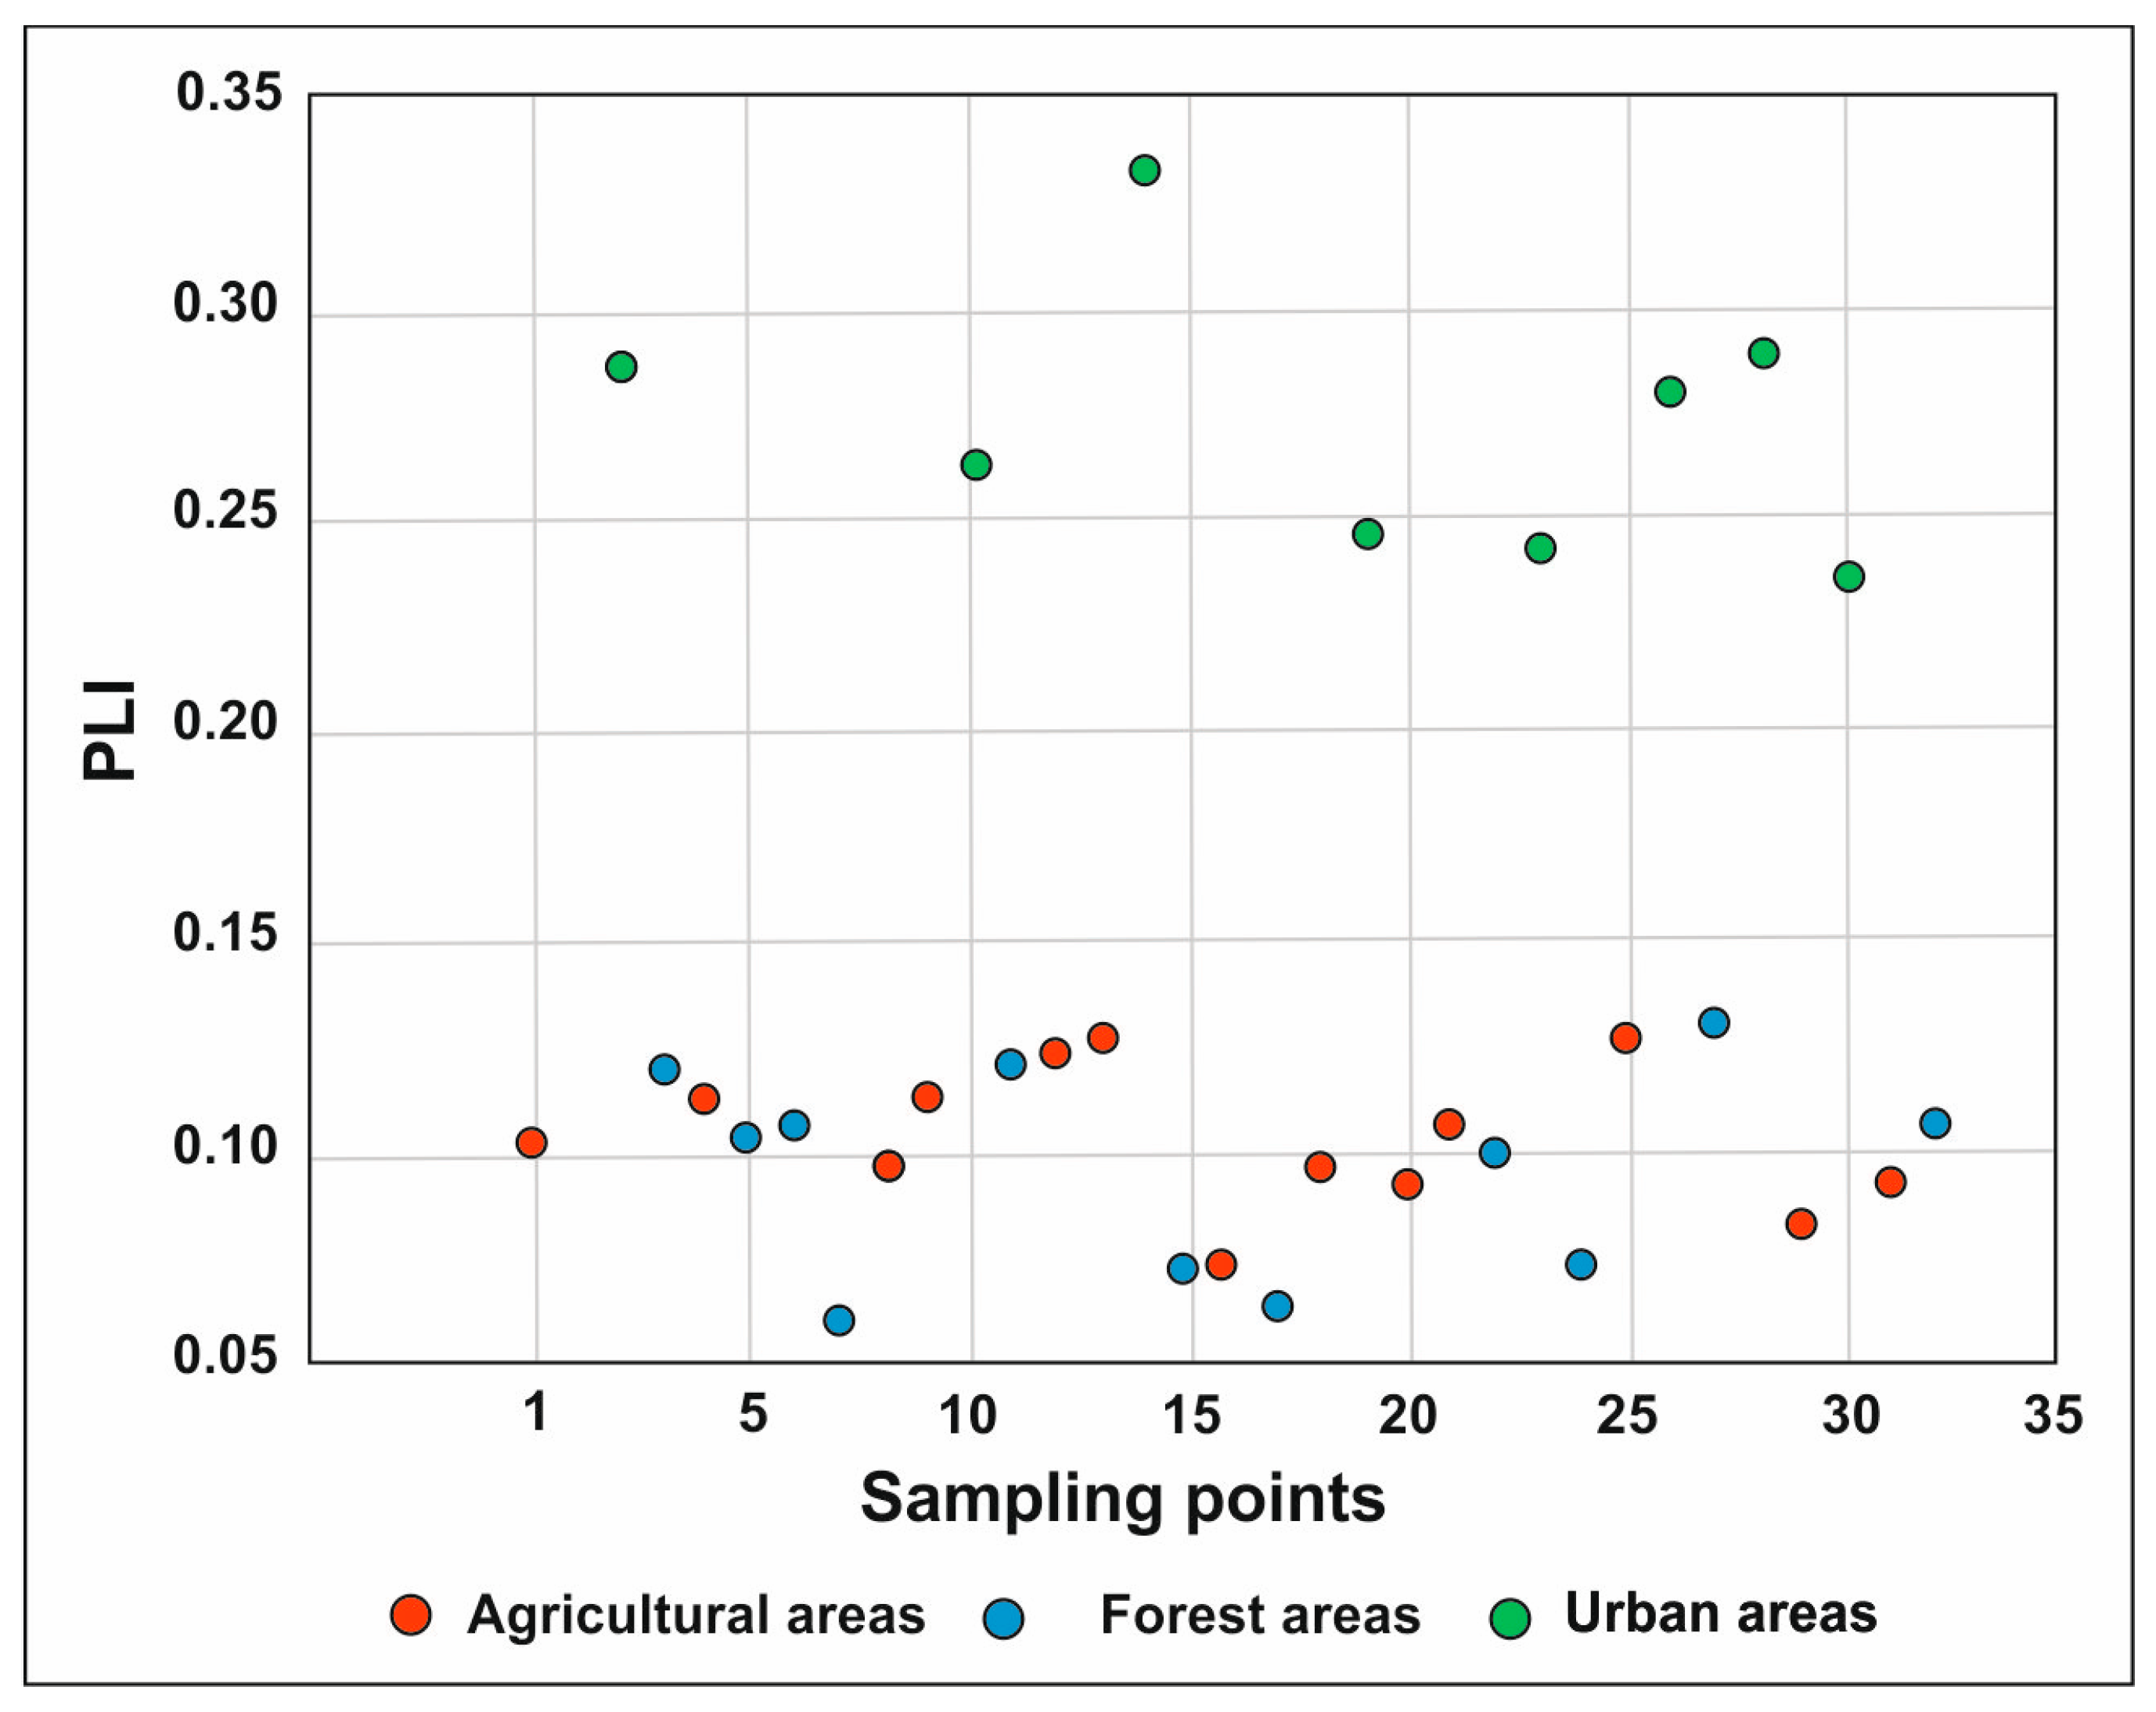
The analysis of the PLI values for the different measurement points in agricultural, forested, and urban areas within the Bug River catchment indicated that the PLI values for agricultural areas were relatively low, around 0.10. This suggests low levels of heavy metal contamination in these regions, possibly due to the lower intensity of pollution sources compared to those in urban areas. Similarly, the PLI values in the forested areas were also low, oscillating around 0.10 (Figure 5). This suggests that these areas were less exposed to heavy metal contamination, which may have been related to the natural buffering capacity of forests and lower anthropogenic activity.
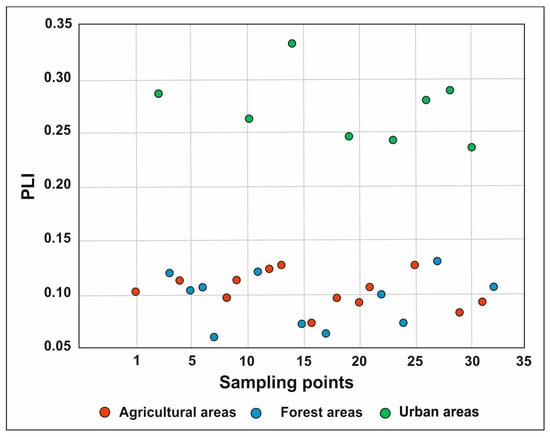
Figure 5.
PLI values.
In contrast, the PLI values for the measurement points in urban areas were higher, ranging from 0.24 to 0.33. Urban areas are characterized by higher levels of heavy metal contamination due to the greater concentration of pollution sources such as industrial emissions, transportation, and intensive human activities.
Comparing the obtained results with those in the available scientific literature, it was found that the results are consistent with the general trends observed in other studies. A study on the sediments of the Vistula River in Poland found higher PLI values in urban areas, which exceeded 1.0 [17]. Research on the Jinsha River in China [22] found PLI values in agricultural areas ranging from 0.2 to 0.5, which are higher than our results (~0.10), suggesting differences in agricultural practices and local hydrological conditions. Additionally, Khan and Wen [38] indicated that the PLI values in urban areas range from 0.5 to 1.2, indicating higher pollution levels in more industrialized catchments. Our results, with a maximum PLI of 0.30, suggest that the contamination of the Bug River is relatively lower.
The differences in PLI values between agricultural, forested, and urban areas highlight the impact of human activities on the pollution levels in river sediments. Urban areas exhibited the highest PLI values, suggesting the need for special attention and remedial actions in these regions. The analysis of the PLI values indicated that urban areas in the Bug River catchment are the most exposed to heavy metal contamination. In contrast, agricultural and forested areas showed significantly lower levels of pollution. These results emphasize the need for monitoring and protective measures, particularly in areas with high human activity.
3.4. Identification of Sources of Pollution via Statistical Analysis
The Pearson correlation analysis is shown in Table 5. The solid and robust correlations between metals obtained in the present study provide information on the origin and migration of metals in the environment [15,63]. According to Ke et al. [64], Bhuyan et al. [65], and Ciazela et al. [66], solid and robust correlations between metal pairs ranging from r = 0.7 to r = 0.9 indicate their common origin. In Table 4, only the correlations of metals with Cd were found to be low at around r = 0.22, which indicate a lack of cross-correlation. Negative correlations of metals with OM and pH were also observed, which may affect their distribution in the study catchment.
Table 5.
Pearson correlations among concentrations of heavy metals and properties of sediments.
These results reveal two different likely sources of metals: anthropogenic and lithological [67,68]. The high number of detected correlations of metal pairs poses questions about their possible sources. The most polluted waters were discharged from Ukraine, the Lviv agglomeration, the Volyn region; and Belarus, the Brest region.
The impact of pollution brought from outside the border and discharged in Poland makes the border section of the Bug River polluted [68,69,70]. As expected when analyzing Pearson correlation coefficients, the results of the factor analysis were very pronounced. The total FA variance was 70% and 15% for F1 and F2, respectively (Table 6). F1 strongly correlated with Pb, Cr, Cu, Zn, Ni, Fe, Mn, and pH, and F2 with Cd and OM. The number of factors was determined based on the sag and Kaiser criteria. Sources F1 and F2 are both anthropogenic and lithogenic, as evidenced by the associations of the studied metals with Fe, Mn, OM, and sediment pH. The sources of metals in the Bug River catchment were mentioned previously.
Table 6.
Classification of examined elements according to multivariate analysis (factor analysis).
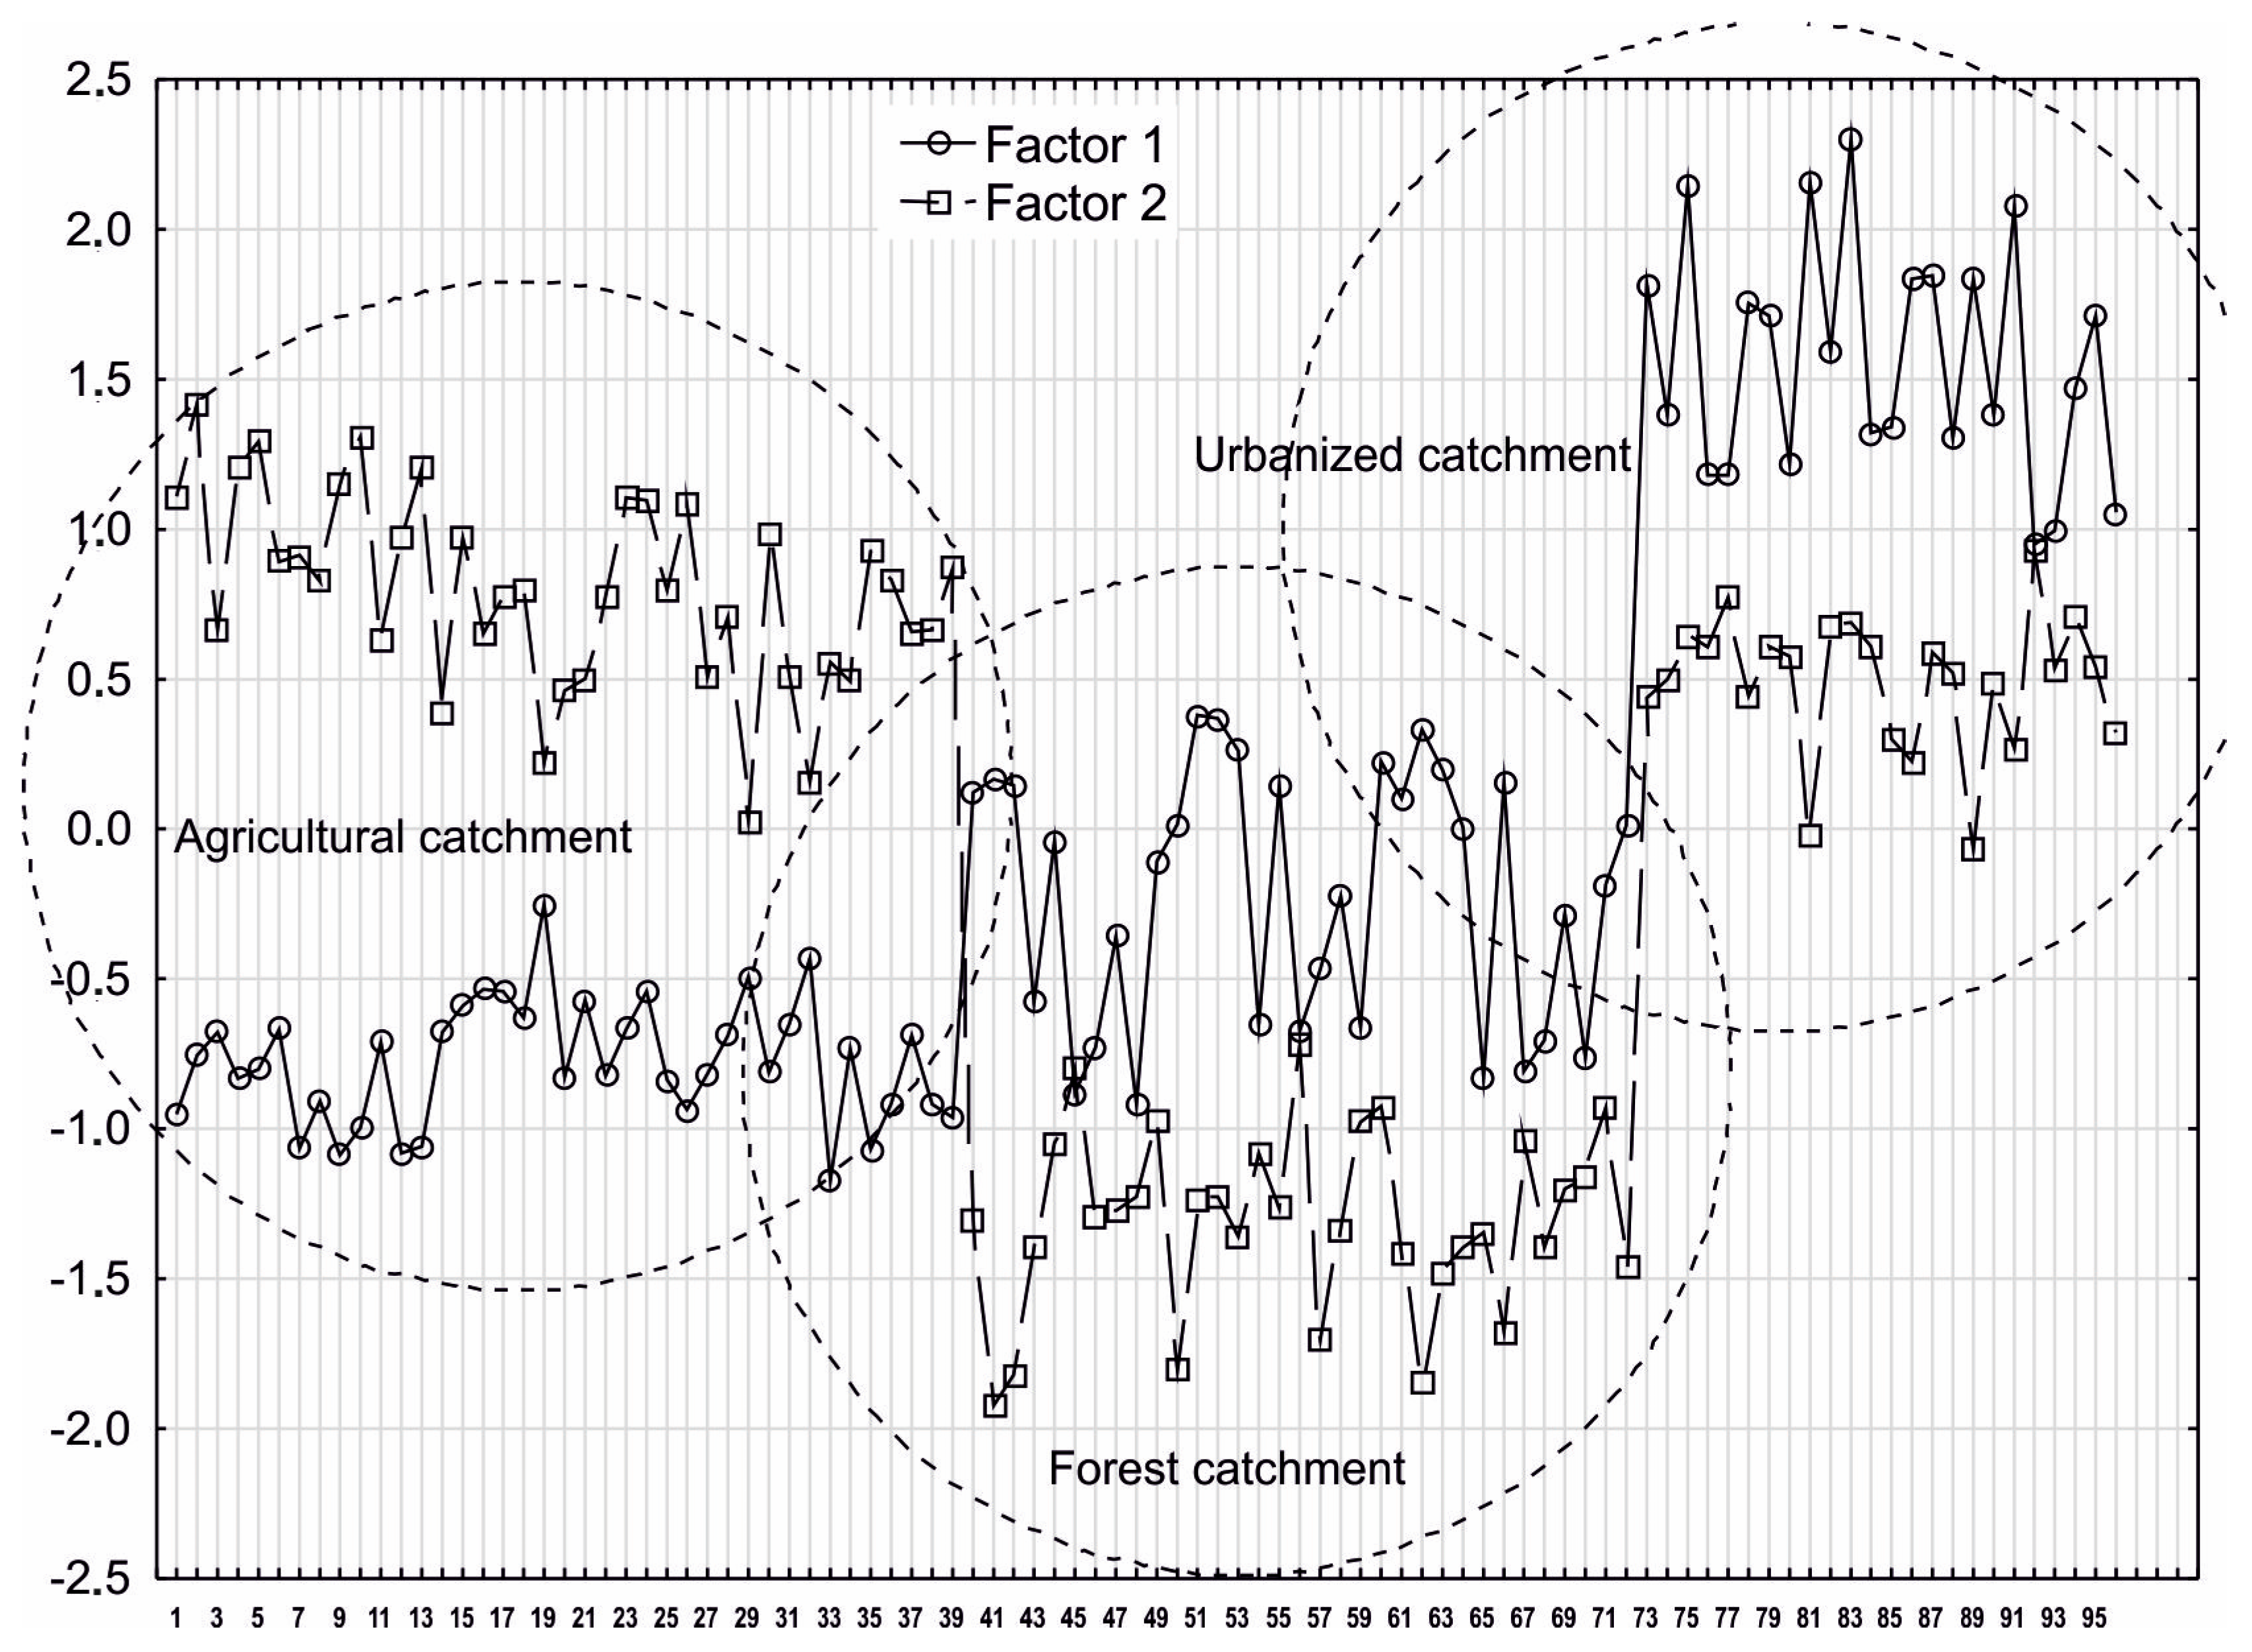
In order to present the results of the factor analysis more accurately, F1 and F2 values were estimated. The factor values at each measurement and control point were obtained. Figure 6 shows the changes in factor values for the points studied. Three groups of points were identified for each factor during the analysis of the factor values. The first group included points located within the agricultural catchment, the second included points in the forested catchment, and the third referred to the urbanized catchment. The highest factor values for F1 were observed at points within the urbanized catchment, followed by the forested and agricultural catchments, which were dictated by the metal sources in the Bug catchment identified earlier. Factor F1 correlated with most of the metals studied.
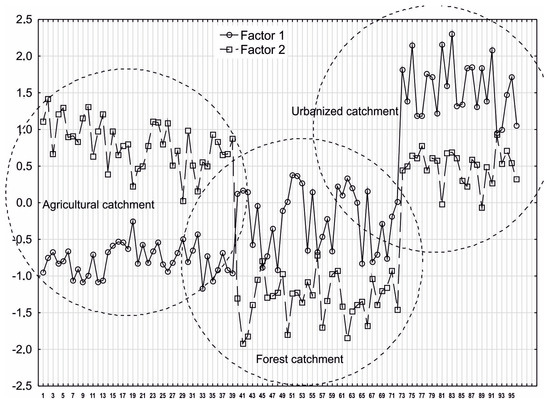
Figure 6.
Factor scores in points.
The agricultural catchment group had the highest factor values for F2, associated with Cd and OM, followed by the urbanized and forested catchments. This may have resulted from the runoff from fields containing large amounts of phosphate and organic fertilizers. Phosphate fertilizers contain Cd in their composition, while OM is, in turn, associated with organic fertilization in the Bug River catchment. Plants absorb Cd relatively quickly from the soil, so Cd accumulates in the food chain. Phosphorus fertilizers have been identified as an essential source of Cd entering the soil [71]. In the European Union, the permissible Cd content in phosphorus fertilizers is 60 mg/kg of dry matter of mineral fertilizers [72].
At the end of the Section 3, it is essential to highlight this research’s strengths and limitations. Although this study provides valuable information on the impact of urbanization and agricultural practices on the heavy metal content in the Bug River sediments, the generalization of the results may be influenced by the limited geographical scope, caused by the international location of the watershed across three countries (Poland, Ukraine, and Belarus). This led to the inability to collect samples from parts of the Bug River watershed (Ukraine and Belarus). This may affect the generalization of the results. Despite these limitations, this study provides valuable insights into the impact of urbanization and agricultural practices on the heavy metal content in the Bug River sediments, offering a new perspective on the scale and mechanisms of their accumulation in different watersheds. These results contribute to a better understanding the interactions between human activity and water quality, which is crucial for planning protection and remediation strategies. Additionally, this study provides a basis for further research and actions to improve water quality in regions exposed to heavy metal pollution.
4. Conclusions
According to the results of this study conducted in the Bug River catchment, it can be concluded that the concentrations of the studied heavy metals in the river sediments varied depending on the type of land use, with higher concentrations in urban areas, where the cadmium concentration reached values up to 2.5 mg/kg, compared to agricultural and forested areas, where concentrations were significantly lower. This indicates the significant impact of human activities, particularly urbanization, on the levels of heavy metal contamination in river sediments. The obtained Igeo and CF values confirmed a slight increase in cadmium levels in sediments, especially in agricultural and urban areas, suggesting the predominance of anthropogenic influences over natural sources of heavy metals.
The PLI values were the highest in urban areas, reaching 0.9, indicating higher pollution levels. However, they generally did not exceed the value of one, suggesting a low level of contamination. Statistical models revealed that the F1 factor values, which correlated with most of the studied metals, were highest at the measurement points in the urban catchments, further highlighting the impact of urbanization on heavy metal contamination in sediments.
This study confirms that effective river water quality management requires continuous monitoring and an understanding of anthropogenic and natural pollution sources to develop and implement effective strategies to minimize the adverse effects of heavy metal contamination. Additionally, these results provide in-depth knowledge about the distribution of heavy metals in the Bug River catchment and offer critical insights into optimizing pollution management strategies and developing remediation methods. The results can also serve as a valuable source of information for local and regional policymakers in planning protective actions to improve water quality and protect public health.
Author Contributions
Conceptualization, E.S., M.S. (Mirosław Skorbiłowicz), M.S. (Marcin Sidoruk) and P.O.; methodology, E.S.; software, M.S. (Mirosław Skorbiłowicz); validation, M.S. (Mirosław Skorbiłowicz), E.S. and M.S. (Marcin Sidoruk); formal analysis, E.S., P.O. and M.S. (Mirosław Skorbiłowicz); investigation, M.S. (Marcin Sidoruk); writing—original draft preparation, E.S., M.S. (Mirosław Skorbiłowicz), M.S. (Marcin Sidoruk), P.O. and U.T.; writing—review and editing, E.S., M.S. (Mirosław Skorbiłowicz) and M.S. (Marcin Sidoruk); visualization, E.S., M.S. (Mirosław Skorbiłowicz) and M.S. (Marcin Sidoruk); supervision, E.S.; project administration, E.S.; funding acquisition, E.S. and M.S. (Marcin Sidoruk). All authors have read and agreed to the published version of the manuscript.
Funding
This research was carried out as part of research project No. WZ/WB-II ́S/2/2021 at Białystok University of Technology and financed by a subsidy provided by the Minister of Science and Higher Education. Funded by the Minister of Science under “the Regional Initiative of Excellence Program References”.
Data Availability Statement
The authors will make data available upon request.
Conflicts of Interest
The authors declare no conflicts of interest.
References
- Shu, Q.; Ma, Y.; Liu, Q.; Zhang, S.; Hu, Z.; Yang, P. Levels and ecological risk of heavy metals in the surface sediments of tidal fats along the North Jiangsu coast, China. Mar. Pollut. Bull. 2021, 170, 112663. [Google Scholar] [CrossRef] [PubMed]
- Ustaoğlu, F.; Islam, M.S. Potential toxic elements in sediment of some rivers at Giresun, Northeast Turkey: A preliminary assessment for ecotoxicological status and health risk. Ecol. Ind. 2020, 113, 106237. [Google Scholar] [CrossRef]
- Mason, R.P. Trace Metals in Aquatic Systems; John Wiley and Sons: Hoboken, NJ, USA, 2013; p. 440. [Google Scholar]
- Skorbiłowicz, E. Assessment of heavy metals contents in surface sediments of Bug River. J. Ecol. Eng. 2014, 15, 82–89. [Google Scholar]
- Sidoruk, M.; Cymes, I. Effect of water management technology used in trout culture on water quality in fish ponds. Water 2018, 10, 1264. [Google Scholar] [CrossRef]
- Niu, Y.; Chen, F.; Li, Y.; Ren, B. Trends and sources of heavy metal pollution in global river and lake sediments from 1970 to 2018. Rev. Environ. Contam. Toxicol. 2020, 257, 1–13. [Google Scholar]
- Sidoruk, M.; Cymes, I.; Kobus, S. Impact of trout breeding in a cascade water flow technology on water quality. J. Elem. 2020, 25, 399–411. [Google Scholar] [CrossRef]
- Sun, X.; Fan, D.; Liu, M.; Tian, Y.; Pang, Y. Source identifcation, geochemical normalization and infuence factors of heavy metals in Yangtze River Estuary sediment. Environ. Pollut. 2018, 241, 938–949. [Google Scholar] [CrossRef] [PubMed]
- Sanz-Prada, L.; García-Ordiales, E.; Roquńí, N.; Gil, J.A.G.; Loredo, J. Geochemical distribution of selected heavy metals in the Asturian coastline sediments (North of Spain). Mar. Pollut. Bull. 2020, 156, 111263. [Google Scholar] [CrossRef] [PubMed]
- Taghavi, M.; Bakhshi, K.; Zarei, A.; Hoseinzadeh, E.; Gholizadeh, A. Soil pollution indices and health risk assessment of metal(loid)s in the agricultural soil of pistachio orchards. Sci. Rep. 2024, 14, 8971. [Google Scholar] [CrossRef]
- Garcia-Ordiales, E.; Loredo, J.; Covelli, S.; Esbri, J.M.; Millan, R.; Higueras, P. Trace metal pollution in freshwater sediments of the world’s largest mercury mining district: Sources, spatial distribution, and environmental implications. J. Soils Sediments 2017, 17, 1893–1904. [Google Scholar] [CrossRef]
- Zhang, L.; Shi, Z.; Zhang, J.; Jiang, Z.; Wang, F.; Huang, X. Spatial and seasonal characteristics of dissolved heavy metals in the east and west Guangdong coastal waters, South China. Mar. Pollut. Bull. 2015, 95, 419–426. [Google Scholar] [CrossRef] [PubMed]
- Rahman, M.; Saha, N.; Molla, A.; Al-Reza, S. Assessment of Anthropogenic Infuence on Heavy Metals Contamination in the Aquatic Ecosystem Components. Water, Sediment, and Fish. Soil Sediment Contam. 2014, 23, 353–373. [Google Scholar] [CrossRef]
- Dong, B.; Qin, B.; Li, W.; Gao, G. Growth and Community Composition of Submerged Macrophytes in Lake Taihu (China): Assessment of Changes in Response to Sediment Characteristics. Wetlands 2016, 37, 233–243. [Google Scholar] [CrossRef]
- Dong, Z.; Liu, H.; Baiyinbaoligao; Hu, H.; Khan, M.Y.A.; Wen, J.; Chen, L.; Tian, F. Future projection of seasonal drought characteristics using CMIP6 in the Lancang-Mekong River Basin. J. Hydrol. 2022, 610, 127815. [Google Scholar] [CrossRef]
- Erol, S.; Neven, C.; Stanislav, F.B.; Ali, K.M.; Mihri, H. Contamination assessment of ecotoxic metals in recent sediments from the Ergene River, Turkey. Environ. Earth Sci. 2016, 75, 1051. [Google Scholar] [CrossRef]
- Sojka, M.; Jaskuła, J. Heavy metals in river sediments: Contamination, toxicity, and source identification—A case study from Poland. Int. J. Environ. Res. Public Health 2022, 19, 10502. [Google Scholar] [CrossRef] [PubMed]
- Liu, A.; Duodu, G.; Goonetilleke, A.; Ayoko, G. Infuence of land use confgurations on river sediment pollution. Environ. Pollut. 2017, 229, 639–646. [Google Scholar] [CrossRef] [PubMed]
- Islam, M.S.; Hossain, M.B.; Matin, A.; Sarker, M.S.I. Assessment of heavy metal pollution, distribution and source apportionment in the sediment from Feni River estuary, Bangladesh. Chemosphere 2018, 202, 25–32. [Google Scholar] [CrossRef] [PubMed]
- Debnath, A.; Singh, P.K.; Sharma, Y.C. Metallic contamination of global river sediments and latest developments for their remediation. J. Environ. Manag. 2021, 298, 113378. [Google Scholar] [CrossRef]
- Skorbiłowicz, M.; Skorbiłowicz, E.; Tarasiuk, U.; Falkowska, M. Studies of heavy metal content in bottom sediments and aquatic plants near treated wastewater discharge. Geology Geoph. Environ. 2017, 43, 311–325. [Google Scholar] [CrossRef]
- Yuan, Q.; Wang, P.; Wang, C.; Chen, J.; Feng, T. Metals and metalloids distribution, source identifcation, and ecological risks in riverbed sediments of the Jinsha River, China. J. Geochem. Explor. 2019, 205, 106334. [Google Scholar] [CrossRef]
- Bojakowska, I. Criteria for assessing the pollution of water sediment. Prz. Geol. 2001, 49, 213–218. [Google Scholar]
- Lis, J.; Pasieczna, A. Geochemical Atlas of Polond 1:2 500 000; Polish Geological Institute: Warszawa, Poland, 1995; p. 34. [Google Scholar]
- Bojakowska, I.; Sokołowska, G. [Geochemical classes of purity of aquatic sediments] Geochemiczne klasy czystości osadów wodnych. Prz. Geol. 1998, 46, 49–54. (In Polish) [Google Scholar]
- Turekian, K.K.; Wedepohl, K.H. Distribution of the Elements in Some Major Units of the Earth’s Crust. Geol. Soc. Am. Bull. 1961, 72, 175–192. [Google Scholar] [CrossRef]
- Müller, G. Schwermetalle in den sedimenten des Rheins, Veranderungen Seit 1971. Umschau 1979, 79, 778–783. [Google Scholar]
- Hakanson, L. An ecological risk index for aquatic pollution control. A sedimentological approach. Water Res. 1980, 14, 975–1001. [Google Scholar] [CrossRef]
- Tomlinson, D.L.; Wilson, J.G.; Harris, C.R.; Jeffrey, D.W. Problems in the Assessment of Heavy-Metal Levels in Estuaries and the Formation of a Pollution Index. Helgoländer Meeresunters. 1980, 33, 566–575. [Google Scholar] [CrossRef]
- Bhuiyon, M.A.H.; Parvez, L.; Islam, M.A.; Dampare, S.B.; Suzuki, S. Heavy metal pollution of coal mine-affected agricultural soils in the northern part of Bangladesh. J. Hazard. Mater. 2010, 173, 384–392. [Google Scholar] [CrossRef] [PubMed]
- Likuku, A.S.; Mmolawa, K.B.; Gaboutloeloe, G.K. Assessment of heavy metal enrichment and degree of contamination around the copper-nickel mine in the Selebi Phikwe region, Eastern Botswana. Environ. Ecol. Res. 2013, 1, 32–40. [Google Scholar] [CrossRef]
- Jiang, F.; Ren, B.; Hursthouse, A.S.; Zhou, Y. Trace metal pollution in topsoil surrounding the Xiangtan Manganese mine area (South-central China): Source identification, spatial distribution and assessment of potential ecological risks. Int. J. Environ. Res. Public Health 2018, 15, 2412. [Google Scholar] [CrossRef]
- Sajjadi, S.A.; Mohammadi, A.; Khosravi, R.; Zarei, A. Distribution, exposure, and human health risk analysis of heavy metals in drinking groundwater of Ghayen County, Iran. Geocarto Int. 2022, 37, 13127–13144. [Google Scholar] [CrossRef]
- Acksel, A.; Giani, L.; Stasch, C.; Kühn, P.; Eiter, S.; Potthoff, K.; Regier, T.; Leinweber, P. Humus-rich topsoils in SW Norway—Molecular and isotopic signatures of soil organic matter as indicators for anthropo-pedogenesis. Catena 2019, 172, 831–845. [Google Scholar] [CrossRef]
- Belzile, N.; Chen, Y.W.; Gunn, J.M.; Dixit, S.S. Sediment trace metal profiles in lakes of Killarney Park, Canada: From regional to continental influence. Environ. Pollut. 2004, 130, 239–248. [Google Scholar] [CrossRef]
- Guven, D.E.; Akinci, G. Effect of sediment size on bioleaching of heavy metals from contaminated sediments of Izmir Inner Bay. J. Environ. Sci. 2013, 25, 1784–1794. [Google Scholar] [CrossRef]
- Hacisalihoğlu, S.; Karaer, F. Relationships of Heavy Metals in Waterand Surface Sediment with Different Chemical Fractions in Lake Uluabat, Turkey. Polish J. Environ. Stud. 2016, 25, 1937–1946. [Google Scholar] [CrossRef] [PubMed]
- Khan, M.Y.A.; Wen, J. Evaluation of physicochemical and heavy metals characteristics in surface water under anthropogenic activities using multivariate statistical methods, Garra River, Ganges Basin, India. Environ. Eng. Res. 2021, 26, 200280. [Google Scholar] [CrossRef]
- Oost, K.V.; Cerdan, O.; Quine, T.A. Accelerated sediment fluxes by water and tillage erosion on European agricultural land. Earth Surf. Process. Landf. 2009, 34, 1625–1634. [Google Scholar] [CrossRef]
- Rastegari Mehr, M.; Shakeri, A.; Amjadian, K.; Khalilzadeh Poshtegal, M.; Sharifi, R. Bioavailability, distribution and health risk assessment of arsenic and heavy metals (HMs) in agricultural soils of Kermanshah Province, west of Iran. J. Environ. Health Sci. Eng. 2021, 19, 107–120. [Google Scholar] [CrossRef]
- De Andrade, L.C.; Tiecher, T.; de Oliveira, J.S.; Andreazza, R.; Inda, A.V.; de Oliveira Camargo, F.A. Sediment pollution in margins of the Lake Guaíba, Southern Brazil. Environ. Monit. Assess. 2018, 190, 3. [Google Scholar] [CrossRef]
- Kelepertzis, E. Accumulation of heavy metals in agricultural soils of Mediterranean: Insights from Argolida basin, Peloponnese. Greece. Geoderma 2014, 221–222, 82–90. [Google Scholar] [CrossRef]
- Tóth, G.; Hermann, T.; Da Silva, M.R.; Montanarella, L. Heavy metals in agricultural soils of the European Union with implications for food safety. Environ. Int. 2016, 88, 299–309. [Google Scholar] [CrossRef] [PubMed]
- Taghavi, M.; Darvishiyan, M.; Momeni, M.; Momeni, M.; Eslami, H.; Fallahzadeh, R.A.; Zarei, Z. Ecological risk assessment of trace elements (TEs) pollution and human health risk exposure in agricultural soils used for saffron cultivation. Sci. Rep. 2023, 13, 4556. [Google Scholar] [CrossRef] [PubMed]
- Lu, H.; Huang, S.; Deng, L.; Ji, B. A Critical Review of the Effectiveness of Biochar Coupled with Arbuscular Mycorrhizal Fungi in Soil Cadmium Immobilization. J. Fungi 2024, 10, 182. [Google Scholar] [CrossRef] [PubMed]
- Khan, M.Y.A.; Gani, K.M.; Chakrapani, G.J. Spatial and temporal variations of physicochemical and heavy metal pollution in Ramganga River—A tributary of River Ganges, India. Environ. Earth Sci. 2017, 76, 231. [Google Scholar] [CrossRef]
- Hayrat, A.; Eziz, M. Identification of the spatial distributions, pollution levels, sources, and health risk of heavy metals in surface dusts from Korla, NW China. Open Geosci. 2020, 12, 1338–1349. [Google Scholar] [CrossRef]
- Sterckeman, T.; Gossiaux, L.; Guimont, S.; Sirguey, C.; Lin, Z. Cadmium mass balance in French soils under annual crops: Scenarios for the next century. Sci. Total Environ. 2018, 639, 1440–1452. [Google Scholar] [CrossRef] [PubMed]
- Zahoor, I.; Mushtaq, A. Water pollution from agricultural activities: A critical global review. Int. J. Chem. Biochem. Sci. 2023, 23, 164–176. [Google Scholar]
- Milke, J.; Gałczyńska, M.; Wróbel, J. The Importance of Biological and Ecological Properties of Phragmites Australis (Cav.) Trin. Ex Steud., in Phytoremendiation of Aquatic Ecosystems-The Review. Water 2020, 12, 1770. [Google Scholar] [CrossRef]
- Ramírez-Pérez, A.M.; Álvarez-Vázquez, M.A.; De Ula-Álvarez, E.; de Blas, E. Environmental Assessment of Trace Metals in San Simon Bay Sediments (NW Iberian Peninsula). Minerals 2020, 10, 826. [Google Scholar] [CrossRef]
- Yang, C.; Wang, L.; Liu, Y.; Shan, B.; Sun, D. Spatial Distribution, Potential Risks and Source Identification of Heavy Metals in the Coastal Sediments of the NorthernBeibu Gulf, South China Sea. Int. J. Environ. Res. Public Health 2022, 19, 10205. [Google Scholar] [CrossRef]
- Kabadayi, F.; Cesur, H. Determination of Cu, Pb, Zn, Ni, Co, Cd and Mn in road dusts of Samsun City. Environ. Monit. Assess. 2010, 168, 241–253. [Google Scholar] [CrossRef] [PubMed]
- Bardelli, F.; Cattaruzza, E.; Gonella, F.; Rampazzo, G.; Valotto, G. Characterization of road dust collected in Traforo del San Bernardo highway tunnel: Fe and Mn speciation. Atmos. Environ. 2011, 45, 6459–6468. [Google Scholar] [CrossRef]
- Adamiec, E.; Jarosz-Krzemińska, E.; Wieszała, R. Heavy metals from non-exhaust vehicle emissions in urban and motorway road dusts. Environ. Monit. Assess. 2016, 188, 369. [Google Scholar] [CrossRef] [PubMed]
- Khan, M.Y.A.; Gani, K.M.; Chakrapani, G.J. Assessment of surface water quality and its spatial variation. A case study of Ramganga River, Ganga Basin, India. Arab. J. Geosci. 2016, 9, 28. [Google Scholar] [CrossRef]
- Rajaram, B.S.; Suryawanshi, P.V.; Bhanarkar, A.D.; Rao, C.V.C. Heavy metals contamination in road dust in Delhi city. India Environ. Earth Sci. 2014, 72, 3929–3938. [Google Scholar] [CrossRef]
- Zhu, Y.G.; Ioannidis, J.P.A.; Li, H.; Jones, K.C.; Martin, F.L. Understanding and harnessing the health effects of rapid urbanization in China. Environ. Sci. Technol. 2011, 45, 5099–5104. [Google Scholar] [CrossRef]
- Landre, A.L.; Winter, J.G.; Helm, P.; Hiriart-Baer, V.; Young, J. Metals in Lake Simcoe sediments and tributaries: Do recent trends indicate changing sources? J. Great Lakes Res. 2011, 37, 124–131. [Google Scholar] [CrossRef]
- Li, R.; Yuan, Y.; Li, C.; Sun, W.; Yang, M.; Wang, X. Environmental Health and Ecological Risk Assessment of Soil Heavy Metal Pollution in the Coastal Cities of Estuarine Bay—A Case Study of Hangzhou Bay, China. Toxics 2020, 8, 75. [Google Scholar] [CrossRef]
- Nazzal, Y.; Bárbulescu, A.; Howari, F.; Al-Taani, A.A.; Iqbal, J.; Xavier, C.M.; Sharma, M.; Dumitriu, C.S. Assessment of Metals Concentrations in Soils of Abu Dhabi Emirate Using Pollution Indices and Multivariate Statistics. Toxics 2021, 9, 95. [Google Scholar] [CrossRef]
- Skorbiłowicz, E.; Skorbiłowicz, M.; Rogowska, W. Temporal and spatial changes in metal contents of arable soils in the Bug river catchment in 1995–2015 (Poland). Int. J. Conserv. Sci. 2022, 13, 895–914. [Google Scholar]
- Suresh, G.; Ramasamy, V.; Meenakshisundaram, V.; Venkatachalapathy, R.; Ponnusamy, V. Influence of mineralogical and metal composition on natural radionuclide concentrations in the river sediments. Appl. Radiat. Isot. 2011, 69, 1466–1474. [Google Scholar] [CrossRef] [PubMed]
- Ke, X.; Gui, S.; Huang, H.; Zhang, H.; Wang, C.; Guo, W. Ecological risk assessment and source identification for metals in surface sediment from the Liaohe River protected area, China. Chemosphere 2017, 175, 473–481. [Google Scholar] [CrossRef] [PubMed]
- Bhuyan, M.S.; Bakar, M.A.; Akhtar, A.; Hossain, M.B.; Ali, M.M.; Islam, M.S. Metal contamination in surface water and sediment of the Meghna River, Bangladesh. Environ. Nanotechnol. Monit. Manag. 2017, 8, 273–279. [Google Scholar] [CrossRef]
- Ciazela, J.; Siepak, M.; Wojtowicz, P. Tracking metal contamination in a complex river-oxbow lake system: Middle Odra Valley, Germany/Poland. Sci. Total Environ. 2018, 616–617, 996–1006. [Google Scholar] [CrossRef] [PubMed]
- Islam, S.M.D.; Bhuiyan, M.A.H.; Rume, T.; Mohinuzzaman, M. Assessing heavy metal contamination in the surface sediments of Shitalakhya River, Bangladesh, using pollution evaluation indices and geo-spatial analysis. Pollution 2016, 2, 299–312. [Google Scholar]
- Zamora-Ledezma, C.; Negrete-Bolagay, D.; Figueroa, F.; Zamora-Ledezma, F.; Ni, M.; Alexis, F.; Guerrero, V.H. Heavy metal water pollution: A fresh look about hazards, novel and conventional remediation methods. Environ. Technol. Innov. 2021, 22, 101504. [Google Scholar] [CrossRef]
- Gopchak, I.; Kalko, A.; Basiuk, T.; Pinchuk, O.; Gerasimov, I.; Yaromenko, O.; Shkirynets, V. Assessment of surface water pollution in Western Bug River within the cross-border section of Ukraine. J. Water Land Dev. 2020, 46, 97–103. [Google Scholar] [CrossRef]
- Połeć, K.; Grzywna, A. Influence of Natural Barriers on Small Rivers for Changes in Water Quality Parameters. Water 2023, 15, 2065. [Google Scholar] [CrossRef]
- Chen, Y.; Wang, L.; Liang, T.; Xiao, J.; Li, J.; Wei, H.; Dong, L. Major ion and dissolved heavy metal geochemistry, distribution, and relationship in the overlying water of Dongting Lake. China Environ. Geochem. Health 2019, 41, 1091–1104. [Google Scholar] [CrossRef]
- Regulation (EU) 2019/1009 of the European Parliament and of the Council of 5 June 2019 laying down rules on the making available on the market of EU fertilising products and amending Regulations (EC) No. 1069/2009 and (EC) No. 1107/2009 and repealing Regulation (EC) No. 2003/2003. 25.6.2019. L 170/1.
Disclaimer/Publisher’s Note: The statements, opinions and data contained in all publications are solely those of the individual author(s) and contributor(s) and not of MDPI and/or the editor(s). MDPI and/or the editor(s) disclaim responsibility for any injury to people or property resulting from any ideas, methods, instructions or products referred to in the content. |
© 2024 by the authors. Licensee MDPI, Basel, Switzerland. This article is an open access article distributed under the terms and conditions of the Creative Commons Attribution (CC BY) license (https://creativecommons.org/licenses/by/4.0/).