Abstract
In the context of ever-increasing water demand and pressures on natural resources, efficient water management is becoming a major priority for contemporary society. Since nitrogen and phosphorus, as essential nutrients, play a crucial role in the dynamics of aquatic ecosystems, but excessive concentrations can cause eutrophication of receptors, they need to be eliminated as completely as possible while respecting the principles of a sustainable economy, efficiency, and quality. In this study, the efficiency of optimizing the technological process of wastewater treatment by dosing FeCl3 40% solution to reduce nitrogen and phosphorus concentrations in treated water was investigated. The results obtained revealed that the use of this type of flocculant resulted in an increase in the efficiency of the removal process of total N by an average of 35.57 mg/L and total P by an average of 3.89 mg/L. Also, the results, which are interpreted by mathematical modeling, show that the optimal use of FeCl3 40% solution leads to a significant reduction in pollutants, well below the maximum permitted values (according to Romanian regulations, the maximum value for total phosphorus is 2 mg/L and total nitrogen is 15 mg/L for localities with a population between 10,000 and 100,000 inhabitants). This technical approach not only improves the quality of treated water but also contributes to minimizing the impact on aquatic ecosystems and promotes the principles of circular economy in water resource management. By optimizing the dosage of FeCl3 40% solution in the treatment process, the efficiency of the coagulation and flocculation processes is maximized, thus providing a viable and sustainable solution for reducing the environmental impact of nitrogen and phosphorus and promoting responsible and sustainable water resource management.
1. Introduction
Biogenic products from sewage treatment plants can be used as organic fertilizers [1,2,3]. They contain essential plant nutrients such as nitrogen, phosphorus, and potassium, as well as other trace elements and organic substances that can improve soil fertility [4,5]. By applying these organic fertilizers, efficient management of organic waste and sustainable use of resources can be achieved, helping to reduce reliance on chemical fertilizers and promote more sustainable and environmentally friendly agriculture [6,7,8,9]. The use of these biogenic products as fertilizers can also help to close the nutrient cycle and incorporate them into a circular system [4,6,10,11].
The search for efficient solutions for recycling and reuse of resources, as well as the development of more sustainable and efficient technologies, can lead to significant improvements in wastewater treatment processes [11,12,13,14,15]. In this regard, the literature presents various opportunities that can contribute to significant improvements in wastewater treatment processes [12,16,17,18,19,20]. Life cycle analysis, sewage sludge recovery, reuse of treated water, or optimization of treatment processes are just a few examples of good practices that are currently successfully applied in wastewater treatment plants [21,22].
Nutrients such as phosphorus and nitrogen can be recovered from treated wastewater and used in agriculture or other industrial processes [23]. These substances are essential for soil fertilization and can replace chemical fertilizers obtained from non-renewable sources [23]. In their study, Dereszewska and Cytawa developed a spreadsheet to determine the nutrient content (P and N) of wastewater and biomass at each stage of the treatment line and estimated the amount of readily available nutrient-rich organic matter that can be returned to the environment as organic fertilizer [24]. Also, the reuse of nutrients recovered from wastewater has a very positive impact on the environment; primarily, it prevents water bodies from discharging excess nutrients (eutrophication) [2,6,8,25].
From the study of potential sources of highly polluting substances, nitrogen and phosphorus are nowadays a constant presence in wastewater from both the population and industry [3,6,26]. Household wastewater usually has both nitrogen and phosphorus compounds, mainly due to the widespread use of detergents and dissolvable solutions in domestic drinking water [2,3,27,28].
Domestic wastewater also contains more phosphorus than is necessary for the nutrient balance of the water, which can contribute substantially to eutrophication and therefore needs to be removed by physical-chemical treatment [16].
According to the Treaty of Accession to the European Union, Romania has undertaken obligations involving significant investments in the water and sewage sector so that drinking water complies with the quality indicators imposed by the European Union, and by 2018, wastewater collection and treatment will be carried out in 2346 urban agglomerations with a population between 2000 and 10,000 [29].
In the framework of this study, the monitoring of raw and treated wastewater was carried out at the Dumbrăveni Wastewater Treatment Plant (WWTP), which is located within the urban area of the locality, on a 25,869 sq.m. plot on the right bank of the Târnava Mare river.
The Dumbrăveni WWTP (Figure 1) is designed for a relatively small number of inhabitants (7100 LE), and in the first instance, only the removal of organic and suspended matter was considered. According to NTPA-001 (HG188/2002, Annex 1, Table 2), for settlements with an equivalent population of less than 10,000 LE, both total phosphorus and total nitrogen are not required [30], but physical, chemical, biological, and bacteriological characteristics must comply with the values specified in NTPA-002 [31].
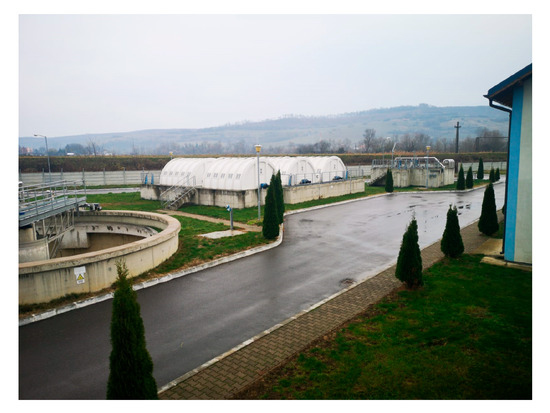
Figure 1.
Dumbrăveni Wastewater Treatment Plant.
Increasingly stringent European Union requirements, which are or are to be implemented in Romania, impose strict limits for nitrogen (total or ammoniacal) as well as phosphorus [30,31].
The monitoring of total nitrogen and total phosphorus quality indicators was additionally carried out, meeting the quality conditions imposed by the regulations in force on water protection since the technological process of the Dumbrăveni WWTP, with rotating biological contactors, has less than 10,000 LE.
In the present study, the influence of FeCl3 40% solution on the removal efficiency of total nitrogen and total phosphorus was analyzed [32]. Indicators were monitored in the year 2021 when FeCl3 40% solution dosing of concentration 40% was not applied and in years 2022 and 2023 when FeCl3 40% solution dosing was applied.
The objective of this work was to evaluate the parameters of wastewater treated by biological treatment, paying special attention to the monitoring of total nitrogen and total phosphorus as important quality indicators.
2. Materials and Methods
The dosage of the coagulant FeCl3 40% solution for phosphorus and nitrogen removal was calculated based on the average values of the physicochemical indicators (biochemical oxygen consumption, total phosphorus, and total nitrogen) and the average daily flow during the study years. During the study period, FeCl3 40% solution was dosed at the inlet to the biofilters after primary settling, always taking into account the values of the input parameters to the treatment plant.
FeCl3 40% solution performs several functions in wastewater treatment (California Water Technologies, Santa Fe Springs, CA, USA) [33]:
- It reacts with and precipitates soluble phosphates.
- It reacts with the alkalinity of water to form iron hydroxide, which acts as both a coagulant and flocculant, facilitating the settling of suspended solids, including precipitated ferric phosphate.
Additional dosing of an anionic polymer (polyelectrolyte) further enhances flocculation and sedimentation.
Excess ferric ions that have not reacted with phosphate will bind to soluble sulfites (forming an insoluble ferrous sulfite precipitate that has the secondary advantage of reducing odor) and various organic compounds contained in wastewater.
The following parameters were monitored in wastewater analyses: COD (chemical oxygen demand), BOD5 (biochemical oxygen demand determined at 5 days), total nitrogen, total phosphorus, and total suspended solids.
In this context, total nitrogen and total phosphorus were studied in detail as the most sensitive parameters (the determinations were made using the following equipment: Spectroquant UV-VIS—Xylem Analytics, Germany and Thermoreactor CR2200–Wissenschaftlich Technische Werkstatten, Weilheim, Germany), while the others were the indicators considered in the design of the treatment plant.
For laboratory analysis, the samples were taken in polyethylene containers, with the volume taken for analysis being two liters of wastewater. The flasks were filled to the top to limit sample contact with the gas phase and reduce agitation during transport. Sealing the stopper thus avoids several transformations that can occur in the sample, such as changes in carbon dioxide content and pH variations; prevents hydrogen carbonates from changing into insoluble carbonates; reduces the likelihood of iron (II) oxidation; and reduces the tendency for color change.
The identification system has been designed and implemented to ensure that the sample cannot be confused physically or in records from the time of collection and throughout its storage in the laboratory for analysis. The sample vials and working bottles were marked with numbers that corresponded to the different samples at the time of collection. These identifiers were then recorded in the records of the working steps.
Samples were received based on the accompanying sampling notes. At the reception, the following were taken into account: the integrity of the sample, the correct identification of the sample, and whether the container meets the requirements of the sample collection standard. The handling of the samples was carried out in such a way as to avoid the possibility of impurification or chemical contamination. Storage of samples was carried out in the refrigerator when the laboratory schedule did not allow for immediate analysis. Sampling and preservation of samples were carried out in the laboratory.
Sampling was carried out according to the standard for wastewater sampling (SR ISO 5667-10/1994—Water quality) [34].
The determination of physico-chemical parameters relevant to the efficiency of the treatment plant operation was carried out according to the standardized methods presented in Table 1.

Table 1.
Analytical standard used for physical-chemical analysis.
The determination of the dosage amount of FeCl3 40% solution coagulant for wastewater treatment at the Dumbrăveni wastewater treatment plant was performed by laboratory tests using the Jar Test method.
The Jar Test method is a laboratory procedure often used to determine the optimum operating conditions for water treatment or wastewater treatment. This method allows pH adjustments, variations in coagulant dosage, alternating mixing speed, or testing coagulants on a smaller scale to predict the performance of such a large-scale treatment operation.
Both the coagulant and the optimal dose depend on:
- -
- the amount of slurry to be retained;
- -
- the nature of the suspension;
- -
- the degree of purification (addresses factors that influence the choice of coagulant and optimal dosage in the wastewater treatment process);
- -
- wastewater flow rate, etc.
Water coagulation investigations are carried out using the Jar Test method in an apparatus consisting of a holder for 4–6 L cylinders, into which the water to be studied is introduced, together with known doses of coagulant, varying, for example, from 5 to 5 mg/dm3.
The apparatus has a motor for stirring the samples. At first, for 3 to 5 min—the time needed to mix the coagulant with the water in the cylinders—the samples are stirred at a high speed (≈ 150 rpm), then at a lower speed (40–50 rpm) for about 5 min—the time needed to flocculate the suspensions. Then, for 30 min, the contents of the cylinders are allowed to sediment, and the turbidity of the clarified water (supernatant) is determined (turbidimeter type Hach 2100P—Hach Company, Loveland, CO, U.S.A.). The sample with the lowest turbidity determines (turbidimeter type Endress Hauser Turbimax CUS51D—Endregess + Hauser, Germany) the optimum coagulant dose (2022 and 2023).
3. Results and Discussion
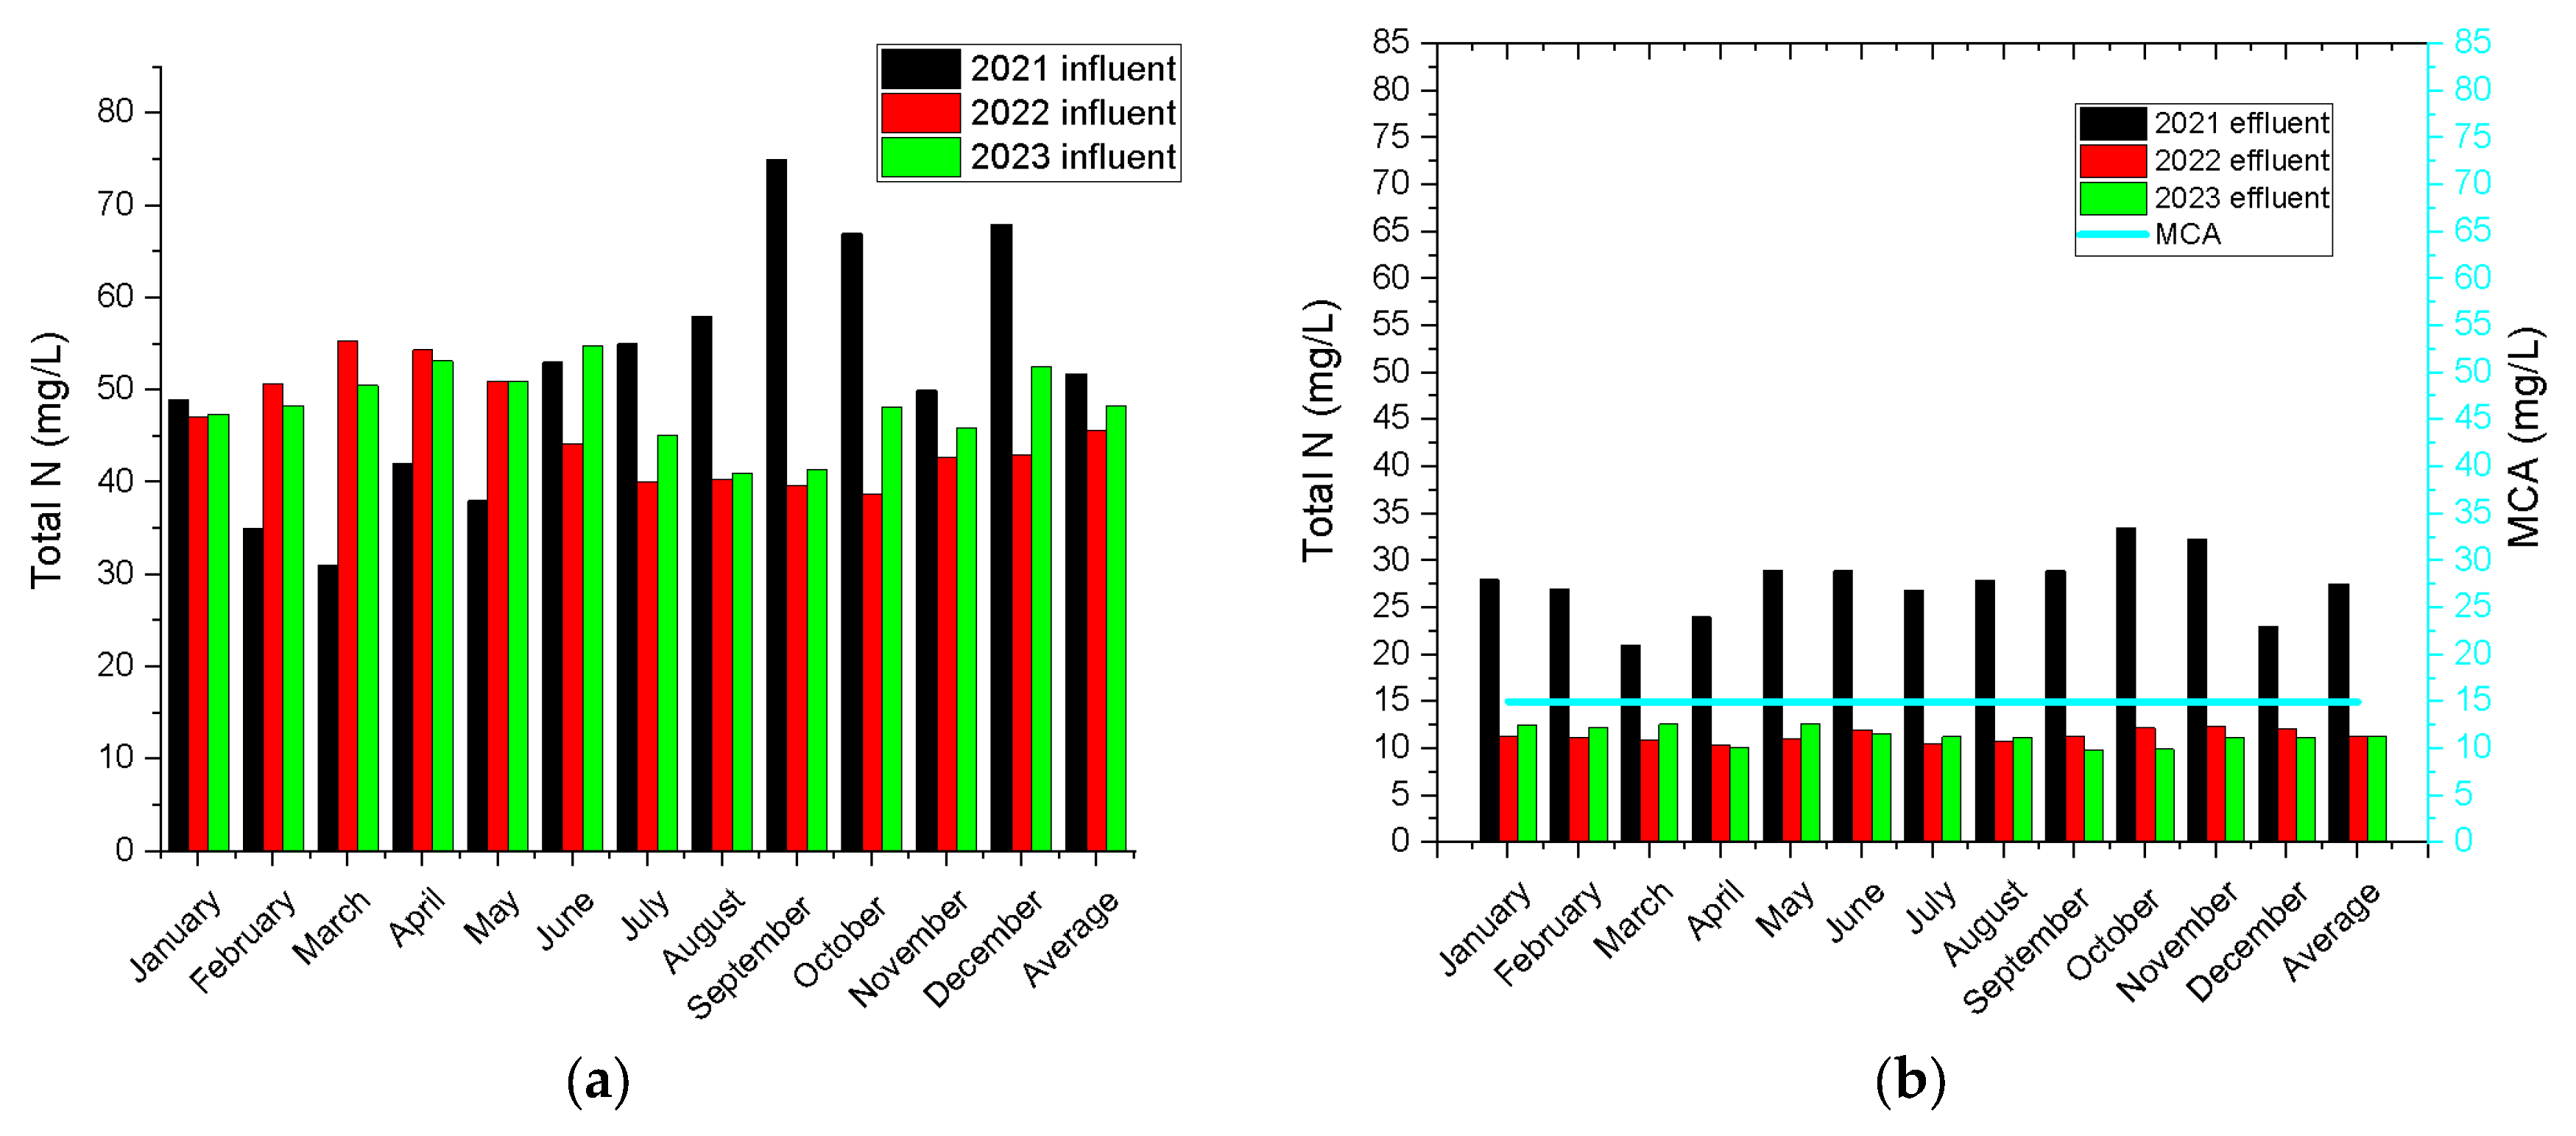
Figure 2 and Figure 3 show the values for total nitrogen and total phosphorus in influent and effluent from the biological treatment process, both in years when FeCl3 40% solution was not dosed and in years when dosing was carried out. The values shown in these figures are represented by the maximum permissible concentration (MCA) in the effluent (values indicated by legal norms) [30,31].
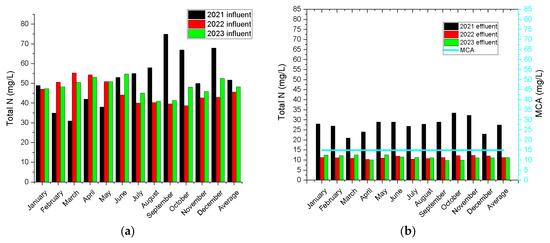
Figure 2.
Evolution of total nitrogen concentration compared to the year in which FeCl3 40% solution was not dosed and the years in which dosing was carried out: (a) influent; (b) effluent.
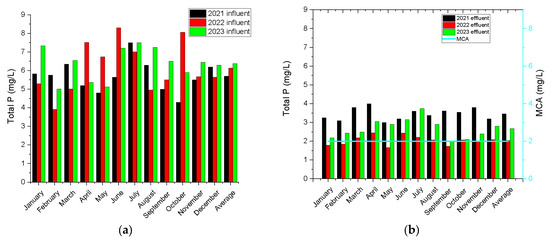
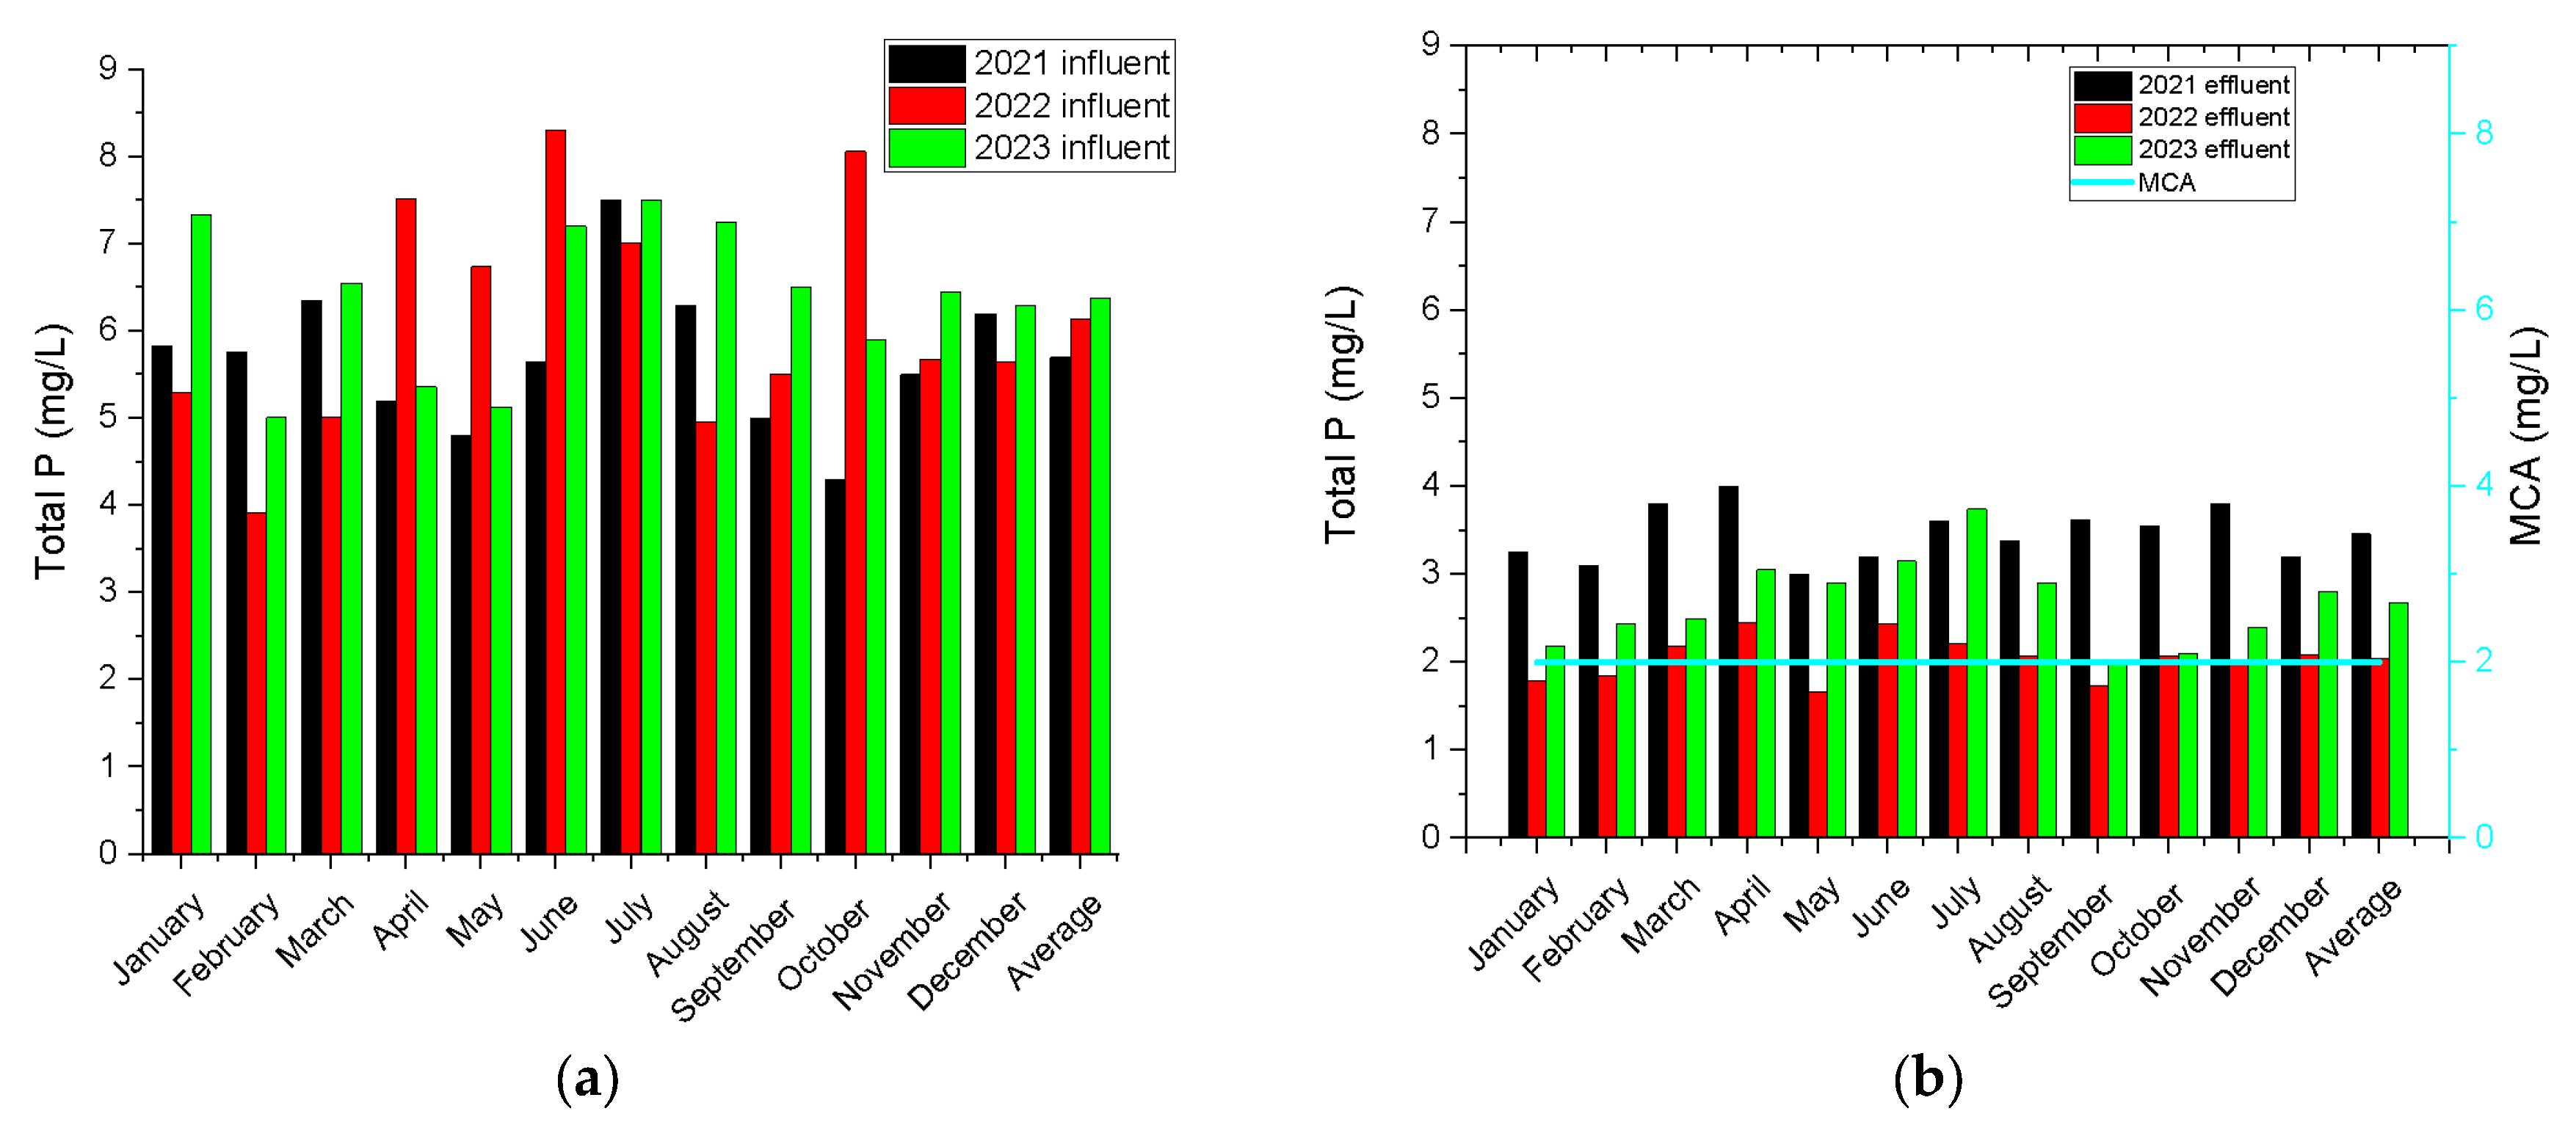
Figure 3.
Evolution of total phosphorus concentration compared to the year in which FeCl3 40% solution was not dosed and the years in which dosing was carried out: (a) values corresponding to the influent; (b) values corresponding to the effluent.
According to the data presented in Figure 2, the following conclusions can be drawn:
- -
- For the year 2021, the lowest value of total N removed from influent was 8 mg/L (corresponding to February), and the highest was identified for September and was 46.10 mg/L.
- -
- In the case of 2022, the lowest total N value removed was 26.56 mg/L (for October) and the highest was 44.44 mg/L (for March).
- -
- The lowest amount of total N removed from influent identified for the year 2023 was 29.82 mg/L (August), and the highest was 43.15 mg/L (June).
- -
- The data analysis shows that with the improvement of the method, the minimum amount of total N removed in the process of wastewater treatment in the Dumbrăveni Wastewater Treatment Plant has increased from year to year, reaching in the last year under analysis to be 272.75% more efficient than the first year. Looking at the maximum value of total N removed, it can be seen that it decreased in the last year compared to the first by 6.39%.
Several conclusions can also be drawn from the analysis of the data in Figure 3:
- -
- Referring to the minimum value of total P removed from the influent, a value of 0.75 mg/L was obtained in 2021, for 2022 a value of 2.06 mg/L, and for 2023 a value of 2.23 mg/L. An increase of 197.33% was identified in the last year compared to the first year.
- -
- Referring to the maximum values of total P removed from the influent, a value of 3.9 mg/L was obtained in 2021, for 2022 a value of 5.99 mg/L, and for 2023 a value of 4.5 mg/L. A fluctuation in the efficiency of the total P removal process was identified, with the greatest increase of 53.58% being obtained in 2022 compared to the first year.
The data presented in Figure 2 and Figure 3 lead to the conclusion that the use of a FeCl3 40% solution in the wastewater treatment process results in a significant improvement of this process, in particular by increasing total nitrogen and total phosphorus removal efficiency (the dose of FeCl3 40% solution was 6–7 L/day).
The basic theory underlying this, which has been confirmed in practice—through measurements carried out—assumes that the addition of a FeCl3 40% solution to the water, without changing the design and operating parameters of the treatment plant, stimulates, through the presence of ferric ions, the development of the microbiota responsible both for nitrification and denitrification and for the removal of phosphorus and other pollutants.
To verify this hypothesis and thus determine the extent to which the application of FeCl3 40% solution influences the efficiency of treatment, statistical data were selected, systematized, and analyzed from measurements taken in the year before the use of FeCl3 40% solution in the treatment plant and during the two years in which this solution was applied.
Thus, based on the records of monthly averages of influent and effluent total nitrogen and phosphorus, an efficiency was calculated, representing the monthly averages of the removal efficiencies of these two pollutants over the three years. The parameter values are shown in Table 2. The table contains the values for the period before the use of the FeCl3 40% solution, the year 2021, and for the period when the FeCl3 40% solution was used, the years 2022 and 2023.
Table 2.
Monthly averages of purification efficiency.
A preliminary analysis is a comparative analysis of the evolution of this parameter over the 12 calendar months of each year, based on the following graphs (Figure 4, Figure 5 and Figure 6).
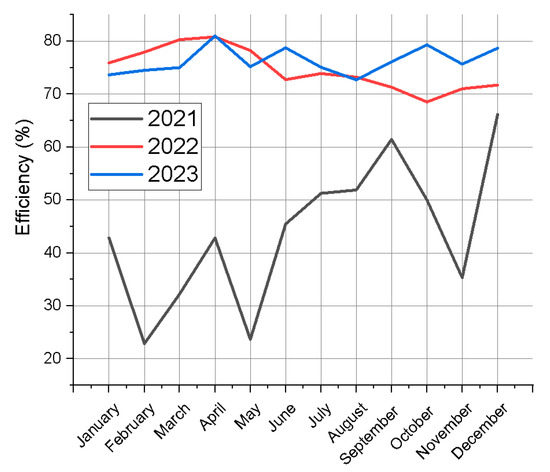
Figure 4.
Graphical representation of total nitrogen removal efficiency.
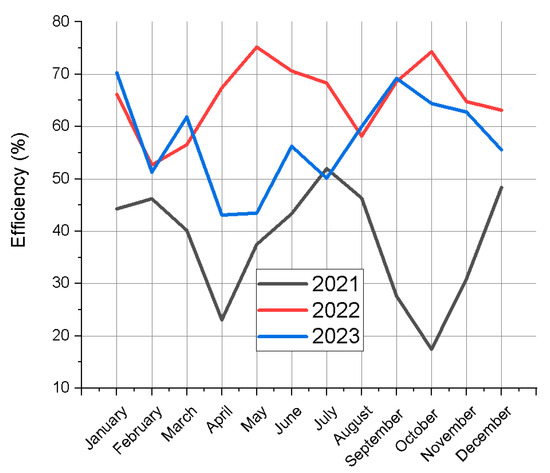
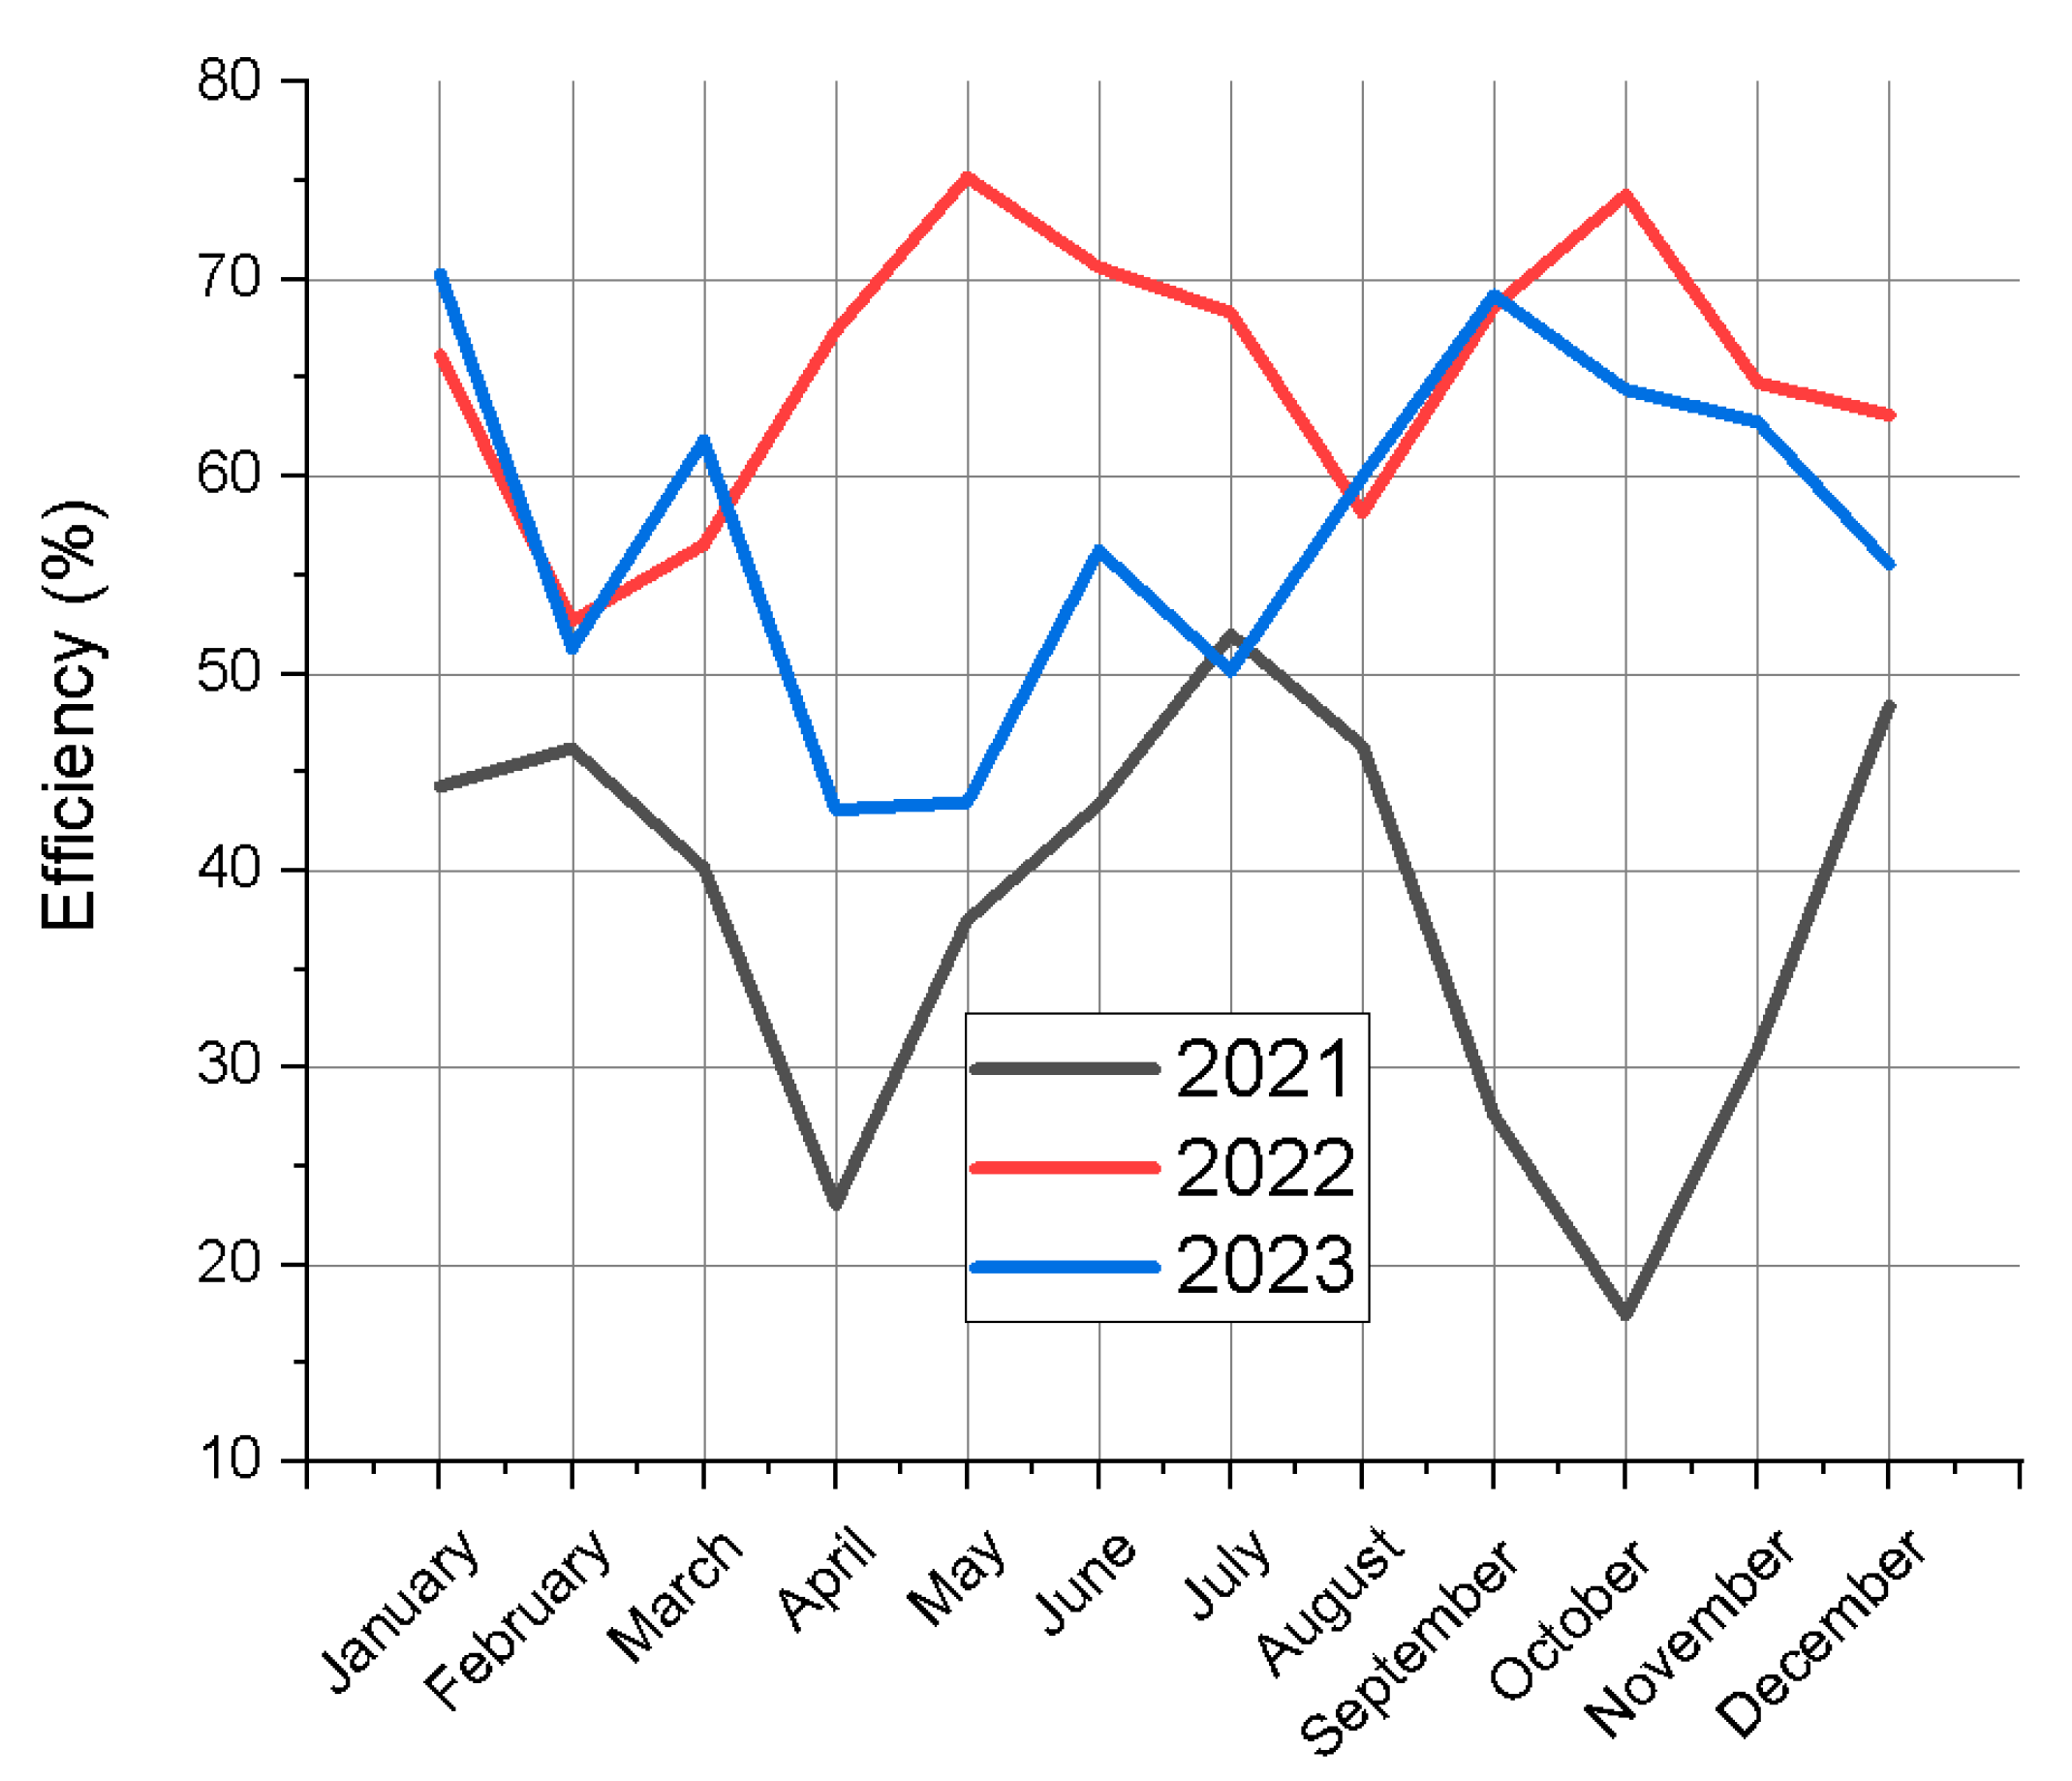
Figure 5.
Graphical representation of total phosphorus removal efficiency.
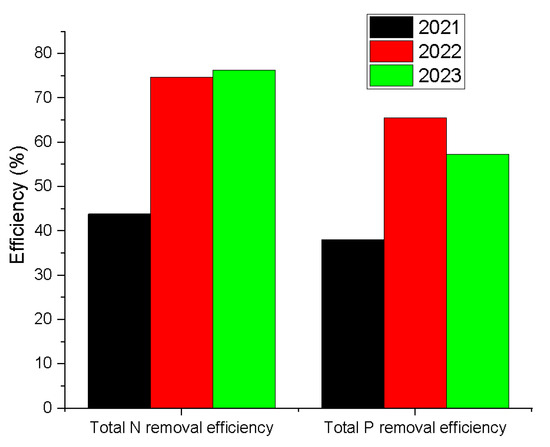
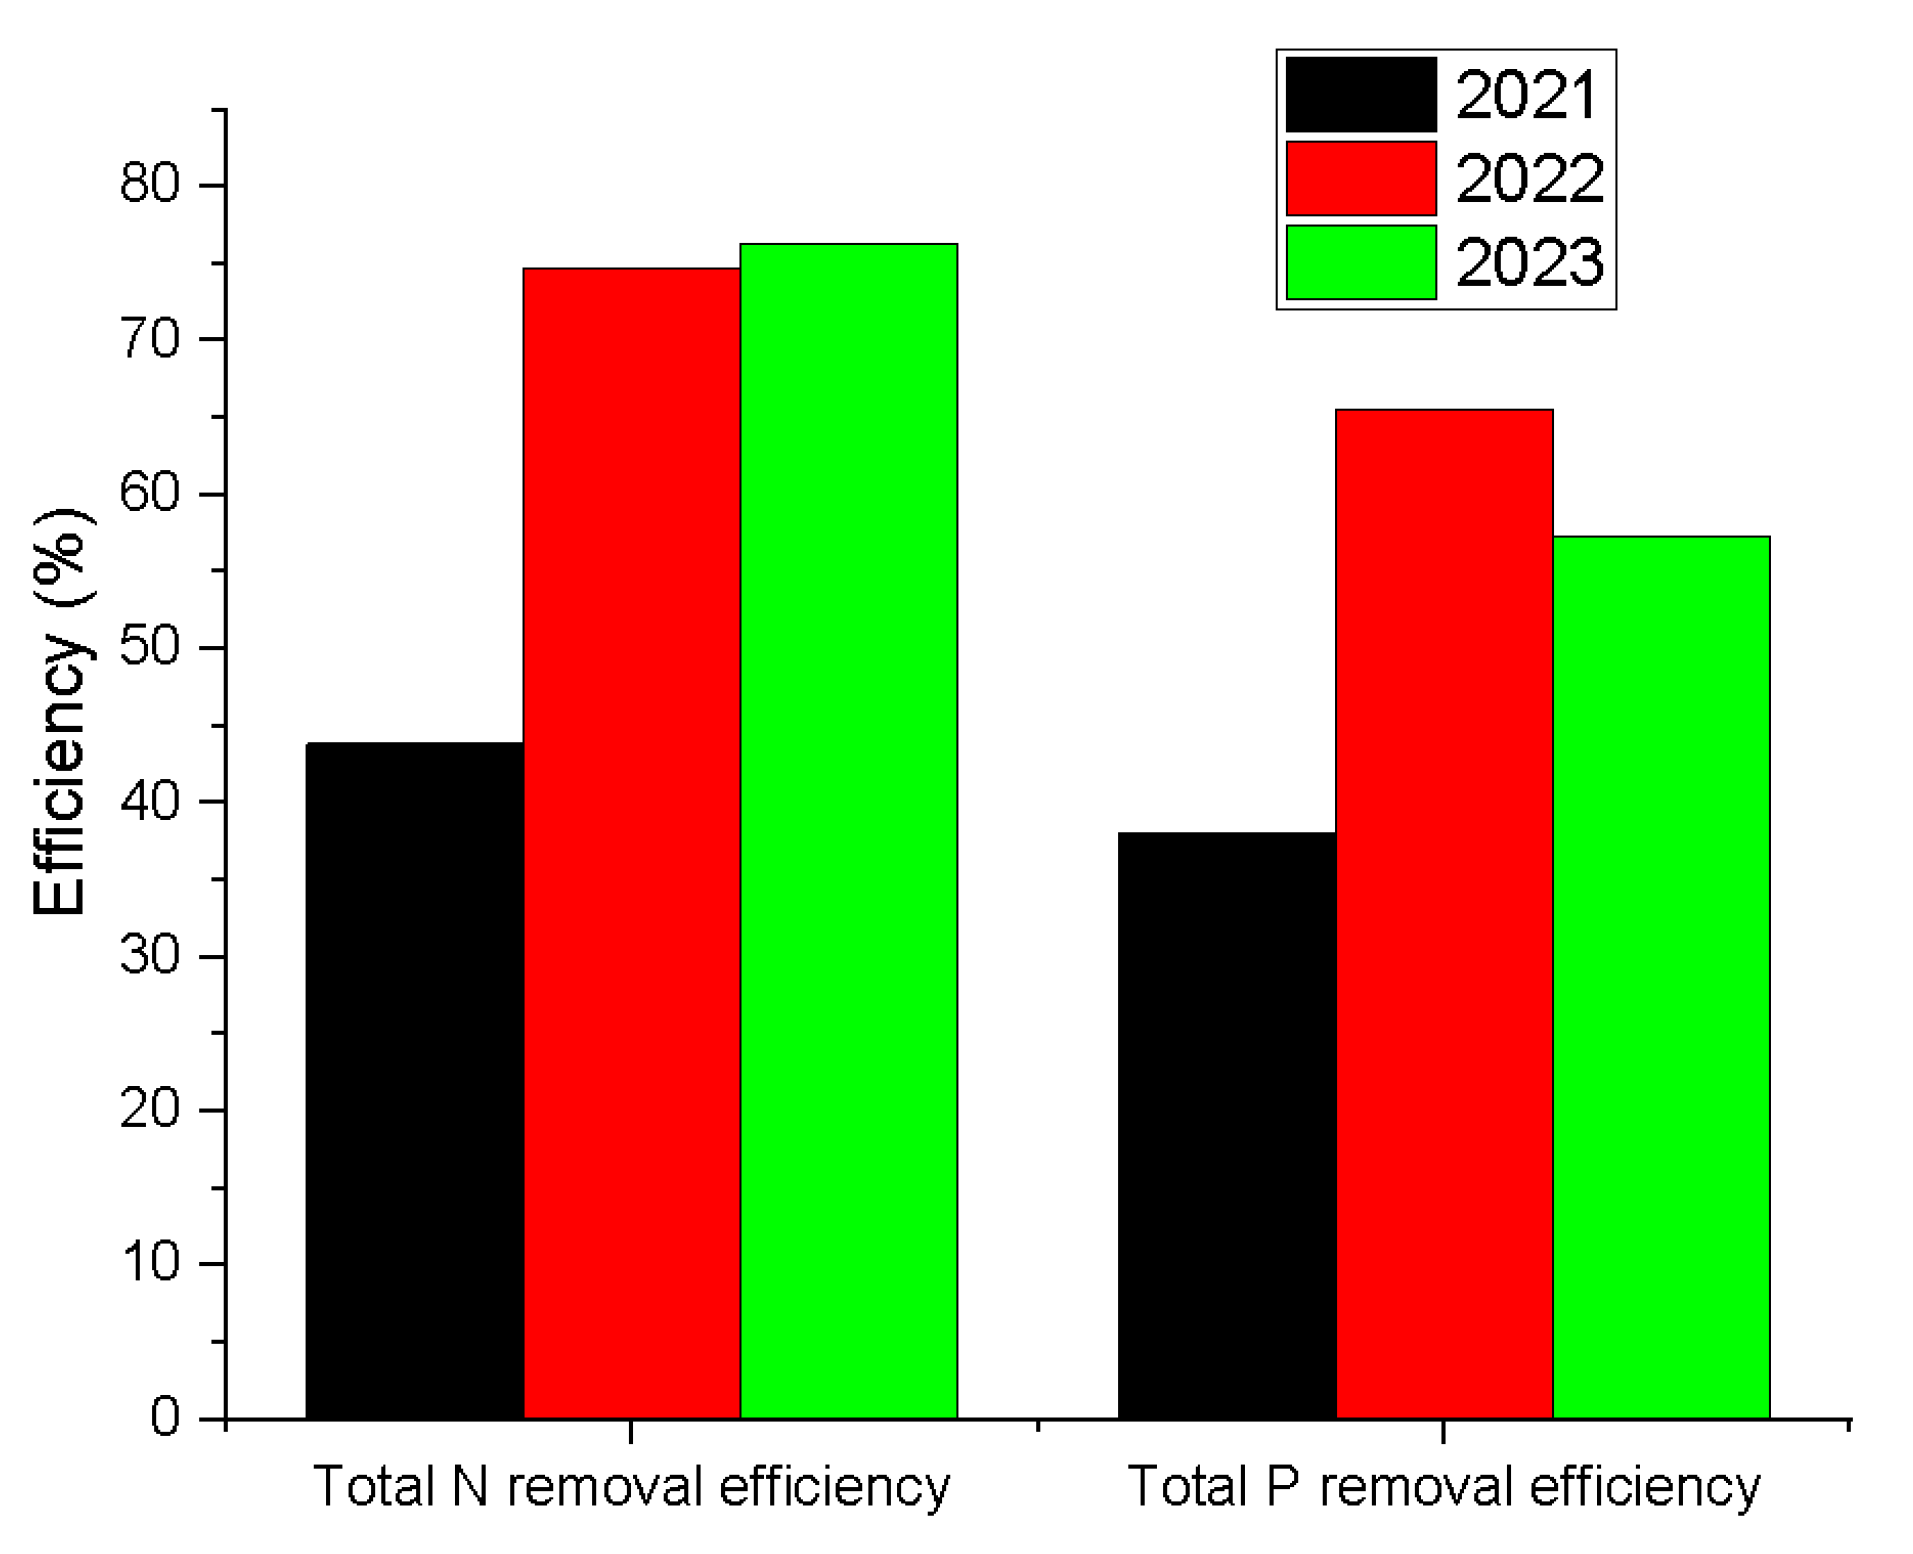
Figure 6.
Graphical representation of average annual treatment efficiency.
The graph on the evolution of nitrogen removal confirms a clear and significant increase in the parameter after the application of FeCl3 40% solution, from an annual average of 43.8% to over 76.3%. It can also be seen that, in 2021, the values fluctuated around the average by more than 20 points, while in 2022 and 2023, the evolution generally stabilized in the range of 68.5–81%.
A significant increase in purification efficiency is also observed for phosphorus, from an annual average of 38.1% to values reaching levels of 57.4–65.5% after application of the FeCl3 40% solution. In contrast to nitrogen, in the case of phosphorus, fluctuating developments of the parameter were observed both in 2021 and in 2022 and 2023. The graph can confirm that, for the most part, when comparing the same calendar months, they had opposite directions.
The annual evolution of the removal efficiency of these pollutants is eloquently illustrated in Figure 6.
The graph shows a significant, strong increase in efficiency for both pollutants in 2022 compared to 2021, i.e., with the use of FeCl3 40% solution in wastewater. In the next stage (year 2023), total nitrogen removal efficiency increases slightly, while total phosphorus removal efficiency shows a small but not insignificant decrease and remains well above the level of 2021.
Once the significant increase in removal efficiency has been demonstrated for both pollutants, it is useful to determine both the size of the effect and other statistical indicators explaining the influence that the use of FeCl3 40% solution has on the parameter under analysis. To this end, the data in Table 3 (purification efficiency data for total nitrogen removed and total phosphorus removed) are entered for analysis in the SPSS v. 17.0 (Statistical Package for the Social Sciences) application developed by IBM (New Orchard Road Armonk, New York, NY, USA). After processing, the output will generate a series of tables/graphs whose most important values will be presented and interpreted below.
Table 3.
Normality distribution test.
To be subject to statistical analysis methods, the variables (efficiency, in this case) must meet the condition of normality of distribution, i.e., no outliers or extremes. The Kolmogorov–Smirnov test is used to verify this condition.
The result is considered statistically insignificant, with Z-values correlated with a significance threshold of p (Sig.) > 0.05 confirming this. In other words, the efficiency values for all periods and pollutants analyzed do not differ significantly from a normal distribution.
The statistical method used was an analysis of variance (simple ANOVA) with repeated measurements. This involves studying, in three stages, the efficiency of the treatment plant in removing nitrogen and phosphorus from wastewater: one stage without the use of FeCl3 40% solution (2021) and two stages under the conditions of solution use (2022 and 2023).
By comparing the measurements for each calendar month, carried out in the three stages, the effect of the FeCl3 40% solution on the removal efficiency of the two pollutants is analyzed and interpreted.
The next step involves checking whether the variable (efficiency) meets the sphericity condition, i.e., the homogeneity of the correlation coefficients between each of the two steps. For this purpose, we use the results of Mauchly’s Test of Sphericity (Table 4).
Table 4.
Sphericity test—elimination of N.
For nitrogen removal efficiency, the sphericity condition in the first phase is not met, with W = 0.162 and p = 0.00 < 0.05 being statistically significant. Given this, the Greenhouse–Geisser correction is used, with the first two Epsilon coefficients being greater than 0.500 (lower-bound). As a result, the sphericity of the data is assumed, and the analysis can proceed. Correction means adjusting the degrees of freedom df (number of steps − 1 = 3 − 1 = 2), which involves multiplying it by the correction coefficient.
In the case of phosphorus removal efficiency, the sphericity condition (Table 5) is confirmed both by the values W = 0.907 and p = 0.612 > 0.05, which are not statistically significant, and by the fact that one of the Epsilon coefficients is equal to 1.
Table 5.
Sphericity test—elimination of P.
The actual interpretation of the statistical results starts with the analysis of the test values for within-subjects effects, as presented in Table 6 and Table 7. The term ‘within-subject effects’ means, in this case, the analysis and comparison of the effects of FeCl3 40% solution for the same calendar month in three different years.
Table 6.
Intra-subject effects test—N.
Table 7.
Intra-subject effects test—P.
Table 6 and Table 7 contain the results of the Levene test (also called the F-test), which compares the homogeneity of the variances. The variances must be relatively equal for each of the three stages of the experiment. In the case of phosphorus, with the sphericity condition being met (Sphericity Assumed), only the first row of the table is of interest. For nitrogen, the assumption of sphericity implies the adjustment of degrees of freedom, and the second row of the table (Greenhouse–Geisser) is considered.
Thus, in the case of nitrogen, the calculated value F (1.088; 22) = 52.152, being significant at a threshold p = 0.000 < 0.05, indicates significant differences between the steps analyzed in nitrogen removal efficiency. As a result, it can be stated that there is a significant effect of the use of FeCl3 40% solution on the total nitrogen removal efficiency of wastewater, with the risk of this statement being wrong being zero (Sig = 0.000). The same is confirmed for the evolution of total phosphorus removal efficiency by the value F(2; 22) = 23.506, which is also significant at a safety threshold of p = 0.000 < 0.05.
To support the conclusions from the intra-subject effects tests, the contrast test is also performed to highlight differences between the experimental steps. The contrast test generates Table 8 and Table 9.
Table 8.
Contrast test—N.
Table 9.
Contrast test—P.
The values obtained indicate the following in the case of total nitrogen removal efficiency (Table 8):
- -
- F(1; 42,655), p = 0.000 < 0.05—there are statistically significant differences between the Year 1 and Year 2 stages (“Level 1 vs. Level 2”);
- -
- F(1; 1393), p = 0.263 > 0.05—there are no statistically significant differences between Year 2 and Year 3 stages (“Level 2 vs. Level 3”).
In the case of phosphorus removal efficiency, we have (Table 9):
- -
- F(1; 38,063), p = 0.000 < 0.05—there are statistically significant differences between Year 1 and Year 2 stages (“Level 1 vs. Level 2”);
- -
- F(1; 5652), p = 0.037 < 0.05—there are statistically significant differences between Year 2 and Year 3 stages (“Level 2 vs. Level 3”).
Finally, we are interested in the size of the effect of the FeCl3 40% solution on pollutant removal from one stage to another, which is determined using the r indicator.
To be interpreted, the obtained values are related to some reference values established by J. Cohen (Table 10).
Table 10.
Reference values.
- -
- Nitrogen:
The value of 0.79 (Equation (1)) of the r coefficient leads to the conclusion that the application of FeCl3 40% solution in the wastewater had, in the first stage of use, a very strong effect on increasing the nitrogen removal efficiency. Or, in other words, we state that 79% of the increase in total nitrogen removal efficiency was due to the application of the FeCl3 40% solution.
The fact that there was no significant increase in efficiency in 2023 is due to the tendency for its values to stabilize at a constant level while maintaining the same operating parameters of the treatment plant, including the application of FeCl3 40% solution.
- -
- Phosphorus:
The value of 0.74 confirms (Equation (2)), again, that the application of FeCl3 40% solution to the wastewater had a very strong effect on increasing total phosphorus removal efficiency in the first stage, or that 74% of the increase in total phosphorus removal efficiency was due to the application of FeCl3 40% solution.
In the year 2023, compared to the year 2022, we observe a weak to medium strength effect (r = 0.29—Equation (3)), but with the caveat that the average annual efficiency decreased compared to the previous stage by 8.1%, from 65.5% to 57.4%. The value of r in this situation indicates that only 29% of the 8.1% decrease (i.e., 2.35 points) would be due to the FeCl3 40% solution. Although not significantly affected, future close monitoring of this parameter and of conditions or factors that may affect its stability is required.
Finally, an analysis is needed to reveal a possible link between total nitrogen removal efficiency and phosphorus removal efficiency. For this purpose, a Pearson correlation analysis of the two variables carried out for all three stages is used. Positive values of the correlation coefficient would indicate that the removal efficiency of one pollutant increases, to a certain extent, with an increase in the efficiency of the other pollutant, while negative values would indicate the extent to which the increase in one pollutant is related to a decrease in the other. This determines whether the trends of the two variables are interdependent. The results are shown in Table 11.
Table 11.
Correlations between total N removal efficiency and total P removal efficiency.
The values −0.333 and −0.287 of the coefficient, corresponding to the periods when the FeCl3 40% solution was used, indicate, at first sight, a negative correlation between the two variables, in the sense that the increase in the removal efficiency of one pollutant is, albeit to a small extent, related to the decrease in the efficiency of the other pollutant. However, this statement cannot be statistically assumed because the significance thresholds p (Sig.) = 0.145 and p (Sig.) = 0.183 are greater than 0.05, in which case the certainty of the correctness of this conclusion falls well below the accepted level of 95.
Therefore, from a statistical point of view, it can be argued that there is no significant correlation between the evolution of total nitrogen removal efficiency and phosphorus removal efficiency.
The statistical analysis shows that the lack of FeCl3 40% solution dosing in the non-dosing year indicates a reduction in total nitrogen and total phosphorus removal efficiency compared to years when FeCl3 40% solution is used in the treatment process.
The data analysis shows a positive relationship between FeCl3 40% solution dosing and the compliance of treated water with the maximum allowable concentrations of total phosphorus and total nitrogen according to Regulation 001 (Romanian law) [37].
4. Conclusions
The purified wastewater following the appropriate dosing of FeCl3 40% solution in the technological process met the quality standards set for total phosphorus and total nitrogen concentrations, highlighting the effectiveness of the proposed method. To meet the quality requirements, a series of analyses of certain parameters must be carried out after the treatment process (COD, BOD5, total P, total N, total suspended solids, etc.), but in this paper, we have focused on the importance of removing total nitrogen and total phosphorus.
The results validate the proposed experimental method as a viable and effective approach for sustainable management of total nitrogen and total phosphorus in the biological treatment process, with the potential to contribute to reducing environmental impact. In the year when FeCl3 40% solution was not dosed (2021), the total P removal efficiency was 39.32%, compared to the years when FeCl3 40% solution was dosed in 2022, when it was 66.65%, and in 2023, when it was 57.95%. The same can be said for total N, where the efficiency in the year when FeCl3 40% solution was not dosed was 46.80%, and in the years when it was dosed, in 2022 it was 75.10% and in 2023 it was 76.46%.
Based on statistical analysis, a significant correlation was observed between the dose of FeCl3 40% solution (the optimum application dose was determined between 50 and 70 g/m3 of wastewater, values obtained in the laboratory analysis of the wastewater treatment plant) used for total nitrogen and total phosphorus removal.
This research offers promising prospects for optimizing biological treatment processes, with the potential to improve the performance and sustainability of wastewater treatment systems.
As a result of this study, the treatment process implemented at Dumbrăveni Wastewater Treatment Plant resulted in increased efficiency in nitrogen removal, showing a significant increase in performance after the introduction of FeCl3 40% solution, with an increase from about 43.8% to over 76.3% average per year.
Total phosphorus removal efficiency also improved markedly, increasing from an annual average of around 40% to a range of 60–70% after the introduction of the FeCl3 40% solution.
A continuous optimization of the amount of ferric chloride added is necessary to ensure a more accurate dosing of the precipitation coagulant. Chemicals in wastewater, including nitrogen and phosphorus, can only be retained by advanced treatment, which involves additional costs and environmental and health risks.
The WWTP uses influent from the local sewage network, adapting to climatic conditions and technology. Although there are no strict requirements for nitrogen and phosphorus in WWTPs for communities of less than 10,000 inhabitants, removing these substances is recommended for environmental and pragmatic reasons.
To maintain or improve the quality of water discharged to the outfall, it is essential to reduce nutrients (N and P) in the wastewater treated at the WWTP. Even though there are no legal requirements for treatment plants serving communities smaller than 10,000 p.e., nitrogen and phosphorus removal is essential from an ecological and economic perspective.
The results and statistical analysis highlight a significant correlation between nitrogen and phosphorus removal effectiveness and optimized ferric chloride dosing. This promotes a promising direction for wastewater management strategies that combine technical efficiency with environmental responsibility in a sustainable economy.
Author Contributions
Conceptualization, methodology, writing—review and editing, supervision, formal analysis, O.I. and E.G.; software, M.S.; validation, E.M.; data curation, N.B.; writing—original draft, E.G. and M.S.; visualization, E.M. and N.B. All authors have read and agreed to the published version of the manuscript.
Funding
This research received no external funding.
Data Availability Statement
Data are contained within the article.
Conflicts of Interest
The authors declare no conflicts of interest. The funders had no role in the design of the study, in the collection, analysis, or interpretation of data, in the writing of the manuscript, or in the decision to publish the results.
References
- Efthymios, R.; Aivazidou, E.; Achillas, C.; Aidonis, D.; Bochtis, D. Water-energy-nutrients synergies in the agrifood sector: A circular economy framework. Energies 2021, 14, 159. [Google Scholar]
- Fazelipour, M.; Takdastan, A.; Borghei, S.M. Biological removal of nutrients (N & P) from urban wastewater with a modified integrated fixed-film activated sludge-oxic settling anoxic system using an anoxic sludge holding tank. Water Environ. J. 2021, 35, 830–846. [Google Scholar] [CrossRef]
- Gaşpar, E.; Munteanu, I.; Sîntea, S. Removal of N and P in a rotating biological contactor plant. Case study: Agnita, Romania. Water 2022, 14, 3670. [Google Scholar] [CrossRef]
- Gherghel, A.; Teodosiu, C.; De Gisi, S. A review on wastewater sludge valorisation and its challenges in the context of circular economy. J. Clean. Prod. 2019, 228, 244–263. [Google Scholar] [CrossRef]
- Godoy, C.B. Nutrient Recovery from a Wastewater Treatment Plant for Agricultural Applications in the Context of the Circular Economy: A Sustainable Analysis. Master’s Thesis, Universitat Politecnica de Catalunya, Barcelona, Spain, 2021. [Google Scholar]
- Kassouf, H.; García Parra, A.; Mulford, L.; Iranipour, G.; Ergas, S.J.; Cunningham, J.A. Mass fluxes of nitrogen and phos-phorus through water reclamation facilities: Case study of biological nutrient removal, aerobic sludge digestion, and side-stream recycle. Water Environ. Res. 2020, 92, 478–489. [Google Scholar] [CrossRef] [PubMed]
- Izadi, P.; Izadi, P.; Eldyasti, A. Design, operation and technology configurations for enhanced biological phosphorus removal (EBPR) process: A review. Rev. Environ. Sci. Biotechnol. 2020, 19, 561–593. [Google Scholar] [CrossRef]
- Gaspar, E.; Sava, C.; Caratus, M.; Barbu, C.H. Correlations among parameters and indicators within a wastewater treatment plant. case study: The WWTP of Medias, Romania. Environ. Eng. Manag. J. 2022, 21, 831–838. [Google Scholar]
- Holmes, D.E.; Dang, Y.; Smith, J.A. Nitrogen Cycling during Wastewater Treatment, 1st ed.; Elsevier Inc.: Amsterdam, The Netherlands, 2019; Volume 106. [Google Scholar]
- Hernández-Chover, V.; Castellet-Viciano, L.; Fuentes, R.; Hernández-Sancho, F. Circular economy and efficiency to ensure the sustainability in the wastewater treatment plants. J. Clean. Prod. 2023, 384, 135563. [Google Scholar] [CrossRef]
- Kalemba, K. Circular economy in wastewater treatment plant, Architecture. Civ. Eng. Environ. 2020, 13, 93–97. [Google Scholar]
- Di Capua, F.; de Sario, S.; Ferraro, A.; Petrella, A.; Race, M.; Pirozzi, F.; Fratino, U.; Spasiano, D. Phosphorous removal and recovery from urban wastewater: Current practices and new directions. Sci. Total Environ. 2022, 823, 153750. [Google Scholar] [CrossRef]
- McCarroll, M.; Hamann, H. What we know about water: A water literacy review. Water 2020, 12, 2803. [Google Scholar] [CrossRef]
- Lorenzo-Toja, Y.; Vázquez-Rowe, I.; Sergio, C.; Desirée, M.-N.; Teresa, M.M.; Gumersindo, F. Eco-efficiency analysis of Spanish WWTPs using the LCA + DEA method. Water Res. 2015, 68, 651–666. [Google Scholar] [CrossRef] [PubMed]
- Mizyed, A.G. Review on application of rotating biological contactor in removal of various pollutants from effluent. Technol. Biochem. 2021, 2, 41–61. [Google Scholar]
- Medrano, J.; Jaffe, J.; Lombardi, D.; Holzer, M.A.; Roemmele, C. Students’ scientific evaluations of water resources. Water 2020, 12, 2048. [Google Scholar] [CrossRef]
- Zulkifli, M.; Hasan, H.A.; Abdullah, S.R.S.; Muhamad, M.H. A review of ammonia removal using a biofilm-based reactor and its challenges. J. Environ. Manag. 2022, 315, 115162. [Google Scholar] [CrossRef] [PubMed]
- Pan, H.; Jie, R.; Xinyu, H.; Hu, Y. Comparison of two starch-based flocculants with polyacrylamide for the simultaneous removal of phosphorus and turbidity from simulated and actual wastewater samples in combination with FeCl3. Int. J. Biol. Macromol. 2021, 167, 223–232. [Google Scholar]
- Mulier, H.; Van de Ven, F.H.M.; Kirshen, P. Circularity in the urban water-energy-nutrients-food nexus. Energy Nexus 2022, 7, 100081. [Google Scholar] [CrossRef]
- Fuck, J.V.R.; Cechinel, M.A.P.; Neves, J.; Andrade, R.C.; Tristão, R.; Spogis, N.; Riella, H.G.; Soares, C.; Padoin, N. Predicting effluent quality parameters for wastewater treatment plant: A machine learning-based methodology. Chemosphere 2024, 352, 141472. [Google Scholar] [CrossRef]
- Smol, M.; Adam, C.; Krüger, O. Use of nutrients from wastewater for the fertilizer industry—Approaches towards the implementation of the circular economy (CE). Desalin. Water Treat. 2020, 186, 1–9. [Google Scholar] [CrossRef]
- Sgroi, M.; Vagliasindi, F.; Roccaro, P. Feasibility, sustainability and circular economy concepts in water reuse. Curr. Opin. Environ. Sci. Health 2018, 2, 20–25. [Google Scholar] [CrossRef]
- Traina, F.; Corsino, S.F.; Torregrossa, M.; Gaspare, V. Biopolymer Recovery from Aerobic Granular Sludge and Conventional Flocculent Sludge in Treating Industrial Wastewater: Preliminary Analysis of Different Carbon Routes for Organic Carbon Utilization. Water 2023, 15, 47. [Google Scholar] [CrossRef]
- Dereszewska, A.; Cytawa, S. Circular economy in wastewater treatment plants-potential opportunities for biogenic elements recovery. Water 2023, 15, 3857. [Google Scholar] [CrossRef]
- Hassan, A.; Samy, G.; Hegazy, M.; Balah, A.; Fathy, S. Statistical analysis for water quality data using ANOVA. Case study—Lake Burullus influent drains. Ain Shams Eng. J. 2024, 15, 102652. [Google Scholar] [CrossRef]
- Teng, T.P.; Chen, W.J. Using Pearson correlation coefficient as a performance indicator in the compensation algorithm of asynchronous temperature-humidity sensor pair. Case Stud. Therm. Eng. 2024, 53, 103924. [Google Scholar] [CrossRef]
- Mohamed, M.A.; Fouad, H.A.; ElHefny, R.M. Reviewing Rotating Biological Contactor’s Different Aspects for Wastewater Treatment with Experiment. Eng. Res. J. Fac. Eng. 2022, 51, 180–187. [Google Scholar] [CrossRef]
- Order No. 163 of 15/02/2005, Part I No. 337 of 21/04/2005 on the Approval of the Technical Regulation “Rules for the Design of Urban Wastewater Treatment Plants and Constructions-Part IV: Advanced Wastewater Treatment Stage”, Code NP 107-04. Available online: https://www.aquademica.ro/uploads/files/legislatie/Ordin%20nr_%20163%20din_%2015_02_2005.pdf (accessed on 13 March 2020).
- EUR-Lex, Treaties. Available online: https://eur-lex.europa.eu/collection/eu-law/treaties/treaties-accession.html?locale=ro (accessed on 13 March 2020).
- NORMATIV NTPA-001/28.02.2002–Norms Concerning the Limits for Pollutants Load on Industrial and Municipal Wastewater Discharged in Natural Receiving Bodies. 2016, pp. 5–11. Available online: https://lege5.ro/Gratuit/geytknbv/normativul-privind-stabilirea-limitelor-de-incarcare-cu-poluanti-a-apelor-uzate-evacuate-in-resursele-de-apa-ntpa-001-din-10111997?d=2024-01-22 (accessed on 13 March 2020).
- NORMATIV NTPA-002 (A) 28/02/2002–Norms Regarding Conditions for Wastewater Discharge in Municipal Sewerage Networks and Directly towards Wastewater Treatment Plants. Available online: https://legislatie.just.ro/Public/DetaliiDocumentAfis/98310 (accessed on 13 March 2020).
- Gaşpar, E.; Barbu, C.H. The influence of FeCl3 40% solution on the active sludge within the municipal wastewater treatment plants. In Proceedings of the 18th International Multidisciplinary Scientific GeoConference SGEM, Albena, Bulgaria, 2–8 July 2018; Volume 18, pp. 733–738. [Google Scholar] [CrossRef]
- California Water Technologies. Available online: https://californiawatertechnologies.com/ (accessed on 13 March 2020).
- SR ISO 5667-10:1994; Calitatea Apei. Prelevare. Partea 10: Ghid Pentru Prelevarea Apelor Uzate. ASRO: Bucharest, Romania, 1994.
- Lab Unlimited, Xylem—WTW Ntot1 TC (LR) Total Nitrogen NTotal 251995. Available online: https://www.labunlimited.com/s/ALL/X-251995/Xylem---WTW-Ntot1-TC-(LR)-Total-Nitrogen-NTotal-251995 (accessed on 13 March 2020).
- SR EN ISO 6878/2008, Water Quality. Determination of Phosphorus. Ammonium Molybdate Spectrophotometric Method. Available online: https://magazin.asro.ro (accessed on 13 March 2020).
- HG 188 28/02/2002. Available online: https://legislatie.just.ro/Public/DetaliiDocument/34651 (accessed on 13 March 2020).


Disclaimer/Publisher’s Note: The statements, opinions and data contained in all publications are solely those of the individual author(s) and contributor(s) and not of MDPI and/or the editor(s). MDPI and/or the editor(s) disclaim responsibility for any injury to people or property resulting from any ideas, methods, instructions or products referred to in the content. |
© 2024 by the authors. Licensee MDPI, Basel, Switzerland. This article is an open access article distributed under the terms and conditions of the Creative Commons Attribution (CC BY) license (https://creativecommons.org/licenses/by/4.0/).