Article

Isotope Hydrology and Hydrogeochemical Signatures in the Lake Malawi Basin: A Multi-Tracer Approach for Groundwater Resource Conceptualisation

by
Limbikani C. Banda
1,2,*,
Robert M. Kalin
1 and
Vernon Phoenix
1
1
Department of Civil & Environmental Engineering, University of Strathclyde, Glasgow G1 1XJ, UK
2
Water Resources Department, Ministry of Water and Sanitation, Private Bag 390, Lilongwe 207213, Malawi
*
Author to whom correspondence should be addressed.
Water 2024, 16(11), 1587; https://doi.org/10.3390/w16111587
Submission received: 10 April 2024 / Revised: 17 May 2024 / Accepted: 24 May 2024 / Published: 31 May 2024

Abstract

:
Reliance on groundwater is outpacing natural replenishment, a growing imbalance that requires detailed and multi-faceted water resource understanding. This study integrated water-stable isotopes and hydrogeochemical species to examine hydrogeochemical processes during groundwater recharge and evolution in the Lake Malawi basin aquifer systems. The findings provide insights into groundwater source provenance, with non-evaporated modern precipitation dominating recharge inputs. Grouped hydrochemical facies exhibit five groundwater water types, prominently featuring Ca-Mg-HCO3. Modelled hydrogeochemical data underscore dominant silicate dissolution reactions with the likely precipitation of calcite and/or high-Mg dolomitic carbonate constrained by ion exchange. Isotope hydrology reinforces water resource system conceptualisation. Coupled isotopic-hydrogeochemical lines of evidence reveal a discernible spatial-seasonal inhomogeneity in groundwater chemical character, revealing a complex interplay of meteoric water input, evaporative effects, recharge processes, and mixing dynamics. Findings show that measurable nitrate across Malawi highlights a widespread human impact on groundwater quality and an urgent need for detailed modelling to predict future trends of nitrate in groundwater with respect to extensive fertiliser use and an ever-increasing number of pit latrines and septic systems arising from rapid population growth. This study not only refined the Lake Malawi basin aquifer systems conceptualisation but also provided isotopic evidence of groundwater and lake water mixing. This study sets a base for groundwater management and policy decisions in support of the Integrated Water Resources Management principles and Sustainable Development Goal 6 objectives for groundwater sustainability in the transboundary Lake Malawi basin.

Graphical Abstract

1. Introduction

Access to safe drinking water and sanitation is a fundamental human right, as stated in the United Nations (UN) resolution 64/292 [1]. The provision of clean water is further enshrined as a critical global priority in Sustainable Development Goal 6, ‘Clean water and sanitation’. Despite this, a considerable proportion of the global population lacks access to adequate water services. Recent figures estimate that ca 2.4 billion people reside in water-stressed countries, and ca 2.2 billion people lack access to safely managed drinking water (2020 and 2022, respectively) [2]. This issue is particularly prevalent in many rural and peri-urban communities in sub-Saharan African (SSA) countries, including Malawi. Groundwater plays a vital role in supplying drinking water and supporting domestic needs, especially in regions with limited water distribution networks. It constitutes approximately 50% of global freshwater resources, serves about 40% of irrigated agriculture, and provides around one-third of the water supply for industry. Its significance extends to human development and economic growth [3]. However, excessive groundwater extraction and declining groundwater levels present sustainability challenges [4]. Sustainable management approaches are necessary to ensure the long-term availability of groundwater resources. Groundwater has been particularly critical in building resilience to climate change and ensuring water security in the Southern African Development Community (SADC) region [5]. Approximately 65% of Malawi’s population heavily relies on groundwater for drinking and domestic use [6,7]. This is even more significant in rural areas where 82% of the population relies on groundwater. Considering the unpredictable nature of precipitation and inconsistent surface water flows in Malawi [8], groundwater is viewed as a reliable alternative for water supply provision, especially during drought periods [9]. The significance of groundwater in surface water dynamics in Malawi, through its significant role in base flow, further emphasises the importance of groundwater within Malawi’s water security.
Malawi’s aquifer lithology influences groundwater quality [6]. Geogenic and geochemical factors influence groundwater quality in Malawi, in some instances leading to elevated levels of salinity, fluoride, iron, sulphate and chlorides [10,11,12,13]. Raised levels of sulphate in weathered basements [14] and high salinity in alluvial aquifers have been reported, with the latter resulting in the abandonment of several boreholes [15]. Malawi also faces challenges regarding groundwater supply impacted by aquifer stress and improper infrastructure development by non-governmental organisations, resulting in a scourge of stranded groundwater assets across the country [16]. Rapid population growth, changing lifestyles, unpredictable precipitation, higher agricultural demands, water resource degradation, and climate change add to a list of drivers confounding Malawi’s water problems [17,18]. The agricultural sector, employing over 80% of the population and driving Malawi’s economy, uses a substantial amount of the country’s renewable freshwater resources, exerting heavy pressure on Malawi’s water resources [19]. To address these issues, Integrated Water Resources Management (IWRM) and sustainable water management techniques such as borehole garden permaculture [20,21], alongside advanced technologies like isotope hydrology tracers, can play a crucial role in understanding and managing groundwater resources sustainably [22]. Notably, isotope hydrology tracers provide insights into the conceptualisation of hydrological–hydrogeological systems [23,24], groundwater dynamics, recharge processes, and water-source provenance [25,26,27,28], aiding in science-led policy decisions [29]. Yet, despite their benefits, the use of advanced technologies to facilitate sustainable water resource management is limited in low-income countries, and their potential to inform SDGs (e.g., SDG 6) has not been fully explored [30,31,32]. Establishing shared laboratories for the routine use of isotope hydrology tracers can significantly improve water resource management in low-income countries.
The overarching aim of this work was to establish a conceptualisation of the groundwater in the Lake Malawi basin (LMB) aquifer systems, focusing on isotope hydrology and hydrogeochemical baseline characterisation, spatial-seasonal effects on groundwater mineral signatures, geochemical controls on groundwater quality and evolution, groundwater-resource provenance, and hydrogeological system conceptualisation. Specifically, this study addressed the following research questions: (a) What are the background isotope hydrology and hydrochemical signatures of groundwater in the LMB? (b) How are the LMB aquifer systems recharged, and what are the isotope hydrology and hydrochemical signatures of distinct recharge inputs? (c) What are the geospatial and seasonal effects on groundwater quality and mineralisation? (d) What are the key geochemical controls on groundwater quality and evolution? and (e) How do isotope hydrology, hydrogeochemical and geospatial characteristics help refine the conceptualisation of the LMB aquifer systems? This study is consistent with the IWRM principles and SDG 6 objectives, with the potential to underpin sustainable groundwater resource management in Malawi and the wider region. This study aligns with the International Atomic Energy Agency (IAEA) Technical Cooperation (TC) project objectives (RAF7021 regional project) for sustainable water management and supports transboundary water management initiatives under the 2004 ZAMCOM agreement and was supported by the Scottish Government’s Climate Justice Fund Water Futures Programme (CJF).

2. Study Area

The Lake Malawi basin (LMB) is a transboundary region that covers Lake Malawi and its surrounding surface areas in Malawi, Mozambique, and Tanzania (Figure 1a). It lies within a seismically active belt at the southernmost region of the East African Rift System (EARS), with a combined lake and land surface area of ca. 126,500 km2, 97,740 km2 of which is land surface [6]. The study area is constrained to the Lake Malawi basin section within Malawi’s international boundary (Figure 1b), spanning ca. 64,785 km2 of land surface, with ca. 32,955 Km2 of land surface occupied by Mozambique and Tanzania. The study area covers 13 water resource areas (WRAs) of national significance, mainly focusing on the 11 major water resource areas with a substantial contribution to Lake Malawi hydrology (Figure 1b). It leaves out two minor WRAs encompassing Chizumula and Likoma islands in the middle of Lake Malawi with minimal contributions to the Lake Malawi hydrology.

2.1. Water Resources

Water resources in the study area consist of surface waters such as rivers, lakes, lagoons, and water reservoirs, as well as groundwater reserves found in aquifers [33]. The surface water and groundwater resources are, in part, shared across borders, requiring a multinational approach for equitable and sustainable management such as the 2004 ZAMCOM agreement. With a total of 49,032 groundwater points (community water supply boreholes and protected shallow wells) distributed across the basin, only approximately 85.8% are functional or partially functional [6]. The majority (63.8%) of these groundwater points consist of community water supply boreholes fitted with hand pumps, followed by protected dug wells [6]. Annual averaged surface runoff contributions to Lake Malawi are around 391 m3/s (for Malawi), 486 m3/s (for Tanzania), and 41 m3/s (for Mozambique), with a mean outflow of 395 m3/s [6]. Lake Malawi’s stand fluctuates between 471.5 and 477 masl, with a range of 474 to 475.3 masl recorded in 2022, contributing to an annual recharge input of 35.9 km3 [6]. The highlands and catchment areas contribute to surface water runoff, which eventually replenishes rivers and streams flowing into Lake Malawi, with 63% of Malawi’s surface runoff water discharging into Lake Malawi [33]. Key surface water storage reservoirs include Kamuzu Dam I and Kamuzu Dam II on Lilongwe River, with a combined supply capacity of 125,000 m3/day. The Lunyangwa Dam on the Lunyangwa River has a supply capacity of 25,900 m3/day [34], and the Bwanje Valley Dam on the Naminkokwe River has a supply capacity of 5.6 million m3 [30]. The Kamuzu Dams primarily supply water to Malawi’s capital, Lilongwe, while the Lunyangwa Dam serves Mzuzu City, Ekwedeni township, and other surrounding areas. The Bwanje Valley Dam supports the Bwanje Valley irrigation scheme, providing a water supply source, hydropower generation potential, and environmental flows. Other water storage reservoirs include the Chitete Dam in the Kasungu township and the Lusa Dam in Mchinji, which are mainly used for water supply, irrigation, and supporting small-scale fish farming for rural livelihoods.

2.2. Topography

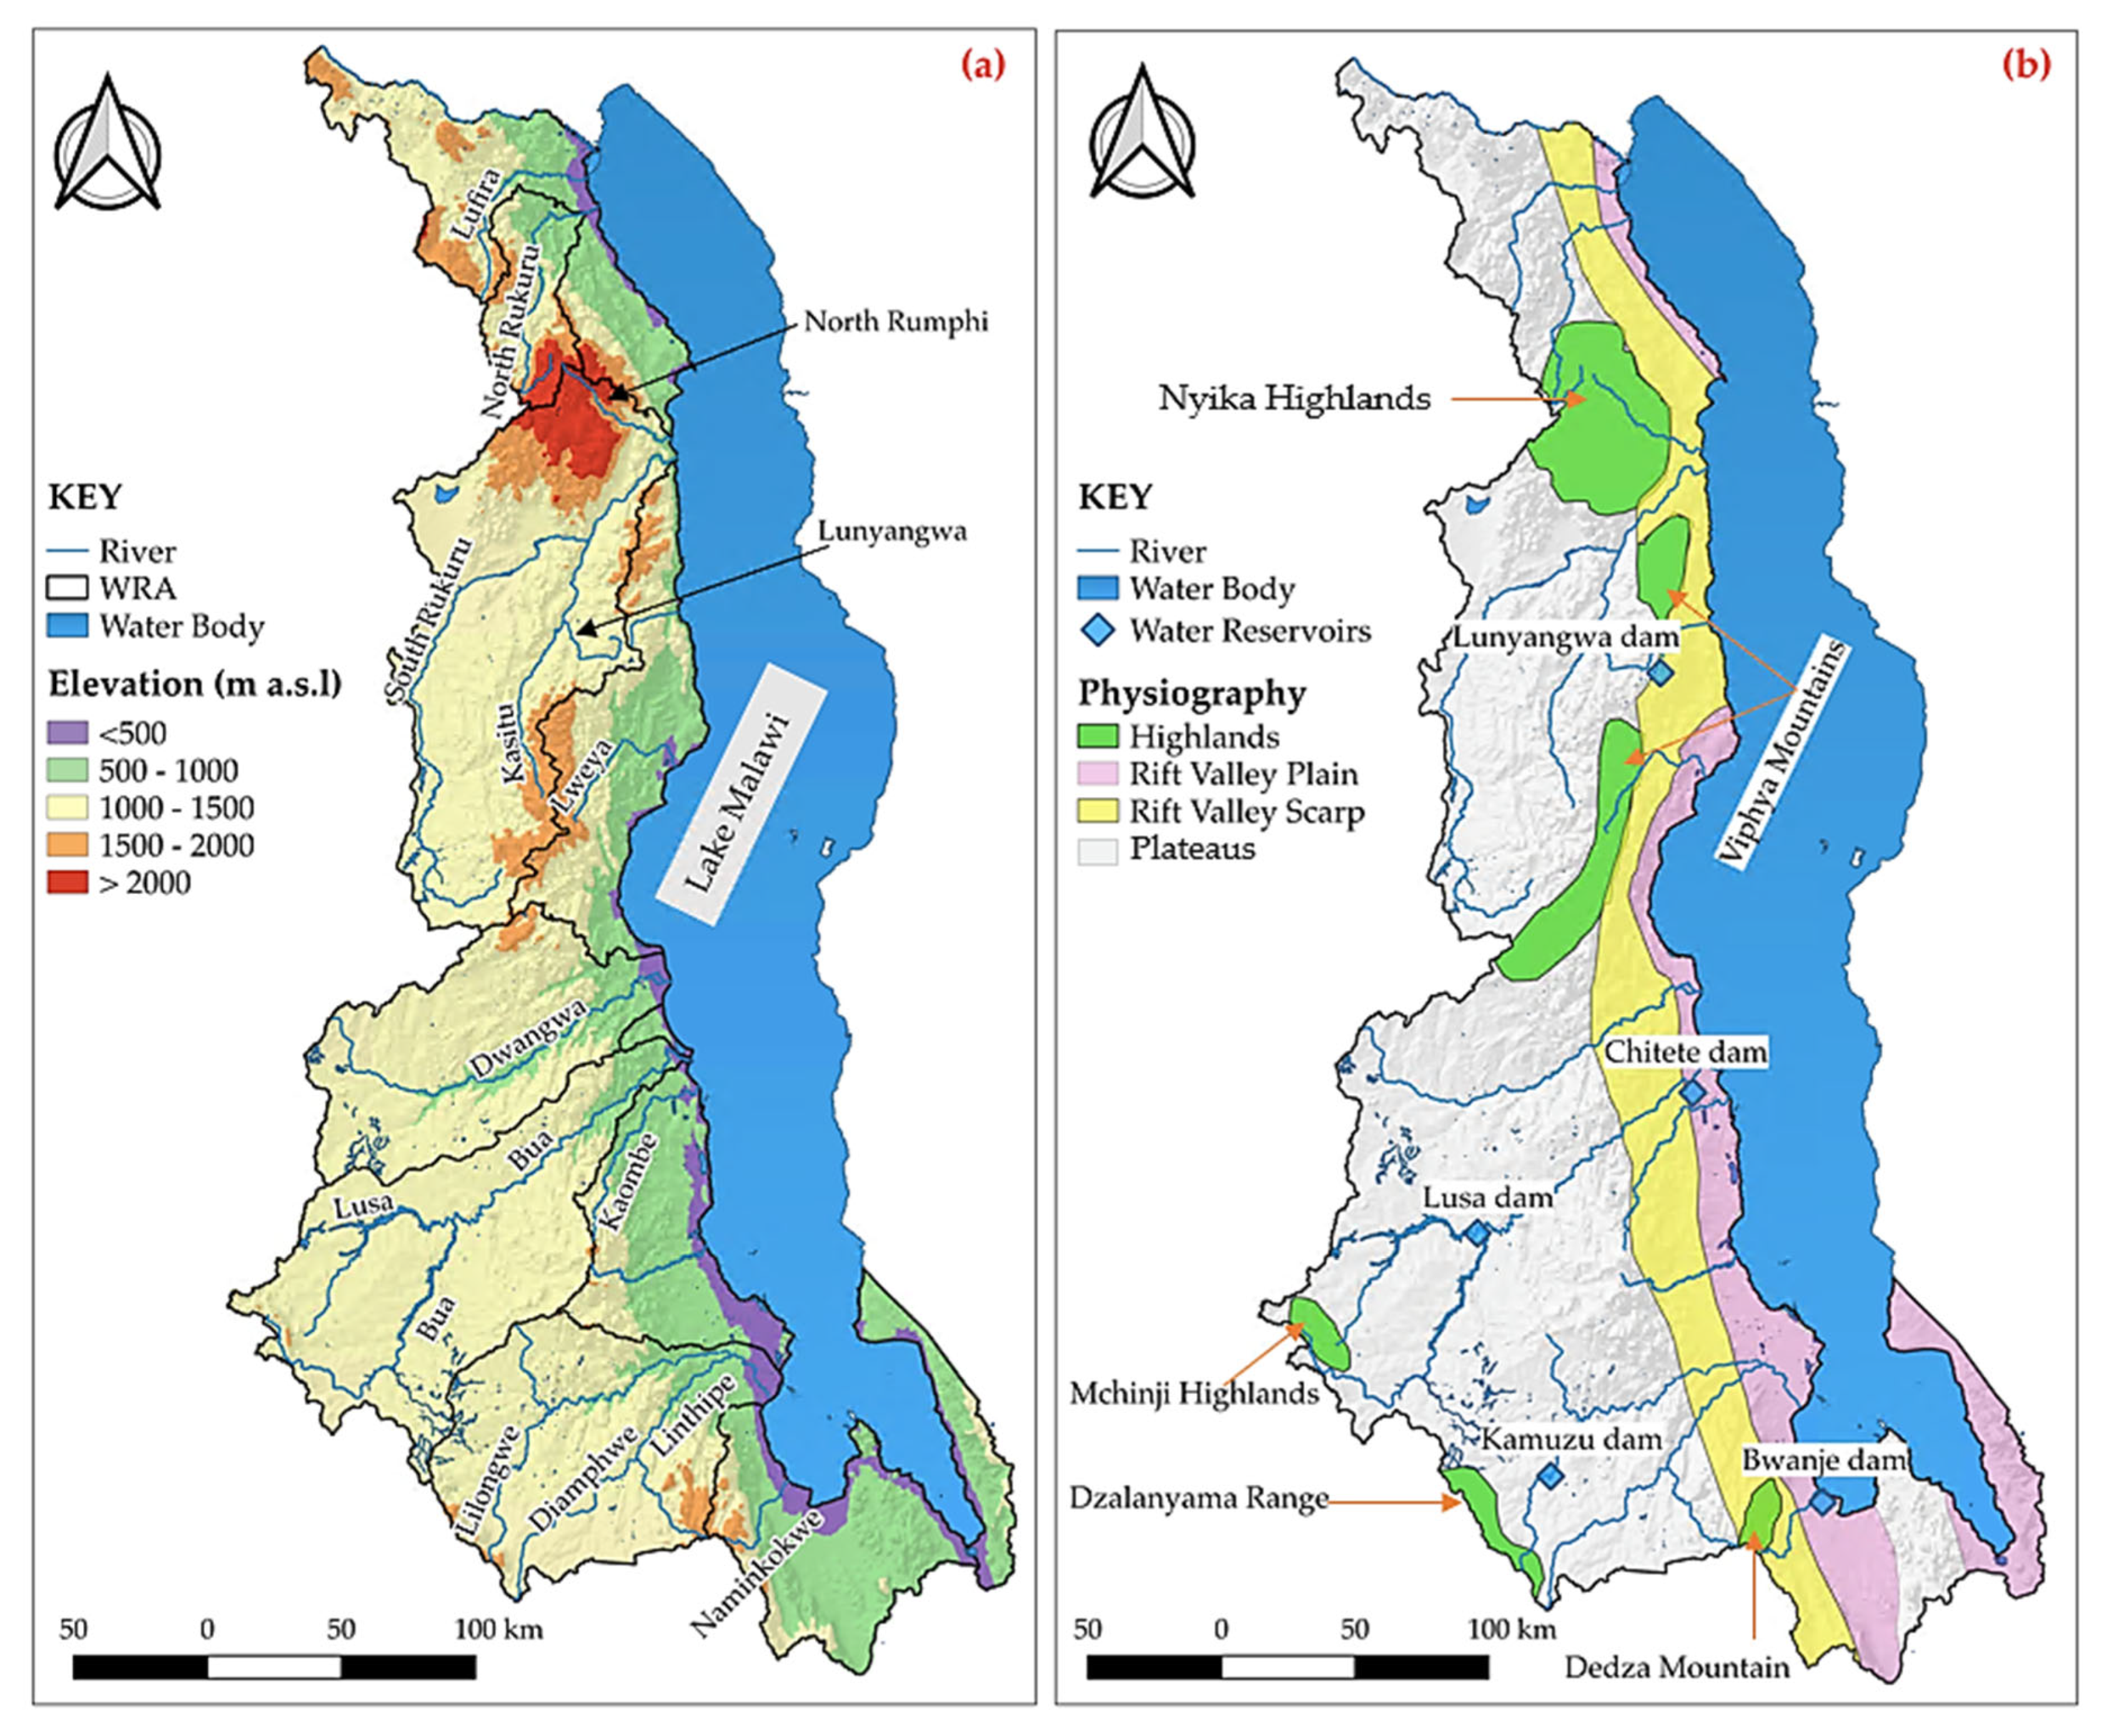
The Lake Malawi basin has a diverse topography, ranging in altitude from 471 to 2521 m, with a mean of 1102 masl (Figure 2a). It consists of highlands, plateaus, rift valley escarpments, rift valley plains, and rift valley floors (Figure 2b). Notable highland features include Dedza mountain, the Dzalanyama range, the Mchinji highlands, the Viphya mountains, and the Nyika highlands, which vary from 667 to 2521 m, with a mean elevation of 1618 m asl. The plateaus primarily feature gentle slopes, including wetland ecosystems locally known as ‘dambos’ that easily flood with no well-defined channels. The dambos play a significant role in groundwater storage and subsequent draining within the plateaus. The Kasungu–Lilongwe plain is the most extensive plateau, covering ca 6000 km2 and ranging in altitude from 1000 to 1800 m asl [30]. This area is predominantly agricultural, with few remaining areas of indigenous savannah scrub woodlands and forests. The underlying strata of the plateaus consist mainly of colluvium overlying in situ layers of saprolite (weathered bedrock) [15]. The rift valley escarpment spans from north to south, containing rivers that erode the rift valley scarp as they flow into the rift valley plain, exposing the bedrock [13]. The escarpment varies in altitude from 480 to 2035 m, with a mean of 924 m asl. The western Lake Malawi shoreline is dominated by the rift valley plain, featuring steep sloping land between the Lake and plateaus. The rift valley plain ranges in altitude from 471 to 1550 m, with a mean of 574 m asl. The rift valley floor encompasses the Lake Malawi basin and its surrounding walls, including rocky slopes and escarpments. It also includes a series of terraces that slope from the rift valley walls towards the Lake Malawi shoreline [35]. The topography significantly impacts climate, hydrology, groundwater occurrence, and population distribution and influences water supply demands.

2.3. Geological Setting

The Lake Malawi basin is a rift valley basin mostly made up of basement complex rocks, constituting metamorphic and igneous rocks from the late Precambrian to lower Paleozoic periods [36]. The geological successions across the basin include Quaternary Alluvium and Colluvium, Cretaceous to Pleistocene formations, Jurassic Age Chilwa Alkaline Province formations, Jurassic Age Karoo Stromberg Volcanic formations, the Karoo Sedimentary Series from the Permo-Triassic period, and the Basement Complex formations from the Late Precambrian and Lower Paleozoic periods [36]. The basin is characterised by various geological processes such as escarpment formation, faulting, fracturing, erosion, rift valley floor development, and sedimentation [37]. There are major faults occurring from north to south and north-northwest to south-southwest, with notable fault lines along Lake Malawi [38]. The geological features of the basin exhibit a dynamic environment where geological and geomorphological processes are continuously occurring with a potential influence on its hydrogeology [33]. The presence of basement-complex rocks, consisting of late Precambrian to lower Paleozoic metamorphic and igneous rocks, forms the basin foundation, resulting in low-yielding aquifers. However, the weathered zones of these aquifers, about 15–30 m thick in plateau areas, serve as important sources of domestic water supplies [33]. Uplift and erosion resulting from the rift valley’s development have reduced aquifer thickness, especially along escarpment crests and near bedrock outcrops, impacting groundwater availability. Alluvial deposits beneath lakeshore plains, formed by sedimentation from rivers and the lake, create high-yielding aquifers with varied characteristics both vertically and laterally. The fracture zones of the rift valley escarpment, formed by faulting and fracturing processes which increase permeability and water flow, create medium-yielding aquifers [38]. Ongoing geological processes, such as faulting, fracturing, erosion, and sedimentation, continuously impact aquifer permeability, storage capacity, and water resource availability [37]. Thus, an understanding of the geological characteristics and processes is crucial for effectively managing and sustaining the water resources of the basin.

2.4. Hydrogeological Setting

The hydrostratigraphic units within the aquifer system of the Lake Malawi basin encompass a weathered and fractured basement, as well as consolidated and unconsolidated sedimentary units (Figure 3). These units constitute three primary aquifer groups: consolidated sedimentary rock, unconsolidated sedimentary units overlying weathered basement, and weathered basement overlying fractured basement [6]. The unconsolidated sedimentary units overlying weathered basement aquifer constitutes intergranular pore spaces that facilitate groundwater transmission. The weathered basement units overlying fractured basement aquifer comprises intergranular pore spaces, fissures, fractures, and joints that enable groundwater flow. The consolidated sedimentary rock largely constitutes sandstone and shale, while the unconsolidated sedimentary units overlying weathered basement aquifer is mostly made up of colluvium and alluvium. The weathered basement overlying fractured basement aquifer mostly constitutes charnockitic gneiss and hornblende-biotite-gneiss. The basement complex is a primary source of groundwater in Malawi, and its mineral content largely influences the groundwater quality in the basin. Key rock minerals include plagioclase, pyroxenes, feldspars, amphiboles, and biotite [39]. These are largely natural sources of chemical species like calcium, magnesium, sodium, and potassium. Plagioclase minerals are sources of calcium and sodium during weathering, and the type of plagioclase in Malawi is more calcium-rich than sodium-rich. Therefore, there is more calcium in groundwater as it dissolves [13]. The dissolution of mafic minerals releases magnesium ions (as well as iron and other ions) in groundwater, some of which bear fluoride ions [12]. The consolidated sedimentary aquifers are found in the northern part, where they occur sparsely, while the unconsolidated sedimentary units overlying the weathered basement group largely occur on the western side. The weathered basement units overlying the fractured basement aquifer group are mostly found on the eastern side, particularly along the rift scarp zones. Isolated outcrops of basement lithologies occur in the basin, with some folded exposures, especially along the Malawi–Zambia border [6]. The Lake Malawi shoreline areas within the rift valley plain are characterised by unconsolidated fluvium, colluvium, and alluvium sedimentary units where they overlay weathered basement units. The potential yield of the unconsolidated sedimentary units overlying the weathered basement aquifer is estimated to be around 20 L/s, while water supply boreholes within the weathered basement overlying the fractured basement aquifer have a lower yield of up to 2 L/s [13].

2.5. Climate

The Lake Malawi basin climate is classified as tropical-continental, influenced by various factors such as altitude, relief, and presence of Lake Malawi [6]. The Köppen–Geiger system categorises the climate as Aw or Savannah, described as “Not (Af) and Pdry < 100 − MAP/25”, where Af is rainforest, MAP is mean annual precipitation, and Pdry is the precipitation of the driest month [40]. The basin has a dual-season system, with a wet season from November to April and a dry season from May to October. The dry season, driven by south-easterly winds, is mostly cool-dry from May to August and hot-dry from September to October. The wet season is influenced by north-easterly winds; the Intertropical Convergence Zone (ITCZ), the Congo Air Boundary (CAB), and Tropical Cyclones and accounts for ca 90% of annual precipitation [41,42]. The majority of rain falls between December and March, with January receiving the highest amounts in most areas of the basin. However, there is a contrasting pattern near the western shoreline of Lake Malawi, where peak precipitation is usually observed in March [43].
Annually, precipitation ranges from 623 to 1654 mm, averaging 927 mm. The rift valley plain, bordering Lake Malawi, receives the most rain, with a mean of 1036 mm, which is linked to lake effects [44]. In contrast, the western plateaus exhibit more aridity, which is linked to topographic isolation. The basin’s diverse relief and proximity to Lake Malawi have a significant impact on the spatial distribution of precipitation [44,45]. The mean annual temperature ranges from 12.9 to 24.7 °C, averaging 20.5 °C. The Nyika highlands experience cooler temperatures, averaging 17.6 °C, whereas the rift valley lakeshore plain, with the lowest topographic extremes, experiences hotter temperatures, averaging 23.4 °C. The coldest months in the LMB are June and July, while the hottest months are October and November. The presence of Lake Malawi moderates the surrounding areas, resulting in a mean daytime temperature of 30.3 °C and a night-time temperature of 10.3 °C [46].

3. Materials and Methods

3.1. Sampling and Analytical Techniques

Three groundwater sampling surveys were conducted between 2021 and 2022. The sampling design provided a representative geographical spread and balanced hydrogeological coverage. The sampling timelines captured seasonal and topographic effects on groundwater dynamics. Sampling coverage was constrained by ease of access, more so in the wet season when travel to remote or low-lying flood-prone areas was risky. Water samples were collected from boreholes, dug wells fitted with handpumps, and hot springs that were in constant use for water supply during sampling and purged when not in use to ensure the samples were representative.
Isotope hydrology samples (n = 327 subdivided into 160 wet season samples and 167 dry season samples) were collected in 50 mL high-density polyethylene (HDPE) bottles with inner caps, sealed with waterproof tape, preserved at 4 °C, and kept away from direct sunlight during transportation and at the laboratory. A set of samples was analysed using a laser spectroscopy-based technique using the Picarro isotopic water analyser (Model: L2140-i, Picarro Inc., Santa Clara, CA, USA) at the IAEA laboratory in Vienna, Austria. Another set of isotope hydrology samples was analysed using a Picarro isotopic water analyser (Model: L2110-i, Picarro Inc., Santa Clara, CA, USA) at the Central Water Laboratory in Lilongwe, Malawi. The isotope hydrology samples were analysed in non-consecutive duplicates in high-precision mode with dry synthetic air carrier gas. Each such analysis consisted of six injections. Lake Kyoga and Standard-09 (Greenland Ice) working reference materials (RMs) were enriched and depleted, respectively. The controls were Standard 11 (Monaco Lagoon) and Standard 06 (Heidelberg tap water) for quality assurance and quality control purposes. Data reduction was performed in the Laboratory Information Management System (LIMS) for lasers [47] using residual memory correction after ignoring the first three injections. Two reference points were used to normalise the Vienna Standard Mean Ocean Water (VSMOW)-Standard Light Antarctic Precipitation (SLAP) scale. The long-term deviation of control samples demonstrated that the measurements were accurate to within 0.1‰ or better for δ18O and 0.5‰ or better for δ2H, and the isotope analysis results were reported as ratios compared to V-SMOW standards (Equation (1)).
δ s / s t d = R s R s t d R s t d × 1000
In Equation (1), Rs is the isotopic ratio of the sample, Rstd is the isotopic ratio of the standard, and δ is the delta notation, where δs/std is reported in per mil (‰). The d-parameter (d) was calculated from Dansgaard’s equation [48] relating to the δ18O and δ2H of water, defined as d = δ2H − 8δ18O‰. The process of handling water samples, including onsite measurements, sample collection, transportation, holding, preparation, and analysis, followed the International Standard Procedures (ISP) [49]. This adherence ensured the consistency and reliability of the isotopic data generated.
On-site measurements (electrical conductivity (EC), total dissolved solids (TDS), and pH) were conducted using a portable multi-meter (Model: HI-98194, Hannah Instruments, Woonsocket, RI, USA). A pair of water samples were collected from each site, one acidified and the other non-acidified, using 1L polyethylene bottles rinsed with distilled water. The water quality samples (n = 727) were labelled, preserved at 4 °C during transportation and storage, and filtered through 0.45 µm Whatman filters prior to analysis at the laboratory. Anions (F, Cl, NO3, and SO4) were measured using Metrohm ion chromatography (Model: 850 Professional IC, Metrohm, Switzerland), while cations (Na, K, Mg, Ca, Fe and Mn) were measured using an inductively coupled plasma spectrometer (Model: iCAP 6200, Series Thermo-Fisher Scientific, Waltham, MA, USA) at the Environmental Analytical Laboratory of the University of Strathclyde in Glasgow, Scotland. Carbonate and bicarbonate were measured using a titrimetric method, while alkalinity was measured using a photometric analyser (Model: KONE Aquakem V.7.2.AQ2, Skalar, Breda, The Netherlands). All field sampling measurements and laboratory analyses were conducted in line with the ISP [50], and the accuracy of the hydrochemical analysis was validated using the ionic balance method, adhering to an allowable ionic balance error (IBE) of ±5% (Equation (2)) [50].
I B E % = C a t i o n s A n i o n s C a t i o n s + A n i o n s   x 100

3.2. Computation of Gibbs Diagram, Chloro-Alkaline Indices, and Saturation Index (SI)

Gibbs diagram plots used the anionic weight ratio Cl/(Cl + HCO3) and cationic weight ratio Na+/(Na+ + Ca2+) as functions of log-transformed TDS) [51] and was used to identify geochemical reactions controlling groundwater chemical evolution in Lake Malawi basin. Schoeller chloro-alkaline indices, defined in Equations (3) and (4), were employed to refine evidence of cation exchange reactions and ascertain the nature and extent of their occurrence in groundwater within the Lake Malawi basin.
C A I I = C l N a + + K + C l
C A I I I = C l N a + + K + H C O 3 + C O 3   2 + S O 4   2 + N O 3
In Equations (3) and (4), if the CAI-I and CAI-II are less than zero, the cation exchange is a forward reaction. If the CAI-I and CAI-II are greater than zero, the cation exchange is a reverse reaction [52]. The saturation index (SI) was used to evaluate the equilibrium state with respect to groundwater and solid mineral phases [53,54,55]. The SI, defined in Equation (5), was calculated using PHREEQC software (version 3.7.3), which calculates the logarithm of the ratio between ion activity product (IAP) and solubility product (Ksp) [56].
S I = l o g I A P K s p
In Equation (5), IAP = ion activity product, Ksp = solubility product, where an SI equal to zero indicates an equilibrium state. If the SI is less than zero, the groundwater is undersaturated with respect to the mineral phase, and there is potential for mineral dissolution. When the SI is greater than zero, the groundwater is oversaturated.

4. Results

4.1. Hydrogeochemical Characteristics

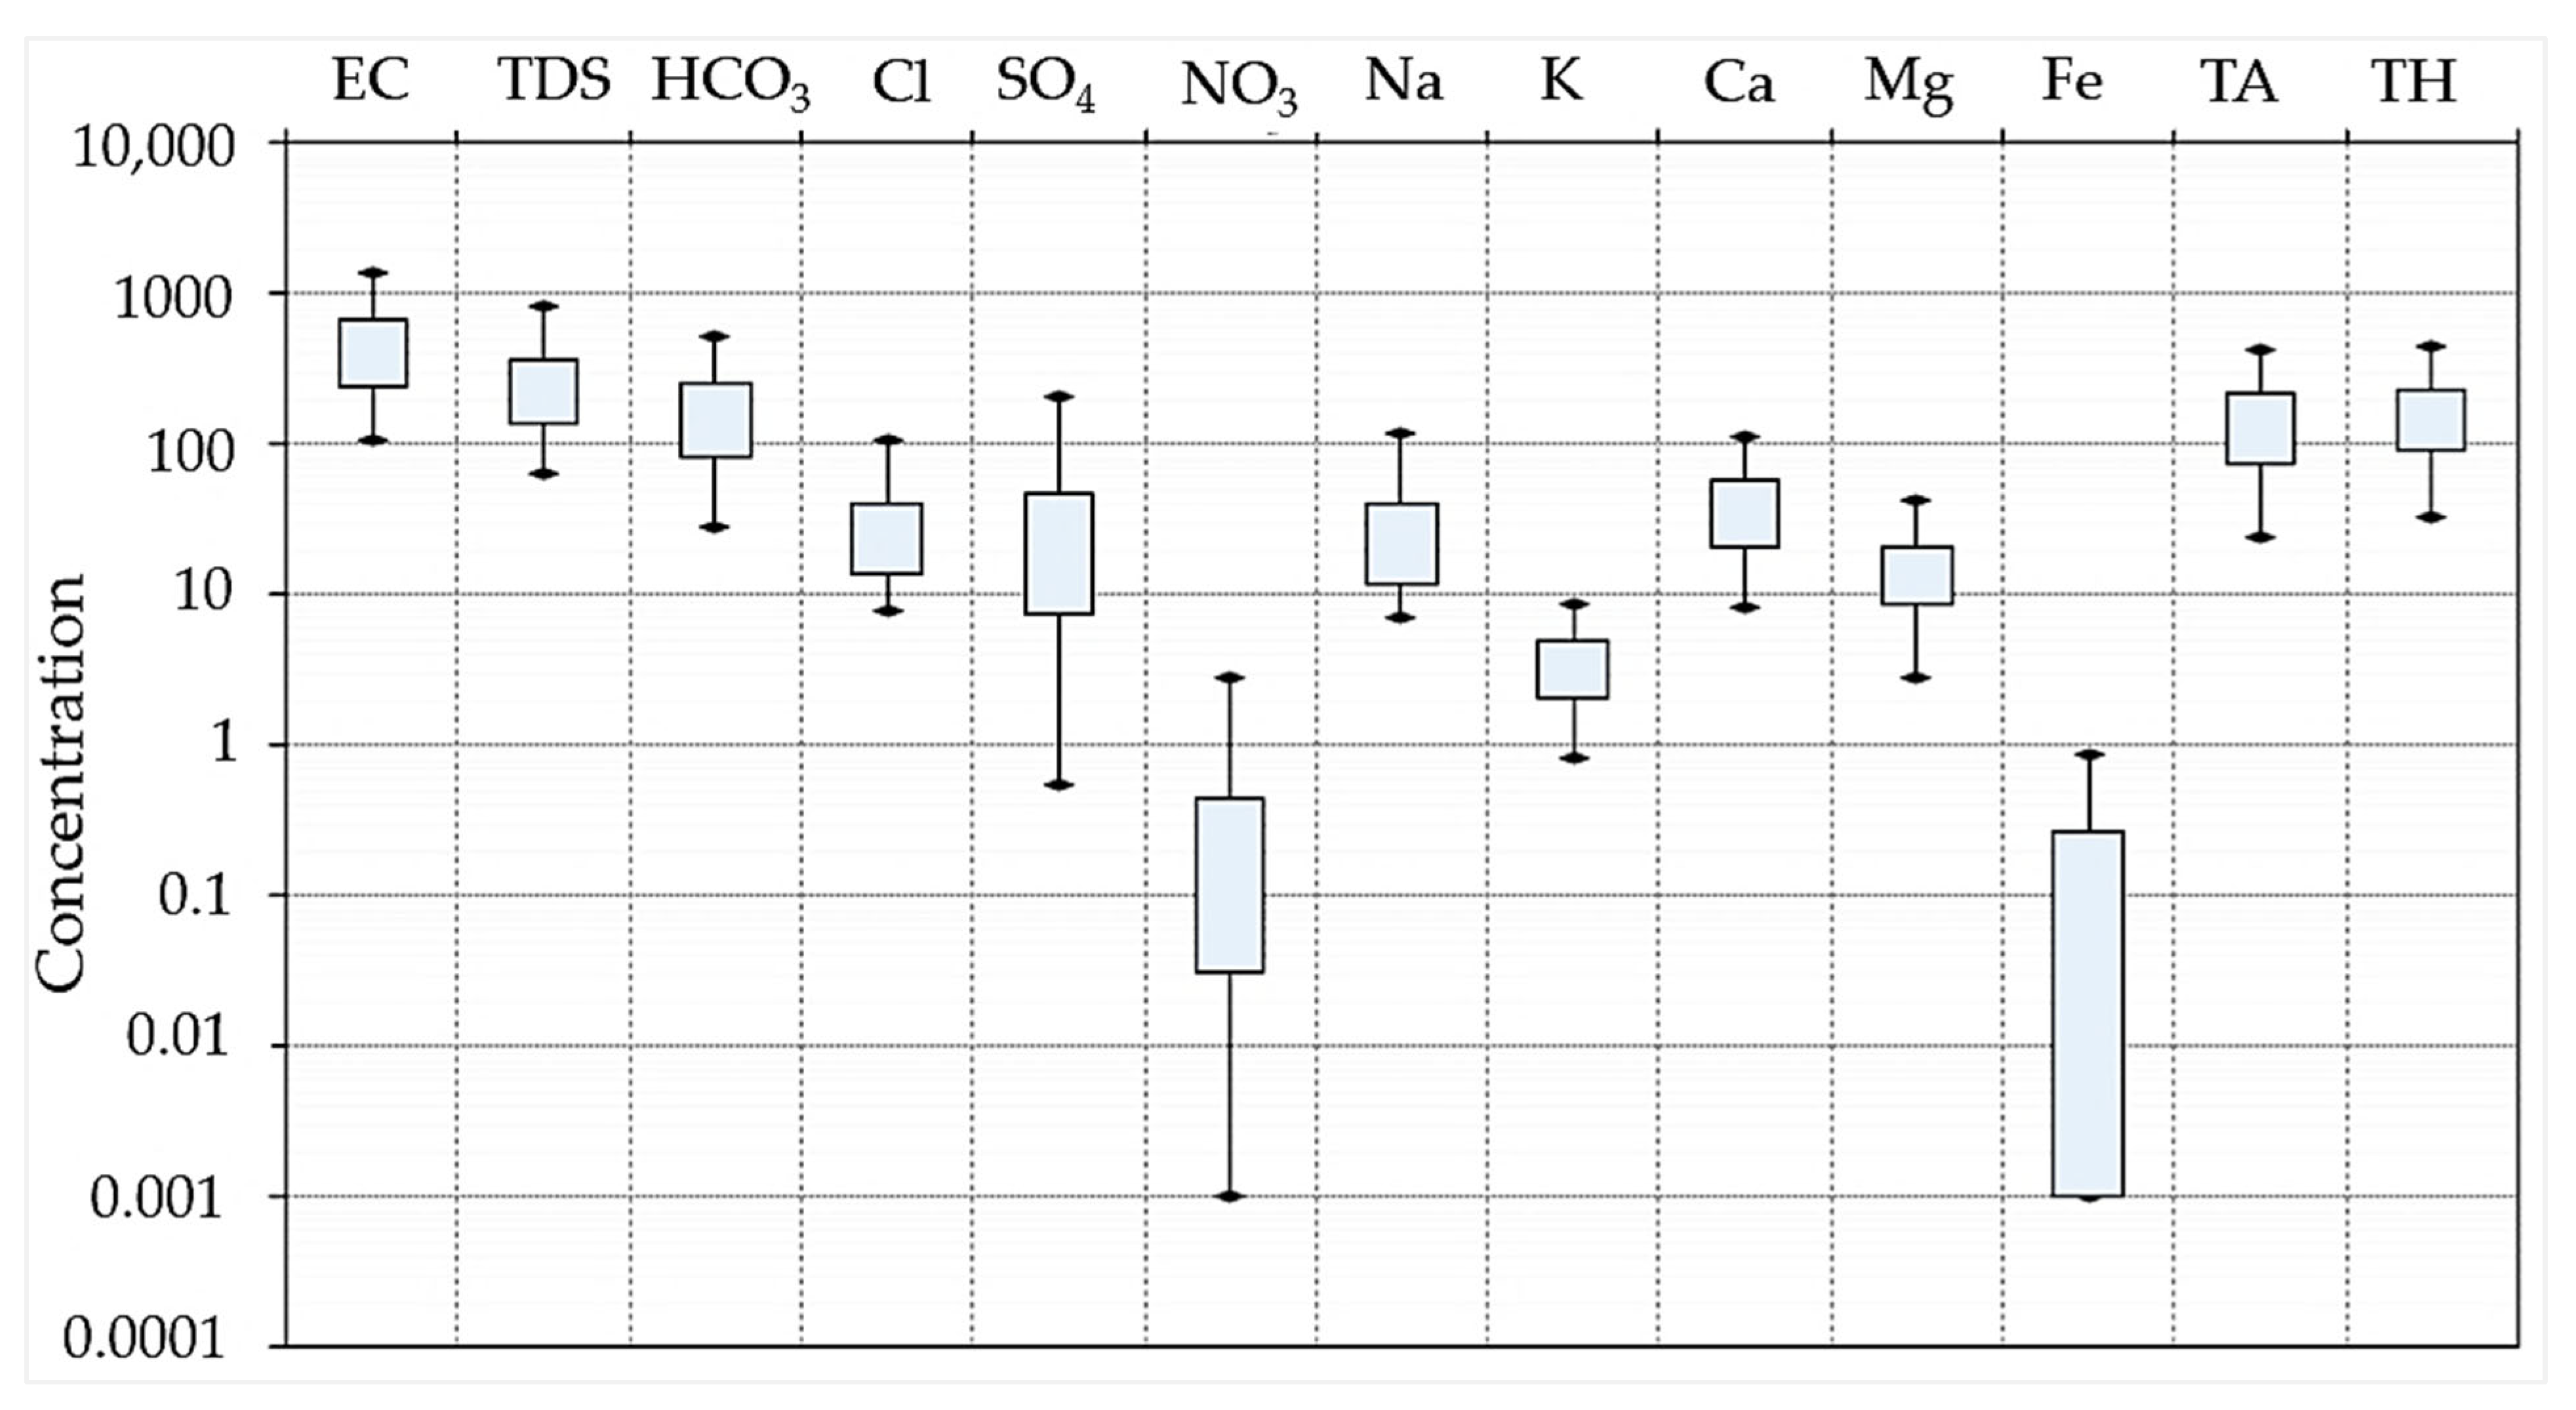
The groundwater pH ranged from acidic to alkaline (pH: 4.5–9.4), with a mean of 6.9 and a median of 6.4. The Total dissolved solids (TDS) varied widely from 23 to 2662 mg/L, with a mean of 305 mg/L and a median of 210 mg/L (Figure 4, Supplementary Material (SM)-Table S1). The dominant cations were calcium, sodium, and magnesium, with considerable variation. The majority of groundwater samples (88%) had TDS below 600 mg/L, which falls within the World Health Organisation (WHO) recommended guidelines for good taste. The remaining 12% had elevated TDS concentrations exceeding 1000 mg/L [57]. While most groundwater samples were aligned with the WHO’s recommended guidelines, there were cases where the groundwater may not fully meet the taste and palatability expectations. Bicarbonate, chloride, and sulphate were the dominant anions, with nitrate and fluoride present at generally low to moderate concentrations.
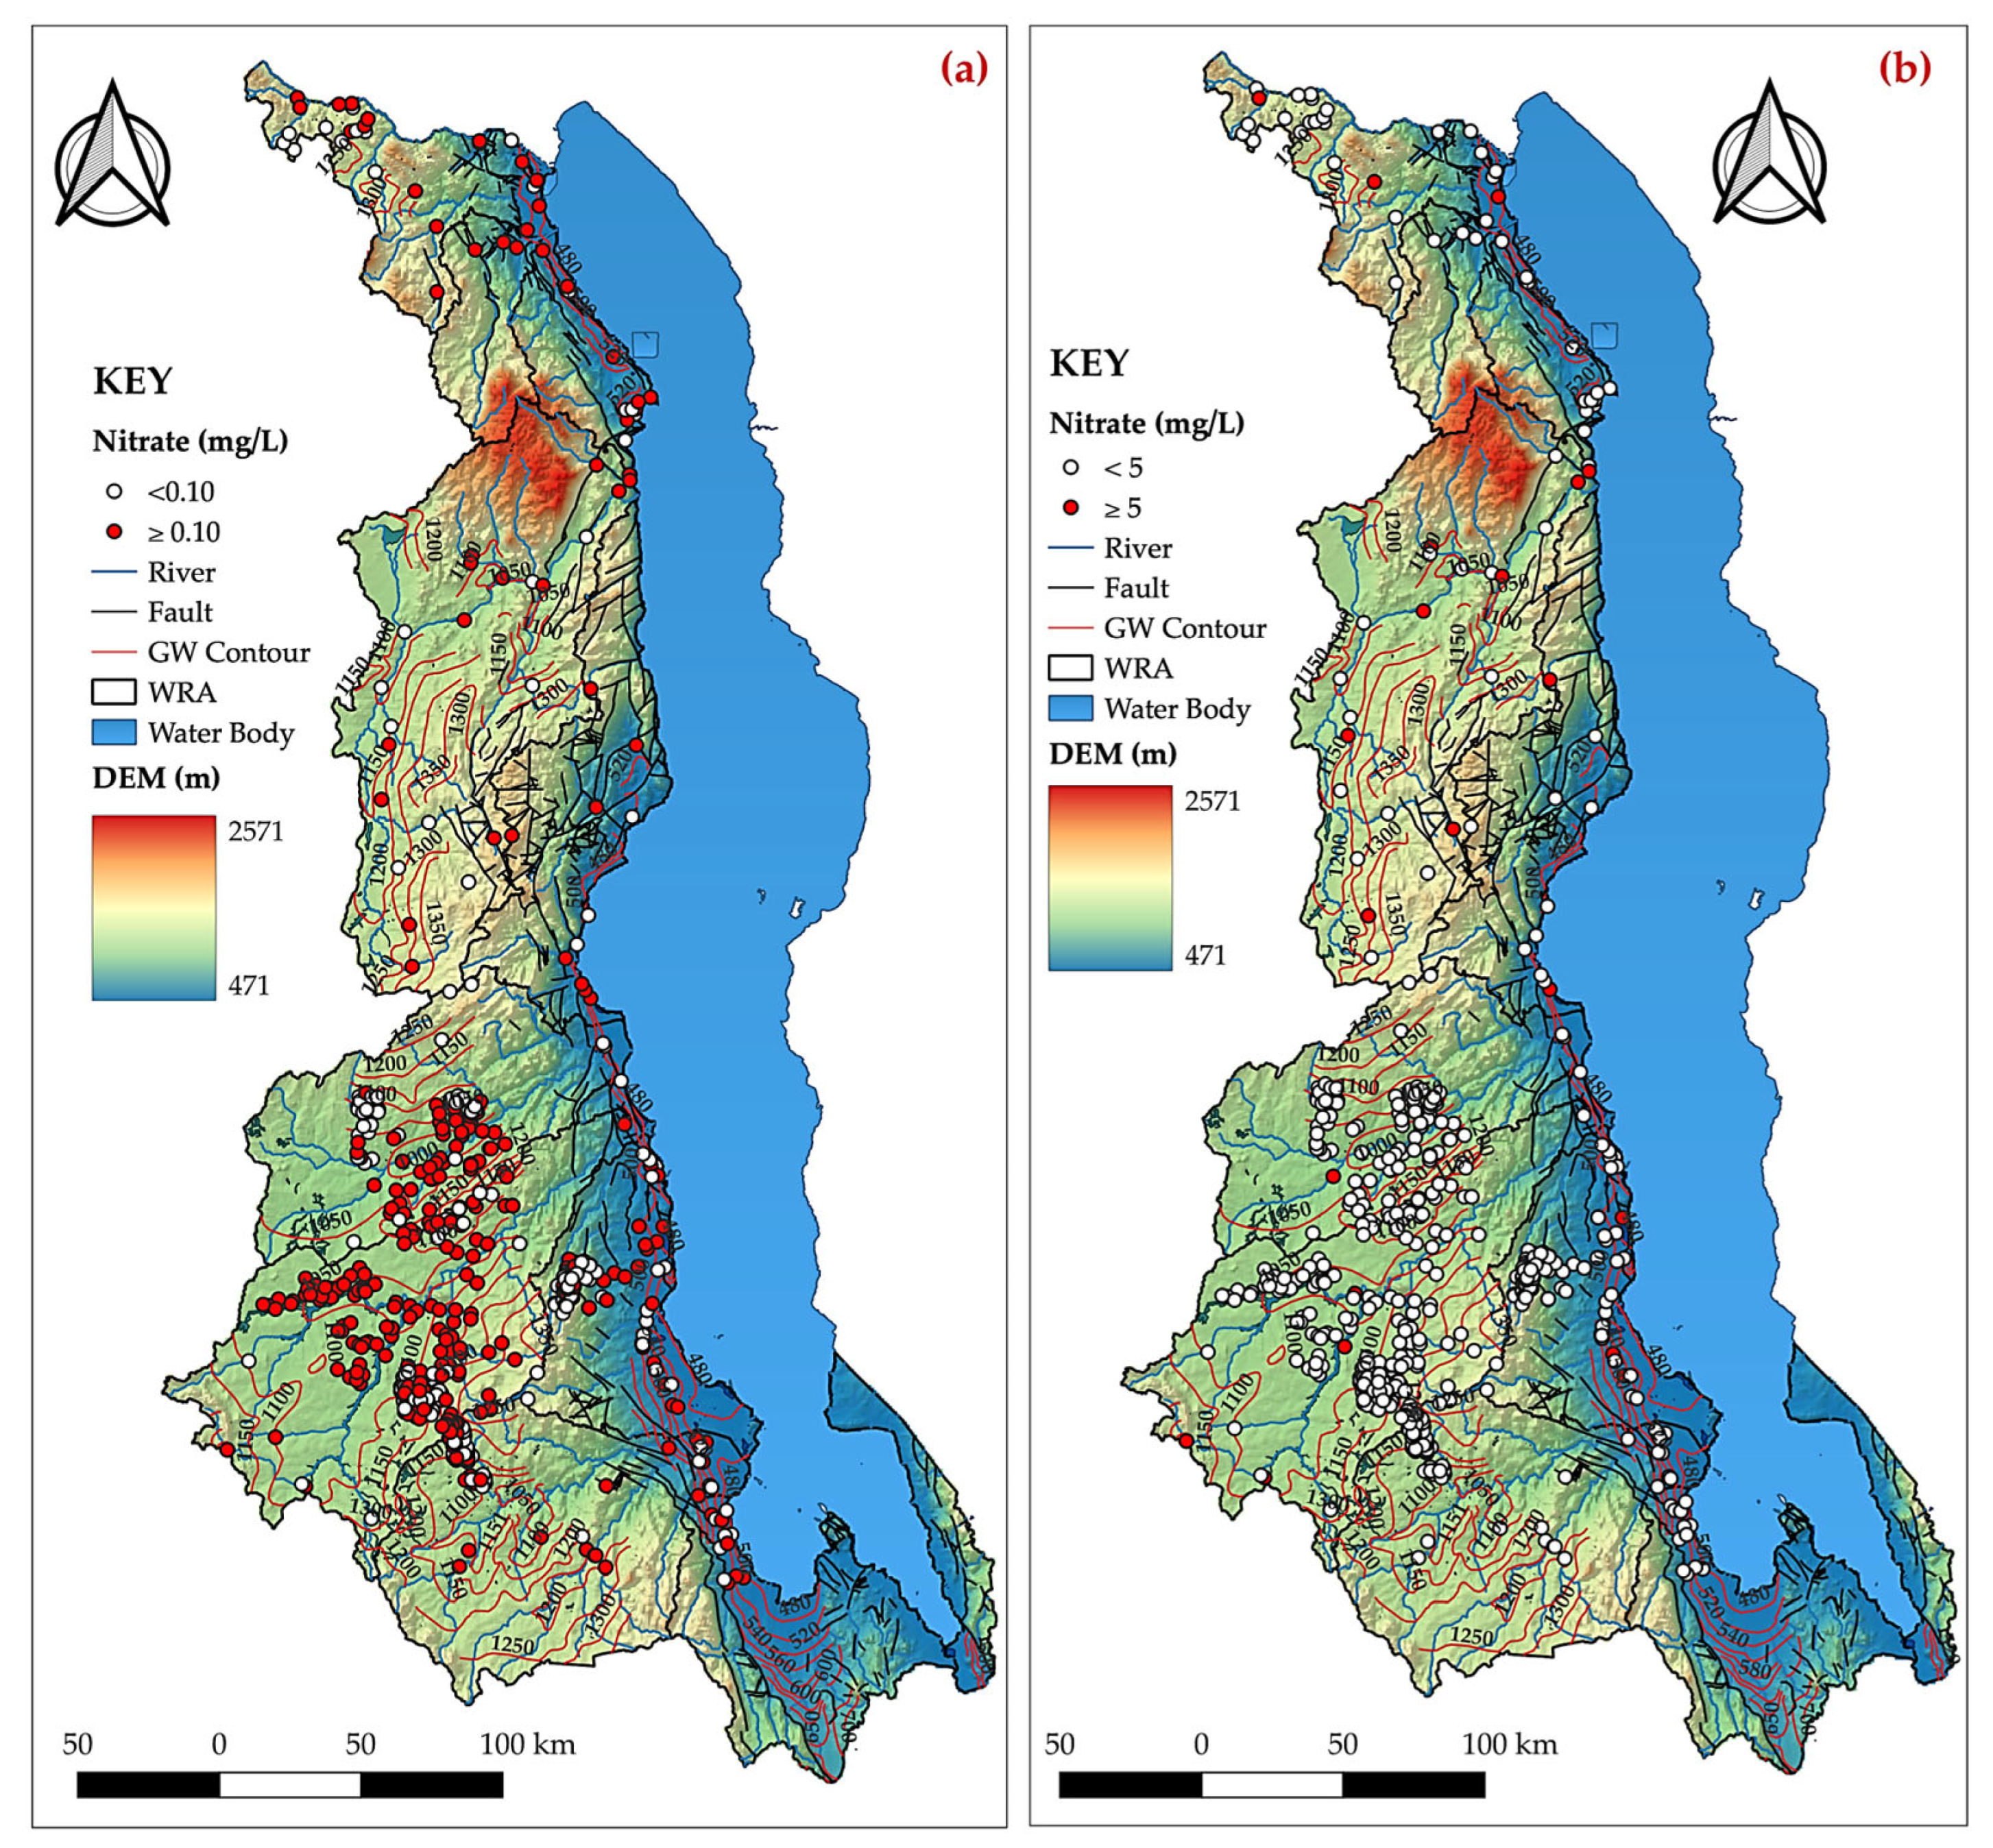
Previous studies reported arsenic occurrence [11] and widespread risks of fluoride [12] in groundwater. This study found that nitrate was ubiquitous in groundwater, detected in most of the groundwater points (93.1%) and varied widely from <0.001 to 235 mg/L, with isolated outliers recorded in the northern part of the basin (Figure 5a). The nitrate concentrations were generally consistent with the recommended WHO guidelines for drinking water (Figure 5b). Given there is no natural source of nitrate in Malawi’s groundwater, the ubiquitous nature of this contaminant points towards human-induced pollution. This highlights a critical need to model nitrate-related contamination sources across the country, considering a surge in likely sources, including pit latrines, septic systems, and extensive fertiliser use due to SDG 6 drivers and the current population boom.

4.2. Hydrogeochemical Facies

A Piper plot was used to examine groundwater hydrogeochemistry, delineating distinct hydrogeochemical facies based on dominant cationic and anionic species [58]. This approach refined the understanding of the hydrogeochemical signatures of Lake Malawi basin groundwater and how minerals in the host rock matrix impact the groundwater along its flow path. The classification of hydrogeochemical facies identified five groundwater types (Figure 6): (1) Ca-Mg-HCO3, (2) Ca-Mg-SO4, (3) Na-Cl, (4) Ca-Mg-SO4-Cl, and Na-HCO3-Cl (5). The most prevalent groundwater type was Ca-Mg-HCO3, comprising 73.9% of the groundwater samples. This dominance suggests groundwater evolves from recharge through geochemical reactions with primary silicates and secondary carbonates and/or high-Mg dolomitic carbonate rock matrices. The close proximity of distinct hydrochemical facies suggests groundwater mixing from multiple sources, supported by the presence of mixed water types (Ca-Mg-SO4 and Na-HCO3-Cl). A mixing trend observed in a cation ternary diagram (Figure 6) suggests cation exchange reactions, increasing the dissolved sodium concentration by exchanging with calcium in clays.
The spatial distribution of the water types aligned with the TDS, exhibiting greater uniformity in highland plateau areas and more inhomogeneity in low-lying areas, especially in the lakeshore and flood plains (Figure 7a,b). This inhomogeneity suggests the influence of various factors, such as the seepage of surface water into groundwater, the presence of older groundwater with higher calcium or sodium concentrations due to prolonged travel time, and the dissolution of minerals resulting in calcium, sodium, and magnesium in solution.

4.3. Mechanisms Controlling Mineral Enrichment

Groundwater mineral enrichment is influenced by geochemical reactions (e.g., eva–oration, precipitation, and mineral weathering) along a flow path [29]. The Gibbs diagram (Figure 8) identifies water–rock mineral reactions as the dominant geochemical mechanism controlling groundwater mineral enrichment. It also depicts an increasing cationic weight ratio Na+/(Na+ + Ca2+) with a corresponding minimal change in the TDS, suggesting cation exchange as another controlling geochemical reaction. Table 1 and Table S5 display various rock minerals and their respective interactions with water, resulting in the release of ionic species into groundwater that influence its chemical composition.
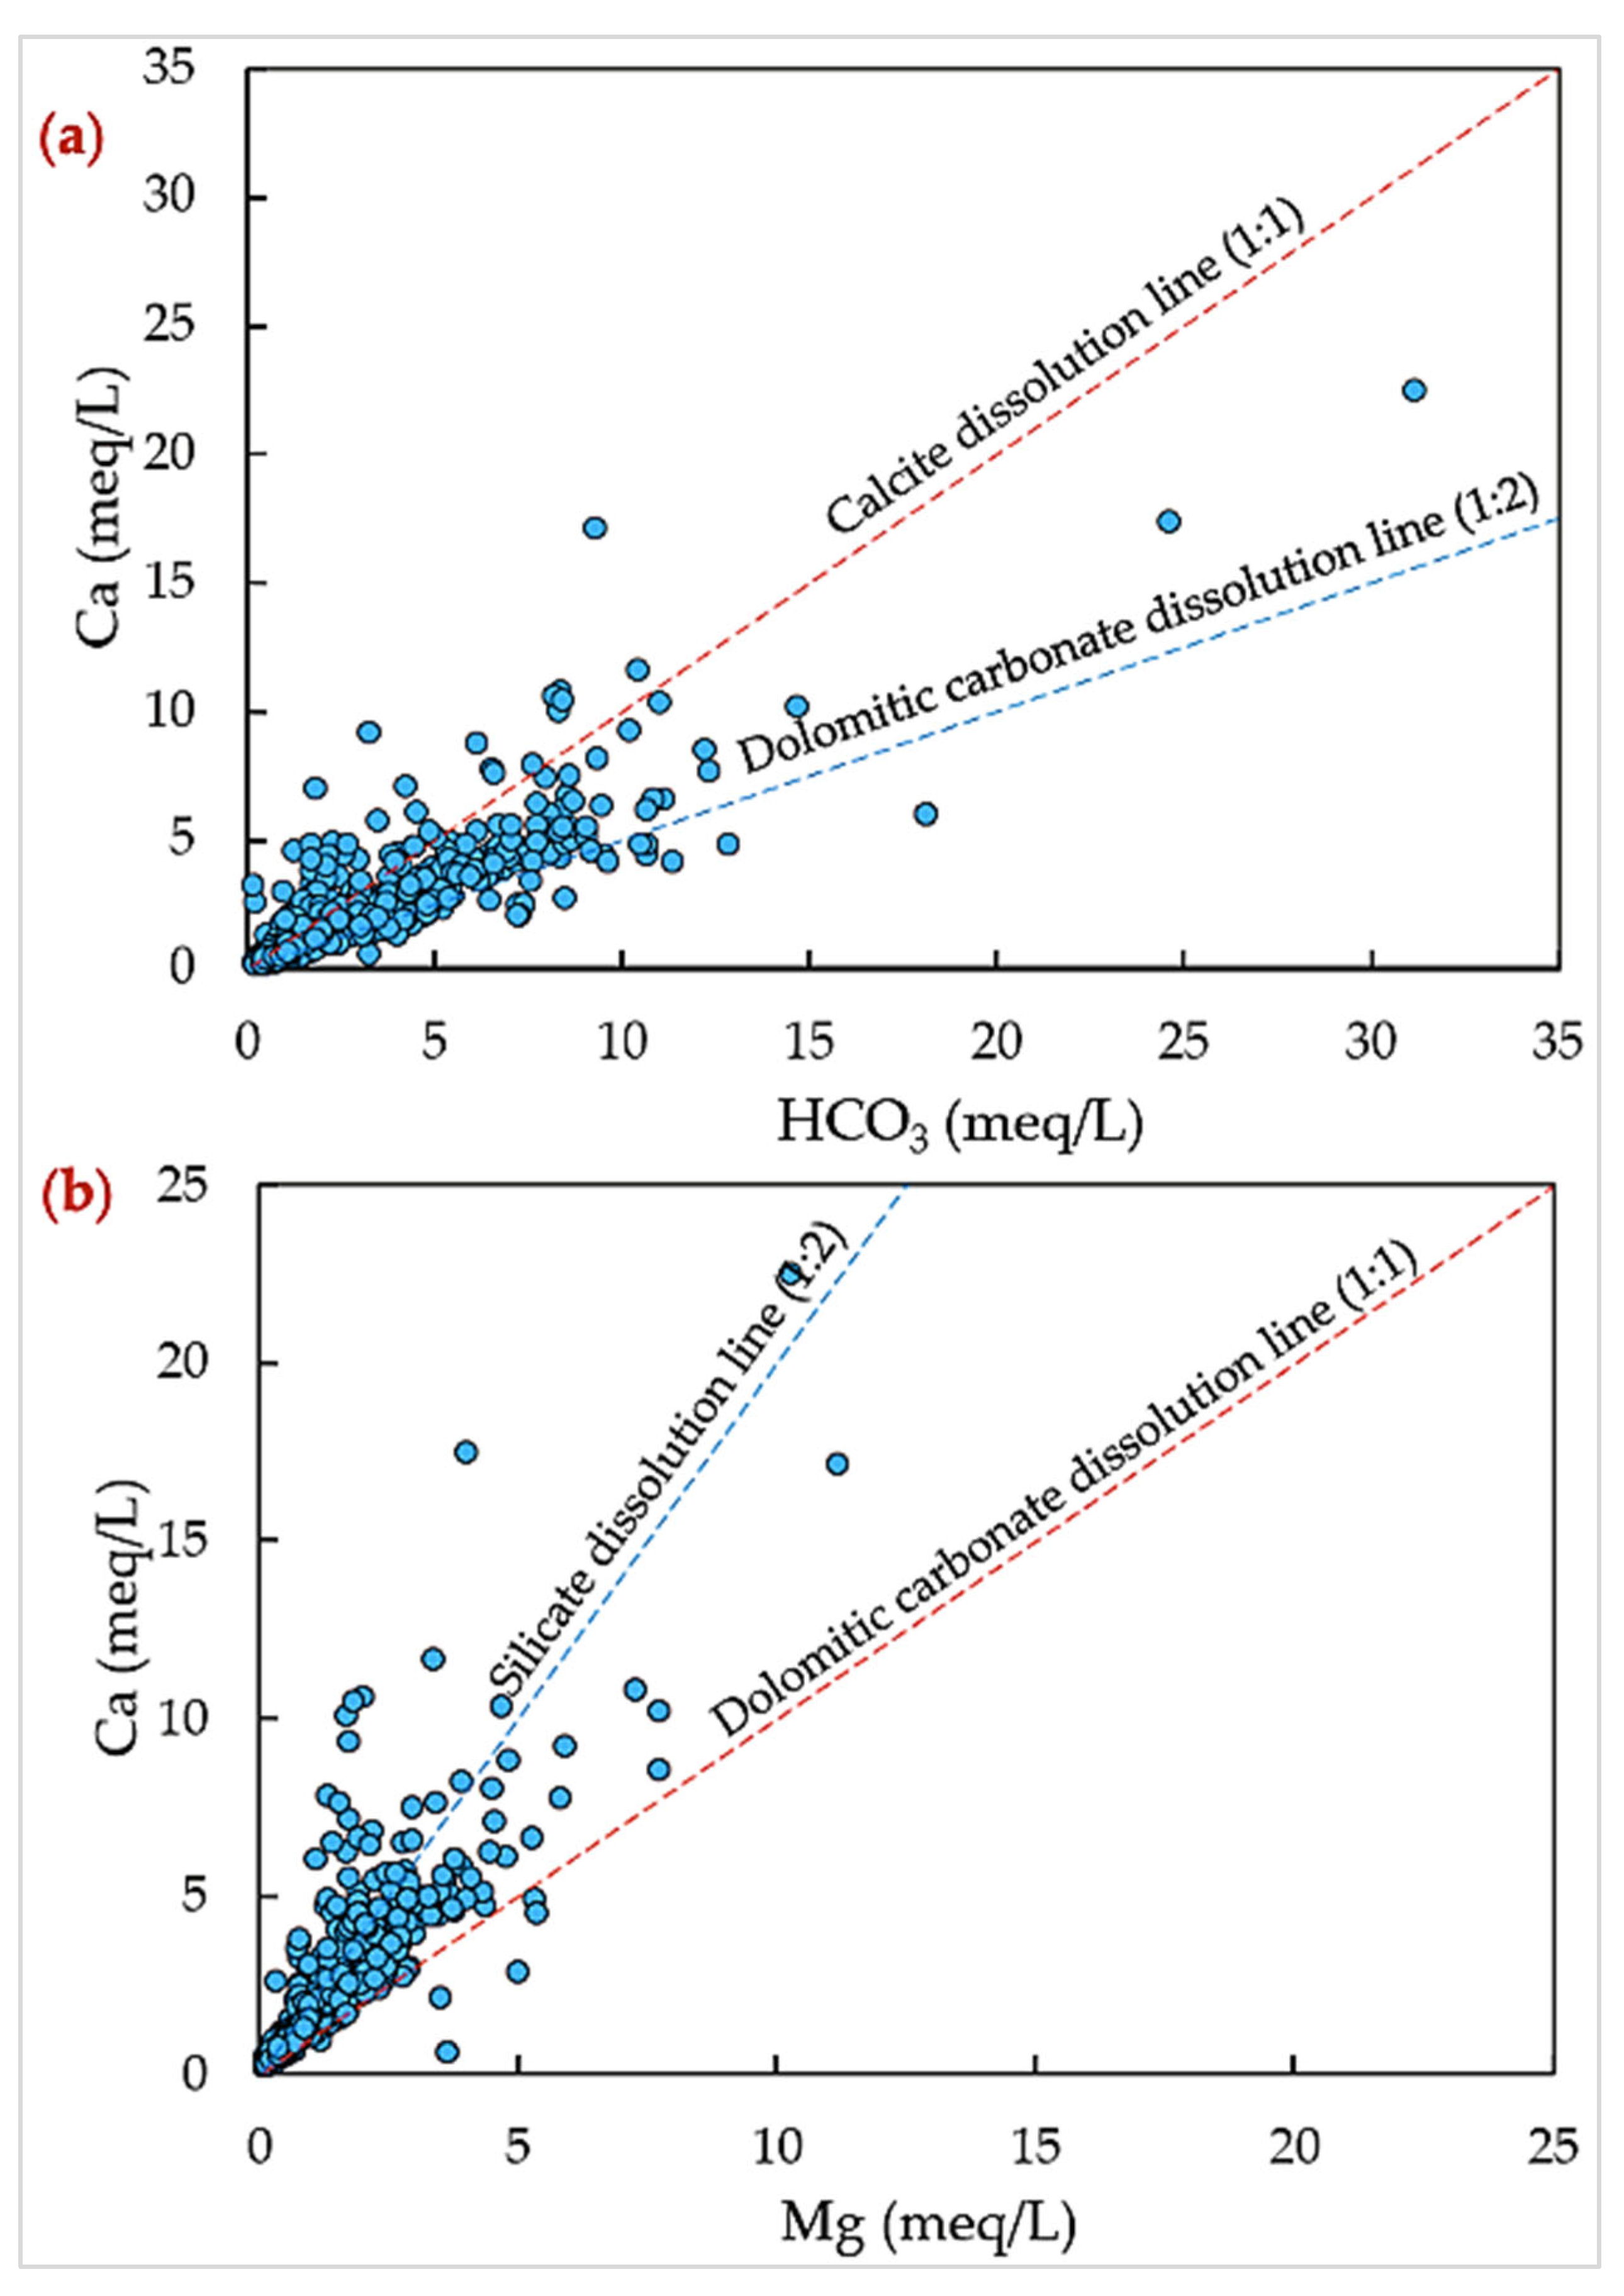
The calcium vs. bicarbonate (Ca2+/HCO3) weight ratio was used to examine carbonate mineral-related geochemical reactions (e.g., the dissolution of calcite and apparent high-Mg dolomitic carbonate controlled by the dissolution of Mg-silicates and plagioclase) controlling Lake Malawi basin groundwater mineral enrichment. The results identified high-Mg dolomitic carbonate dissolution as a controlling geochemical reaction, revealed by the clustering of groundwater data within 1:1 and 1:2 HCO3/Ca2+ weight ratios (Figure 9a).
The calcium vs. magnesium (Ca2+/Mg2+) weight ratio was used to further examine the carbonate and silicate mineral-related geochemical reactions controlling the Lake Malawi basin groundwater mineral enrichment. The results identified dolomitic carbonate dissolution and calcium or magnesium silicate dissolution as the controlling geochemical mechanisms of groundwater mineral enrichment (Figure 9b), revealed by a dominant Ca2+/Mg2+ weight ratio greater than 1:1, clustering within 1:2 equiline. A groundwater data subset plotted above the 1:1 equiline for the Ca2+/Mg2+ weight ratio suggests excess Ca2+ derived from other geochemical reactions.
Cation exchange reactions were examined using the linear relationship of adjusted calcium and magnesium concentrations (Ca2+ + Mg2+ − HCO3 − SO42−) vs. sodium and potassium adjusted concentrations (Na+ + K+ − Cl) to refine the cation exchange reaction controlling insights. The aforementioned adjustments were made to eliminate any potential influence deriving from silicate weathering, gypsum (unlikely), and halite (unlikely) dissolution reactions. The resulting slope for the linear relationship agrees with the expected ideal slope of −1, suggesting silicate mineral reactions with forward cation exchange reactions (Figure S1a) [59]. The Schoeller chloro-alkaline indices (CAI-I; CAI-II) calculated based on Equations (3) and (4) suggest the dominant occurrence of cation exchange forward reaction influencing groundwater mineralisation (Figure S1b).

4.4. Geochemical Modelling

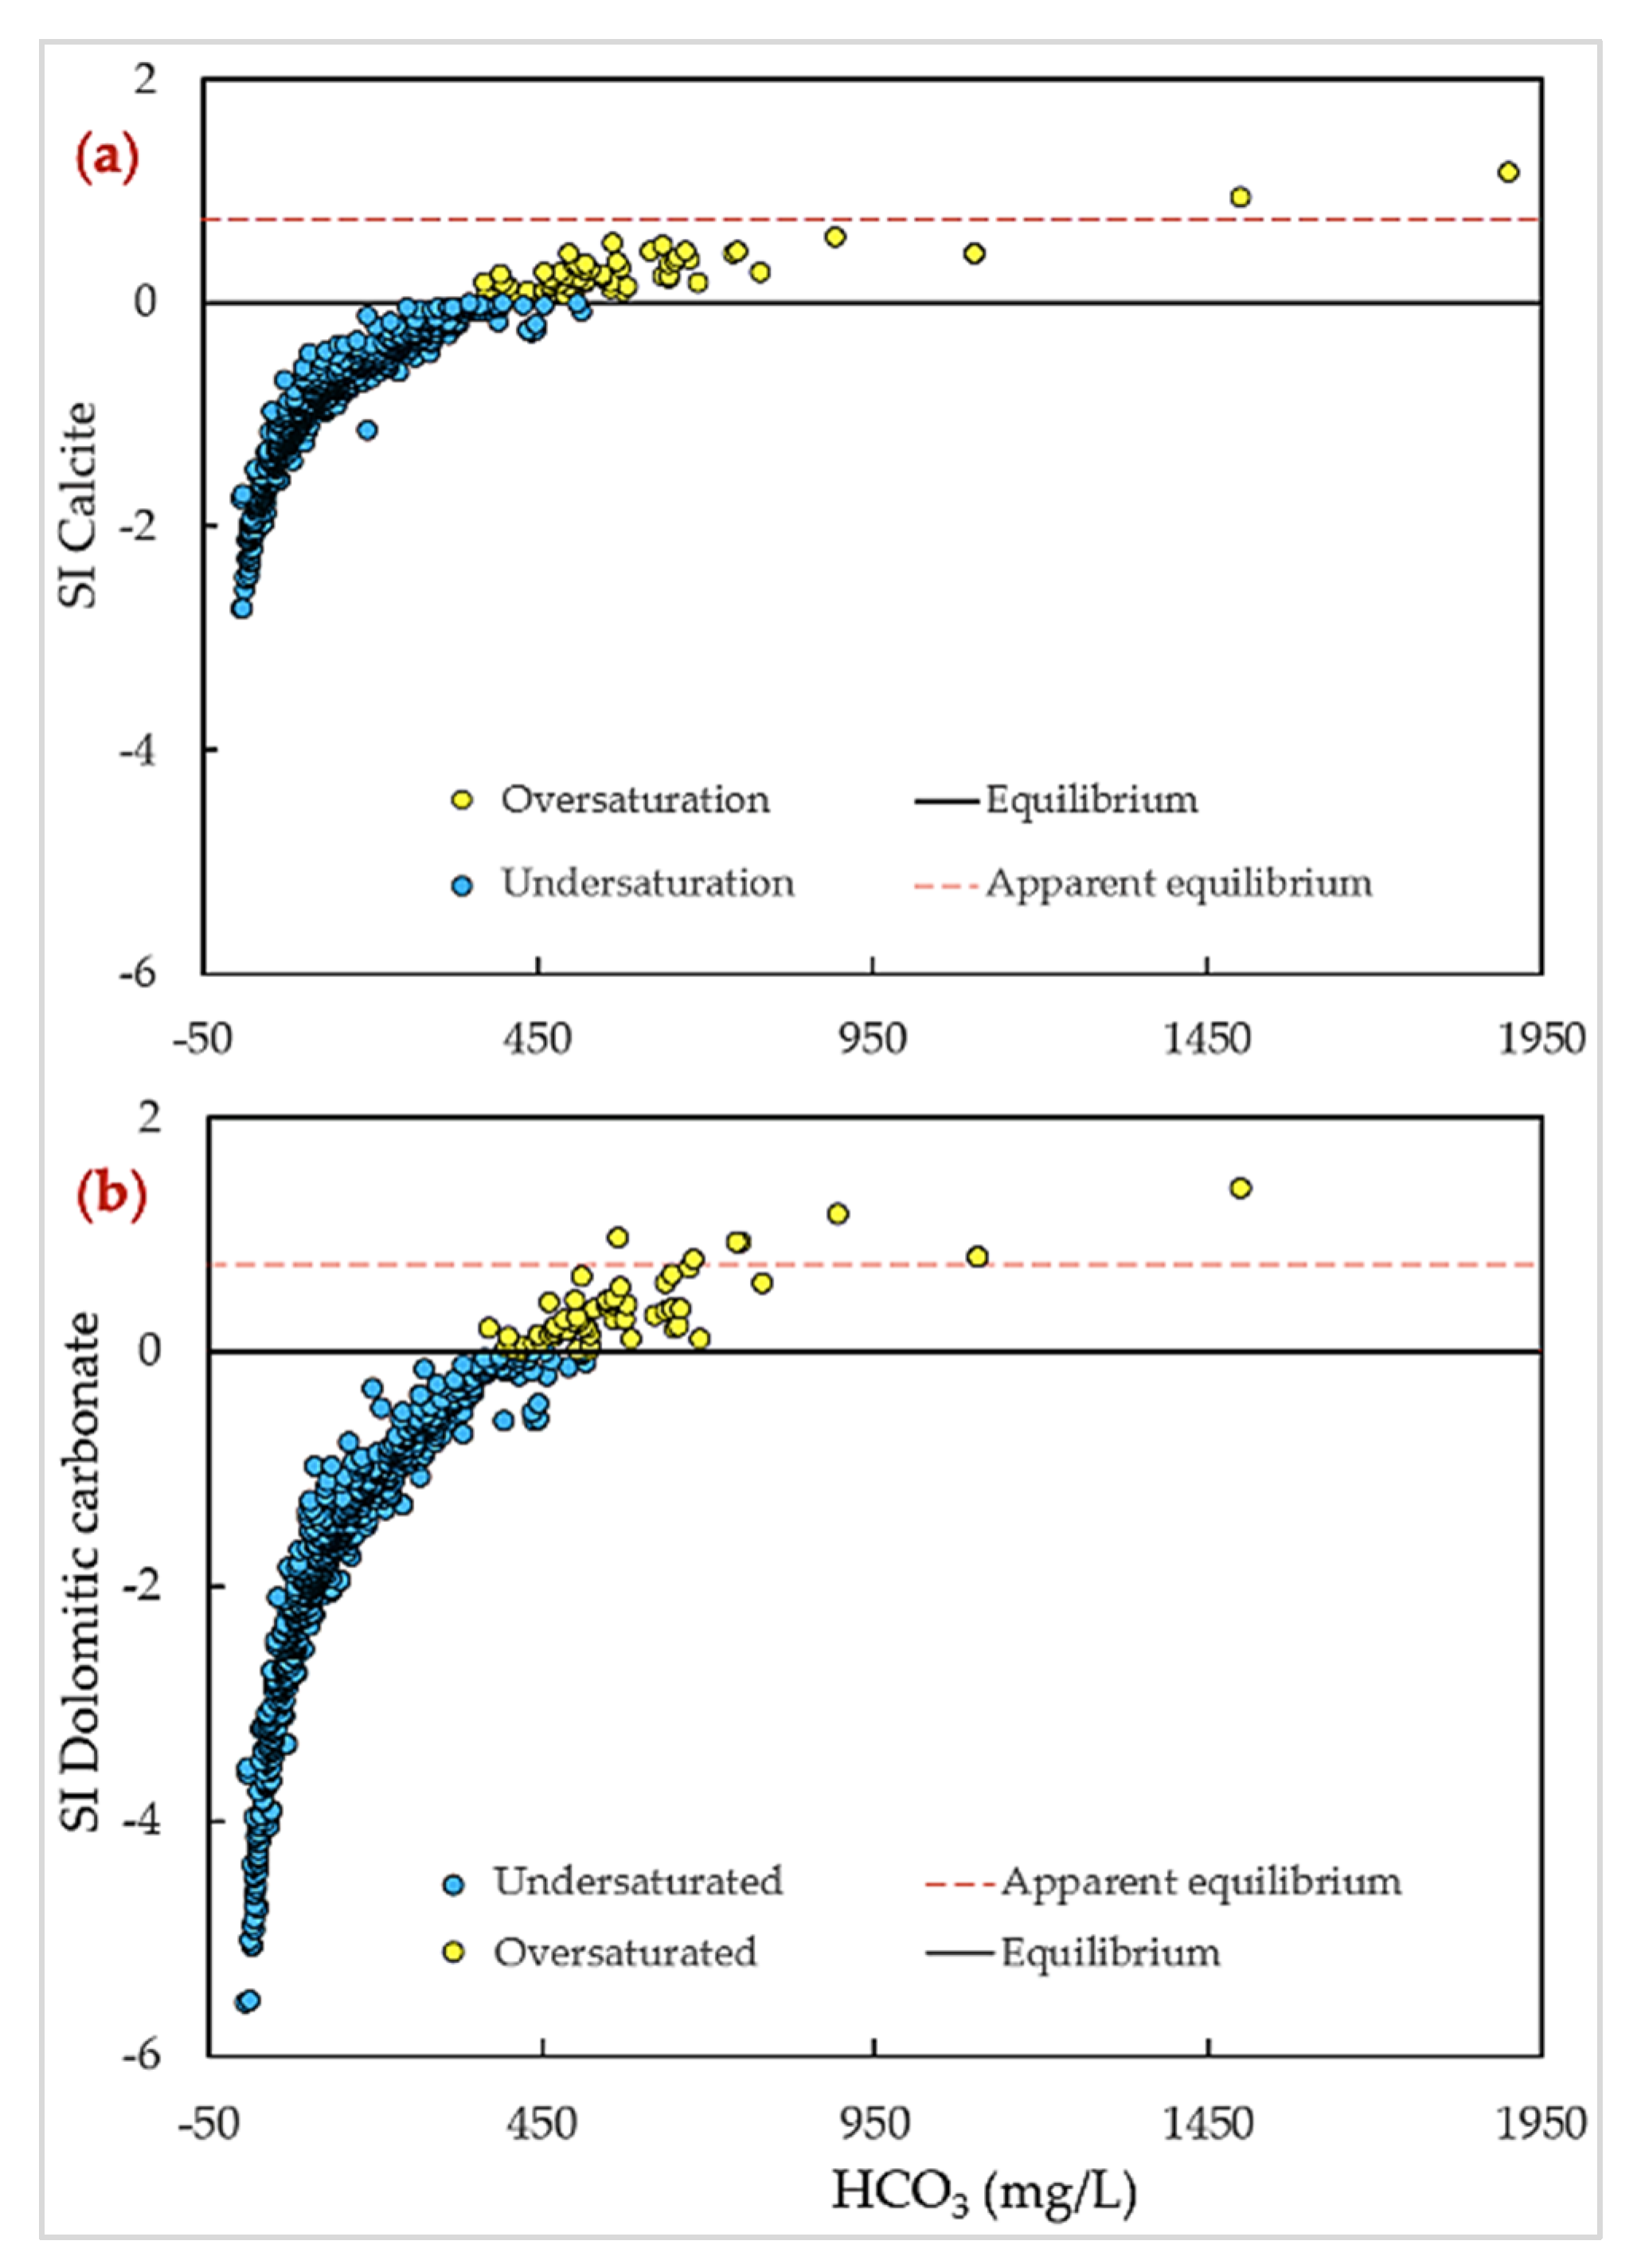
Geochemical modelling identified probable reactions controlling chemical evolution and chemical changes resulting from such reactions [29]. The saturation index (SI) calculated based on Equation (5) provided insights into an equilibrium state with respect to groundwater and solid mineral phases [53,54,55]. The results showed that groundwater from 58% of the samples was undersaturated (SIcalcite: −2.8 to 0) with respect to mineral phase calcite (CaCO3), while the remaining 42% was at equilibrium or oversaturated (SIcalcite: 0 to 1.9) with respect to mineral phase calcite (CaCO3) (Figure 10a). The negative SIcalcite suggests a thermodynamic potential for calcite to dissolve in the groundwater. The positive SIcalcite suggests conditions likely to reverse the reaction, resulting in the precipitation of calcite from the solution phase. The SIcalcite near zero or remaining as a constant down gradient along the groundwater flow path suggests apparent equilibrium conditions in the groundwater system (where the mass transfer precipitation/dissolution of carbonate minerals continues as silicate weathering occurs). The negative SIcalcite is associated with groundwater recharge in highlands, which is characterised by low pH. The positive SIcalcite is associated with high groundwater pH, likely influenced by the weathering of silicate minerals, raising carbonate ions (CO32−) while reducing hydrogen ions (H+). It should be noted that the saturation index for carbonate species is co-dependent on an accurate field measurement of alkalinity, pH, temperature (in situ), and pCO2; thus, with uncertainty, the slightly positive values may, in fact, be in equilibrium. Given calcite is generally not kinetically hindered, the results shown in Figure 10a likely, therefore, converge to equilibrium (through the precipitation of carbonate phases or, where highly undersaturated, dissolution).
Groundwater from 61% of the samples exhibited undersaturation conditions (SIdolomitic carbonate: −5.6 to 0) with respect to mineral phase dolomite (CaMg(CO3)2), which here is considered the end-member of a high Mg dolomitic carbonate (the source of Mg most likely from the incongruent dissolution of ferromagnesian silicate minerals). The remaining 39% exhibited oversaturation (SIdolomitic carbonate: 0 to 3.6) with respect to mineral phase dolomite (Figure 10b). The negative SIdolomitic carbonate suggests a thermodynamic potential for a high Mg dolomitic carbonate to dissolve in groundwater. The positive SIdolomitic carbonate suggests conditions are likely to reverse the reaction, resulting in high Mg carbonate precipitation from the solution phase. The precipitation of dolomite is kinetically hindered, and, therefore, high SI values may be due to slow rates of high Mg carbonate precipitation. These geochemical reactions suggest the presence of carbonate minerals undergoing continuous dissolution and precipitation in groundwater. The SI ranges for Gypsum (CaSO4.2H2O) (SIgypsum: −6.9 to −0.4) indicate this evaporite mineral is not actively involved in geochemical reactions but is able to dissolve in the Lake Malawi basin groundwater should it locally exist (Figure S2). Given there is no current geologic evidence for the occurrence of these minerals, a detailed mineralogic analysis of aquifer materials is needed, and thermodynamic interpretation should be avoided.
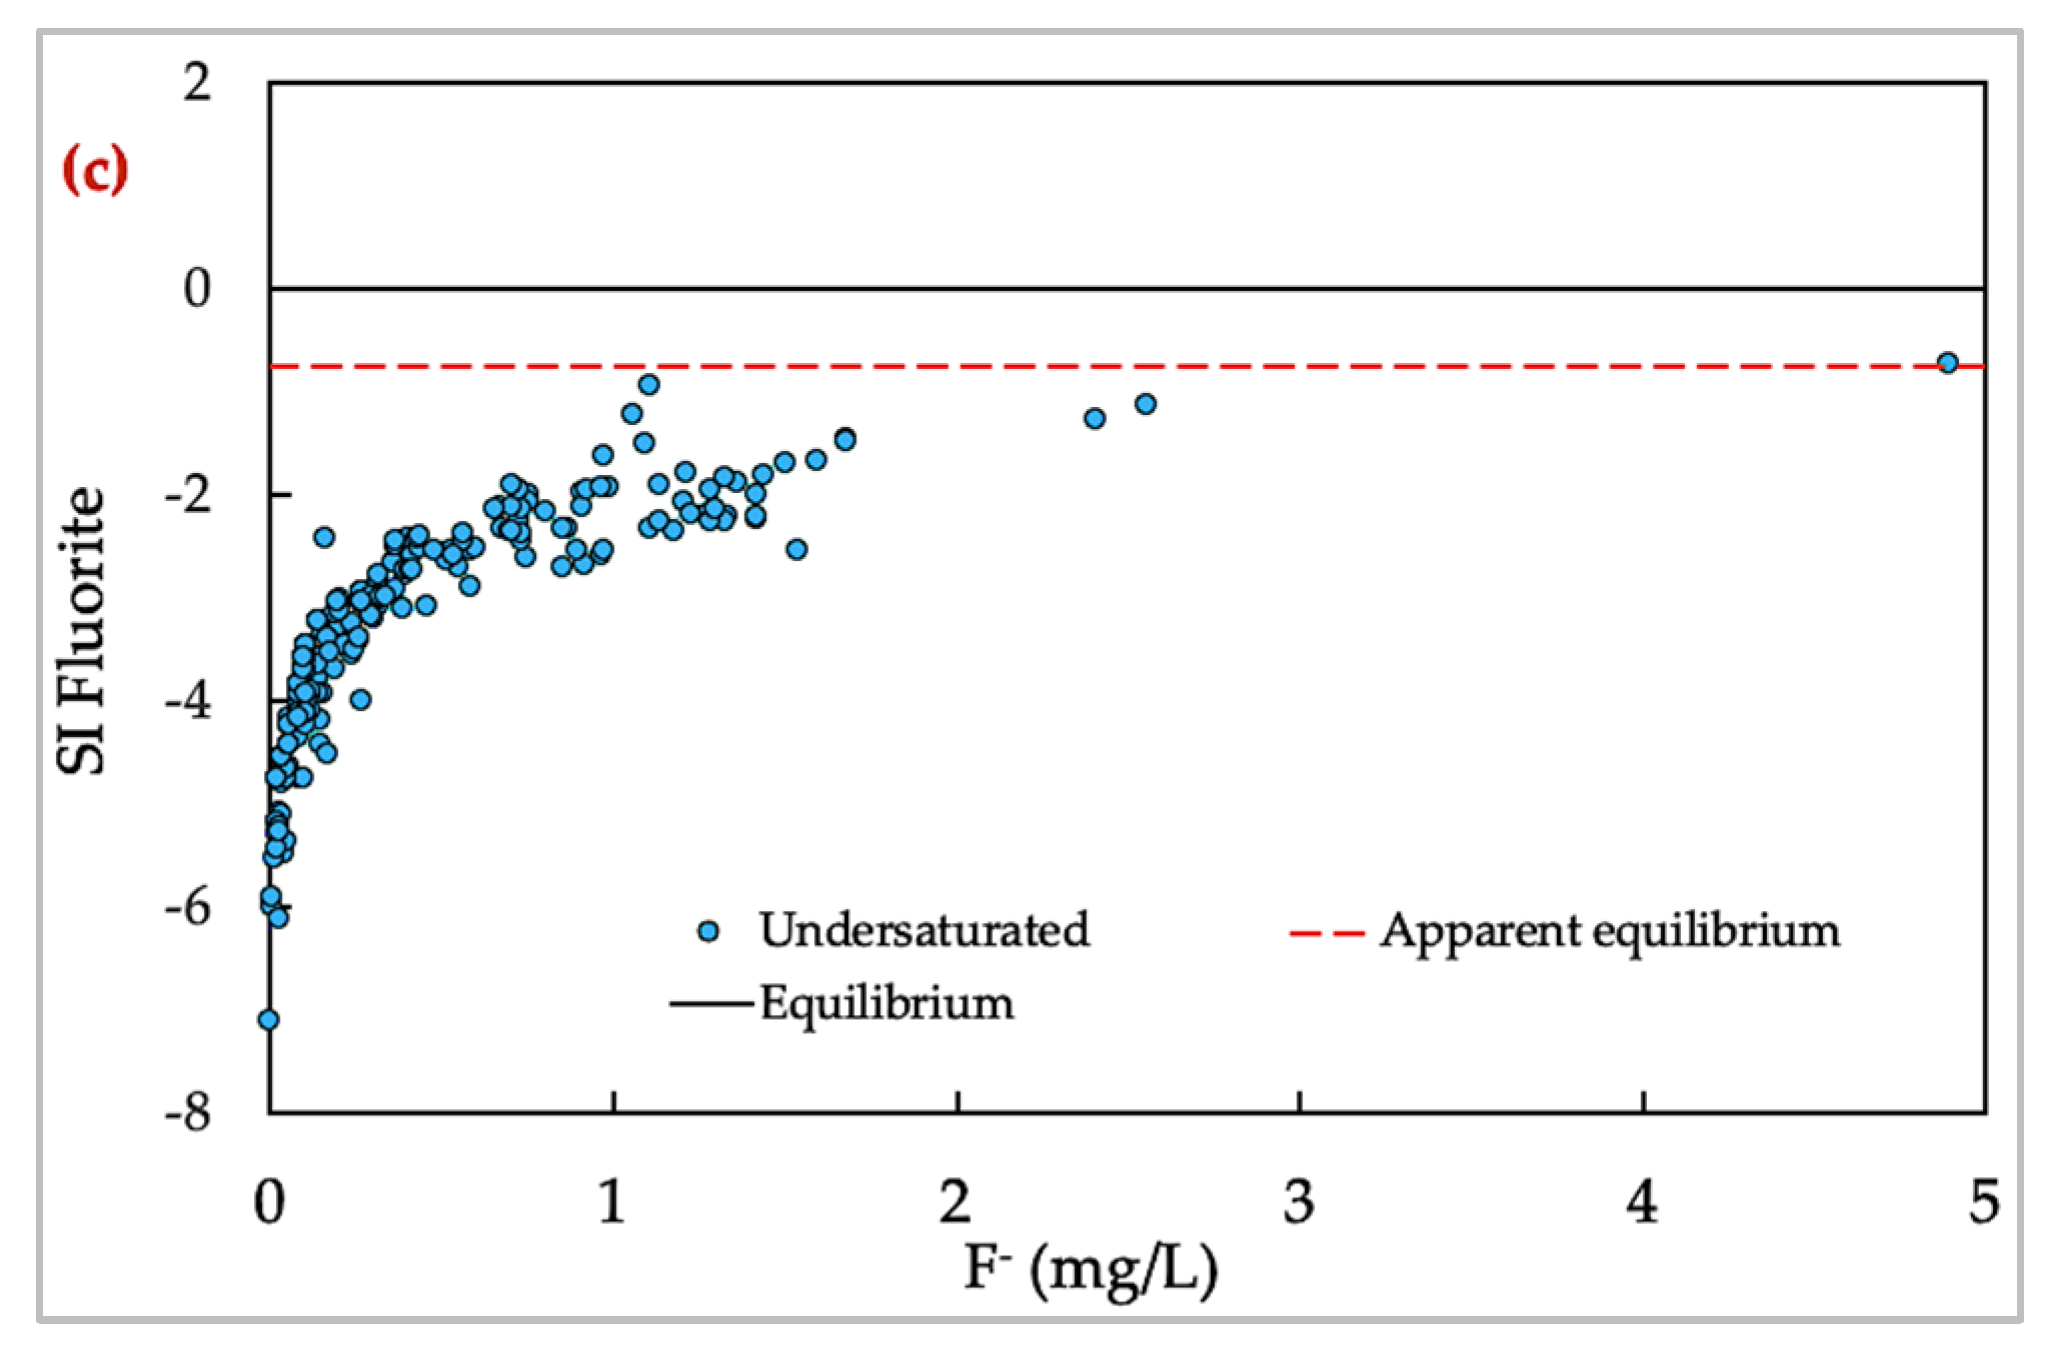
It is possible that deep fluid flow (hidden hot springs) is also a source of sulphate and fluoride and requires further investigation [60]. The SI of Fluorite (CaF2) spanned from −8.8 to −0.8, approaching apparent equilibrium. This trend may be a common ion effect with calcite (Figure 10a,c), but given the increasing concentrations of fluoride, there is a need for further substantiating evidence of deep fluid circulation from geothermally active areas, herein the source of fluoride ions in groundwater [60].

4.5. Isotope Hydrology Characteristics

4.5.1. Precipitation Stable Isotope Signatures

The isotope hydrology of precipitation in the Lake Malawi basin was measured on samples collected at four observatory stations as part of the Malawi Network of Isotopes in Precipitation (MNIP) (Table S2). The precipitation δ2H signatures (n = 91) ranged from −111.2‰ to +12.4‰, with a mean of −35.6‰, and δ18O signatures ranged from −14.3‰ to +1.0‰, with a mean of −6.1‰ (Figure 11a,b; Table S3). The precipitation d-parameter was distributed between −2.2‰ and +19.3‰, with a mean of +13.3‰. The mean d-parameter of +13.3‰ showed that the recycling of atmospheric moisture by large-scale evaporation process off Lake Malawi was highly likely, a proxy indicator of an isotopic offset of the local air mass from the global air mass (Figure 11a). This isotopic offset ascribed to the d-parameter in precipitation is consistent with the African Great Lakes region isotopic effect.
The wide range of measured isotopes (range: +123‰ for δ2H, +15.3‰ for δ18O) is attributed to controlling factors such as evaporation, different moisture sources, and the influence of Lake Malawi producing spatial and seasonal variations [30,42,44,45].

4.5.2. Groundwater Stable Isotope Signatures

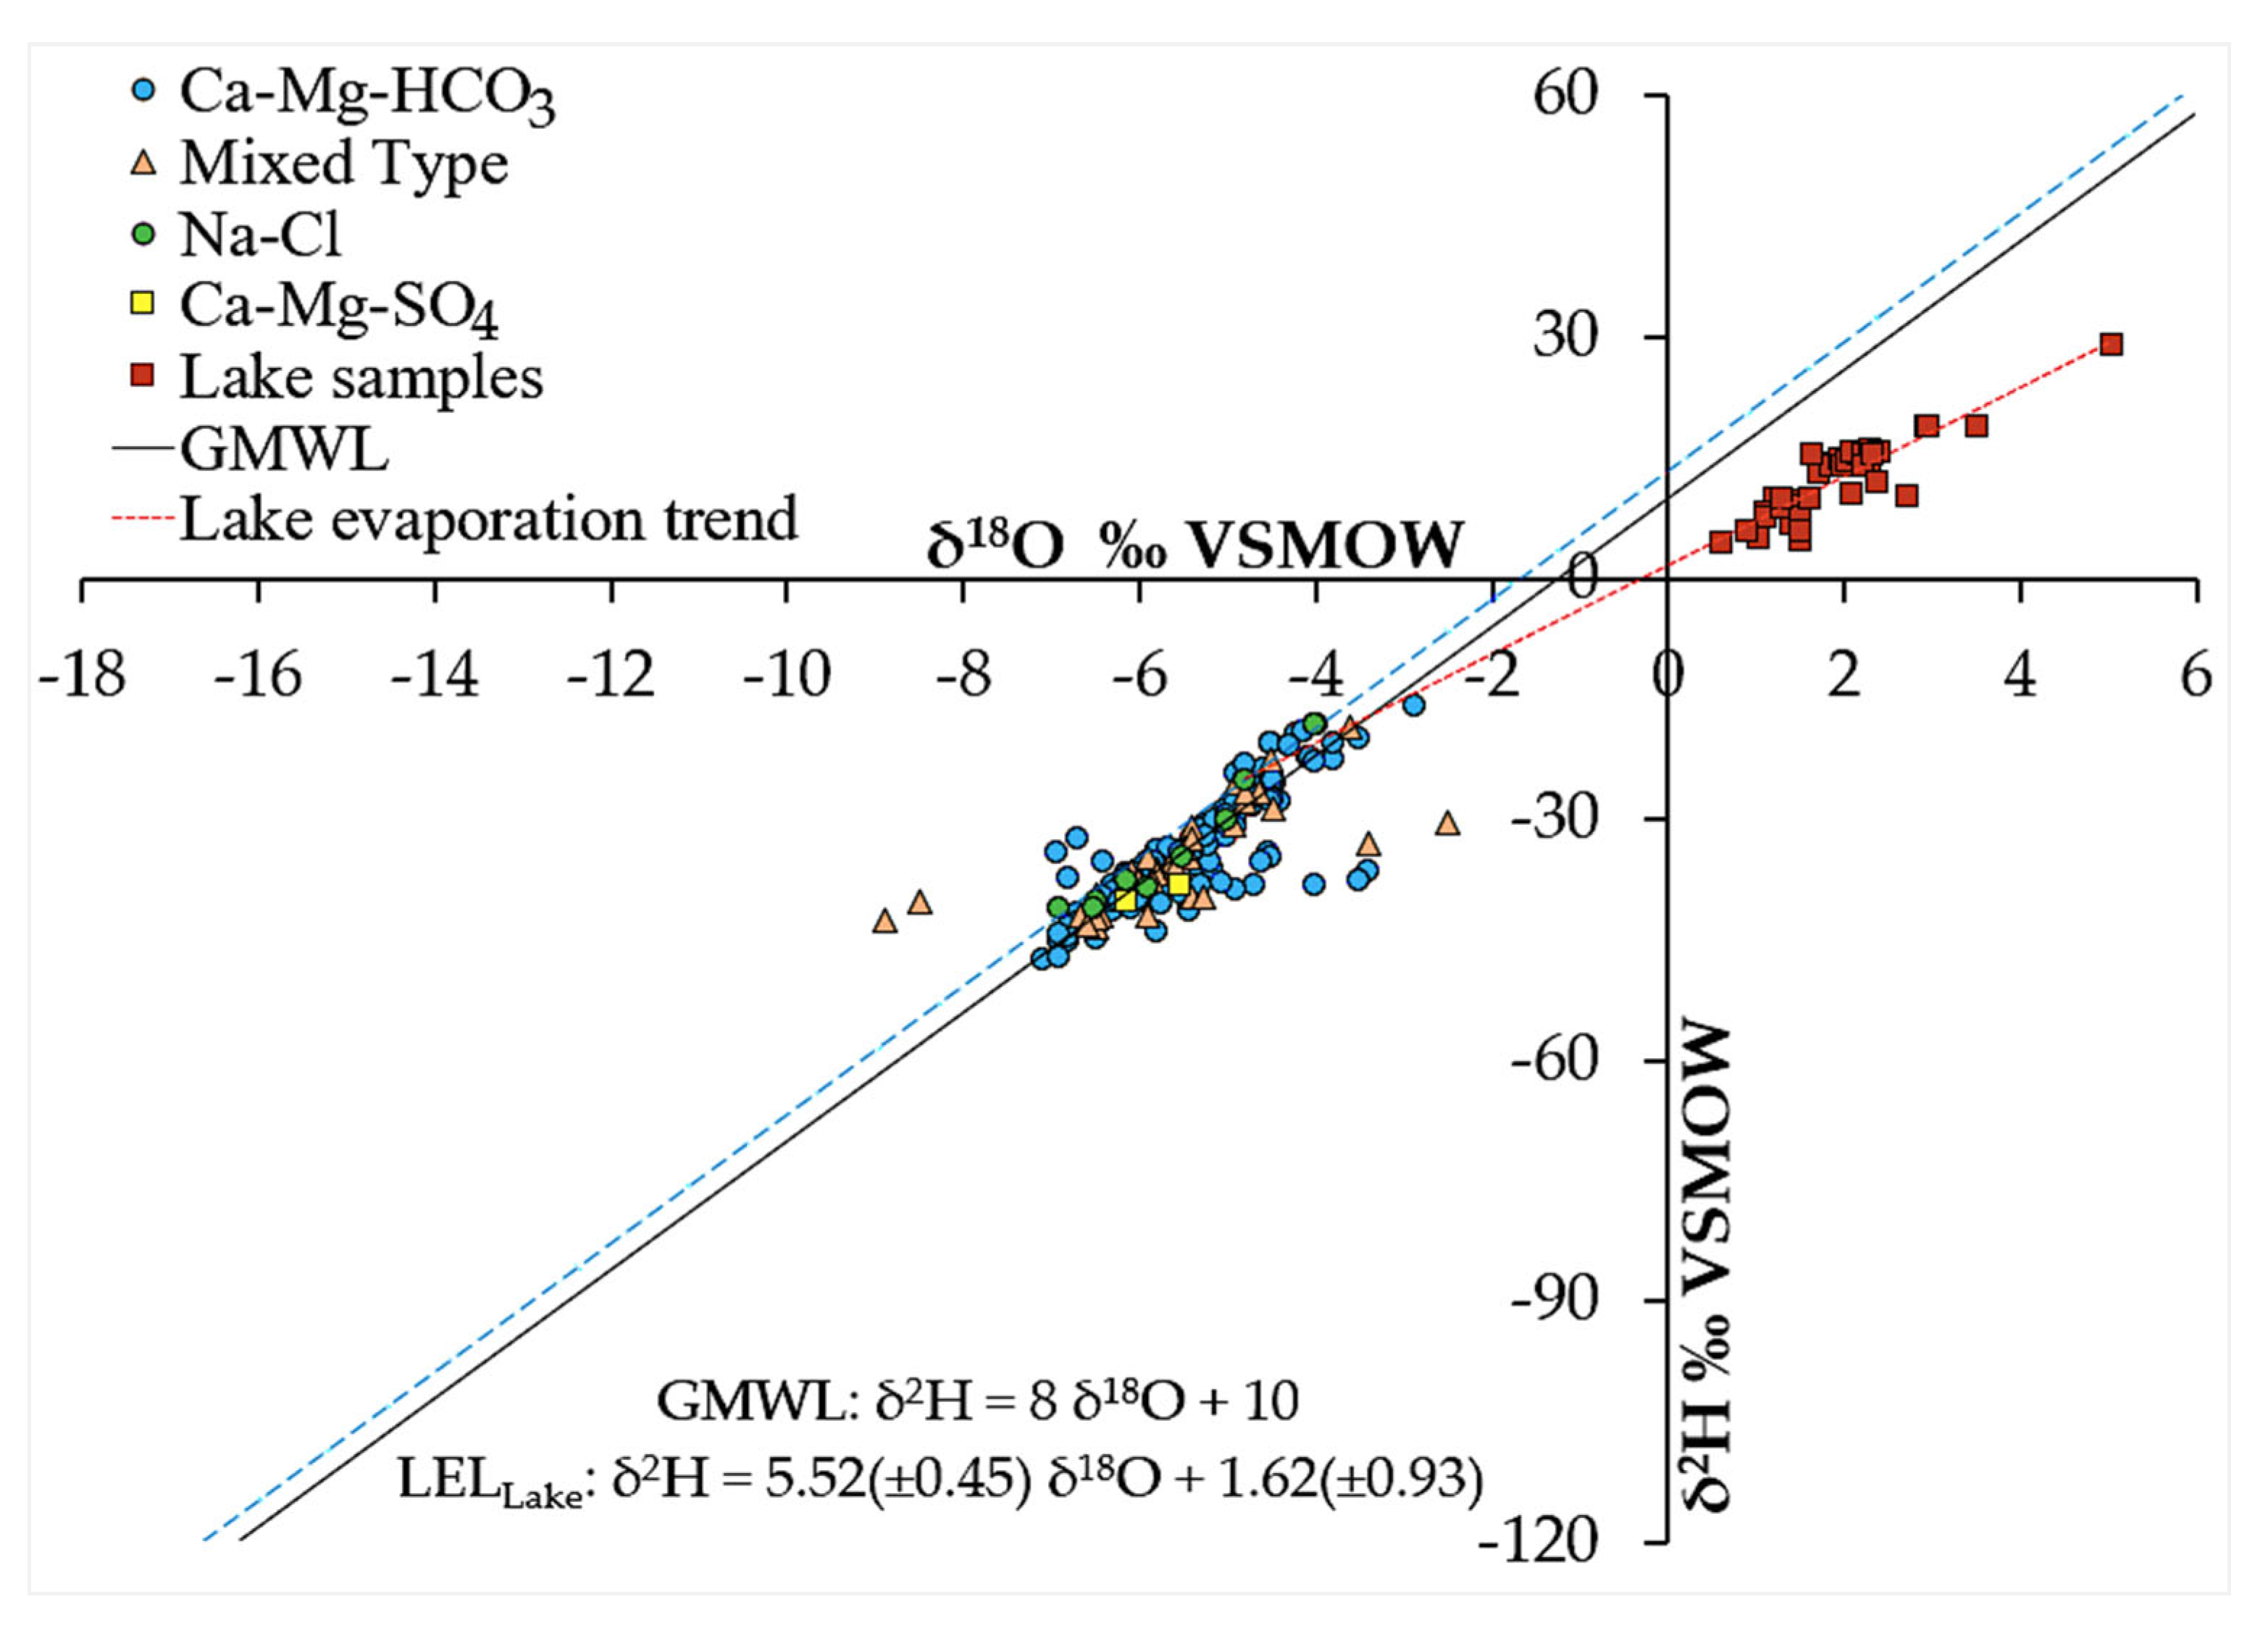
Groundwater δ2H range from −47.4 ‰ to −15.8 ‰, with a mean of −34.6‰, and δ18O ranged from -8.9‰ and −2.5‰, with a mean of −5.6‰ (Figure 12a; Table S4). The d-parameter ranged from −10.5 to +28.6‰, with a mean of +10.0‰ (Figure 12b). Most groundwater samples, categorised as Group G1, were depleted in heavier isotopes and aligned with the Global Meteoric Water Line (GMWL), suggesting groundwater recharge from modern non-evaporated local meteoric waters (Figure 12a). This is defined by the mean groundwater signatures corresponding to the mean precipitation signatures. A subset of samples, Group G2, deviated below the GMWL, exhibiting isotopic enrichment, prominent during the ‘dry season’ in low-lying and near-lake sites, ascribed to secondary evaporative fractionation. The secondary evaporative fractionation prior to groundwater recharge occurs either during the initial runoff preceding infiltration, within the groundwater body itself, or from infiltrating isotopically enriched surface water (e.g., from irrigation return). The Group G2 could also be influenced by deep-seated hydrothermal waters (Figure 12c). The Group G3 samples plot above the meteoric water line. Precipitation, which comes from moisture in a closed evaporative basin and/or is initially snow, may have significantly enhanced the d-parameter for this group [61,62]. Recent studies of δ17O further elucidate these effects, and future studies of δ17O in precipitation in the African Great Lakes region are highly warranted [63].
Overall, the mean δ18O–δ2H signatures of groundwater were consistent with the mean δ18O–δ2H signatures of modern local precipitation. The evaporation trend in Figure 12a is a proxy indicator of lake water and groundwater mixing, suggesting lake water infiltration to the aquifer and groundwater discharge to the lake water system.

4.5.3. Dynamics: Spatial Distribution and Seasonal Effects

The spatial distribution of δ2H–δ18O signatures aligns with geographic expectations, with enriched δ2H–δ18O signatures predominant in low-lying and near-lake sites and depleted δ2H–δ18O signatures dominant in highland plateau sites (Figure 13). Nonetheless, there was no statistically significant evidence of a distinct elevation effect on isotopic signatures of groundwater (Figure S3). There was a discernible seasonally variant disparity in the spatial distribution of δ2H–δ18O signatures, wherein certain upland and lowland sites exhibited enriched and depleted δ2H–δ18O signatures, respectively (Figure S4). The order of magnitude of the hydraulic head is consistent with progressive groundwater isotopic fractionation, whereby shallow groundwater (susceptible to phreatic evaporation) exhibits less negative δ2H–δ18O signatures than deep groundwater. Near-geologic fault groundwater sites exhibit complex isotopic signatures’ inhomogeneity ascribed to multi-influential process controls linked to groundwater sample flow path chronicle and/or evaporative effects (Figure 13).
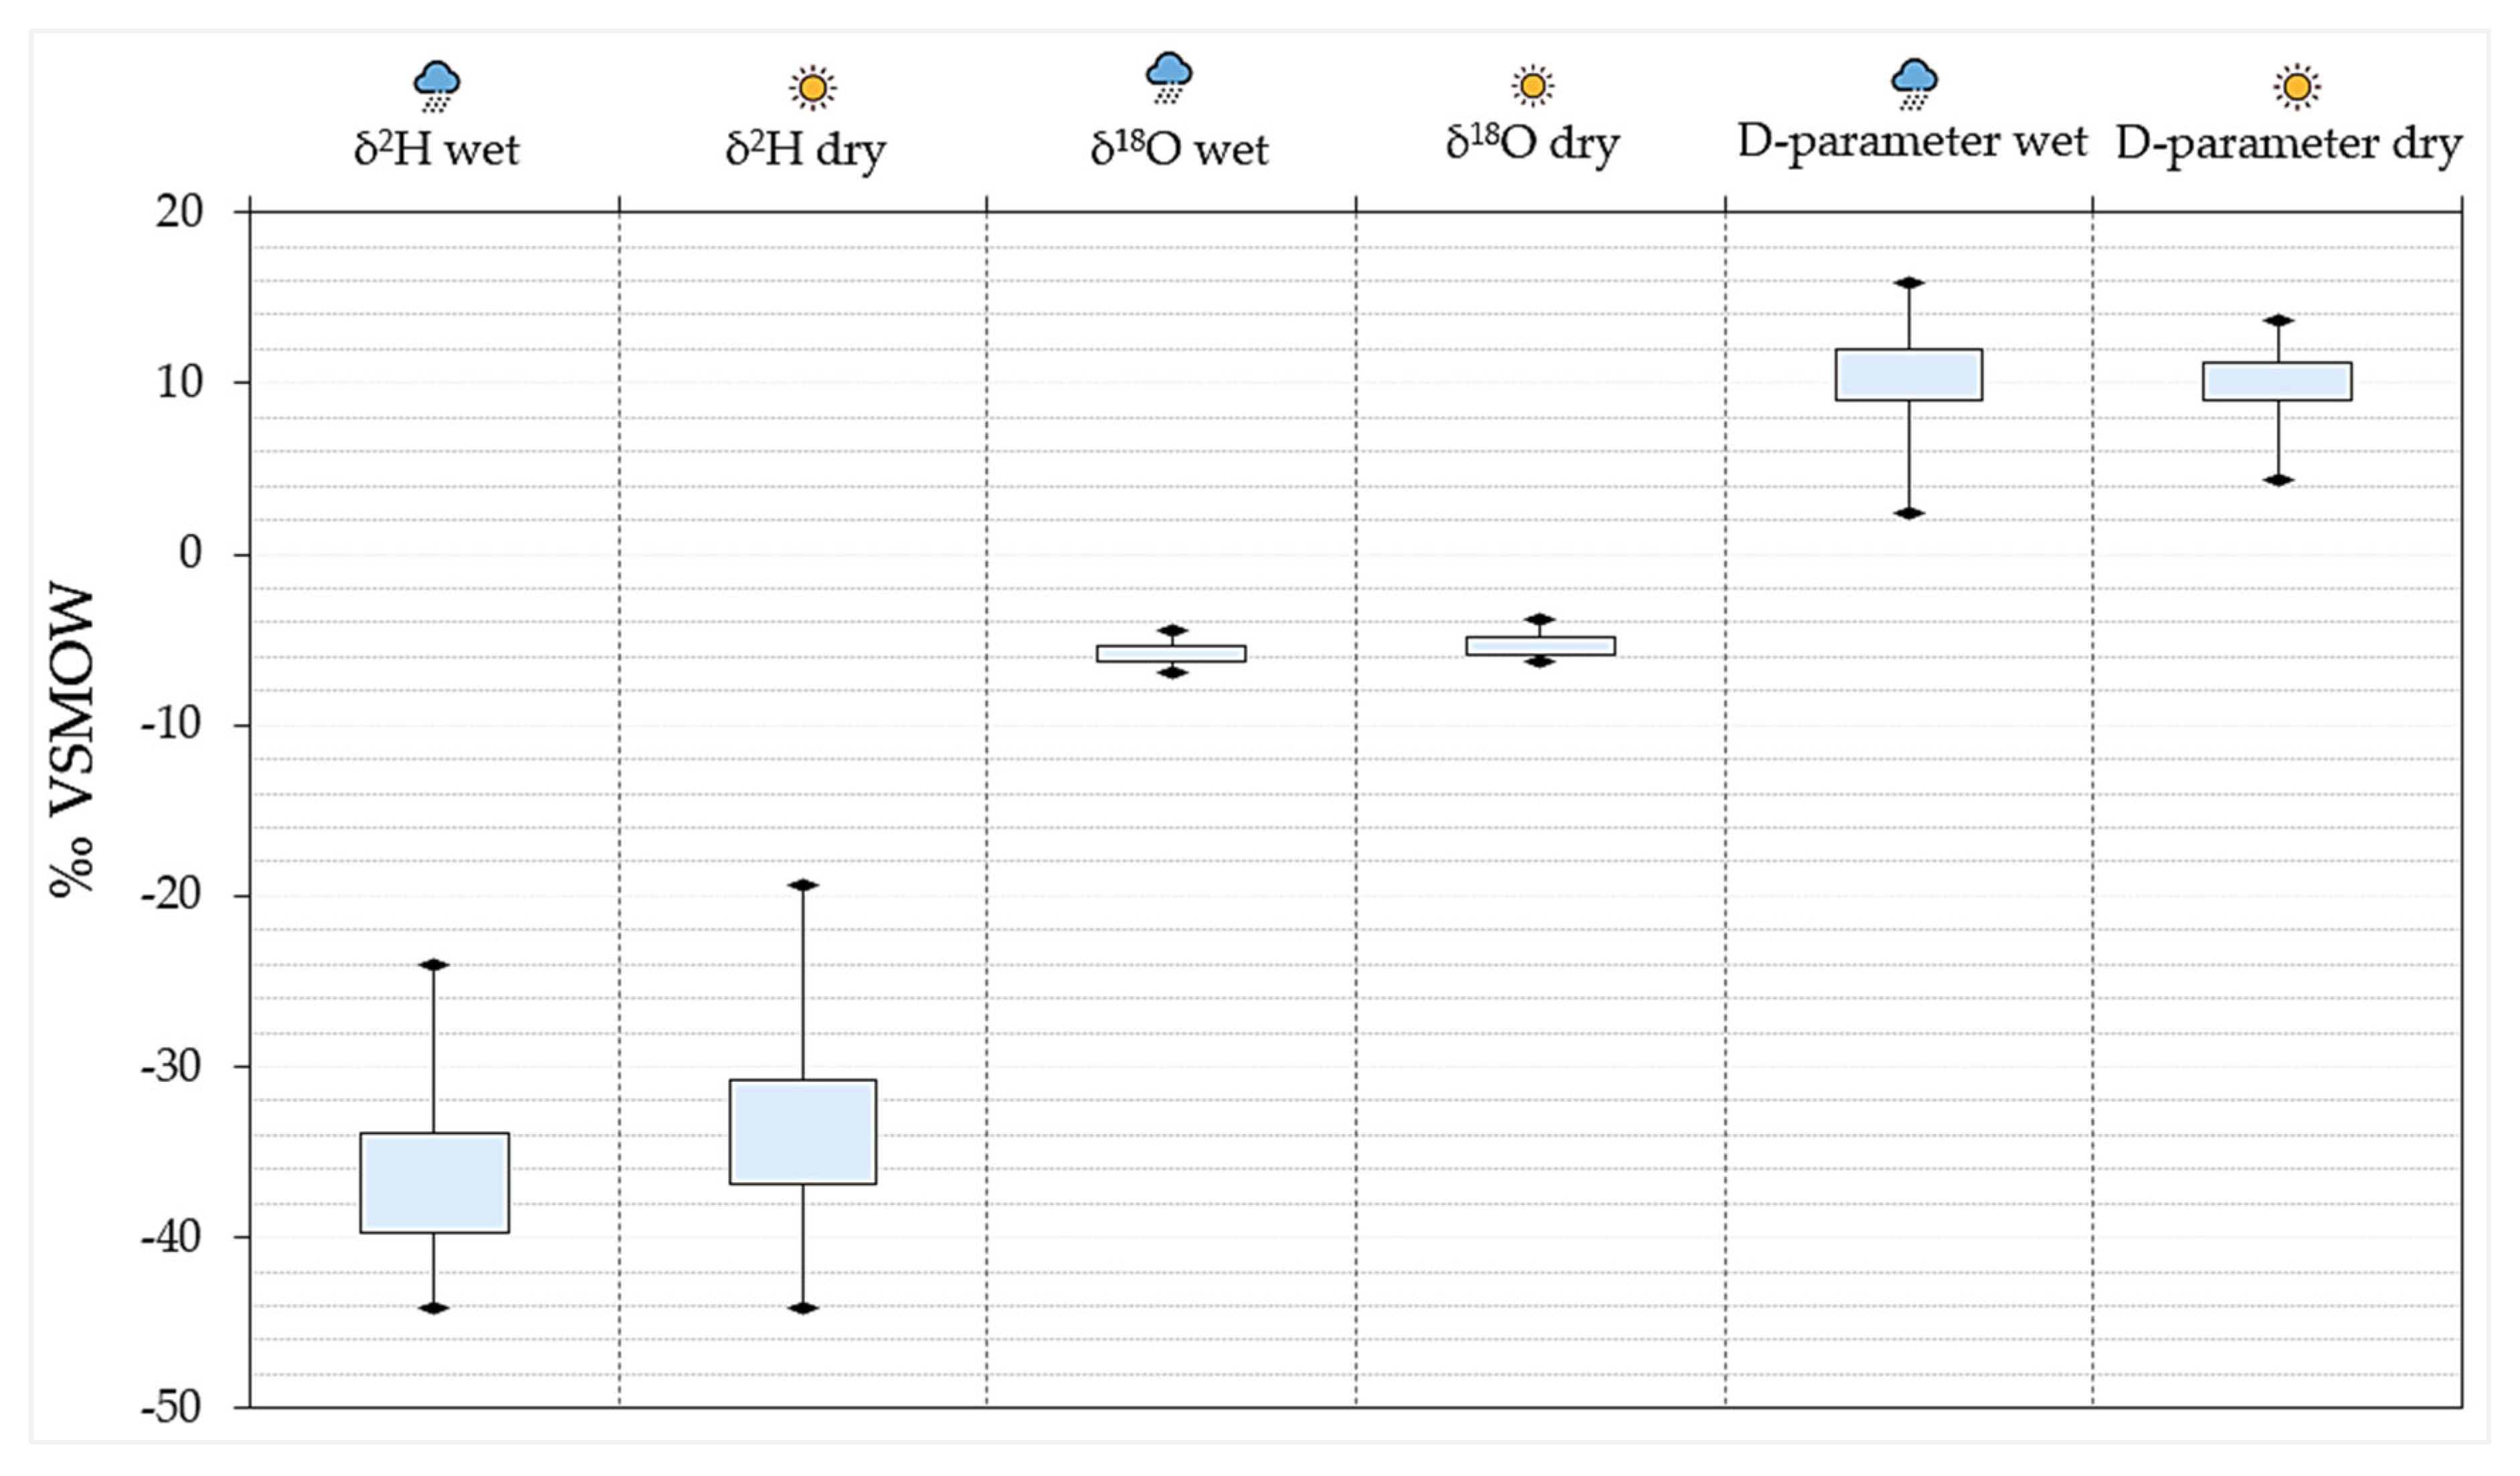
Groundwater δ2H–δ18O signatures for wet and dry seasons reveal distinct patterns (Figure 14). Dry season δ2H–δ18O signatures exhibited evaporative influences on groundwater either pre- or post-recharge and the potential infiltration of enriched lake water. They were enriched in heavier isotopes than wet season δ2H–δ18O signatures, with a wider intra-seasonal inhomogeneity. However, some anomalies defy seasonal expectations, with enriched δ2H–δ18O signatures in the wet season and depleted δ2H–δ18O signatures in the dry season. These anomalies may be attributed to a combination of factors, including local recharge mechanisms, mixing of water sources, and anthropogenic influences. This basin’s hydrogeological system complexities highlight the intricate interplay of meteoric water input, evaporation effects, recharge processes, deep fluid circulation, and mixing sources within the Lake Malawi basin.

4.6. Integrated Isotopic-Hydrogeochemical and Geospatial Insights

Examining δ2H–δ18O signatures in conjunction with hydrogeochemical data provides a refined understanding of the groundwater recharge process and evolution. The prevalent Ca-Mg-HCO3 groundwater type, characterised by low mineralisation and alignment with the GMWL, indicates a recent recharge from local precipitation that has not undergone significant evaporation (Figure 15). Another common type, Ca-Mg-SO4 groundwater with a slightly higher electrical conductivity that plots just below the meteoric water line, suggests evaporative effects either pre- or post-recharge. The mixed groundwater types, Na-HCO3-Cl and Ca-Mg-SO4-Cl, plot along the GMWL but with outliers, suggesting the mixing of groundwater from multiple sources. Diverse processes, such as mineral–water reactions and evaporative effects, contribute to these mixed groundwater types. The Na-Cl groundwater type plots along and slightly below the GMWL, suggesting the mixing of older groundwater with newer meteoric water, with the latter dominating isotopically. Given the limited constraints on this observation, additional investigation is necessary to elucidate the findings. The combined isotope hydrology and hydrogeochemistry results point towards a mix of processes impacting groundwater evolution. The complexity of hydrochemical types and isotopic signatures, particularly near the lakeshore area at Lake Malawi, suggest intricate groundwater flow patterns and historical influences converging in this region.

5. Discussion

5.1. Origin of Ionic Species in Groundwater

Groundwater hydrochemistry exhibits a wide array of cationic and anionic species, dominated by Ca2+, Na+, HCO3, and Cl. These ionic species are attributed to a range of natural and anthropogenic processes. Sodium (Na+) is mainly obtained through the weathering of silicate rocks like albite (NaAlSi3O8), a sodium-rich plagioclase feldspar. Other sources of Na+ include cation exchange reactions that exchange calcium (Ca2+) from sodium-rich groundwater in clay. Highly localised evaporation and precipitation of trona (Na2CO3·NaHCO3·2H2O) in thermal spring sites constrained in the northern part of the basin yields sodium bicarbonate (NaHCO3) deposits, which dissolve to release Na+ in groundwater. Calcium (Ca2+) is primarily derived from anorthite (CaAl2Si2O8), a calcium-rich plagioclase, along with other rock minerals like hornblende (Ca2(MgFeAl)5(AlSi)8O22) and calcite. Magnesium (Mg2+) sources include the weathering of magnesium-bearing silicate minerals like biotite (K(Mg,Fe)3(AlSi3)10(OH,F)), olivine (Mg2SiO4), and amphibole (hornblende (Ca2(MgFeAl)5(AlSi)8O22)). Potassium (K+) is likely derived from muscovite Kal2(AlSi3O10)(F,OH)2 and biotite, typically found in sediments. Carbonate species (CO32− and HCO3) in groundwater are derived from carbonate mineral reactions, primarily calcite dissolution. The presence of SO42− in groundwater suggests the occurrence of oxidation reactions of pyrite rock mineral (FeS2) or deep fluid migration. The detection of NO3 in Malawi’s groundwater, where no geogenic source exists, suggests human influence. Identifying and addressing human-driven nitrate contamination sources is crucial for achieving Sustainable Development Goal 6 objectives. Fluoride (F) occurrence in groundwater can be attributed to various minerals, including micas, fluorapatite (Ca5(PO4)3F), fluorite (CaF2), and concealed thermal springs [60].

5.2. Groundwater Evolution

Groundwater recharge in the Lake Malawi basin primarily occurs as a result of the infiltration of precipitation, a fundamental process that introduces fresh meteoric water into the subsurface. This influx of water initiates a complex series of geochemical reactions with rock minerals driven by soil carbon dioxide as an acid source. Plagioclase feldspars, essential components of the rock matrix, undergo incongruent reactions upon interaction with meteoric water, leading to the release of calcium and sodium ions along with insoluble secondary clay minerals from complex smectites to simple kaolite (Table S5). The dissolution of carbonate species contributes to the overall chemical composition of groundwater in the basin. As groundwater flows through the rock matrix, incongruent reactions with silicates continue until saturation with carbonate minerals, predominantly calcite, is reached, after which mass transfer reactions continue at equilibrium, exerting significant control over groundwater chemistry. The weathering of plagioclase feldspar thus maintains an equilibrium with calcite. The presence of substantial carbonate in groundwater leads to the accumulation of calcite over time, especially in fractures and cavities within aquifer rocks. These fractures and cavities serve as crucial sites for the initiation of carbonate crystal formation, further influencing the groundwater system’s chemical and isotopic composition. Noteworthy changes in the aquifer’s composition and characteristics occur gradually due to the progressive buildup of calcite, and it is strongly advised that future studies include carbon isotope (δ13C) dynamics. Moreover, the formation of secondary calcite following the initial precipitation adds diversity to the range of minerals present in the groundwater system. Secondary calcite is widely distributed in fractures, veins, and cavities within granite and aquifer rocks, underscoring its importance across various geological formations. Where geothermal water mixes with meteoric water, fluorite is likely controlling levels of fluoride in groundwater, and further investigation is needed. In essence, the intricate interplay between precipitation, geochemical reactions, mineral dissolution, and carbonate mineral precipitation shapes the groundwater mineralisation processes in the Lake Malawi basin, highlighting the dynamic nature of hydrogeological systems in this region.

5.3. Implications for Water Resource Management

This study establishes a current baseline for understanding the isotope hydrology and hydrogeochemistry of groundwater in the Lake Malawi basin. This baseline is critical for monitoring future changes in the region’s water resources. This study’s findings are particularly relevant in water resource areas like WRA 4, WRA 5, WRA 6, WRA 8, and WRA 9 (Figure 1), where the Malawi Government aims to restore catchments and improve water security, agricultural productivity, and rural livelihoods. Insights gained from this research on groundwater recharge, evolution, and hydrogeochemical characteristics are valuable in shaping future policies in this domain as follows:
  • Understanding the origins and influences impacting groundwater recharge can guide the development and implementation of sustainable water resource management policies. These policies can focus on safeguarding and maintaining groundwater quality, especially in areas at risk of pollution or contamination, thereby underpinning efforts towards SDG 6 targets related to water and sanitation;
  • Utilising knowledge about different groundwater types and their unique characteristics can shape decisions related to land-use planning. Areas with sensitive groundwater recharge zones may necessitate stricter regulations to preserve water quality and promote responsible usage;
  • Policy initiatives should emphasise the importance of the ongoing monitoring of groundwater quality and quantity. Regulations could be implemented to govern land practices near recharge zones and protected groundwater areas based on identified hydrochemical features and isotopic markers;
  • Recognising the potential impact of evaporation on groundwater quality can spur the development of strategies to mitigate these effects. Policies targeting the reduction of evaporation-related factors, such as managing surface–water interactions or regulating land use activities, may be essential;
  • Given the intricate nature of groundwater recharge processes highlighted in this study, policies promoting collaboration among various stakeholders, including governmental bodies, researchers, and local communities, can be instrumental. This collaborative approach can facilitate a comprehensive strategy for groundwater management and conservation;
  • The nitrate concentration in the groundwater aligns with the recommended guidelines by the World Health Organisation for safe drinking water, as illustrated in Figure 5. Despite this compliance, there is a pressing necessity to develop a detailed model that specifically addresses groundwater contamination associated with nitrates, particularly in light of the upsurge in fertiliser use, pit latrines, and septic systems arising from the rapid population growth. By creating a more comprehensive and focused analysis of nitrate-related pollution, we can better understand and mitigate the potential risks posed by these sanitation systems to ensure the continued safety of our drinking water sources;
  • Future isotope hydrology studies should include δ15N−δ18O (NO3), δ13C (dissolved and mineral phases), and δ34S−δ18O (SO4) along with methods to study groundwater ages;
  • In essence, this study’s outcomes provide valuable insights to guide policymakers in crafting regulations and actions that support sustainable groundwater management, ensure water availability, and safeguard water resources for future generations.

Supplementary Materials

The following supporting information can be downloaded at: https://www.mdpi.com/article/10.3390/w16111587/s1, Table S1: Descriptive statistical summary of hydrochemical analysis results of groundwater samples from Lake Malawi Basin, Table S2: List of Malawi-Network of Isotopes in Precipitation (MNIP) stations in Lake Malawi Basin, Table S3: Descriptive statistical summary of stable isotopic signatures of precipitation from MNIP stations in Lake Malawi Basin, Table S4: Descriptive statistical summary of stable isotopic signatures of groundwater from Lake Malawi Basin. Table S5: Natural sources of ionic species in groundwater and corresponding geochemical reactions. Figure S1: Cross plot of ion weight ratios on cation exchange in groundwater, Figure S2: Plot of saturation indices for gypsum and halite minerals in groundwater, Figure S3: Relationship between stable isotopes signatures and elevation, Figure S4: Relationship between δ18O signatures and Elevation in Lake Malawi Basin.

Author Contributions

Conceptualisation, L.C.B. and R.M.K.; methodology, L.C.B.; validation, L.C.B.; formal analysis, L.C.B. and R.M.K.; investigation, L.C.B.; resources, L.C.B. and R.M.K.; data curation, L.C.B.; writing—original draft preparation, L.C.B.; writing—review and editing, L.C.B., R.M.K. and V.P., visualisation, L.C.B. and R.M.K.; supervision, R.M.K. and V.P.; project administration, L.C.B., R.M.K. and V.P.; funding acquisition, L.C.B., R.M.K. and V.P. All authors have read and agreed to the published version of the manuscript.

Funding

The authors are thankful for the financial support of the Scottish Government under the Climate Justice Fund Water Futures Program (research grant HN-CJF-03), awarded to the University of Strathclyde (Prof. R.M. Kalin PI). We also gratefully acknowledge the funding by the Commonwealth Scholarship Commission (CSC) awarded to Limbikani Chitsundi Banda, the principal researcher. Finally, we acknowledge the International Atomic Energy Agency (IAEA) research grant awarded to Limbikani Chitsundi Banda (Prof R.M. Kalin Technical Advisor) under the AFRA Regional Project grant (RAF7021).

Data Availability Statement

The research data provided in this study can be obtained upon reasonable request from the corresponding author.

Acknowledgments

We acknowledge the administrative support by the Malawi Government through the Ministry of Water and Sanitation and the Civil and Environmental Engineering Department of the University of Strathclyde.

Conflicts of Interest

The authors declare no conflicts of interest.

References

  1. United Nations General Assembly Resolution 64/292. The Human Right to Water and Sanitation, A/RES/64/292. Available online: http://daccess-ods.un.org/access.nsf/Get?Open&DS=A/RES/64/292&Lang=E (accessed on 5 February 2024).
  2. United Nations: The Sustainable Development Goals Report. 2021. Available online: https://unstats.un.org/sdgs/report/2021/ (accessed on 5 February 2024).
  3. United Nations Water. Groundwater Overview: Making the Invisible Visible. Int. Groundw. Resour. Assess. Cent. 2018, 1–60. [Google Scholar]
  4. Jasechko, S.; Seybold, H.; Perrone, D.; Fan, Y.; Shamsudduha, M.; Taylor, R.G.; Fallatah, O.; Kirchner, J.W. Rapid groundwater decline and some cases of recovery in aquifers globally. Nature 2024, 625, 715–721. [Google Scholar] [CrossRef] [PubMed]
  5. Chidya, R.C.G.; Matamula, S.; Nakoma, O. Evaluation of groundwater quality in rural-areas of northern Malawi: Case of Zombwe extension planning area in Mzimba. Phys. Chem. Earth 2016, 93, 55–62. [Google Scholar] [CrossRef]
  6. Kalin, R.M.; Mleta, P.; Addison, M.J.; Banda, L.C.; Butao, Z.; Nkhata, M.; Rivett, M.O.; Mlomba, P.; Phiri, O.; Mambulu, J. Hydrogeology and Groundwater Quality Atlas of Malawi, Bulletin; Ministry of Water and Sanitation, Government of Malawi: Lilongwe, Malawi, 2022; p. 151. ISBN 978-1-915509-00-0.
  7. Chavula, G.M.S. Malawi Country Report on the Water, Energy and Food (WEF) Nexus; A Malawi Country Report submitted to SADC as part of the SADC—EU Project on “Fostering Water, Energy and Food Security Nexus Dialogue and Multi-Sector Investment in the SADC Region”; Malawi Ministry of Forestry and Natural Resources: Lilongwe, Malawi, 2018.
  8. Kelly, L.; Bertram, D.; Kalin, R.; Ngongondo, C.; Sibande, H. A National Scale Assessment of Temporal Variations in Groundwater Discharge to Rivers: Malawi. Am. J. Water Sci. Eng. 2020, 6, 39–49. [Google Scholar] [CrossRef]
  9. Kelly, L.; Bertram, D.; Kalin, R.; Ngongondo, C. Characterization of Groundwater Discharge to Rivers in the Shire River Basin, Malawi. Am. J. Water Sci. Eng. 2019, 5, 127–138. [Google Scholar] [CrossRef]
  10. Monjerezi, M.; Vogt, R.D.; Aagaard, P.; Saka, J.D.K. Using δ87Sr/δ86Sr, δ18O and δ2H isotope data along with major chemistry composition to assess groundwater salinization in lower Shire River Valley, Malawi. Appl. Geochem. 2011, 26, 2201–2214. [Google Scholar] [CrossRef]
  11. Rivett, M.O.; Robinson, H.; Wild, L.; Melville, J.; McGrath, L.; Phiri, P.; Flink, J.; Wanangwa, G.; Mleta, P.; MacLeod, S.; et al. Arsenic occurrence in Malawi groundwater. J. Appl. Sci. Environ. Manag. 2018, 22, 1807–1816. [Google Scholar] [CrossRef]
  12. Addison, M.J.; Rivett, M.O.; Robinson, H.; Fraser, A.; Miller, A.M.; Phiri, P.; Mleta, P.; Kalin, R.M. Fluoride occurrence in the lower East African Rift System, Southern Malawi. Sci. Total. Environ. 2019, 712, 136260. [Google Scholar] [CrossRef] [PubMed]
  13. Smith-Carrington, A.K.; Chilton, P.J. Groundwater Resources of Malawi; Overseas Development Administration Institute of Geological Sciences: London, UK, 1983; Available online: http://resources.bgs.ac.uk/sadcreports/malawi1983smithcarringtonmalawigwresources.pdf (accessed on 8 December 2023).
  14. BGS. WaterAid. Groundwater Quality: Malawi. In British Geological Survey/WaterAid; Natural Environment Research Council: Swindon, UK, 2008. [Google Scholar]
  15. Chavula, G.M.S. Malawi. In Groundwater Availability and Use in Sub-Saharan Africa: A Review of Fifteen Countries; Pavelic, P., Giordano, M., Keraita, B., Ramesh, V., Rao, T., Eds.; International Water Management Institute: Colombo, Sri Lanka, 2012; Available online: http://www.iwmi.cgiar.org/Publications/Books/PDF/groundwater_availability_and_use_in_sub-saharan_africa_a_review_of_15_countries.pdf (accessed on 15 December 2023).
  16. Kalin, R.M.; Mwanamveka, J.; Coulson, A.B.; Robertson, D.J.C.; Clark, H.; Rathjen, J.; Rivett, M.O. Stranded Assets as a Key Concept to Guide Investment Strategies for Sustainable Development Goal 6. Water 2019, 11, 702. [Google Scholar] [CrossRef]
  17. Banda, L.C.; Rivett, M.O.; Kalin, R.M.; Zavison, A.S.K.; Phiri, P.; Chavula, G.; Kapachika, C.; Kamtukule, S.; Fraser, C.; Nhlema, M. Seasonally Variant Stable Isotope Baseline Characterisation of Malawi’s Shire River Basin to Support Integrated Water Resources Management. Water 2020, 12, 1410. [Google Scholar] [CrossRef]
  18. United Nations. The Sustainable Development Goals Report. 2017. Available online: https://www.unwater.org/publications/un-water-annual-report-2017 (accessed on 5 February 2024).
  19. UNDP. UN World Water Development Report. 2020. Available online: http://Unwater.org (accessed on 5 February 2024).
  20. Hinton, R.G.K.; Macleod, C.J.A.; Troldborg, M.; Wanangwa, G.; Kanjaye, M.; Mbalame, E.; Mleta, P.; Harawa, K.; Kumwenda, S.; Kalin, R.M. Factors Influencing the Awareness and Adoption of Borehole-Garden Permaculture in Malawi: Lessons for the Promotion of Sustainable Practices. Sustainability 2021, 13, 12196. [Google Scholar] [CrossRef]
  21. Rivett, M.O.; Halcrow, A.W.; Schmalfuss, J.; Stark, J.A.; Truslove, J.P.; Kumwenda, S.; Harawa, K.A.; Nhlema, M.; Songola, C.; Wanangwa, G.J.; et al. Local scale water-food nexus: Use of borehole-garden permaculture to realise the full potential of rural water supplies in Malawi. J. Environ. Manag. 2018, 209, 354–370. [Google Scholar] [CrossRef]
  22. Wassenaar, L.I.; Van Wilgenburg, S.L.; Larson, K.; Hobson, K.A. A groundwater isoscapes (δD, δ18O) for Mexico. J. Geochem. Explor. 2009, 102, 123–136. [Google Scholar] [CrossRef]
  23. Han, Z.; Shi, X.; Jia, K.; Sun, B.; Zhao, S.; Fu, C. Determining the Discharge and Recharge Relationships between Lake and Groundwater in Lake Hulun Using Hydrogen and Oxygen Isotopes and Chloride Ions. Water 2019, 11, 264. [Google Scholar] [CrossRef]
  24. Attandoh, N.; Yidana, S.M.; Abdul-Samed, A.; Sakyi, P.A.; Banoeng-Yakubo, B.; Nude, P.M. Conceptualization of the hydro-geological system of some sedimentary aquifers in Savelugu-Nanton and surrounding areas, Northern Ghana. Hydrol. Process. 2013, 27, 1664–1676. [Google Scholar] [CrossRef]
  25. Rivett, M.O.; Symon, S.; Jacobs, L.; Banda, L.C.; Wanangwa, G.J.; Robertson, D.J.C.; Hassan, I.; Miller, A.V.M.; Chavula, G.M.S.; Songola, C.E.; et al. Paleo-Geohydrology of Lake Chilwa, Malawi is the Source of Localised Groundwater Salinity and Rural Water Supply Challenges. Appl. Sci. 2020, 10, 6909. [Google Scholar] [CrossRef]
  26. Abdou Babaye, M.S.; Orban, P.; Ousmane, B.; Favreau, G.; Brouyère, S.; Dassargues, A. Characterization of recharge mechanisms in a pre-cambrian basement aquifer in semi-arid south-west Niger. Hydrogeol. J. 2019, 27, 475–491. [Google Scholar] [CrossRef]
  27. Cartwright, I.; Cendon, D.; Currell, M.; Meredith, K. A review of radioactive isotopes and other residence time tracers in Hydrogeology Journal understanding groundwater recharge: Possibilities, challenges, and limitations. J. Hydrol. 2017, 555, 797–811. [Google Scholar] [CrossRef]
  28. Balagizi, C.M.; Kasereka, M.M.; Cuoco, E.; Liotta, M. Influence of moisture source dynamics and weather patterns on stable isotopes ratios of precipitation in Central-Eastern Africa. Sci. Total. Environ. 2018, 628, 1058–1078. [Google Scholar] [CrossRef]
  29. Kalin, R.M. Basic concepts and formulations for isotope-geochemical process investigations, procedures, and methodologies of geochemical modelling of groundwater systems. In Manual on Mathematical Models in Isotope Hydrology; Yurtsever, Y., Ed.; IAEA: Vienna, Austria, 1995; Volume 910, p. 155. Available online: http://wwwnaweb.iaea.org/napc/ih/documents/TECDOCS/TECDOC%200910%20Mathematical%models%201996.PDF (accessed on 10 February 2023).
  30. Banda, L.C.; Rivett, M.O.; Kalin, R.M.; Zavison, A.S.; Phiri, P.; Kelly, L.; Chavula, G.; Kapachika, C.C.; Nkhata, M.; Kamtukule, S.; et al. Water-Isotope Capacity Building and Demonstration in a Developing World Context: Isotopic Baseline and Conceptualization of a Lake Malawi Catchment. Water 2019, 11, 2600. [Google Scholar] [CrossRef]
  31. Kalin, R.M.; Long, A. Application of hydrogeochemical modelling for validation of hydrologic flow modelling in the Tucson Basin Aquifer, Arizona, USA. In Mathematical Models and Their Applications to Isotope Studies in Groundwater Hydrology; IAEA: Vienna, Austria, 1994; pp. 209–254. [Google Scholar]
  32. International Atomic Energy Agency (IAEA). Isotope Hydrology and Integrated Water Resources Management, C&S Papers Series (CD-ROM) 23, IAEA, Vienna. 2004. Available online: https://www.iaea.org/publications/7184/isotope-hydrology-and-integrated-water-resources-management (accessed on 16 July 2023).
  33. Government of the Republic of Malawi, Ministry of Agriculture, Irrigation and Water Development. Project for National Water Resources Master Plan in the Republic of Malawi—Final Report; Volume II: Main Report; Ministry of Agriculture, Irrigation and Water Development: Lilongwe, Malawi, 2014; Available online: http://open_jicareport.jica.go.jp/pdf/12184537_01.pdf (accessed on 21 September 2023).
  34. GoM (NWRB). Environmental and Social Impact Assessment for Lunyangwa Dam Raising, Mzuzu: European Investment Bank. 2019. Available online: https://www.eib.org/en/registers/all/123952467 (accessed on 21 September 2023).
  35. Ebinger, C.J.; Crow, M.J.; Rosendahl, B.R.; Lefournier, J.; Livingstone, D.A. Structural evolution of Lake Malawi, Africa. Nature 1984, 308, 627–629. [Google Scholar] [CrossRef]
  36. GoM. Atlas for the hydrogeological and water quality Maps. In National Water Development Programme; Ministry of Agriculture, Irrigation and Water Development: Lilongwe, Malawi, 2015. [Google Scholar]
  37. Carter, G.S.; Bennett, J.D. The Geology and Mineral Resources of Malawi. Malawi Geol. Surv. Dep. Bull. 1973, 6, 1–62. [Google Scholar]
  38. Chorowicz, J. The East African rift system. J. Afr. Earth Sci. 2005, 43, 379–410. [Google Scholar] [CrossRef]
  39. Bath, A.H. Hydrochemistry in Groundwater Development: Report on an Advisory Visit to Malawi; Report WD/OS/80/20; British Geological Survey: London, UK, 1980. [Google Scholar]
  40. Chilton, P.J.; Smith-Carington, A.K. Characteristics of the Weathered Basement Aquifer in Malawi in Relation to Rural Water Supplies; IAHS Press: Wallingford, UK, 1984; pp. 57–65. [Google Scholar]
  41. Peel, M.C.; Finlayson, B.L.; McMahon, T.A. Updated world map of the Köppen-Geiger climate classification. Hydrol. Earth Syst. Sci. 2007, 11, 1633–1644. [Google Scholar] [CrossRef]
  42. Ngongondo, C.; Xu, C.-Y.; Gottschalk, L.; Alemaw, B. Evaluation of spatial and temporal characteristics of rainfall in Malawi: A case of data scarce region. Theor. Appl. Clim. 2011, 106, 79–93. [Google Scholar] [CrossRef]
  43. Nicholson, S.E.; Klotter, D.; Chavula, G. A detailed rainfall climatology for Malawi, Southern Africa. Int. J. Clim. 2013, 34, 315–325. [Google Scholar] [CrossRef]
  44. Sene, K.; Piper, B.; Wykeham, D.; McSweeney, R.T.; Tych, W.; Beven, K. Long-term variations in the net inflow record for Lake Malawi. Hydrol. Res. 2016, 48, 851–866. [Google Scholar] [CrossRef]
  45. Vincent, K.; Dougill, A.J.; Mkwambisi, D.D.; Cull, T.; Stringer, L.C.; Chanika, D. Analysis of Existing Weather and Climate In-formation for Malawi; Kulima Integrated Development Solutions: Pietermaritzburg, South Africa, 2014. [Google Scholar]
  46. Department of Climate Change and Meteorological Services. Available online: http://www.rvatlas.org (accessed on 20 September 2021).
  47. Coplen, T.B.; Wassenaar, L.I. LIMS for lasers 2015 for achieving long-term accuracy and precision of δ2H, δ17O, and δ18O of waters using laser absorption spectrometry: LIMS for lasers 2015. Rapid Commun. Mass Spectrom. 2015, 29, 2122–2130. [Google Scholar] [CrossRef] [PubMed]
  48. Dansgaard, W. Stable isotopes in precipitation. Tellus 1964, 16, 436–468. [Google Scholar] [CrossRef]
  49. IAEA (International Atomic Energy Agency). Laser Spectroscopic Analysis of Liquid Water Samples for Stable Hydrogen and Oxygen Isotopes; Training Course Series No. 35; International Atomic Energy Agency: Vienna, Austria, 2009; Available online: https://www.iaea.org/publications/8195/laser-spectroscopic-analysis-of-liquid-water-samples-for-stable-hydrogen-and-oxygen-isotopes (accessed on 10 February 2021).
  50. APHA (American Public Health Association). Standard Methods for the Examination of Water and Wastewater; American Public Health Association (APHA): Washington, DC, USA, 2005. [Google Scholar]
  51. Gibbs, R.J. Mechanisms Controlling World Water Chemistry. Science 1970, 170, 1088–1090. [Google Scholar] [CrossRef]
  52. Schoeller, H. Qualitative evaluation of groundwater resources. In Methods and Techniques of Groundwater Investigations and Development; UNESCO: Paris, France, 1965; pp. 54–83. [Google Scholar]
  53. Singh, C.K.; Kumar, A.; Shashtri, S.; Kumar, A.; Kumar, P.; Mallick, J. Multivariate statistical analysis and geochemical modeling for geochemical assessment of groundwater of Delhi, India. J. Geochem. Explor. 2017, 175, 59–71. [Google Scholar] [CrossRef]
  54. Srinivasamoorthy, K.; Chidambaram, M.; Prasanna, M.V.; Vasanthavigar, M.; John Peter, A.; Anandhan, P. Identification of major sources controlling groundwater chemistry from a hard rock terrain—A case study from Mettur taluk, Salem District, Tamil Nadu, India. J. Earth Syst. Sci. 2008, 117, 49–58. [Google Scholar] [CrossRef]
  55. Merkel, B.J.; Planer-Friedrich, B. Groundwater Geochemistry: A Practical Guide to Modelling of Natural and Contaminated Aquatic Systems, 2nd ed.; Springer: Berlin/Heidelberg, Germany, 2008. [Google Scholar]
  56. Parkhurst, D.L.; Appelo, C.A.J. Description of Input and Examples for PHREEQC Version 3—A Computer Program for Speciation, Batch-Reaction, One-Dimensional Transport, and Inverse Geochemical Calculations; 2328-7055; U.S. Geological Survey: Reston, VA, USA, 2013. [Google Scholar]
  57. World Health Organization. Guidelines for Drinking-Water Quality: Fourth Edition Incorporating First Addendum; World Health Organization: Geneva, Switzerland, 2017; ISBN 978-92-4-154995-0. [Google Scholar]
  58. Piper, A.M. A graphical procedure in the geochemical interpretation of water analysis. Eos Trans. Am. Geophys. Union 1944, 25, 914–928. [Google Scholar]
  59. Monjerezi, M.; Vogt, R.D.; Aagaard, P.; Saka, J.D. The hydro-geochemistry of groundwater resources in an area with prevailing saline groundwater, lower Shire Valley, Malawi. J. Afr. Earth Sci. 2012, 68, 67–81. [Google Scholar] [CrossRef]
  60. Addison, M.J.; Rivett, M.O.; Phiri, P.; Mleta, P.; Mbalame, E.; Banda, M.; Phiri, O.; Lakudzala, W.; Kalin, R.M. Identifying Groundwater Fluoride Source in a Weathered Basement Aquifer in Central Malawi: Human Health and Policy Implications. Appl. Sci. 2020, 10, 5006. [Google Scholar] [CrossRef]
  61. Vystavna, Y.; Harjung, A.; Monteiro, L.R.; Matiatos, I.; Wassenaar, L. Stable isotopes in global lakes integrate catchment and climatic controls on evaporation. Nat. Commun. 2021, 12, 7224. [Google Scholar] [CrossRef]
  62. Tuinenburg, O.A.; Theeuwen, J.J.E.; Staal, A. High-resolution global atmospheric moisture connections from evaporation to precipitation. Earth Syst. Sci. Data 2020, 12, 3177–3188. [Google Scholar] [CrossRef]
  63. Terzer-Wassmuth, S.; Araguás-Araguás, L.J.; Wassenaar, L.I.; Stumpp, C. Global and local meteoric water lines for δ17O/δ18O and the spatiotemporal distribution of Δ′17O in Earth’s precipitation. Sci. Rep. 2023, 13, 19056. [Google Scholar] [CrossRef]
Figure 1. Study area showing (a) study area location in Malawi and its transboundary extent (Malawi, Mozambique, Zambia, and Tanzania), and (b) study area extent with water resource areas (WRAs) (c) Malawi location in Africa.
Water 16 01587 g001
Figure 2. Study area showing (a) topography (SRTM elevation data: USGS) and main drainage sys– tems and (b) physiographic zones and water reservoirs.
Water 16 01587 g002
Figure 3. Idealised cross-section hydrostratographic units (aquifers) in the Lake Malawi basin (after [6]).
Water 16 01587 g003
Figure 4. Observed hydrochemical interquartile plot for groundwater in Lake Malawi basin: It shows the distribution of electrical conductivity (EC) (µS/cm), total dissolved solids (TDS) (mg/L), total alkalinity (TA) as CaCO3 (mg/L), total hardness (TH) as CaCO3 (mg/L), and major ions (mg/L) in groundwater.
Water 16 01587 g004
Figure 5. Spatial distribution of nitrate concentrations in groundwater across the LMB. (a) shows general distribution of measurable nitrate and (b) shows measurable nitrate concentration projecting potential impact.
Water 16 01587 g005
Figure 6. Piper plot for groundwater samples: Various colours show hydrochemical facies based on electrical conductivity (EC), a proxy indicator of total dissolved salts (TDS).
Water 16 01587 g006
Figure 7. Spatial distribution of (a) TDS and (b) water types in groundwater across LMB.
Water 16 01587 g007
Figure 8. Gibbs diagram showing key mechanisms controlling groundwater chemistry.
Water 16 01587 g008
Figure 9. Relationship between major ion concentrations of groundwater samples, (a) Ca2+ vs. HCO3, and (b) Ca2+ vs. Mg2+.
Water 16 01587 g009
Figure 10. Saturation indices (SI) for (a) calcite, (b) dolomitic carbonate, and (c) fluorite from groundwater samples in the Lake Malawi basin.
Water 16 01587 g010aWater 16 01587 g010b
Figure 11. (a) Plot of δ2H–δ18O signatures for precipitation samples from MNIP stations and lake sites in the Lake Malawi basin. A blue line (slope of 8; d-parameter of +13.3‰) represents the distribution of the d-parameter for local precipitation, a proxy for an isotopic offset of local air mass from the global air mass represented by the Global Meteoric Water Line (GMWL). The red line represents the lake evaporation line (LEL). (b) Histogram providing the distribution of d-parameter for precipitation and lake water samples.
Water 16 01587 g011
Figure 12. (a) Plot of δ2H–δ18O signatures for groundwater and lake samples in Lake Malawi basin. (b) Histogram showing the distribution of the d-parameter for groundwater and lake water samples. (c) Plot of δ2H–δ18O signatures for groundwater samples and associated controlling process influencing isotopic signatures in Lake Malawi basin.
Water 16 01587 g012
Figure 13. Spatial distribution of groundwater (a) δ18O and (b) δ2H signatures in the Lake Malawi Basin.
Water 16 01587 g013
Figure 14. Box plot of groundwater δ2H–δ18O signatures and d-parameter for wet and dry seasons in the Lake Malawi Basin.
Water 16 01587 g014
Figure 15. Plot of δ2H and δ18O signatures for groundwater samples based on groundwater types and electrical conductivity in Lake Malawi Basin. The mixed water type group comprises Ca-Mg-SO4-Cl and Na-HCO3-Cl.
Water 16 01587 g015
Table 1. Natural sources of ionic species in groundwater present in Lake Malawi basin aquifers.
Mineral/Ion Species SourceChemical FormulasIonic SpeciesReaction Type
Carbon Dioxide (CO2)CO2 (+H2O)H+, HCO3Congruent
Plagioclase (Na,Ca)(Al,Si)4O8Ca2+, Na+Incongruent
Anorthite CaAl2Si2O8Ca2+, HCO3Incongruent
BiotiteK(Mg,Fe)3(AlSi3O10)(F,OH)2K+, Mg2+, FIncongruent
CalciteCaCO3Ca2+, CO3, HCO3Congruent
AlbiteNaAlSi3O8Na+Incongruent
MuscoviteKAl2(AlSi3O10)(F,OH)2K+, FIncongruent
OlivineMg2SiO4Mg2+Incongruent
Amphiboles Ca2(MgFeAl)5(AlSi)8O22Mg2+, Ca2+Incongruent
FluorapatiteCa5(PO4)3FCa2+, F, PO4Incongruent
Fluorite
Pyrite
CaF2
FeS2
Ca2+, F
SO42−
Congruent
Incongruent
Disclaimer/Publisher’s Note: The statements, opinions and data contained in all publications are solely those of the individual author(s) and contributor(s) and not of MDPI and/or the editor(s). MDPI and/or the editor(s) disclaim responsibility for any injury to people or property resulting from any ideas, methods, instructions or products referred to in the content.