Abstract
The treatment of reject water containing concentrated ammonia and non-biodegradable organics is a challenging task in wastewater treatment plants. To address this problem, we propose a novel process consisting of a selective ammonium-exchange resin and an ammonia electrooxidation reaction (AmER-AOR). Because an alkaline condition is essential for direct ammonia oxidation, the use of a bipolar membrane (BPM) was helpful. Nonetheless, an initial pH of 13 and KOH addition were required to maintain a high alkalinity for the complete elimination of ammonia. The linear sweep voltammogram elucidated the high pH requirement and ammonia oxidation promotion. When the current density varied from 30 to 80 mA cm−2, 60 mA cm−2 showed the highest current efficiency (30.39%) and the lowest specific energy demand (95.3 kWh/kg-N), indicating the most energy-effective condition. Increasing the initial concentration of ammonia from 0.1 M to 0.5 M improved the current efficiency (51.57%), demonstrating an additional energy-effective strategy for the AmER-AOR. The energy efficiency of pure H2 production in the cathodic chamber was 30%. To estimate the viability for practical applications, reject water collected from a local wastewater treatment plant was applied in the AmER-AOR. Notably, no significant difference in the ammonia removal rate was observed with synthetic wastewater. To the best of our knowledge, this is the first study that employs a BPM as a separator and OH− supplier for direct ammonia oxidation. Our findings reveal that the AmER-AOR with a BPM has promising practical applicability in the treatment of reject water and energy production.
1. Introduction
Ammonia is a primary nutrient that plays a vital role in various fields, including industry, agriculture, chemical engineering, energy, and environmental engineering [1]. However, it is also a primary contaminant in the water and atmosphere, contributing to eutrophication [1], secondary particulate matter [2], odor [3], and climate change [4]. In particular, the discharge of ammonia nitrogen (NH3-N), including free ammonia (NH3) and ammonium ions (NH4+), into the environment is strictly limited across the majority of nations to prevent eutrophication. Nonetheless, a substantial amount of NH3-N is generated from anthropogenic sources, such as the fertilizer industry, agricultural. Human living activity, reject water contains a high level of NH3-N (>0.5 g-N L−1). Reject water includes thickened liquid, digested supernatant liquor, dewatered filtrate, and other wastewater produced in the sludge treatment process, which is subordinate wastewater generated from the domestic wastewater treatment process. Reject water is generally treated by mixing it with raw municipal wastewater rather than employing a separate treatment process, owing to economic costs [5]. However, the handling of reject water is difficult because of its chemical properties, low biodegradability, high nitrogen concentration, and low organic content [6]. Owing to these characteristics, conventional nitrogen treatment processes (biological nitrification/denitrification) are unsuitable. Moreover, although reject water comprises approximately 1–3% of the incoming domestic wastewater, nitrogen loading to the wastewater treatment plants is substantial [7].
To address the problem of the treatment of reject water, various alternative processes have been developed and applied in municipal wastewater treatment plants. Anaerobic ammonium oxidation (anammox) is a biological treatment process that has attracted the attention of numerous researchers. Anammox microorganisms convert ammonium and nitrite to nitrogen gas under anaerobic conditions, which reduce aeration costs (<50% compared to that of the conventional denitrification method). In addition, an organic electron donor is unnecessary, demonstrating that a decrease in chemical costs and total nitrogen removal in wastewater is achievable. Owing to these advantages, anammox is recognized as the most promising technology [6]. However, anammox is accompanied by slow-growing microorganisms and is highly sensitive to temperature. Therefore, it has been primarily investigated for the treatment of concentrated side streams [8]. Physical and chemical approaches, including air stripping, struvite precipitation, and photocatalytic oxidation, might be alternatives. However, they require a high NH3-N concentration (>2 g-N/L) for adequate operation and require complicated maintenance. Moreover, the use of chemicals induces an additional water contaminant due to residual ions: NO3−, SO42−, and Cl− [9].
The adsorption technique is a promising technology because of its advantages, such as easy operation and maintenance, low energy demand, and robust removal efficacy. These advantages render the adsorption process commercially viable for various wastewater treatment plants. Nonetheless, the adsorption technique has a great challenge in finding suitable adsorbent materials [1]. Moreover, the adsorbents preferred for NH3-N removal, such as bentonite, biochar, and activated carbon, cannot recover NH3-N, a valuable substance. Therefore, recent research has been devoted to developing adsorbents that exhibit selectivity to NH3-N alongside a superb recovery ability [10]. In order to better the applications for NH3-N removal, we have synthesized a nanostructure-based, selective ammonium-exchange resin (AmER) that exhibits considerable performance in terms of both high selectivity for NH4+ and the adsorption capacity [11]. In addition to its outstanding efficacy, the adsorbent synthesis was facile. However, wastewater containing high NH3-N concentrations (>0.1 M NH3-N) was inevitably generated during the regeneration of the adsorbent. In this context, post-treatment of wastewater is required to regenerate the adsorbent for repeated adsorbent utilization.
Ammonia electrooxidation reaction (AOR) is an emerging technology in wastewater treatment. The versatility, environmental compatibility, and effectiveness of ammonia oxidation render it highly attractive. The implementation of direct electrooxidation in wastewater treatment has focused on improving in efficacy, including the removal rate, energy effectiveness, and conversion to desirable products [12,13,14,15]. In recent decades, various approaches for hydrogen gas (H2) recovery from NH3-N in wastewater have been confirmed following a surge in interest in climate change, carbon neutrality, and H2 energy. A divided cell with a conductive membrane was used to obtain pure H2 at a cathode. Diaz and Botte applied electrooxidation to remediate NH3-N in swine wastewater using a divided cell with a Teflon membrane [16]. They demonstrated effective NH3-N removal with low energy consumption and H2 production. However, they used artificial wastewater prepared from ultrapure water and chemicals instead of actual wastewater. For the deammonification of leachate by electrooxidation, Kuang et al. applied a bipolar membrane (BPM) with a Ti/PbO2 anode, which showed outstanding performance in NH3-N removal even under acidic conditions [17]. However, they conducted indirect electrooxidation, which generated residual reactive chlorine species (RCS), such as Cl2, OCl−, and HOCl. RCS potentially induce the deactivation of the membrane and electrode due to its strong reactivity. RCS attack the weak points of the membrane and causes injury [18,19]. Therefore, mediated electrooxidation in membrane-integrated cells is inappropriate for long-term operations.
In this study, we investigated the direct electrooxidation as a post-treatment process for NH3-N-enriched wastewater generated from the adsorbent. For a stable AmER-AOR operation, a KNO3 solution was selected as the regeneration medium for the adsorbent to prevent the production of RCS that may strike the membrane, electrode, and the adsorbent. The direct oxidation of NH3-N on the electrode surface is preferentially favored in an electrolytic cell utilizing an electrolyte containing NO3− ions due to it having the highest oxidation state [20]. In addition, the selective conversion of ammonia into nitrogen gas or nitrite/nitrate is another concern for complete nitrogen removal in wastewater treatment. However, the selectivity is insignificant in the AmER-AOR system, because the desorbing agent (the KNO3 solution), as a resource for ammonia-enriched wastewater, already has a high concentration of nitrate ions. Therefore, the AmER-AOR does not require meticulous operation owing to the formation of a given product. This renders the AmER-AOR achievable in an actual implementation.
Direct electrooxidation requires alkaline conditions, because the lone pair of ammonia (:NH3) is more easily adsorbed on the anode surface and subsequently oxidized compared to the ammonium ion (NH4+) [21]. During direct electrooxidation in an alkaline solution, the deprotonation of ammonia consumes the adsorbed OH− to produce water. Therefore, an alkaline pH of the anolyte should be maintained to remove ammonia. Consequently, we employed a BPM as a separator; water dissociation () in the BPM continuously provides OH− to the anolyte under a reverse bias condition [17]. To the best of our knowledge, the application of a BPM for the direct electrooxidation of NH3-N has not been reported. Apart from the separation membrane, the anode is a crucial material in the electrolytic cell to remove ammonia through electrooxidation. Platinum is well known as an identical electrocatalyst due to its relatively fast oxidation rate and selectivity toward the formation of N2 [22].
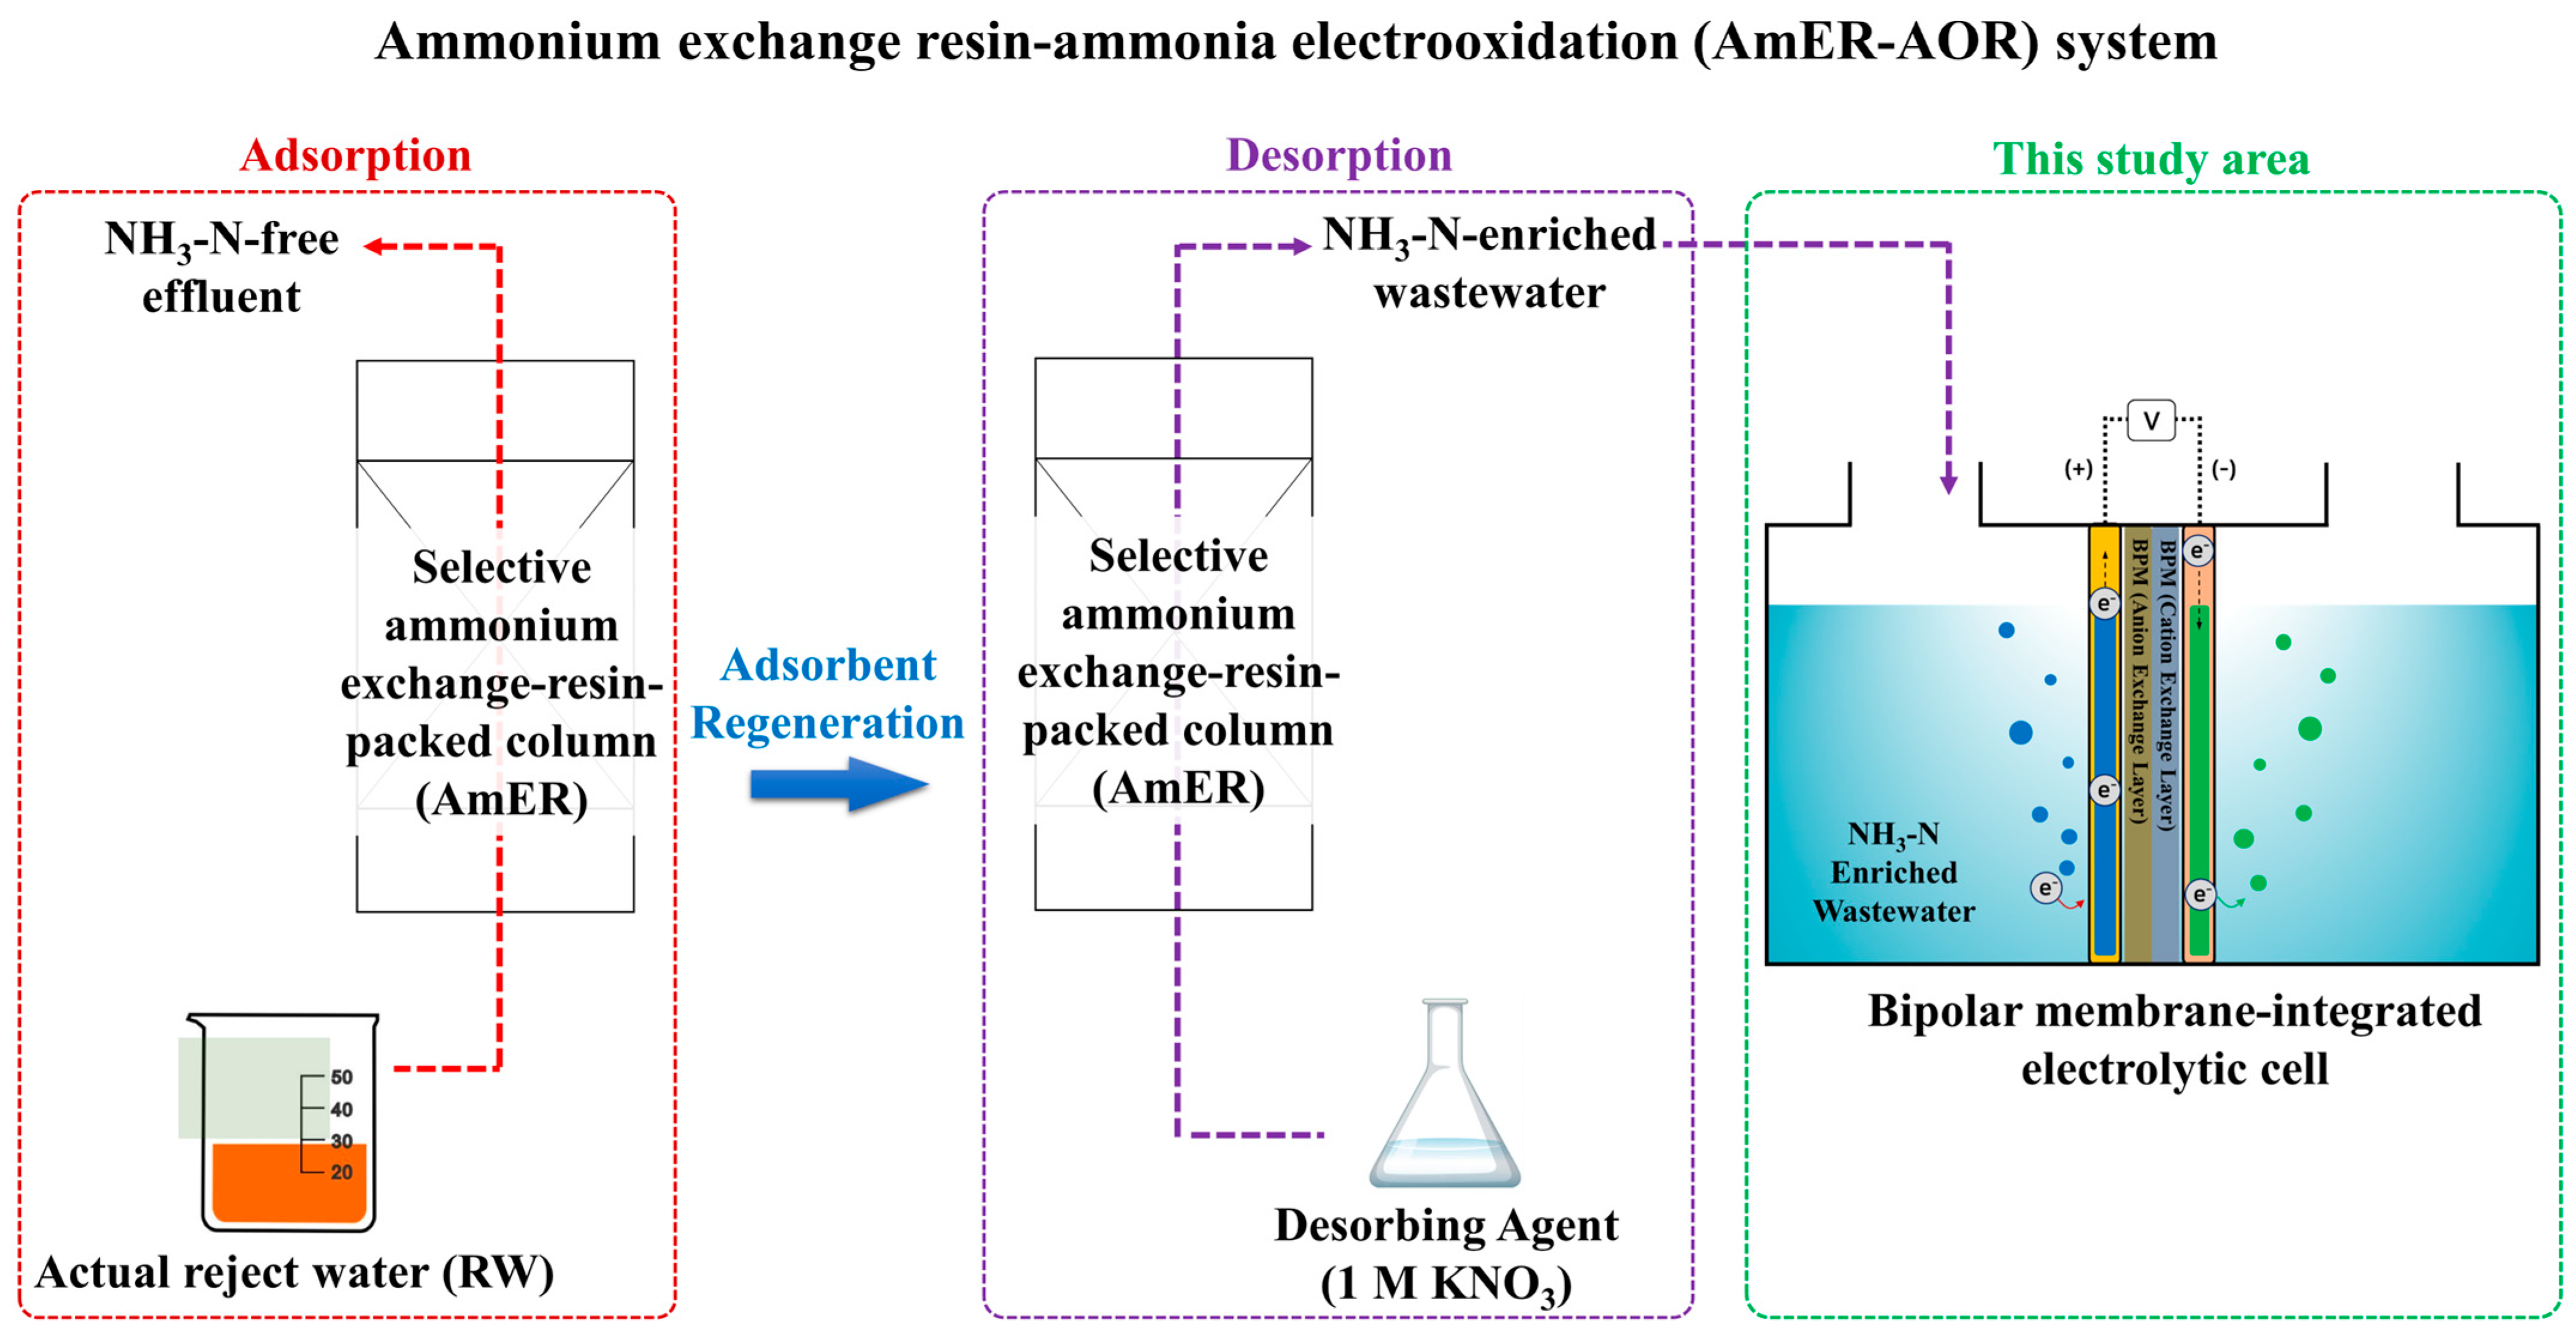
An essential objective of this study was to establish a direct electrooxidation process for the post-treatment of NH3-N-enriched wastewater produced from the adsorbent using commercially available materials such as a BPM and Ti/Pt electrode. Ultimately, an entire system for reject water remediation consisting of an AmER and AOR was developed (AmER-AOR) (Figure 1). To achieve this goal, (ⅰ) the optimal pH conditions of the anolyte, as the most crucial operational factor, were investigated using synthetic wastewater. (ⅱ) A series of experiments were conducted under different current densities and initial NH3-N concentrations to determine the energy-effective operational factor in terms of the current efficiency (CE) and specific energy demand (SED). (ⅲ) The applicability of the AmER-AOR in a practical implementation was estimated using actual reject water. (ⅳ) Finally, the advantages and disadvantages of this study and further refinements, including energy recovery via H2 production and improved energy effectiveness, were discussed.

Figure 1.
A schematic diagram of the AmER-AOR system.
2. Materials and Methods
2.1. Electrolytic Cell Configuration
The electrochemical treatment of NH3-N-enriched wastewater was conducted in a batch mode. A Plexiglas cell consisting of two chambers with a working volume of 150 mL in each reactor (internal dimensions: 50 × 50 × 60 mm) was manufactured. The working volume in both the anodic and cathodic chambers was 140 mL. The chambers were divided using a BPM purchased from Astom Co. (Astom Corporation, Shunan, Japan). A Pt-coated Ti mesh (DE NORA PERMELEC Ltd., Fujisawa, Japan) was used as the anode and cathode. The electrodes were fixed in each chamber near the membrane using a silicon gasket with a thickness of 5 mm. The geometric working area of the electrode was 15 cm2. The detailed cell configuration is illustrated in Figure S1a. Teflon gasbags were connected at the top of each cell to prevent pressure arising from electrochemically generated gases, such as nitrogen and oxygen in the anodic chamber and H2 in the cathodic chamber. The electrolysis experiments were performed at room temperature (25 ± 1 °C). No chiller was employed, because the change in temperature was negligible based on the preliminary test. The anolyte and catholyte were vigorously agitated using a magnetic stirrer at the bottom of the reactors. The electrolytic cell was operated in a galvanostatic mode within a range of 30–80 mA cm−2 using a potentiostat (ZIVE SP1, WonaTech, Seoul, Republic of Korea).
2.2. Wastewater Preparation
Ammonium nitrate (NH4NO3, 99%), potassium nitrate (KNO3, 99%), and potassium hydroxide (KOH, 93%) were purchased from DAEJUNG CHEMICALS & METALS Co., Ltd. (Siheung, Republic of Korea). All reagents were used without further purification. Deionized water (DI) was produced using a water purification system (EXL7 Pure, VIVAGEN, Sungnam, Republic of Korea). To utilize as a surrogate for reject water, synthetic wastewater was prepared following the procedure described in Text S1. As representative reject water, the dewatering filtrate of anaerobic digestion sludge was collected from a local municipal wastewater treatment plant in Goyang-si, Korea. Reject water was used after particle separation to prevent a blockage during adsorption onto the AmER column. The details of the particle separation method are presented in Text S2. However, notably, no significant changes in the chemical properties were observed before and after particle separation despite the use of a flocculating agent for particle separation, as listed in Table S1. NH3-N-enriched wastewater using reject water was prepared according to the procedure described in Text S3. The catholyte was prepared by dissolving 1 M KOH in DI.
2.3. Analytical Method
The anolyte used for the analysis was collected from a sampling spot located at the bottom of the reactor. The total amount of the liquid sample was less than 10 vol.% of the working volume in all experiments. The concentration of NH3-N was quantified using a Nessler reagent with an ultraviolet–visible spectrophotometer at 420 nm (DR5000, Hach, Ames, LA, USA). The pH was measured using a portable instrument (SG98, METTLER TOLEDO, Columbus, OH, USA). The ions in wastewater were analyzed using ion chromatography (Dionex Aquion, Thermo Fisher Scientific, Waltham, MA, USA).
2.4. Electrochemical Characterization
Linear sweep voltammetry (LSV) analysis for direct electrooxidation was carried out in the stagnant electrolyte using a potentiostat (ZIVE SP1, WonaTech, Seoul, Republic of Korea). The working electrode was a Pt-coated Ti plate with dimensions of 20 × 20 mm, corresponding to a geometrical area of 400 mm2. A Pt-coated Ti mesh with dimensions of 50 × 50 mm (geometric surface area of 2500 mm2) was used as the counter electrode. The gap between the working and counter electrodes was 5 mm. An Ag/AgCl (saturated KCl) reference electrode (WizMAC Co., Ltd., Daejeon, Republic of Korea) was used in the three-electrode system. The pH of the electrolyte was adjusted by dosing 8 M KOH solution.
2.5. Theoretical Calculations
The CE was calculated using Equation (1) as follows:
where n is the number of exchanged electrons, which is three for the oxidation of the NH3-N forward nitrogen atom. F is the Faraday constant (96,487 C mole−1), VL is the working volume (L), C0 is the initial NH3-N concentration (g-N L−1), Ct is the final NH3-N concentration (g-N L−1), M is the molecular weight of NH3-N (g mole−1), I is the applied current (A), and t is the electrolysis time (s). The electrical energy, which is needed to oxidize a unit weight of NH3-N, was estimated using Equation (2):
where E is the average applied cell voltage (V), while I, C0, Ct, and VL are the same as those in Equation (1).
The energy efficiency (EE) was calculated from Equation (3):
where HHV is the higher heating value (HHV) of H2 (kWh kg−1), CEHER is the CE of the hydrogen evolution reaction (HER), 2 is the electron exchange for the HER, and F is the Faraday constant.
3. Results and Discussion
3.1. Role of the BPM
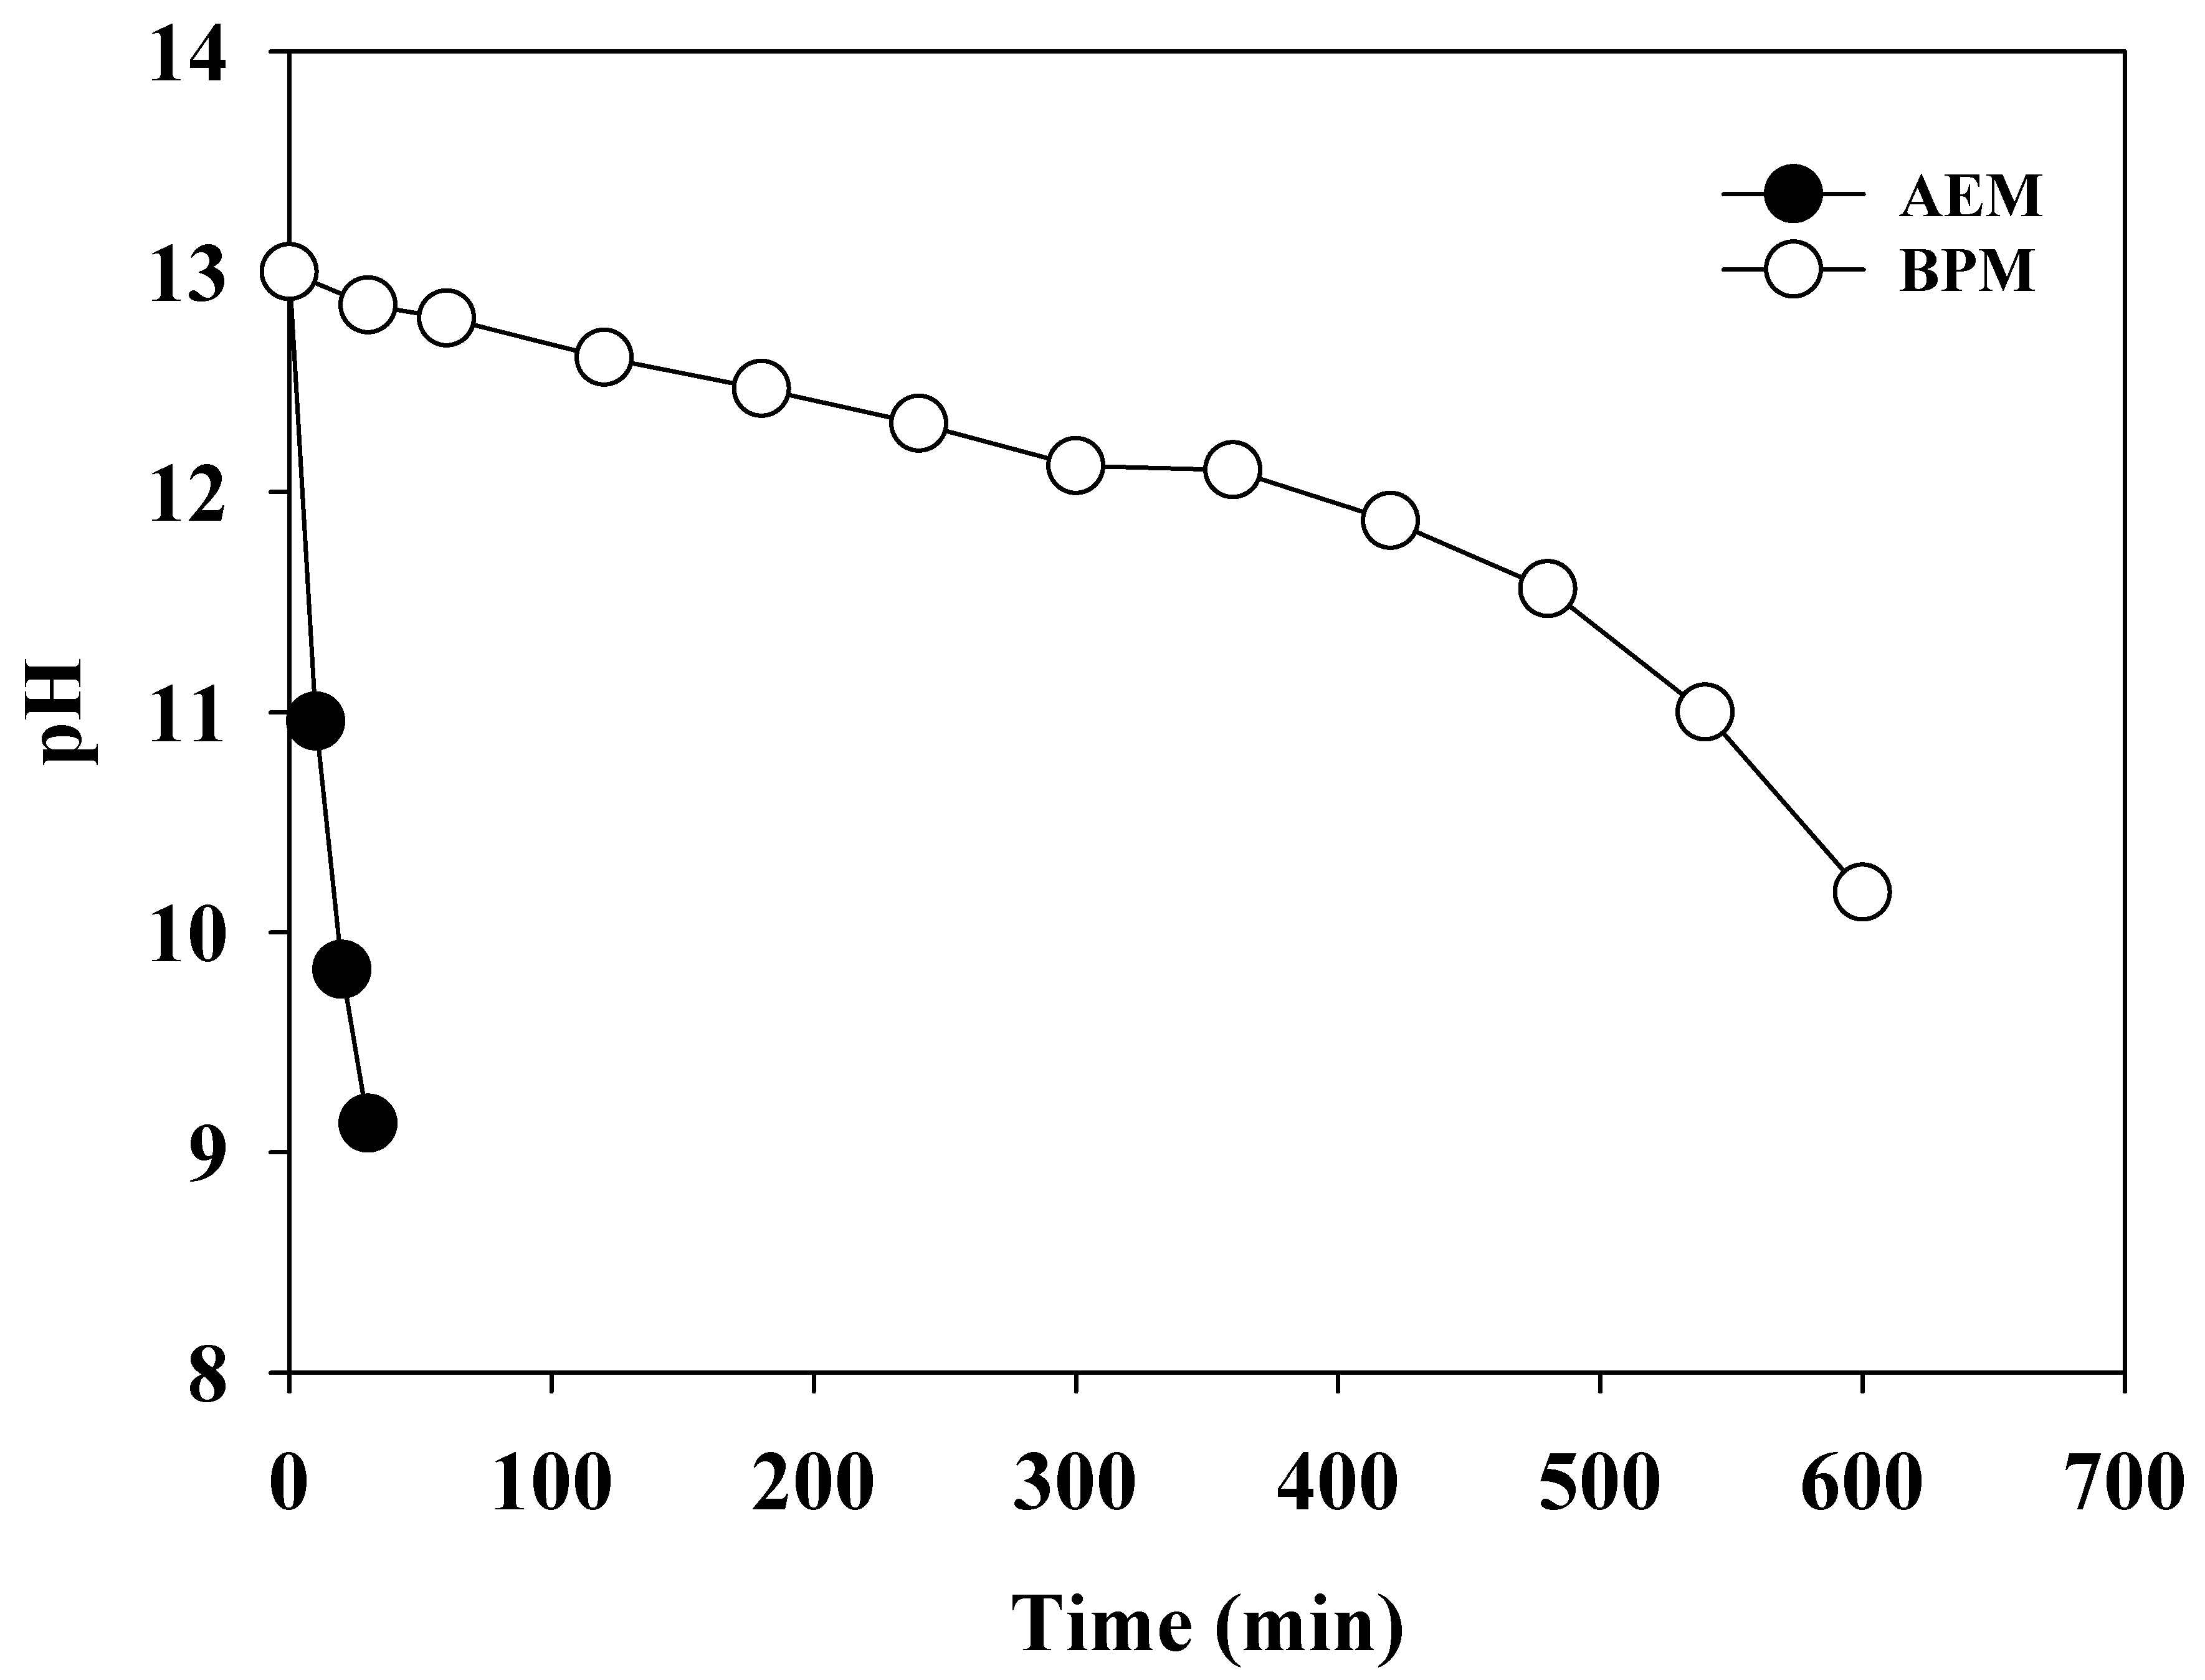
The BPM consists of a cation exchange layer (CEL) and an anion exchange layer (AEL). When a reverse bias is applied, the water dissociation accelerates at the interface wherein the direct contact between the CEL and AEL occurs. The produced OH− and H+ migrate from the corresponding layers in opposite directions (Figure S1b). Therefore, the alkalinity of the anolyte can be maintained for an extended period. To confirm the role of the BPM, the changes in the pH were monitored depending on the type of separator (BPM or anion exchange membrane (AEM, fumasep® FAS-50, fumatech, Bissingen, Germany)) under a current density of 30 mA cm−2 (Figure 2). When the AEM was used as a separator, the initial pH (pH0) of 13.0 rapidly dropped as soon as electrolysis was initiated, and pH 9 (weak alkaline) was reached within 30 min. In contrast, the BPM enabled the pH to be maintained at above 12.0, indicating strong alkaline conditions until the experiment had elapsed for 360 min. This significant distinction was attributed to the different mechanisms of the OH− supply between the BPM and AEM. The OH− from water dissociation in the BPM migrates into the anolyte, while OH− in the catholyte diffuses to the anolyte due to a charge balance when the AEM is used as a separator. In general, migration is more rapid than diffusion. Therefore, the BPM was superior in creating an alkaline environment in the anolyte.

Figure 2.
The changes in the pH of the anolyte (0.1 M NH4NO3 + 0.9 M KNO3) using the anion exchange membrane and bipolar membrane. Catholyte (1.0 M KOH) (j = 30 mA cm−2).
NH3-N can be present in the catholyte due to electrochemical generation by the reduction of NO3− ions transferred from the anolyte or due to the crossover of NH3-N. Crossover of NH3 from the anolyte to the catholyte causes the contamination of H2, because aqueous NH3 can be stripped into the gaseous phase during hydrogen evolution [23]. However, the amount of NH3-N in the catholyte was negligible compared to that of NH3-N in the anolyte when the BPM was used as a separator; the concentration of NH3-N in the catholyte was less than 20 mg-N L−1 at the end of all experiments. Therefore, the crossover of NH3-N from the anolyte to the catholyte can be disregarded because of the bilayer structure of the BPM, which is an additional advantage of the BPM in the AmER-AOR system.
3.2. pH Condition
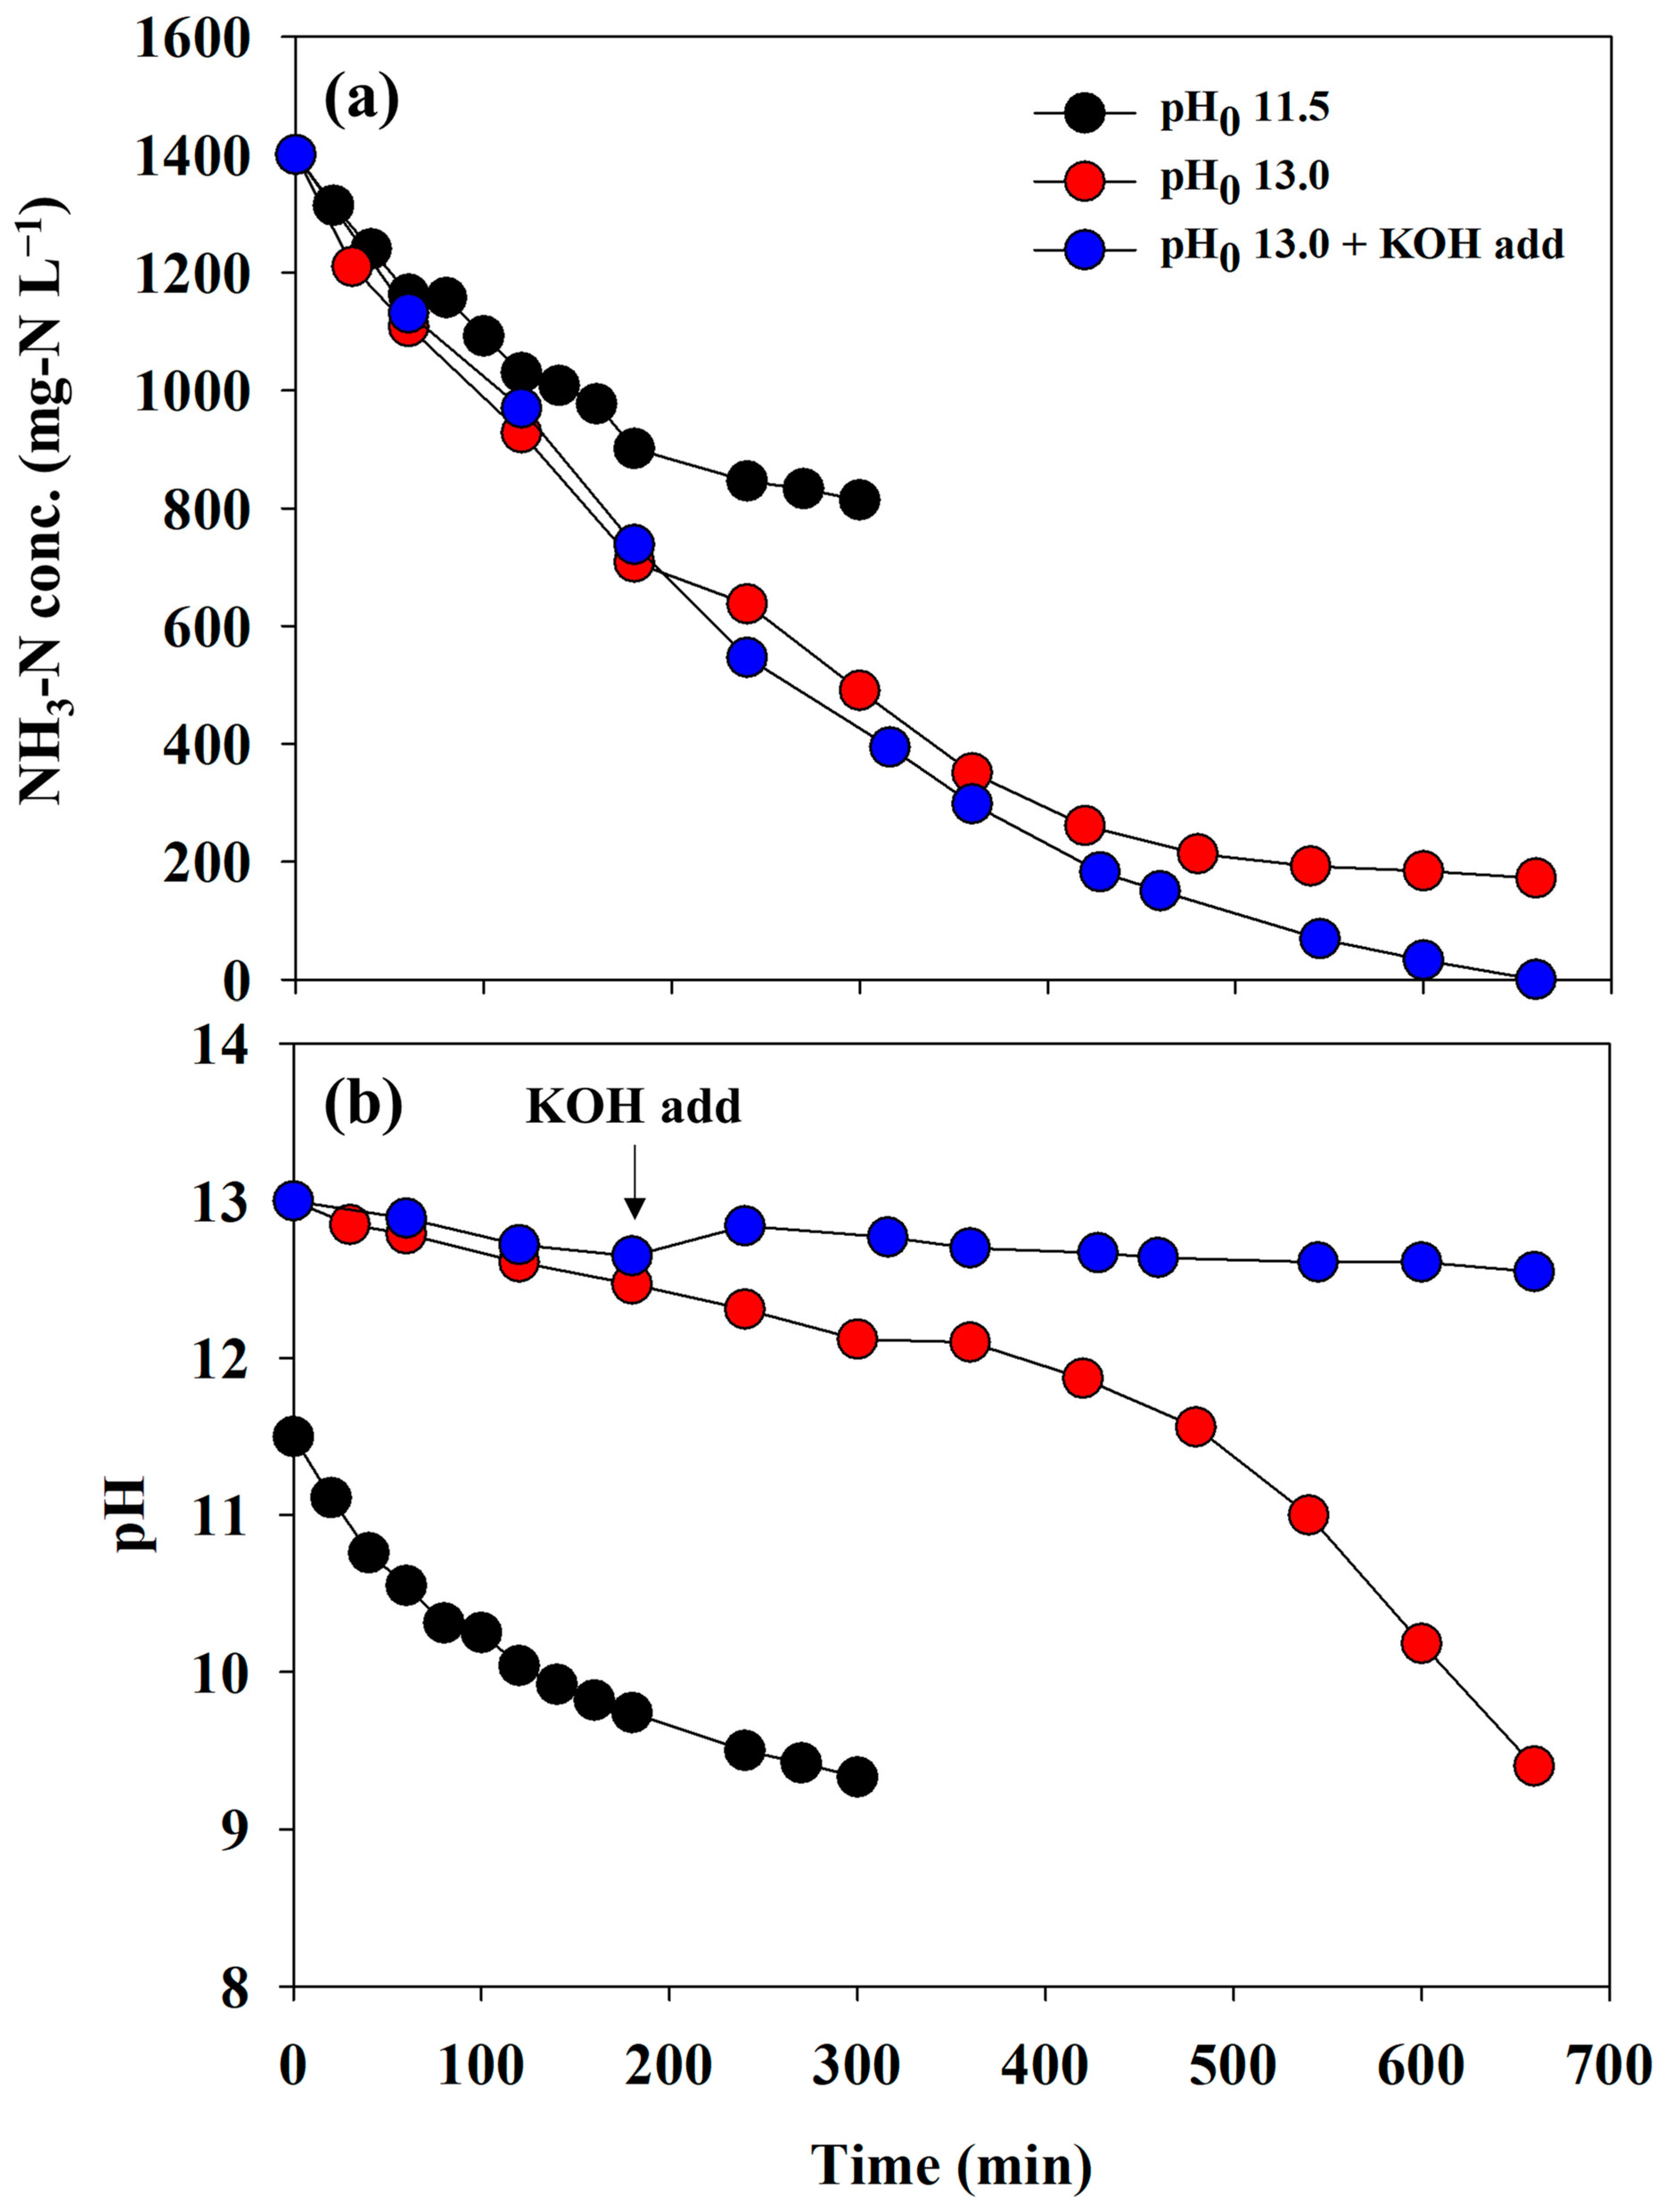
To determine the appropriate operational conditions for direct electrooxidation, a series of experiments were conducted in a batch mode. Although the adsorbent has a high adsorption selectivity for ammonium ions, various ions and organics can be adsorbed and released into a desorbing agent. In this regard, synthetic wastewater was applied to electro-oxidation to minimize unexpected competitive reactions due to impurities prior to the experiment using reject water. Figure 3a depicts the changes in the concentration of NH3-N under the different initial pH conditions of the anolyte. At a pH0 11.5 condition, approximately 850 mg-N L−1 remained in the reactor after 300 min, and no significant NH3-N removal was observed thereafter. In contrast, less than 200 mg-N L−1 was detected at a pH0 13.0 condition (red circle) after 660 min. This indicated that a higher initial alkalinity led to a higher NH3-N removal rate. However, the NH3-N concentration did not decrease further when the pH of the anolyte reached approximately 9.0, regardless of pH0 (Figure 3a,b). When using the AEM as a separator, the direct electrooxidation scarcely occurred despite a pH0 of 13.0 due to rapidly reaching pH 9.0 (Figure S2). As listed in Table S2, the NH3-N removal rate fitted with pseudo-first-order decay constants presented similar values within the initial 120 min, whereas the values for all the experiments showed significant differences.

Figure 3.
The changes in the (a) concentration of NH3-N and (b) pH depending on the initial pH conditions (the separator = BPM, the anolyte = 0.1 M NH4NO3 + 0.9 M KNO3, and the catholyte = 1 M KOH).
Considering that the primary purpose of electrolysis was the regeneration of the desorbing agent, the removal of NH3-N to 0 mg-N L−1 was necessary. To overcome the incomplete removal, a KOH tablet (0.2 ± 0.05 g) was added at 240 min to maintain strong alkaline conditions. Consequently, the complete elimination of NH3-N was achieved, and the final pH was 12.5 (blue circles in Figure 3). Therefore, a pH0 of 13 and the addition of KOH are recommended for electrooxidation in this study. This result agrees well with those of previous studies on the direct electrooxidation mechanism and removal experiments that require strong alkaline conditions [24,25,26].
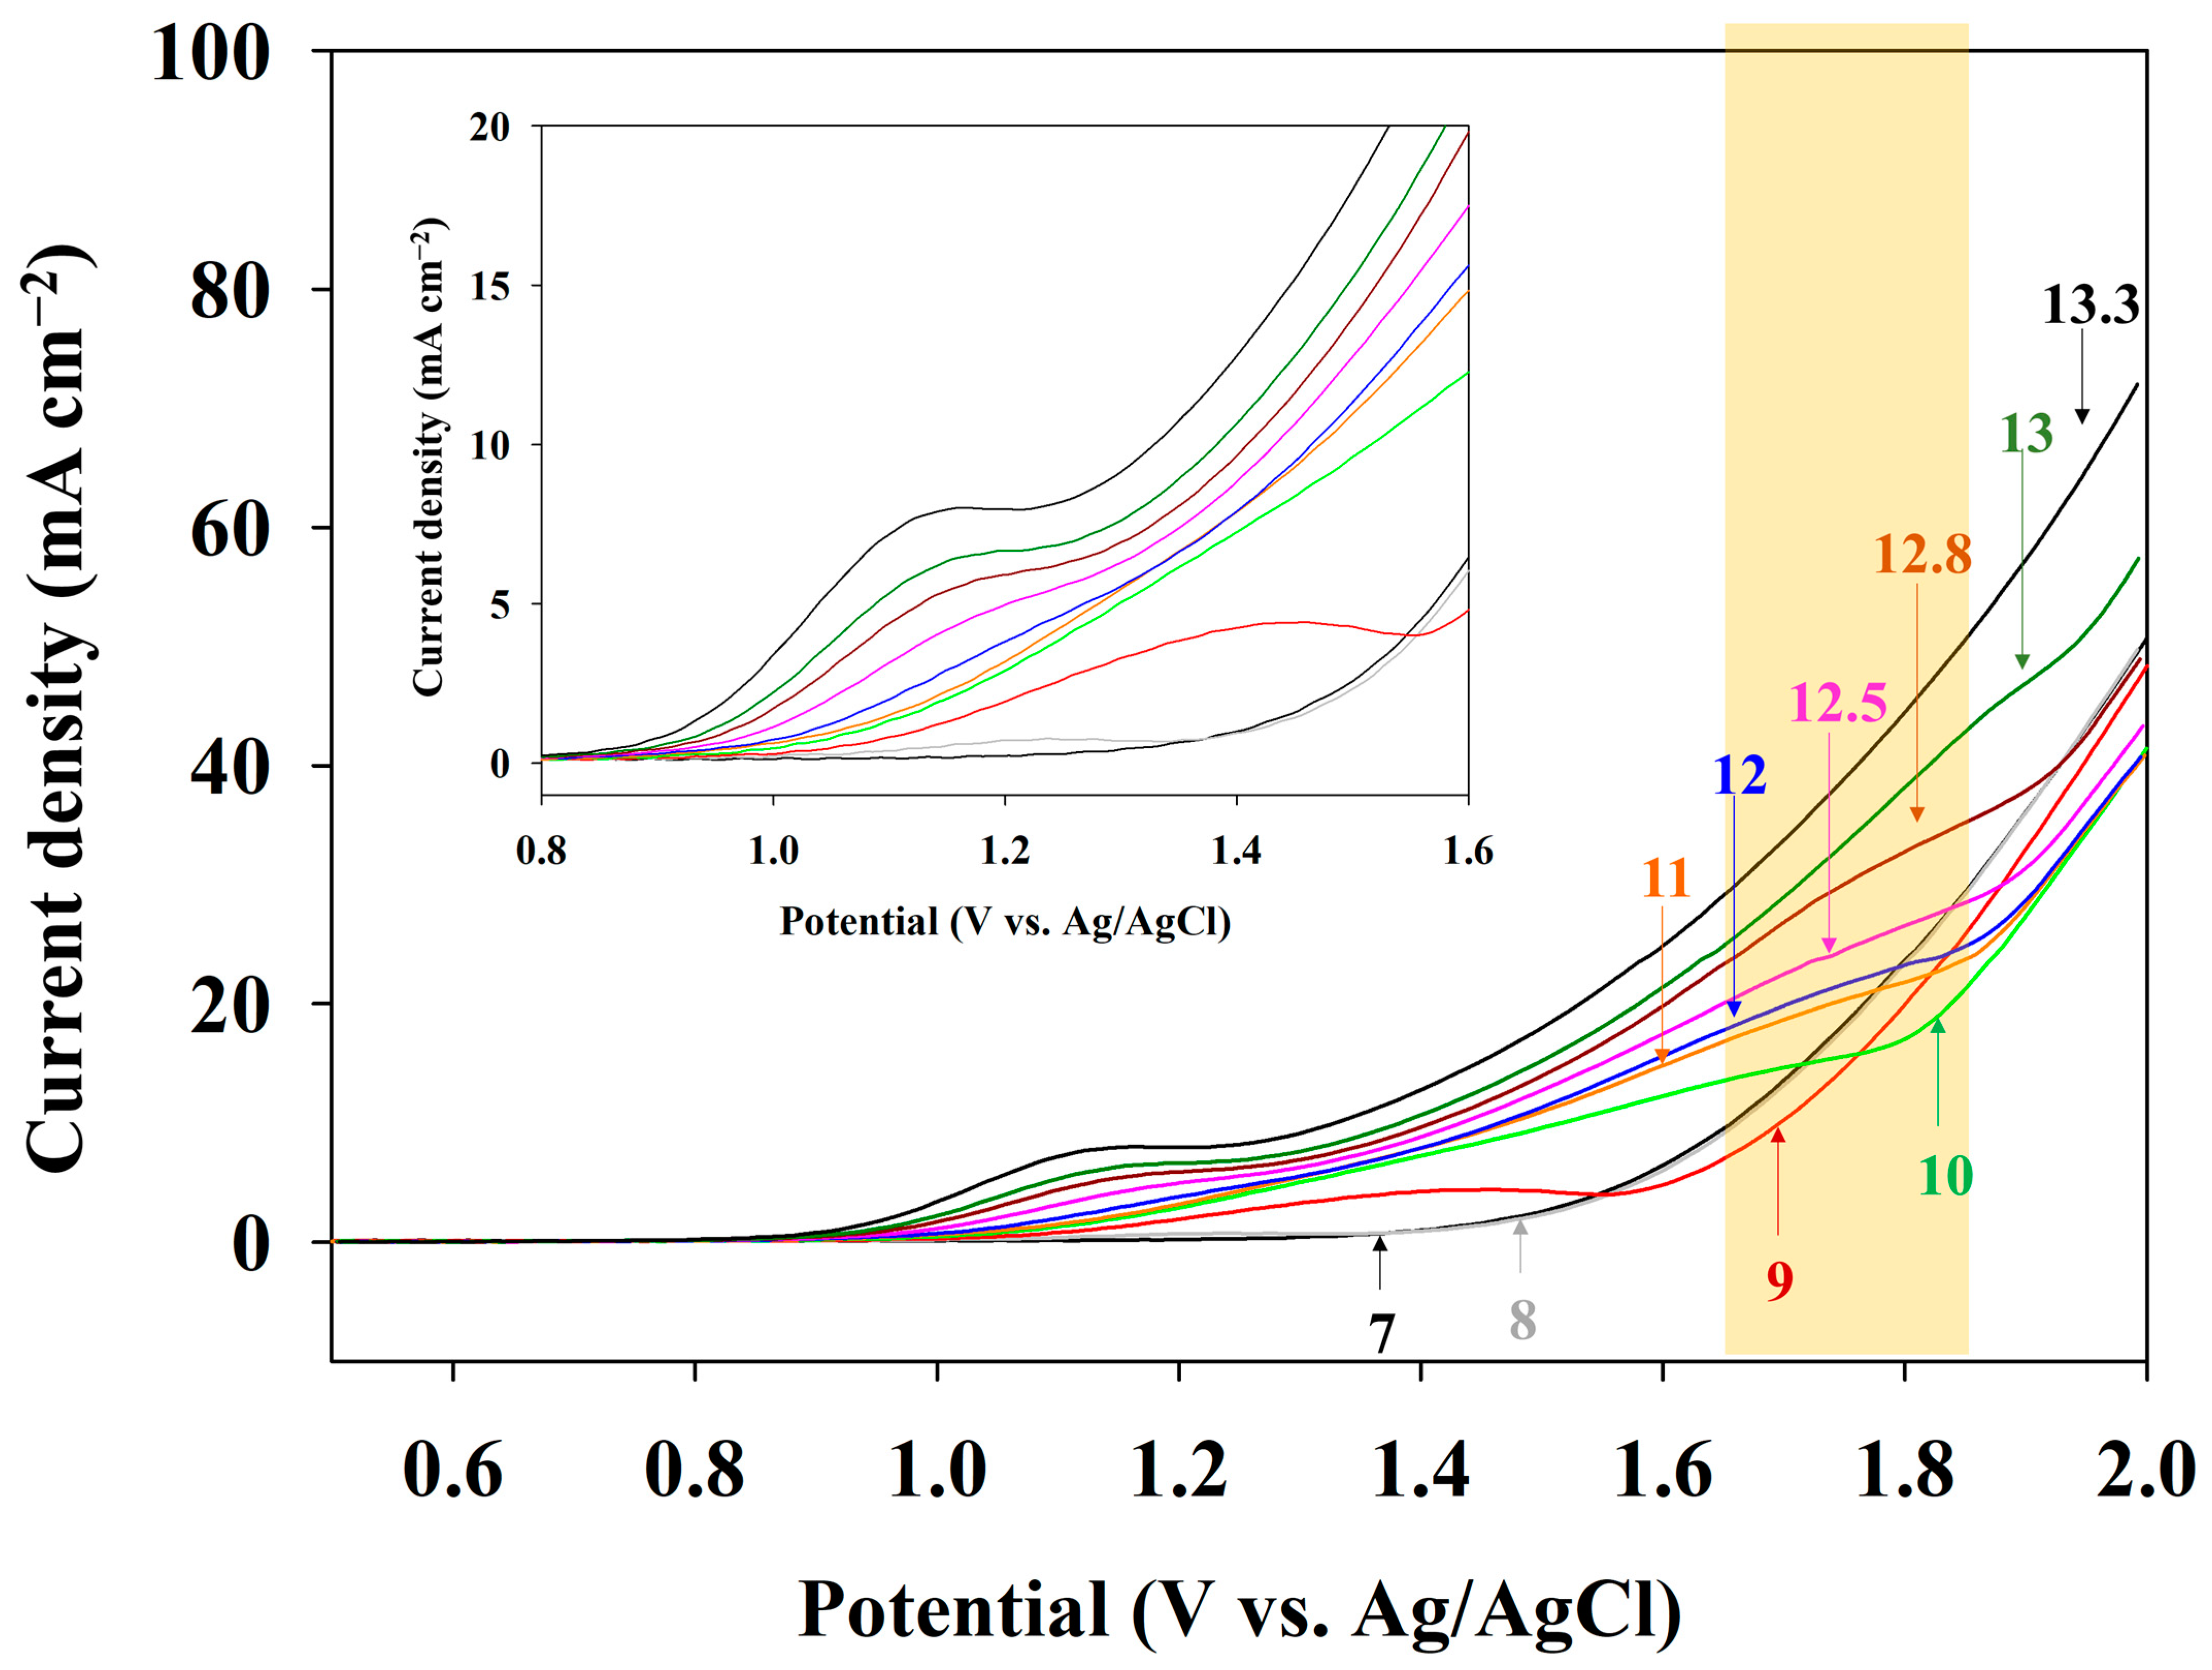
To identify the effect of pH 13.0 on direct electrooxidation of the anolyte, an LSV analysis was conducted (Figure 4). The orange box in Figure 4 indicates a range of changes in the ammonia oxidation peak potential with respect to the pH variation. When the pH was 7.0, the current density increased above 1.42 V, indicating an oxygen evolution reaction (OER). A pH of 8.0 showed an adsorption peak of OH− at a potential of 1.21 V (gray line in offset graph) and a similar current density with a pH of 7.0. However, no peak associated with ammonia oxidation was observed at the pHs of 7.0, 8.0, and 9.0. The voltammogram for pH 10.0 (green line) had a peak related to ammonia oxidation at 1.71 V. The peak current at 1.6 V is related to the adsorption of ammonia, and the increasing current at approximately 1.7 V corresponds to ammonia oxidation. The identification of an ammonia oxidation current at approximately 1.6–1.7 V was confirmed by changes in the current density, depending on the concentration of NH3-N (Figure S3); the ammonia oxidation current at approximately 1.7 V gradually decreased as the electrolysis time elapsed, indicating the decreased NH3-N concentration. The current density at 2.0 V did not significantly differ until the pH was below 12.0. However, a pH above 12.5 showed an increase in the current density. The current density was 72 mA cm−2 at a pH of 13.3, while it was 49 mA cm−2 at a pH of 12.8, showing a 46% higher value. The peak current of ammonia oxidation increased gradually with an increasing pH, and an ammonia oxidation peak was unclear under the highly alkaline condition of pH 13.3, indicating promoted OH− ion adsorption on the electrode surface and subsequent ammonia oxidation. Therefore, a pH of 13.0 was highly recommended for direct electro-oxidation in this study.
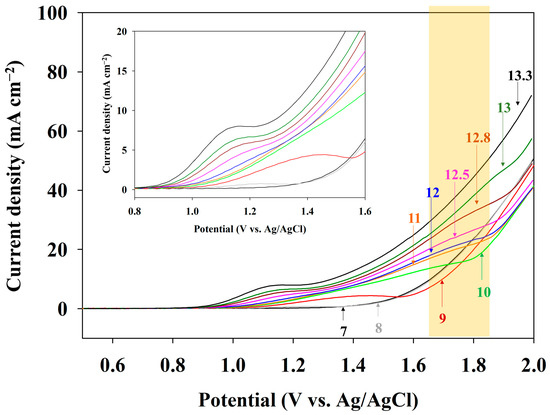
Figure 4.
LSV curves of the Pt-coated Ti electrode in 0.1 M NH4NO3 + 0.9 M KNO3 under the different pH conditions (pH control by the addition of KOH). The scan rate was 50 mV s−1. The offset shows the onset potential in detail. The orange box indicates a range of AOR peak changes depending on the pH.
Zöllig et al. showed that direct electrooxidation is inhibited even at an alkaline pH [27]. They pointed out the reason for the acidification of the local pH in the Nernstian diffusion layer (i.e., the adjacent electrode surface) in a poorly buffered electrolyte. The experimental results and numerical analysis revealed the local pH and NH3/NH4+ ratio variations. Consequently, local acidification could shift NH3 to NH4+, which is hardly oxidized. The anolyte used in this study was prepared using deionized water and chemicals of 99% purity, indicating an impoverished buffer. Accordingly, the anolyte requires high alkaline conditions (pH > 12) due to the considerable effect of the pH on direct electrooxidation and the lack of a buffer. Therefore, whether the effluent of the adsorbent had buffer ions (i.e., purity) was the most crucial factor for the operation of the AmER-AOR process. Additionally, an increase in the pH induced the current density for ammonia oxidation, and the negative shift of the onset potential indicated an ammonia oxidation-friendly condition. The offset graph shows the change in the onset potential. The negative shifting of the onset potential is due to an increased OH− activity [28]. This phenomenon agreed with a previous report stating that the potential of the peak current for ammonia oxidation shifted more positively with decreasing pH values [29].
In addition to the negative shift in the onset potential of ammonia oxidation, the adsorption potential for the OER seemed to shift negatively in accordance with Equation (4), which is derived from the Nernst equation [30]:
E = E0 − 0.0592 × pH = 1.23 − 0.0592 × pH (V)
This implies that alkaline conditions promoted not only direct electrooxidation but also OER. In conclusion, the overly elevated pH requirement was a significant bottleneck that had to be overcome for the practical implementation of the AmER-AOR. Accordingly, an extreme pH of above 12 should be avoided to enable high energy effectiveness and low operational costs owing to the use of alkaline chemicals.
Apart from the above results, the ammonia oxidation peak positively shifted from 1.64 to 1.82 V (vs. Ag/AgCl, orange box in Figure 4). It is well known that an alkaline pH favors AOR, which requires less potential. A voltammetry study showed an ammonia oxidation peak from −0.38 to −0.43 V (vs. SCE) as the pH increased during electrolysis with a Pt electrode [31]. A Pourbaix diagram established by Jang et al. showed that increasing the pH induces a decrease in the oxidation potential [32]. Considering the well-established theory concerning ammonia oxidation, the apparent shift of the ammonia oxidation peak to the positive side should be confirmed through further studies.
3.3. Effect of Operation Conditions on Energy Effectiveness
3.3.1. Effect of the Current Density
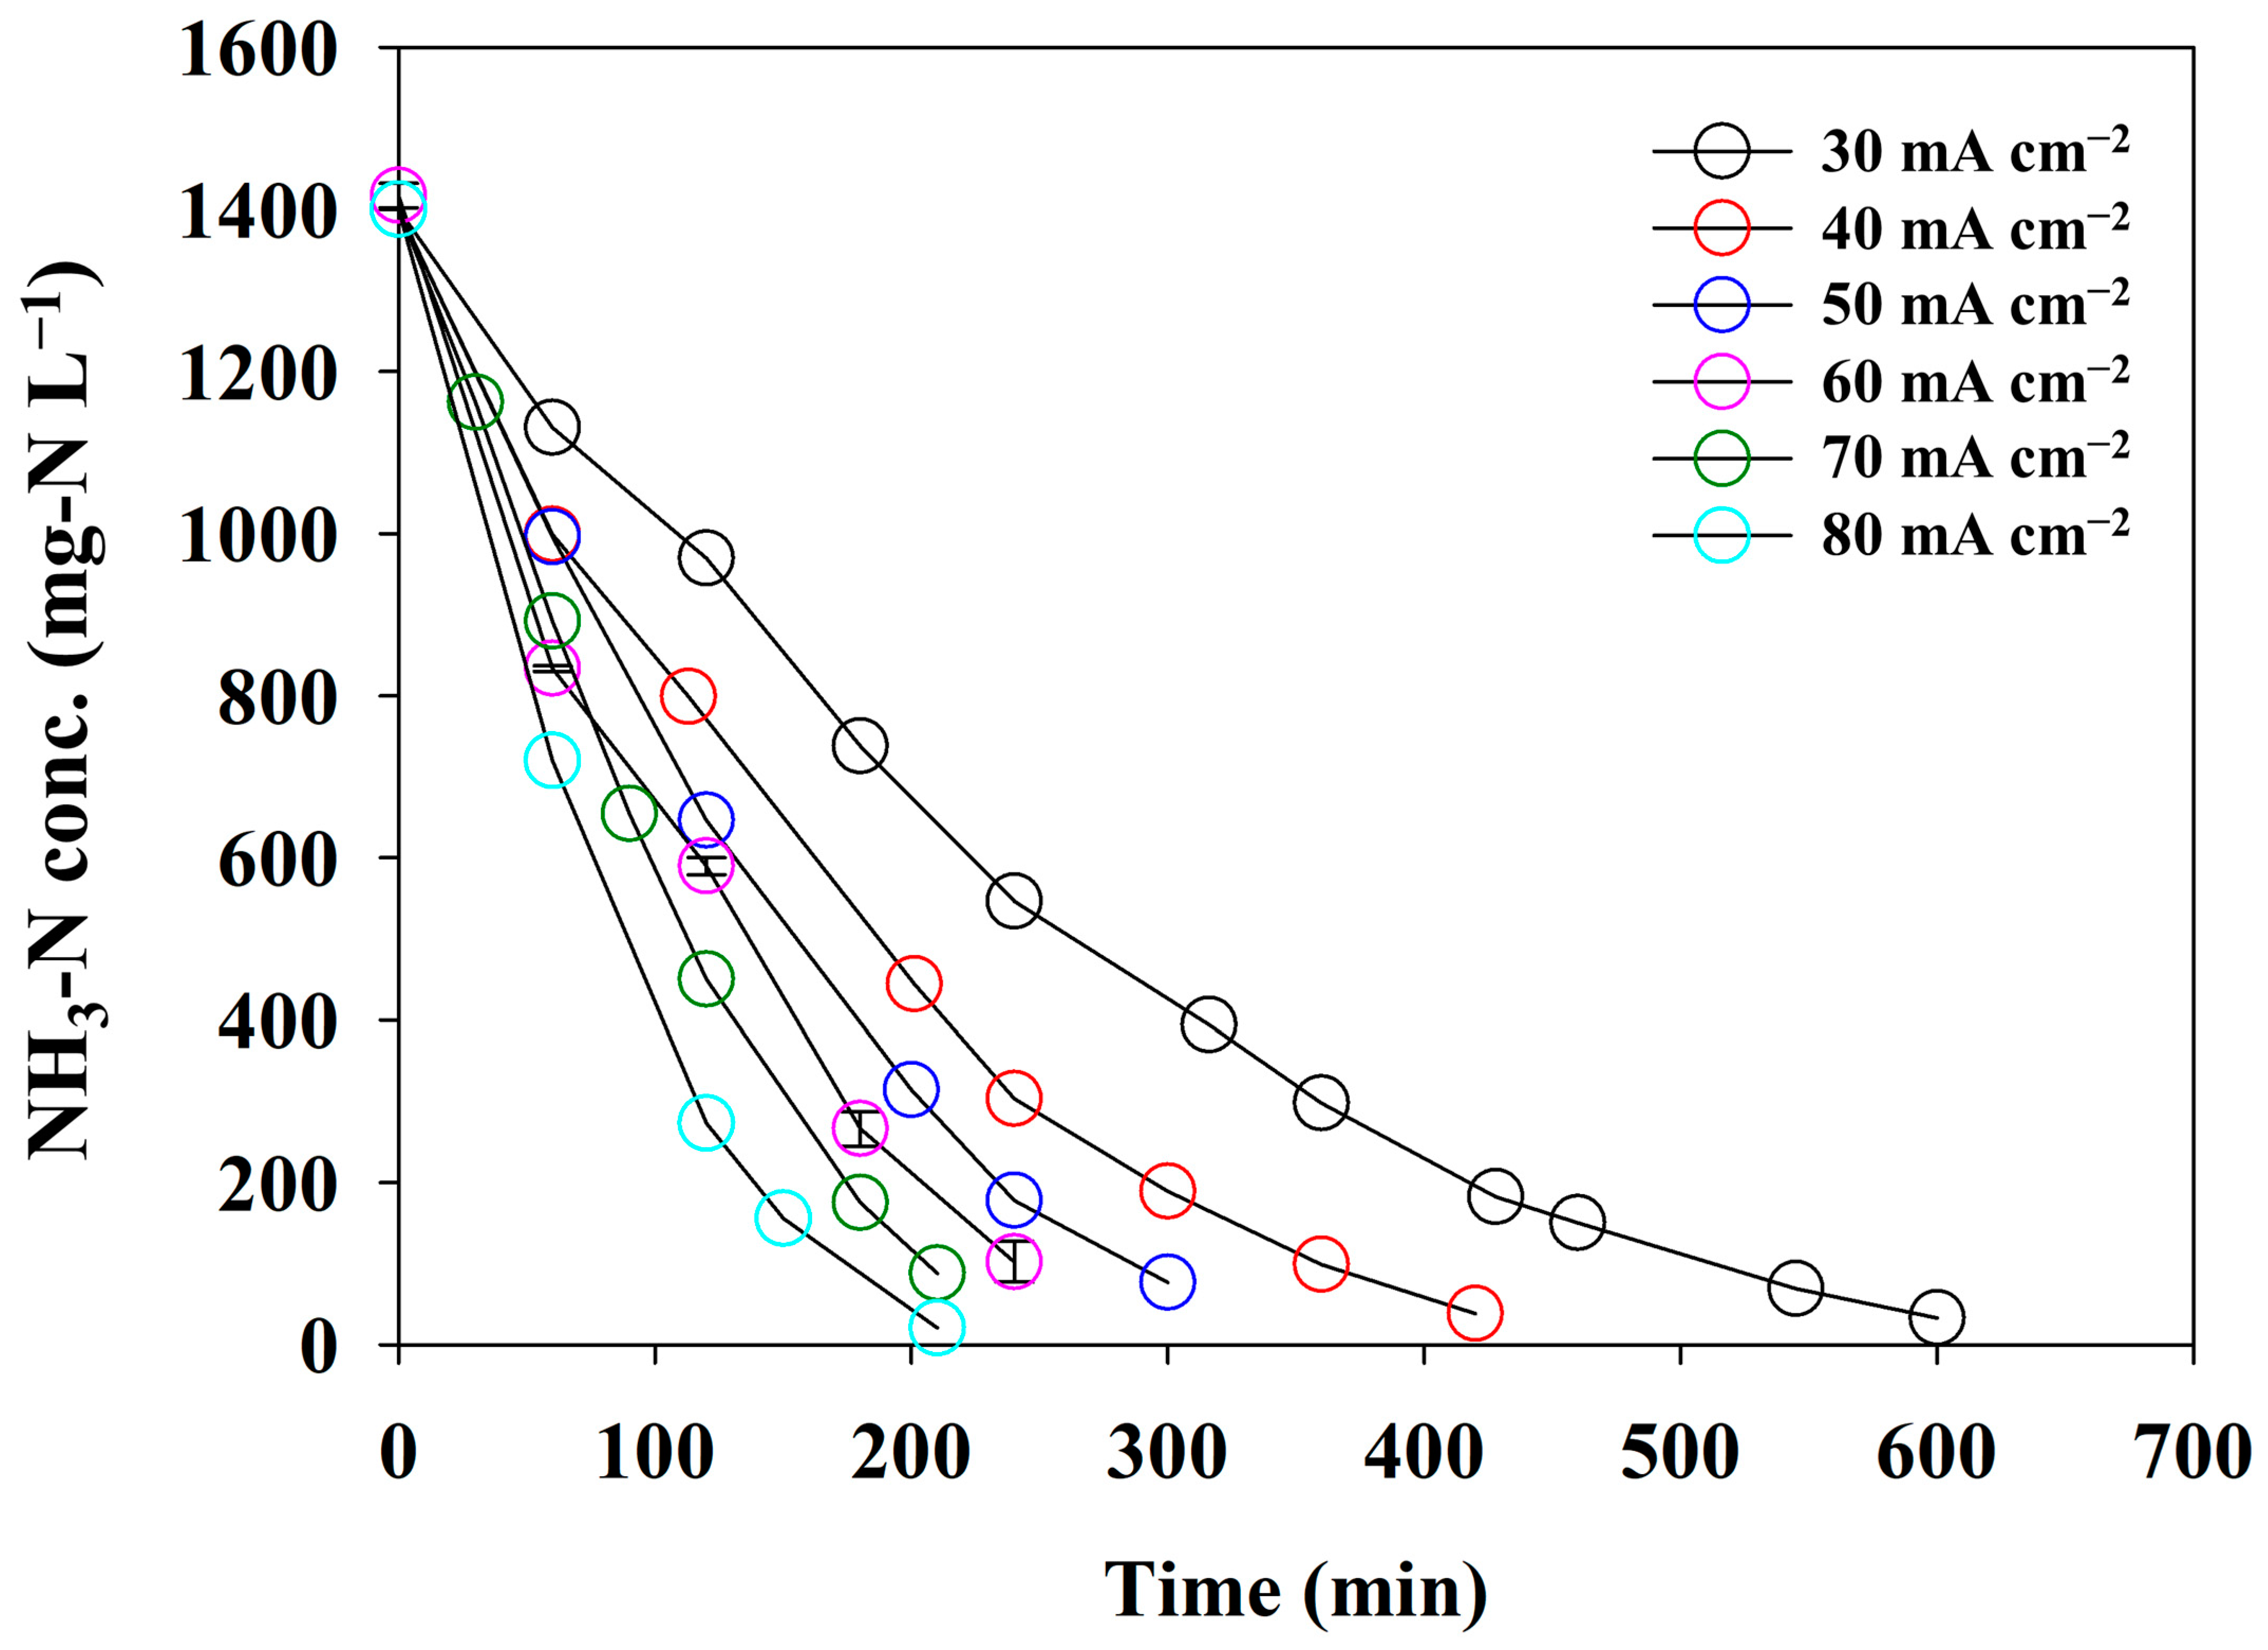
At a pH0 of 13, direct ammonia oxidation was successfully performed. To estimate the effect of the current density on the NH3 removal efficacy as a crucial operational factor, a series of batch experiments under different current densities was carried out using synthetic wastewater containing 0.1 M NH3-N. The CE, SED, and pseudo-first-order reaction constants were calculated with respect to the current density. Figure 5 illustrates the changes in the NH3-N concentration at different current densities from 30 to 80 mA cm−2. The removal rate of NH3-N gradually increased as the current density increased from 30 to 80 mA cm−2. However, the rate of decrease in T99% (the time at which more than 99% of NH3-N was removed) declined as the current density increased. This phenomenon was attributed to a diffusion-controlled electrochemical reaction. Increasing the current density accelerates the reaction rate, which depletes the reactant at the electrode surface. The concentration gradient formed at the interface between the electrode and the electrolyte controls the limiting current density. We considered that 80 mA cm−2 was near the limiting current density. Because current densities exceeding the limiting value may promote competing reactions, such as OER, an experiment exceeding 80 mA cm−2 was not conducted.
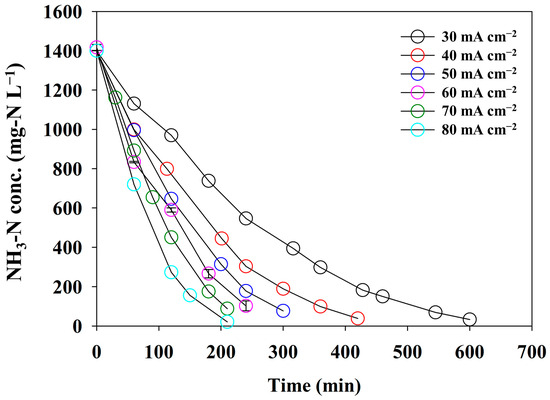
Figure 5.
The changes in the concentration of NH3-N under the different current densities using synthetic wastewater of 0.1 M NH4NO3 + 0.9 M KNO3 (the error bars indicate the standard deviation for the triplicate experiments).
The removal rate showed that ammonia oxidation followed the pseudo-first-order kinetics regardless of the variation in the current density. The reaction kinetics of ammonia oxidation depend on the experimental configuration. The mediated electrooxidation showed the second-order kinetics due to the transport limitation of oxidants and reactants [33,34]. In contrast, direct electrooxidation represents the first-order kinetics that dominate the mass-transport-limited regime, whereas zero-order kinetics are well suited for electron-transfer-limited conditions [13,14,15]. Therefore, this study showed the pseudo-first-order kinetics due to the mass transport limitation under direct electrooxidation and an anolyte with a low concentration of NH3-N.
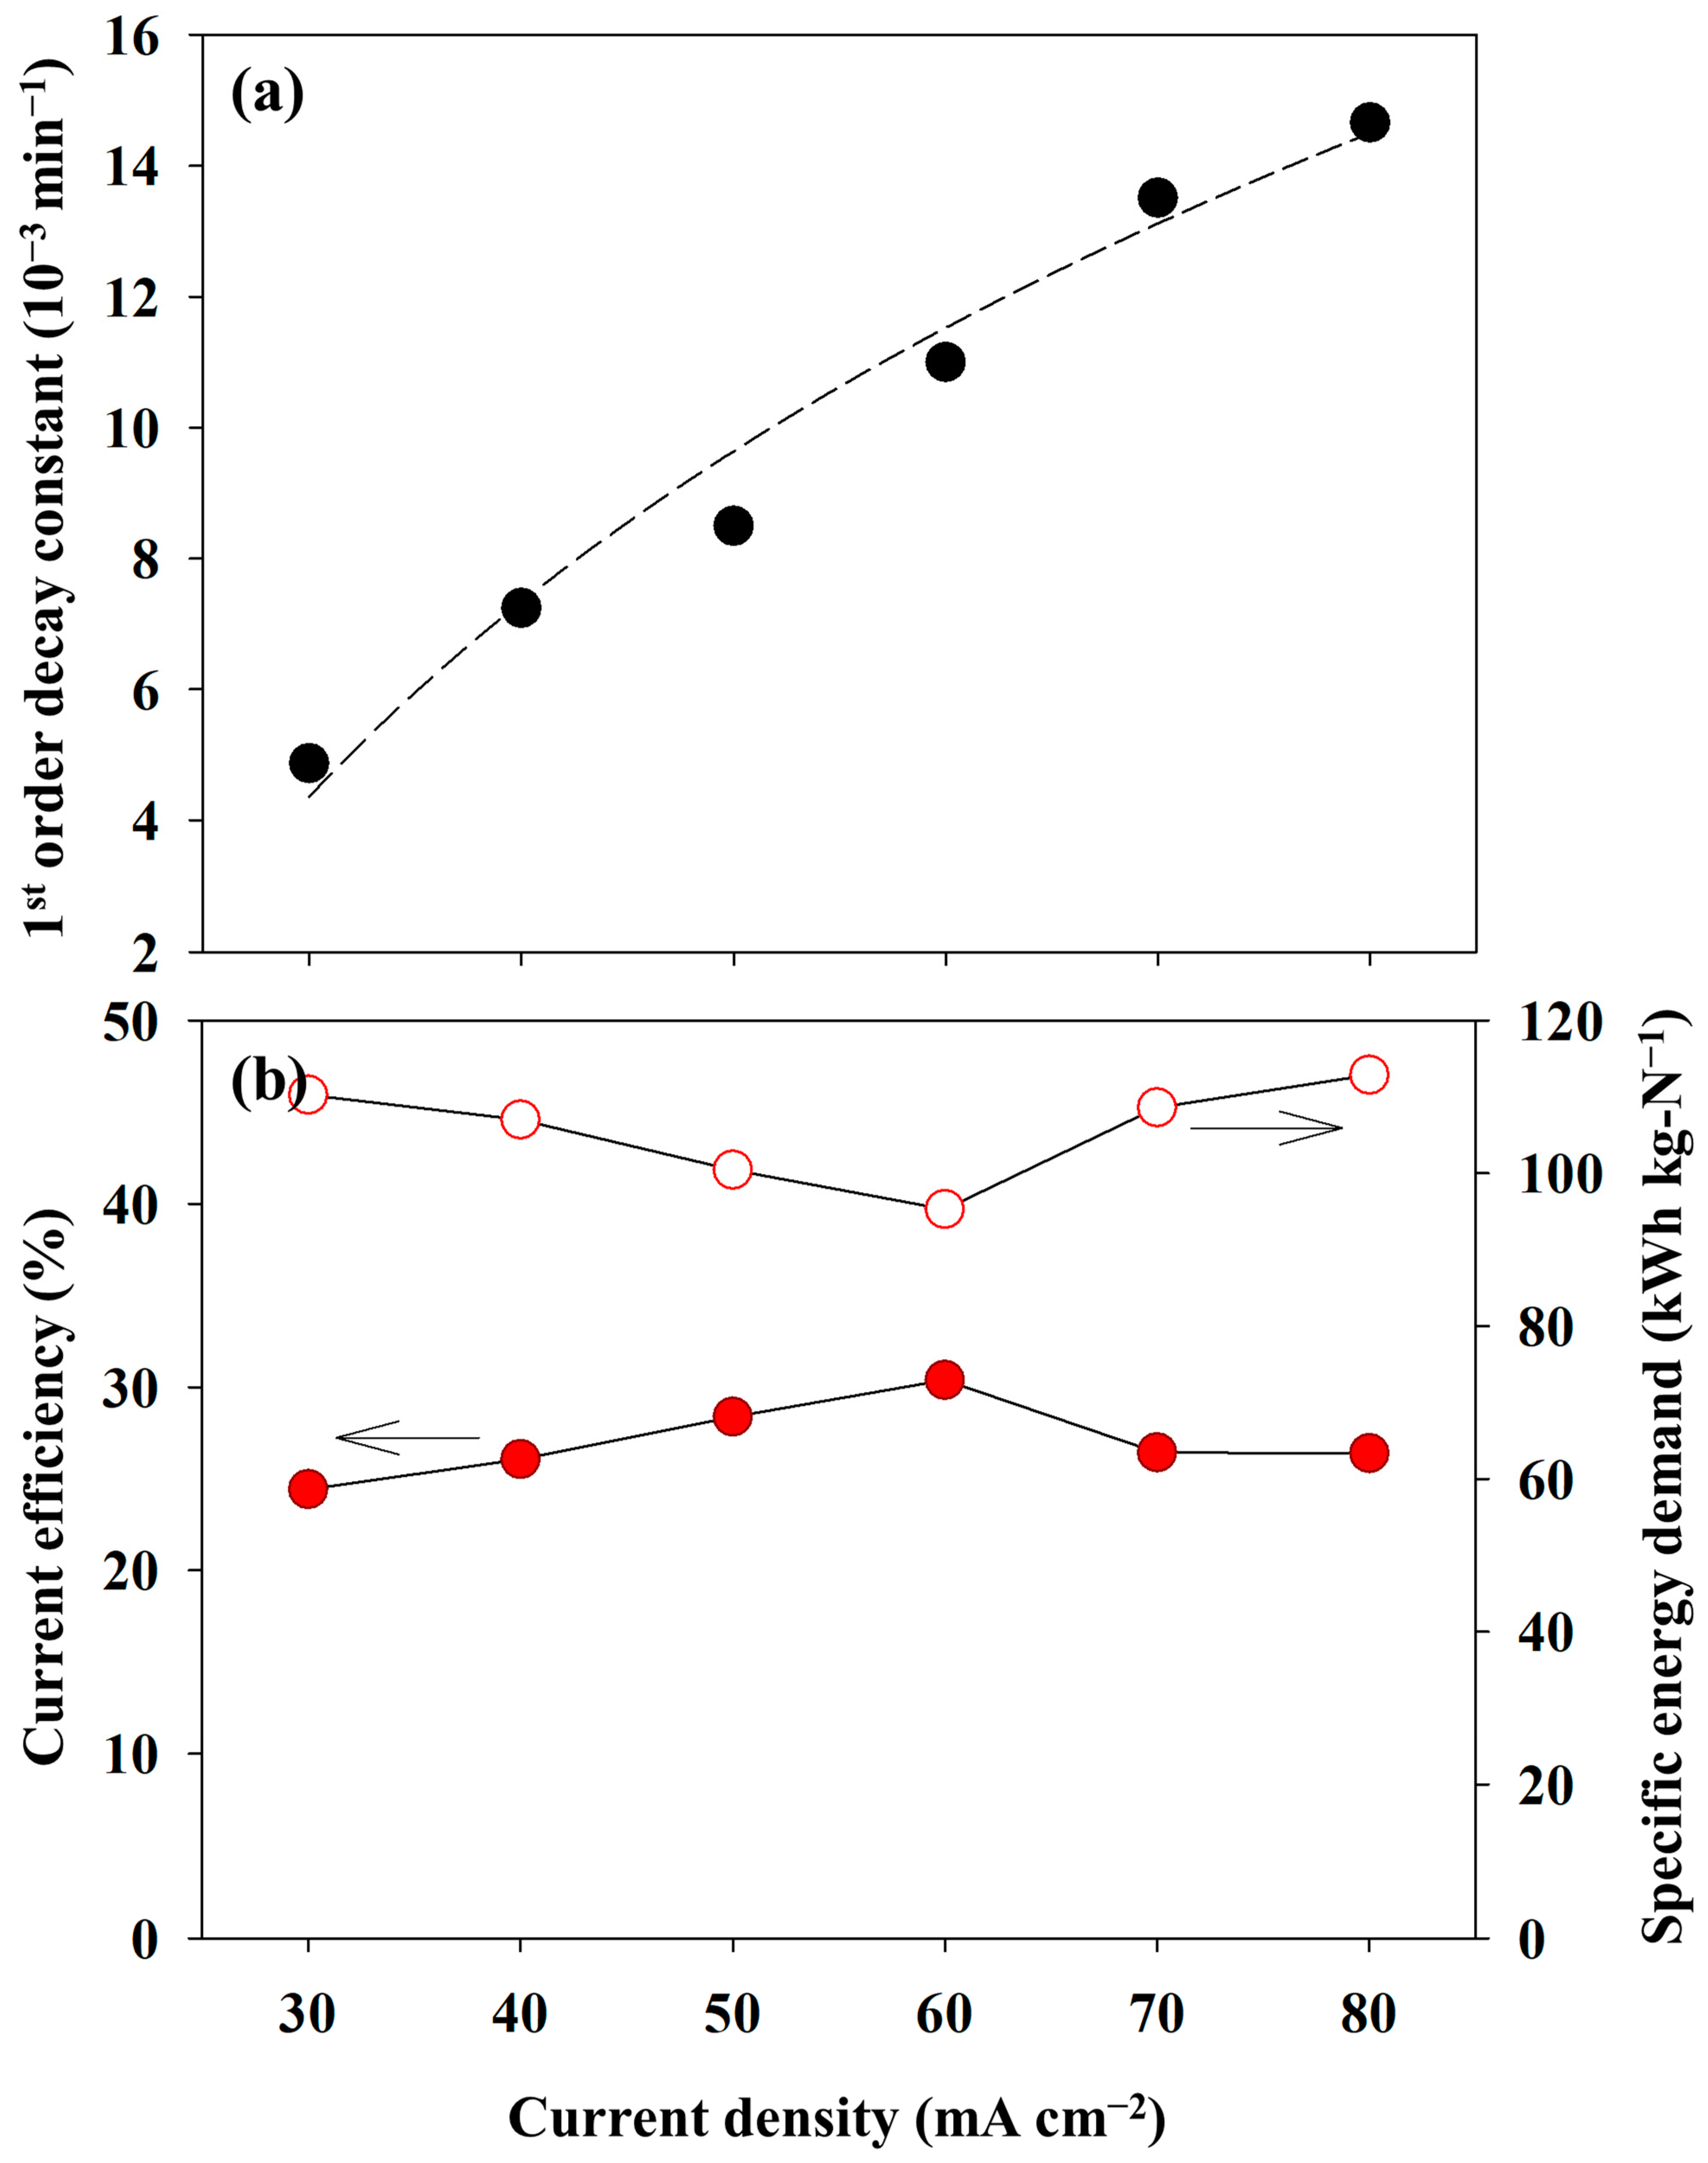
Figure 6a shows the correlation between the pseudo-first-order kinetic constants and the current densities. The pseudo-first-order kinetic constants for ammonia oxidation were determined using the best-fit method, in which the sum of the square errors between the experimental data and the fitting values was minimized. The first-order kinetic model successfully interpreted the experimental results (R2 = 0.9757). The pseudo-first-order kinetic constants varied from 0.005 to 0.014 min−1. These values were consistent with those of other studies that induced direct electrooxidation. Yao et al. showed a value of 0.0013 min−1 under a current density of 20 mA cm−2 and with a Ti/PbO2 anode condition [14]. Song et al. achieved the highest reaction rate of 0.002 min−1 at a pH of 12.0 under a potentiostatic operation of 1.1 V (vs. Ag/AgCl) in an undivided cell equipped with a NiCu/BDD anode [15]. Therefore, it can be concluded that the reaction rates observed in this study were typical. In addition, the plot fitted well with the logarithmic function, endorsing that 80 mA cm−2 approached a liming current density, as mentioned above.
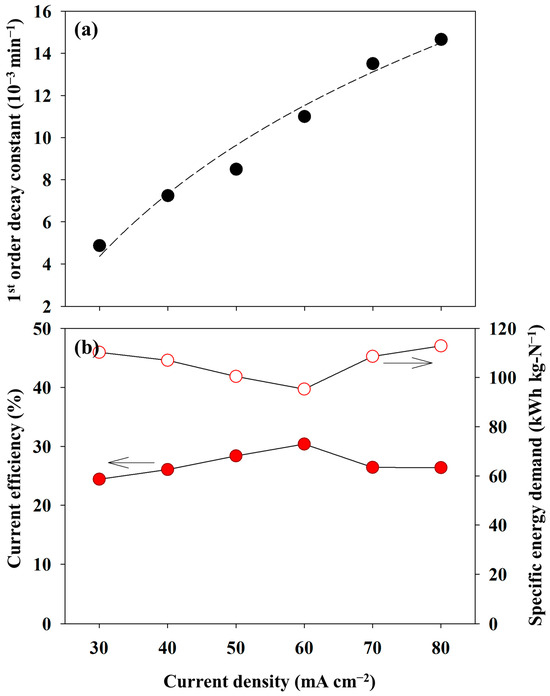
Figure 6.
The changes in the (a) pseudo-first-order kinetic constants (the dashed line indicates the fitting curve with a logarithmic regression) and (b) current efficiency and specific energy demand as a function of the current density (0.1 M NH4NO3 + 0.9 M KNO3).
The variation in the CE was described in Figure 6b (red circle). The CE was in a range of 24.4–30.39% with respect to the variation of the current densities. Notably, the highest value of 30.39% was achieved when 60 mA cm−2 was applied, indicating the most energy-effective operation. Apart from the CE, the lowest SED value of 95.29 kWh/kg-N at 60 mA cm−2 demonstrated an identical conclusion. However, the CE was lower than the values reported in previous studies due to the low NH3-N concentration and mass transport limitations. Kim et al. obtained a CE of 52% during electrolysis using a multi-stacked cell and an AEM under 80 mA cm−2 [25]. However, the initial concentration was 0.5 M. They also reported a CE of 67.4% using a divided cell with a cation exchange membrane and 0.5 M NH3-N [35]. Although a high CE of 60.7% was achieved, even at 10 mM NH3-N, the CD was 1.2 mA cm−2, indicating sufficient mass transport [36].
The SED showed a range of 95–118 kWh/kg-N. These values were similar to those of other electrolysis processes under mediated electrochemical oxidation. Zheng et al. reported 73 kWh/kg-N at 50 mA cm−2 using a RuO2–IrO2–TiO2/Ti electrode [12]. They emphasized that an increase in the current density or decrease in the initial NH3-N concentration significantly affected the CE or SED simultaneously. On the contrary, Zöllig et al. obtained 42 kWh/kg-N with a graphite electrode during the electrooxidation of stored urine [13]. Song et al. demonstrated that the SED skyrocketed at 1.5 V (vs. Ag/AgCl) to 46 kWh/kg-N [15]. In contrast, a value of less than 20 kWh/kg-N was represented at below 1.3 V. Considering the experimental results and the previous literature, the kinetics of AOR in this study was sufficiently rapid. Therefore, the electrolytic cell used in this study exhibited a diffusion-controlled electrochemical reaction. This indicated that a high initial concentration led to an improvement in the CE or SED. Thus, experiments under the different initial NH3-N concentrations were conducted.
3.3.2. Effect of Initial NH3 Concentration
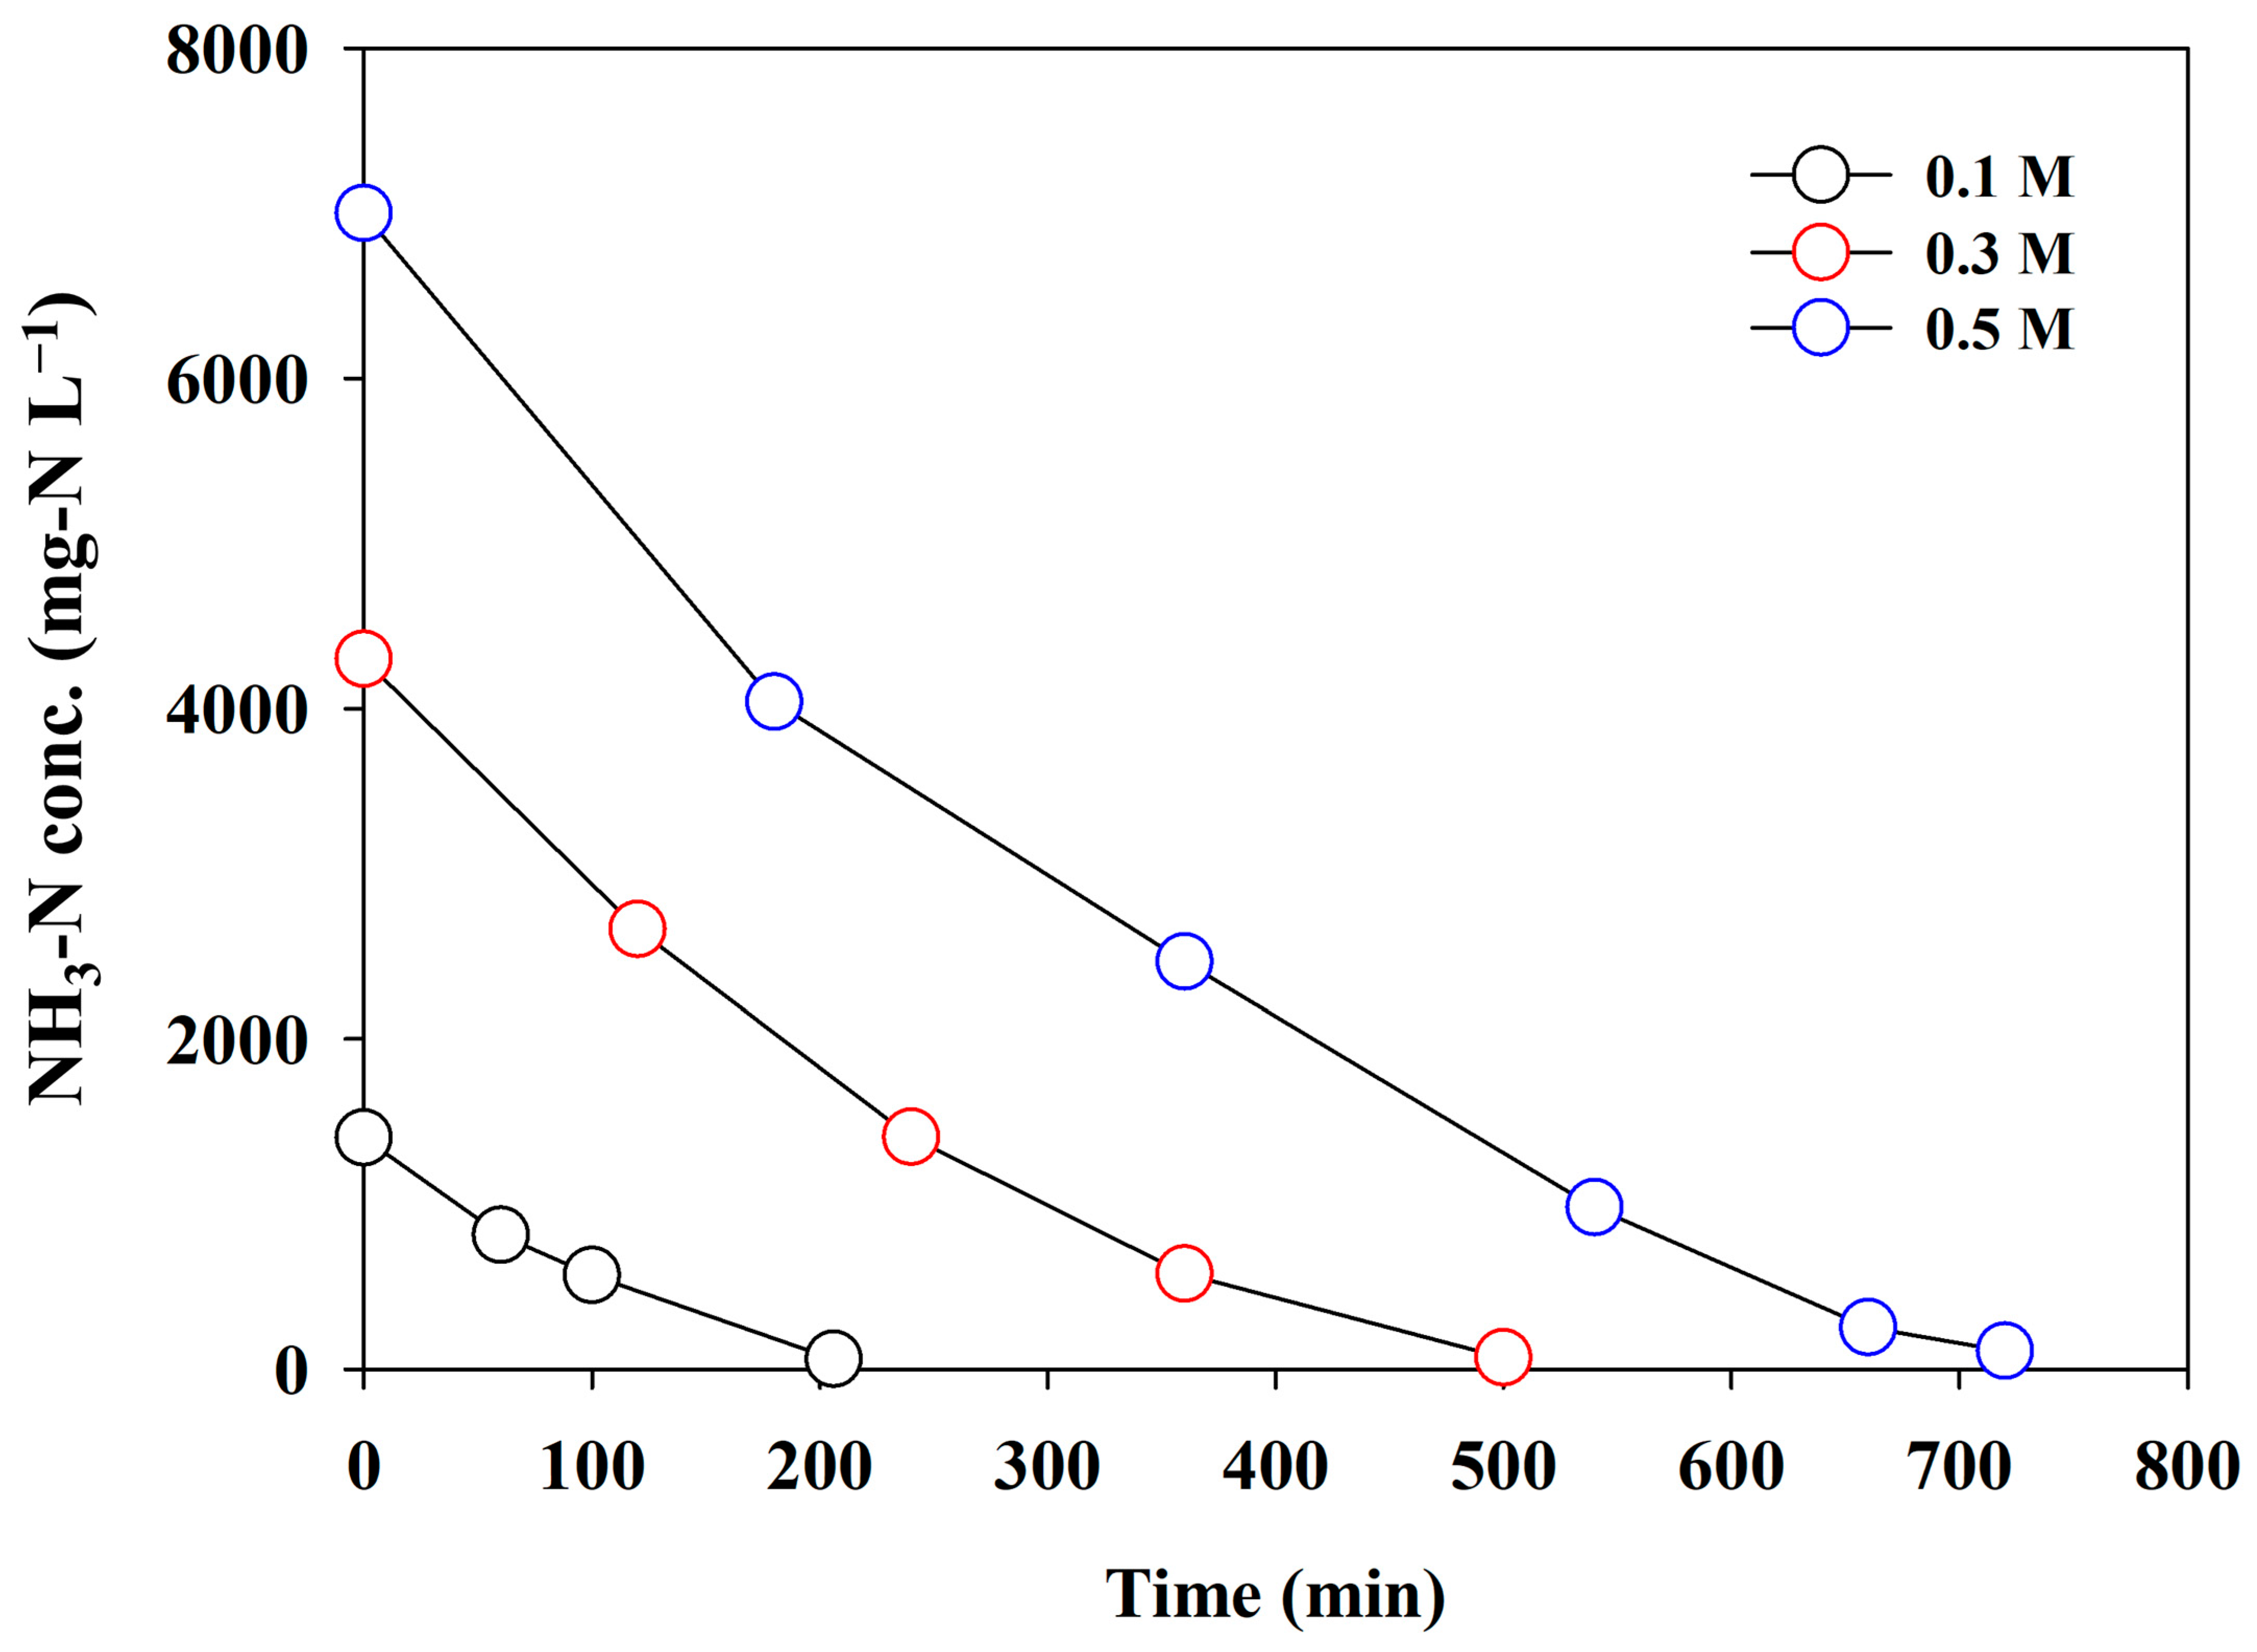
In direct electrooxidation, the mass transport due to the concentration gradient generated at the electrode interface is the primary driving force for pseudo-first-order kinetics. Considering this information, the effect of the initial NH3-N concentration on electrolysis efficacy was investigated. The initial NH3-N concentration varied at 0.1, 0.3, and 0.5 M, as the adsorbent possibly produced the highest concentration (0.5 M) [11]. A current density of 60 mA cm−2, indicating the most energy-effective condition (as shown in Figure 6), was selected for the experiments. Figure 7 depicts the changes in the NH3-N concentration. The reaction rate increased gradually with an increasing initial concentration, which was possibly governed by the mass transfer rate. The CE was improved from 30.37% to 51.57%, while the SED significantly decreased from 95.25 to 58.57 kWh/kg-N (Table 1), which was similar to that reported in other studies [35,37]. The effluent of the adsorbent is continuously discharged during the regeneration of the adsorbent, and the concentration of NH3-N varied depending on the desorption period. Therefore, the electrolysis of NH3-N-enriched wastewater in a continuous mode might be an energy-effective strategy, in addition to operation under the optimal current density.
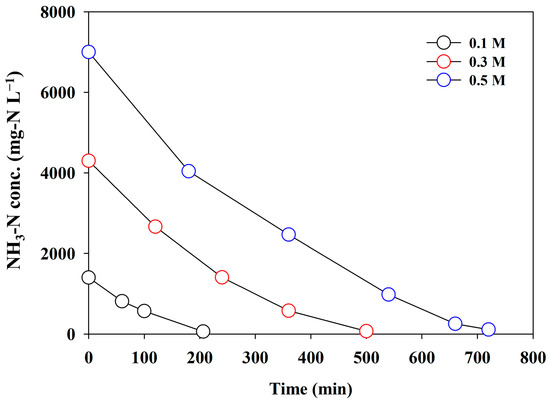
Figure 7.
The changes in the concentration of NH3-N using synthetic wastewater under different initial concentrations (j = 60 mA cm−2).

Table 1.
The current efficiency and specific energy demand with respect to the initial NH3-N concentration.
3.4. Additional Merit of the AmER-AOR: H2 Production
Most studies on the electrochemical treatment of wastewater have been performed using undivided cells. Electrons released from direct electrooxidation of ammonia at the anode migrate to the cathode, where H2 is generated via water electroreduction. Even though H2 is produced at the cathode in an undivided cell, undesirable gases, such as oxygen or nitrogen, are emitted simultaneously during NH3-N treatment. This indicates that the purity of H2 is unsuitable for use without further purification. For example, Cho and Hoffman electrolyzed simulated wastewater containing 2.5 g L−1 of urea and 50 mM NaCl [38]. They reported a H2 purity of 60%. In contrast, in this study, NH3-N-enriched wastewater was adequately electrolyzed in a divided cell that produced pure H2 (>95%) in the cathodic chamber. Therefore, the production of H2 was an additional merit compared with other wastewater treatment processes. Although Kuang et al. electrolyzed NH3-N in a divided cell, they did not deal with H2 production in the cathodic reaction [17]. With this in mind, the amount of energy production in terms of the HHV through HER was estimated from the experimental values obtained from Figure 5. It was assumed that the CE for HER in Equation (3) and the purity of H2 was 100% for calculation convenience.
The calculation results were listed in Table 2. The EE demonstrated a ratio between the electrical energy introduced in the cell and the heat energy generated by H2 gas. The EE ranged from 28.00–30.75%. The values agreed with Cho and Hoffman’s estimation [38]. They plotted the EE associated with the applied cell voltage (Ecell) under different CE values of HER. According to the plot, a decrease in Ecell may increase the EE by more than 30%. Moreover, the net energy consumption for NH3-N removal could be decreased to less than 95 kWh kg-N. In conclusion, the AmER-AOR produces energy from wastewater.
Table 2.
Energy recovery through H2 production as the higher heating value (HHV).
3.5. Practical Application
The experiment using actual reject water containing approximately 1500 mg-N L−1 was conducted at 60 mA cm−2 to examine the practical performance of the AmER-AOR. The experiment was conducted under the same reactor with that of synthetic wastewater. Figure 8a shows the changes in the NH3-N concentration in synthetic wastewater and NH3-N-enriched wastewater. The concentration of NH3-N approached less than 100 mg-N L−1 within 240 min in synthetic wastewater, whereas 270 min was required for NH3-N-enriched wastewater. The removal rate of the two anolytes was the pseudo-first order. This implied that the effluent from the AmER has a similar ionic purity with synthetic wastewater. The pseudo-first-order kinetic constants for direct electrooxidation showed insignificant differences: 0.0107 min−1 and 0.0098 min−1 in synthetic wastewater and NH3-N-enriched wastewater, respectively. In addition, the pH variation of NH3-N-enriched wastewater was analogous to that of synthetic wastewater, indicating a similar electrochemical behavior (Figure 8b). The LSV curves in Figure S4 confirmed this result. The onset potential, NH3 oxidation peak potential, and current density in Figure S4 (LSV for NH3-N-enriched wastewater) were similar to those in Figure 4 (LSV for synthetic wastewater). These results were attributed to the exclusive extraction of NH3 from actual reject water by the adsorbent despite the coexistence of abundant ions in the water matrix. Therefore, this study confirmed the practical feasibility of the AmER-AOR.
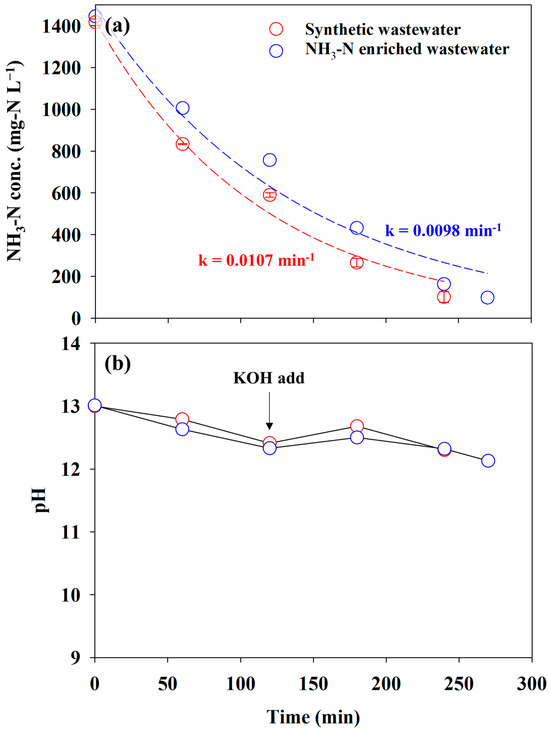
Figure 8.
The changes in the (a) NH3-N concentration and (b) pH for synthetic wastewater (0.1 M NH4NO3 + 0.9 M KNO3) and NH3-N-enriched wastewater. The dashed lines indicate a fitting curve with a pseudo-first-order kinetic regression.
4. Conclusions and Future Scope
This study investigated the AmER-AOR, which consists of ammonium-exchange resin and the electrooxidation of ammonia. To secure an alkaline anolyte for direct electrooxidation in a divided cell, the BPM was employed as a separator. The AmER-AOR system showed several advantages over the conventional biological treatments for ammonia removal from actual reject water. NH3-N was easily removed from actual reject water by adsorption, desorption, and the application of electric energy without complicated control. The rapid removal rate of NH3-N facilitated a minimized spatial requirement. The tolerance of the AmER-AOR for the selective conversion of NH3-N to nitrate renders the operation uncomplicated because of the high concentration of nitrate in NH3-N-enriched wastewater. Finally, it produced a valuable material of H2. Most notably, the AmER-AOR was highly feasible for practical implementation.
However, the high pH requirement weakens the energy effectiveness of the AmER-AOR. To better implement the AmER-AOR, further studies on the pH are essential, including the following strategies: The first method involves the introduction of a buffer, such as carbonate/bicarbonate (pKa = 10.33). The buffer could retrain the drastic decrease in the pH. Although competition between the oxidation of carbonate and NH3 possibly occurs, a low concentration of carbonate does not hinder ammonia oxidation [39]. An additional approach involves the addition of Cl− ions. Mediated electrooxidation is more effective than direct electrooxidation. However, an exceedingly high concentration of Cl− ions generates Cl2 gas, which is a toxic and corrosive material. Therefore, it is essential to determine an appropriate concentration. For example, 1 M KNO3 + 10 mM KCl is desirable for the AmER-AOR. Nonetheless, the RCS remain in the electrolyte even at low concentrations, indicating potential irreparable deterioration of not only the membrane and electrodes but also the adsorbent. Therefore, this approach must be verified through a study associated with the confirmation of the short- and long-term effects of RCS on the stability of the AmER-AOR. Further studies should address these proposals to render the AmER-AOR more feasible in practical applications.
Further research on the AmER-AOR might be a breakthrough in rendering the AmER-AOR more feasible. Most notably, this study developed a novel type of system for treating reject water that could solve the current global water and energy threats.
Supplementary Materials
The following supporting information can be downloaded at: https://www.mdpi.com/article/10.3390/w16111599/s1. Text S1. A method to adjust NH3-N concentration in SW [11]; Text S2. A procedure for particle separation; Text S3. A column test method for NH3-N enriched wastewater preparation; Table S1. The chemical properties of sludge dewatering filtrate before and after particle separation; Table S2. The Pseudo-first order kinetic constant of initial 120 min and end of experiment; Figure S1. (a) A configuration of BPM-integrated electrolytic cell and (b) schematic representation of a bipolar membrane under a reverse bias mode. The description (b) is reproduced from [40], Copyright by Elsevier; Figure S2. The changes of NH3-N concentration and pH using anion exchange membrane (fumasep® FAS-50, FUMATECH, Germany); Figure S3. LSV curves with respect to the electrolysis time under the above pH 12 condition. Scan rate is 50 mV s−1; Figure S4. LSV curves of Pt coated Ti electrode in NH3-N-enriched wastewater. Scan rate is 50 mV s−1. The offset shows the onset potential in detail.
Author Contributions
J.-H.K.: Writing—original draft, Methodology, Investigation, Data curation, and Visualization; G.-G.O.: Formal analysis, Resources; B.-J.L.: Resources; S.I.: Formal analysis, Validation; W.K.: Resources, Supervision, Funding acquisition; S.K.: Conceptualization, Project administration, Writing—review and editing; J.-H.H.: Validation, Formal analysis, Writing—review and editing. All authors have read and agreed to the published version of the manuscript.
Funding
This research was supported by the Korea Institute of Civil Engineering and Building Technology (Project No. 20230160-001). This research was supported by the National Research Council of Science & Technology (NST) grant by the Korean Government (MIST) (No. CPS23091-100).
Data Availability Statement
Data will be available on request.
Conflicts of Interest
The authors declare that they have no known competing financial interests or personal relationships that could have appeared to influence the work reported in this paper.
References
- Han, B.; Butterly, C.; Zhang, W.; He, J.Z.; Chen, D. Adsorbent materials for ammonium and ammonia removal: A review. J. Clean. Prod. 2021, 283, 124611. [Google Scholar] [CrossRef]
- Wyer, K.E.; Kelleghan, D.B.; Blanes-Vidal, V.; Schauberger, G.; Curran, T.P. Ammonia emissions from agriculture and their contribution to fine particulate matter: A review of implications for human health. J. Environ. Manag. 2022, 323, 116285. [Google Scholar] [CrossRef] [PubMed]
- Zilio, M.; Pigoli, A.; Rizzi, B.; Geromel, G.; Meers, E.; Schoumans, O.; Adani, F. Measuring ammonia and odours emissions during full field digestate use in agriculture. Sci. Total Environ. 2021, 782, 146882. [Google Scholar] [CrossRef] [PubMed]
- Riddick, S.N.; Dragosits, U.; Blackall, T.D.; Tomlinson, S.J.; Daunt, F.; Wanless, S.; Sutton, M.A. Global assessment of the effect of climate change on ammonia emissions from seabirds. Atmos. Environ. 2018, 184, 212–223. [Google Scholar] [CrossRef]
- Wen, Q.; Ma, M.; Hou, H.; Yu, W.; Gui, G.; Wu, Q.; Yang, J. Recirculation of reject water in deep-dewatering process to influent of wastewater treatment plant and dewaterability of sludge conditioned with Fe2+/H2O2, Fe2+/Ca(ClO)2, and Fe2+/Na2S2O8: From bench to pilot-scale study. Environ. Res. 2022, 203, 111825. [Google Scholar] [CrossRef] [PubMed]
- Naufal, M.; Wu, J.H. Chemomixoautotrophy and stress adaptation of anammox bacteria: A review. Water Res. 2024, 257, 121663. [Google Scholar] [CrossRef] [PubMed]
- El-Qelish, M.; Mahmoud, M. Overcoming organic matter limitation enables high nutrient recovery from sewage sludge reject water in a self-powered microbial nutrient recovery cell. Sci. Total Environ. 2022, 802, 149851. [Google Scholar] [CrossRef] [PubMed]
- Wang, H.; Fan, Y.; Zhou, M.; Liu, J.; Li, X.; Wang, Y. Metagenomics insight into the long-term effect of ferrous ions on the mainstream anammox system. Environ. Res. 2023, 238, 117243. [Google Scholar] [CrossRef]
- Cruz, H.; Luckman, P.; Seviour, T.; Verstraete, W.; Laycock, B.; Pikaar, I. Rapid removal of ammonium from domestic wastewater using polymer hydrogels. Sci. Rep. 2018, 8, 2912. [Google Scholar] [CrossRef]
- Alshameri, A.; He, H.; Zhu, J.; Xi, Y.; Zhu, R.; Ma, L.; Tao, Q. Adsorption of ammonium by different natural clay minerals: Characterization, kinetics and adsorption isotherms. Appl. Clay Sci. 2018, 159, 83–93. [Google Scholar] [CrossRef]
- Kang, S.; Lee, B.; Ahn, K.H.; Im, S.; Kim, B.; Kim, T.H.; Chae, S. Facile synthesis of copper-substituted Prussian blue analog immobilized ion exchange resins for high-performance ammonium recovery from wastewater: Adsorption kinetics, isotherms, and regeneration. Chem. Eng. J. 2023, 457, 141128. [Google Scholar] [CrossRef]
- Zheng, X.; Ji, L.; Ye, H.; Zhang, Y.; Yan, L.; Li, J.; Kong, H. Removal of ammonia from source-separated urine by electrolytic oxidization using RuO2-IrO2-TiO2/Ti electrodes. Fresenius Environ. Bull. 2010, 19, 991–998. [Google Scholar]
- Zöllig, H.; Remmele, A.; Morgenroth, E.; Udert, K.M. Removal rates and energy demand of the electrochemical oxidation of ammonia and organic substances in real stored urine. Environ. Sci. Water Res. Technol. 2017, 3, 480–491. [Google Scholar] [CrossRef]
- Yao, J.; Mei, Y.; Xia, G.; Lu, Y.; Xu, D.; Sun, N.; Chen, J. Process optimization of electrochemical oxidation of ammonia to nitrogen for actual dyeing wastewater treatment. Int. J. Environ. Res. Public Health 2019, 16, 2931. [Google Scholar] [CrossRef]
- Song, J.; Yang, Y.; Jia, Y.; Wang, T.; Wei, J.; Wang, M.; Yang, B. Improved NH3-N conversion efficiency to N2 activated by BDD substrate on NiCu electrocatalysis process. Sep. Purif. Technol. 2021, 276, 119350. [Google Scholar] [CrossRef]
- Diaz, L.A.; Botte, G.G. Electrochemical deammonification of synthetic swine wastewater. Ind. Eng. Chem. Res. 2012, 51, 12167–12172. [Google Scholar] [CrossRef]
- Kuang, W.; Yan, Z.; Chen, J.; Ling, X.; Zheng, W.; Huang, W.; Feng, C. A Bipolar Membrane-Integrated Electrochlorination Process for Highly Efficient Ammonium Removal in Mature Landfill Leachate: The Importance of ClO• Generation. Environ. Sci. Technol. 2022, 53, 18538–18549. [Google Scholar] [CrossRef]
- Stolov, M.; Freger, V. Degradation of polyamide membranes exposed to chlorine: An impedance spectroscopy study. Environ. Sci. Technol. 2019, 53, 2618–2625. [Google Scholar] [CrossRef] [PubMed]
- Abdullah, S.Z.; Bérubé, P.R. Assessing the effects of sodium hypochlorite exposure on the characteristics of PVDF based membranes. Water Res. 2013, 47, 5392–5399. [Google Scholar] [CrossRef]
- Dutton, K.G.; Lipke, M.C. Correcting Frost Diagram Misconceptions Using Interactive Frost Diagrams. J. Chem. Educ. 2021, 98, 2578–2583. [Google Scholar] [CrossRef]
- Liu, X.; Wang, J. Selective oxidation of ammonium to nitrogen gas by advanced oxidation processes: Reactive species and oxidation mechanisms. J. Environ. Chem. Eng. 2023, 11, 110263. [Google Scholar] [CrossRef]
- Wallace, S.W.; McCrum, I.T.; Janik, M.J. Ammonia electro-oxidation mechanism on the platinum (100) surface. Catal. Today 2021, 371, 50–57. [Google Scholar] [CrossRef]
- Ferrari, F.; Pijuan, M.; Molenaar, S.; Duinslaeger, N.; Sleutels, T.; Kuntke, P.; Radjenovic, J. Ammonia recovery from anaerobic digester centrate using onsite pilot scale bipolar membrane electrodialysis coupled to membrane stripping. Water Res. 2022, 218, 118504. [Google Scholar] [CrossRef] [PubMed]
- Tsai, M.H.; Juang, Y.; Hu, C.C.; Hua, L.C.; Huang, C. Tuning Cu2O morphologies of Cu2O/Ni foam electrodes for the control of reactivity and nitrogen selectivity in direct ammonia electrooxidation reaction. J. Environ. Chem. Eng. 2024, 12, 112339. [Google Scholar] [CrossRef]
- Kim, K.W.; Kim, I.T.; Park, G.I.; Lee, E.H. Electrolytic decomposition of ammonia to nitrogen in a multi-cell-stacked electrolyzer with a self-pH-adjustment function. J. Appl. Electrochem. 2006, 36, 1415–1426. [Google Scholar] [CrossRef]
- Zhang, G.; Ruan, J.; Du, T. Recent advances on photocatalytic and electrochemical oxidation for ammonia treatment from water/wastewater. ACS ES&T Eng. 2020, 1, 310–325. [Google Scholar] [CrossRef]
- Zöllig, H.; Morgenroth, E.; Udert, K.M. Inhibition of direct electrolytic ammonia oxidation due to a change in local pH. Electrochim. Acta 2015, 165, 348–355. [Google Scholar] [CrossRef]
- Katsounaros, I.; Chen, T.; Gewirth, A.A.; Markovic, N.M.; Koper, M.T. Evidence for decoupled electron and proton transfer in the electrochemical oxidation of ammonia on Pt (100). J. Phys. Chem. Lett. 2016, 7, 387–392. [Google Scholar] [CrossRef]
- Marinčić, L.; Leitz, F.B. Electro-oxidation of ammonia in wastewater. J. Appl. Electrochem. 1978, 8, 333–345. [Google Scholar] [CrossRef]
- Shinagawa, T.; Takanabe, K. Towards versatile and sustainable hydrogen production through electrocatalytic water splitting: Electrolyte engineering. ChemSusChem 2017, 10, 1318–1336. [Google Scholar] [CrossRef]
- Zhou, L.; Cheng, Y.F. Catalytic electrolysis of ammonia on platinum in alkaline solution for hydrogen generation. Int. J. Hydrogen Energy 2008, 33, 5897–5904. [Google Scholar] [CrossRef]
- Jang, J.H.; Park, S.Y.; Youn, D.H.; Jang, Y.J. Recent advances in electrocatalysts for ammonia oxidation reaction. Catalysts 2023, 13, 803. [Google Scholar] [CrossRef]
- Nakajima, K.; Toda, H.; Sakata, K.; Nishibayashi, Y. Ruthenium-catalysed oxidative conversion of ammonia into dinitrogen. Nat. Chem. 2019, 11, 702–709. [Google Scholar] [CrossRef] [PubMed]
- Díaz, V.; Ibáñez, R.; Gómez, P.; Urtiaga, A.M.; Ortiz, I. Kinetics of electro-oxidation of ammonia-N, nitrites and COD from a recirculating aquaculture saline water system using BDD anodes. Water Res. 2011, 45, 125–134. [Google Scholar] [CrossRef] [PubMed]
- Kim, K.W.; Kim, Y.J.; Kim, I.T.; Park, G.I.; Lee, E.H. Electrochemical conversion characteristics of ammonia to nitrogen. Water Res. 2006, 40, 1431–1441. [Google Scholar] [CrossRef] [PubMed]
- Hou, J.; Cheng, Y.; Pan, H.; Kang, P. CuSn Double-Metal Hydroxides for Direct Electrochemical Ammonia Oxidation to Dinitrogen. ChemElectroChem 2022, 9, e202101301. [Google Scholar] [CrossRef]
- Zöllig, H.; Fritzsche, C.; Morgenroth, E.; Udert, K.M. Direct electrochemical oxidation of ammonia on graphite as a treatment option for stored source-separated urine. Water Res. 2015, 69, 284–294. [Google Scholar] [CrossRef]
- Cho, K.; Hoffmann, M.R. Molecular hydrogen production from wastewater electrolysis cell with multi-junction BiOx/TiO2 anode and stainless steel cathode: Current and energy efficiency. Appl. Catal. B 2017, 202, 671–682. [Google Scholar] [CrossRef]
- Amstutz, V.; Katsaounis, A.; Kapalka, A.; Comninellis, C.; Udert, K.M. Effects of carbonate on the electrolytic removal of ammonia and urea from urine with thermally prepared IrO2 electrodes. J. Appl. Electrochem. 2012, 42, 787–795. [Google Scholar] [CrossRef]
- Han, J.H.; Jwa, E.; Lee, H.; Kim, E.J.; Nam, J.Y.; Hwang, K.S.; Jeong, N.; Choi, J.; Kim, H.; Jeung, Y.-C.; et al. Direct seawater electrolysis via synergistic acidification by inorganic precipitation and proton flux from bipolar membrane. Chem. Eng. J. 2022, 429, 132383. [Google Scholar] [CrossRef]

Disclaimer/Publisher’s Note: The statements, opinions and data contained in all publications are solely those of the individual author(s) and contributor(s) and not of MDPI and/or the editor(s). MDPI and/or the editor(s) disclaim responsibility for any injury to people or property resulting from any ideas, methods, instructions or products referred to in the content. |
© 2024 by the authors. Licensee MDPI, Basel, Switzerland. This article is an open access article distributed under the terms and conditions of the Creative Commons Attribution (CC BY) license (https://creativecommons.org/licenses/by/4.0/).